 ), Hong Jiao2, Kaiwen Man3
 1浙江师范大学教师教育学院心理学系, 金华 321004
2Measurement, Statistics, and Evaluation, Department of Human Development and Quantitative Methodology, University of Maryland, College Park, Maryland, United States
3Educational Studies in Psychology, Research Methodology, and Counseling, The University of Alabama, Tuscaloosa, United States
收稿日期:2020-03-02出版日期:2020-09-25发布日期:2020-07-24通讯作者:詹沛达E-mail:pdzhan@gmail.com基金资助:* 国家自然科学基金青年基金项目(31900795)The multidimensional log-normal response time model: An exploration of the multidimensionality of latent processing speed
ZHAN Peida1(), Hong JIAO2, Kaiwen MAN3 1Department of Psychology, College of Teacher Education, Zhejiang Normal University, Jinhua, 321004, China
2Measurement, Statistics, and Evaluation, Department of Human Development and Quantitative Methodology, University of Maryland, College Park, Maryland, United States
3Educational Studies in Psychology, Research Methodology, and Counseling, The University of Alabama, Tuscaloosa, United States
Received:2020-03-02Online:2020-09-25Published:2020-07-24Contact:ZHAN Peida E-mail:pdzhan@gmail.com摘要/Abstract
摘要: 在心理与教育测量中, 潜在加工速度反映学生运用潜在能力解决问题的效率。为在多维测验中探究潜在加工速度的多维性并实现参数估计, 本研究提出多维对数正态作答时间模型。实证数据分析及模拟研究结果表明:(1)潜在加工速度具有与潜在能力相匹配的多维结构; (2)新模型可精确估计个体水平的多维潜在加工速度及与作答时间有关的题目参数; (3)冗余指定潜在加工速度具有多维性带来的负面影响低于忽略其多维性所带来的。
图/表 13
表12012年PISA计算机化数学测验的Q矩阵
| 题目 | θ1 | θ2 | θ3 |
|---|---|---|---|
| CM015Q02D | 1 | ||
| CM015Q03D | 1 | ||
| CM020Q01 | 1 | ||
| CM020Q02 | 1 | ||
| CM020Q03 | 1 | ||
| CM020Q04 | 1 | ||
| CM038Q03T | 1 | ||
| CM038Q05 | 1 | ||
| CM038Q06 | 1 |
表12012年PISA计算机化数学测验的Q矩阵
| 题目 | θ1 | θ2 | θ3 |
|---|---|---|---|
| CM015Q02D | 1 | ||
| CM015Q03D | 1 | ||
| CM020Q01 | 1 | ||
| CM020Q02 | 1 | ||
| CM020Q03 | 1 | ||
| CM020Q04 | 1 | ||
| CM038Q03T | 1 | ||
| CM038Q05 | 1 | ||
| CM038Q06 | 1 |
表22012年PISA计算机化数学测验数据的探索性因素分析中的数据-模型拟合指标
| Model | χ2 | df | TLI | CFI | AIC | BIC | SRMR | RMSEA [90% CI] |
|---|---|---|---|---|---|---|---|---|
| 1-factor | 462.79** | 27 | 0.896 | 0.922 | 24592.15 | 24737.03 | 0.045 | 0.101 [0.093, 0.109] |
| 2-factor | 225.49** | 19 | 0.930 | 0.963 | 24370.85 | 24558.65 | 0.032 | 0.083 [0.073, 0.093] |
| 3-factor | 32.66** | 12 | 0.989 | 0.996 | 24192.02 | 24417.38 | 0.010 | 0.033 [0.020, 0.047] |
| 4-factor | 5.56 | 6 | 1.000 | 1.000 | 24176.92 | 24434.48 | 0.004 | 0.000 [0.000, 0.031] |
| 5-factor | 0.09 | 1 | 1.006 | 1.000 | 24181.44 | 24465.83 | 0.000 | 0.000 [0.000, 0.045] |
表3三因素模型的旋转因素载荷矩阵
| 题目 | 因素1 | 因素2 | 因素3 |
|---|---|---|---|
| CM015Q02D | 0.695* | ||
| CM015Q03D | 0.609* | ||
| CM020Q01 | 0.565* | ||
| CM020Q02 | 0.801* | ||
| CM020Q03 | 0.642* | ||
| CM020Q04 | 0.943* | ||
| CM038Q03T | 0.502* | ||
| CM038Q05 | 0.985* | ||
| CM038Q06 | 0.621* |
表3三因素模型的旋转因素载荷矩阵
| 题目 | 因素1 | 因素2 | 因素3 |
|---|---|---|---|
| CM015Q02D | 0.695* | ||
| CM015Q03D | 0.609* | ||
| CM020Q01 | 0.565* | ||
| CM020Q02 | 0.801* | ||
| CM020Q03 | 0.642* | ||
| CM020Q04 | 0.943* | ||
| CM038Q03T | 0.502* | ||
| CM038Q05 | 0.985* | ||
| CM038Q06 | 0.621* |
表42012年PISA计算机化数学测验数据分析中模型-数据拟合指标
| 分析模型 | -2LL | DIC | WAIC | ppp |
|---|---|---|---|---|
| MLRTM | 19305 | 22505 | 22055 | 0.633 |
| ULRTM | 21310 | 22890 | 22770 | 0.597 |
表42012年PISA计算机化数学测验数据分析中模型-数据拟合指标
| 分析模型 | -2LL | DIC | WAIC | ppp |
|---|---|---|---|---|
| MLRTM | 19305 | 22505 | 22055 | 0.633 |
| ULRTM | 21310 | 22890 | 22770 | 0.597 |
表52012年PISA计算机化数学测验数据分析中多维潜在加工速度的方差-协方差矩阵估计值
| Στ | τ1 | τ2 | τ3 |
|---|---|---|---|
| τ1 | 0.301 (0.016) [0.270, 0.334] | 0.751 | 0.767 |
| τ2 | 0.185 (0.010) [0.167, 0.204] | 0.202 (0.010) [0.184, 0.220] | 0.855 |
| τ3 | 0.227 (0.012) [0.206, 0.250] | 0.208 (0.009) [0.190, 0.226] | 0.292 (0.013) [0.266, 0.317] |
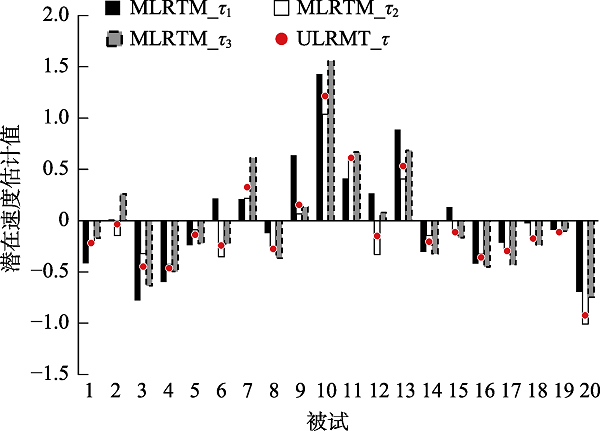
图12012年PISA计算机化数学测验数据分析中前20名被试潜在加工速度估计值 注:ULRTM = 单维对数正态作答时间模型; MLRTM = 多维对数正态作答时间模型; τ = 潜在加工速度
图12012年PISA计算机化数学测验数据分析中前20名被试潜在加工速度估计值 注:ULRTM = 单维对数正态作答时间模型; MLRTM = 多维对数正态作答时间模型; τ = 潜在加工速度表62012年PISA计算机化数学测验数据分析中题目参数估计值
| 题目 | ULRTM | MLRTM | ||||||||||
|---|---|---|---|---|---|---|---|---|---|---|---|---|
| ξ | ω | ξ | ω | |||||||||
| M | SE | 95% CI | M | SE | 95% CI | M | SE | 95% CI | M | SE | 95% CI | |
| 1 | 4.470 | 0.020 | [4.432, 4.508] | 1.617 | 0.031 | [1.558, 1.678] | 4.469 | 0.020 | [4.433, 4.510] | 1.845 | 0.045 | [1.760, 1.936] |
| 2 | 4.630 | 0.019 | [4.592, 4.667] | 1.697 | 0.032 | [1.635, 1.762] | 4.629 | 0.019 | [4.594, 4.668] | 1.976 | 0.051 | [1.874, 2.076] |
| 3 | 4.778 | 0.016 | [4.750, 4.811] | 2.423 | 0.050 | [2.327, 2.519] | 4.778 | 0.015 | [4.747, 4.807] | 2.505 | 0.055 | [2.397, 2.612] |
| 4 | 3.860 | 0.018 | [3.825, 3.895] | 1.866 | 0.036 | [1.793, 1.934] | 3.859 | 0.017 | [3.825, 3.894] | 1.915 | 0.038 | [1.841, 1.991] |
| 5 | 4.258 | 0.016 | [4.226, 4.291] | 2.186 | 0.044 | [2.104, 2.274] | 4.258 | 0.016 | [4.224, 4.287] | 2.202 | 0.047 | [2.112, 2.295] |
| 6 | 3.739 | 0.017 | [3.707, 3.774] | 2.031 | 0.040 | [1.958, 2.116] | 3.739 | 0.017 | [3.706, 3.771] | 2.097 | 0.043 | [2.012, 2.179] |
| 7 | 4.190 | 0.016 | [4.158, 4.220] | 2.314 | 0.047 | [2.221, 2.406] | 4.189 | 0.017 | [4.156, 4.222] | 2.516 | 0.063 | [2.393, 2.638] |
| 8 | 4.522 | 0.018 | [4.487, 4.557] | 1.879 | 0.036 | [1.809, 1.950] | 4.522 | 0.018 | [4.488, 4.558] | 2.091 | 0.047 | [1.995, 2.180] |
| 9 | 4.377 | 0.020 | [4.338, 4.417] | 1.600 | 0.031 | [1.533, 1.656] | 4.379 | 0.021 | [4.339, 4.420] | 1.701 | 0.036 | [1.632, 1.771] |
| μξ | 4.316 | 0.202 | [3.901, 4.701] | 4.315 | 0.199 | [3.914, 4.708] | ||||||
| σξ2 | 0.367 | 0.217 | [0.103, 0.751] | 0.366 | 0.219 | [0.113, 0.763] | ||||||
表62012年PISA计算机化数学测验数据分析中题目参数估计值
| 题目 | ULRTM | MLRTM | ||||||||||
|---|---|---|---|---|---|---|---|---|---|---|---|---|
| ξ | ω | ξ | ω | |||||||||
| M | SE | 95% CI | M | SE | 95% CI | M | SE | 95% CI | M | SE | 95% CI | |
| 1 | 4.470 | 0.020 | [4.432, 4.508] | 1.617 | 0.031 | [1.558, 1.678] | 4.469 | 0.020 | [4.433, 4.510] | 1.845 | 0.045 | [1.760, 1.936] |
| 2 | 4.630 | 0.019 | [4.592, 4.667] | 1.697 | 0.032 | [1.635, 1.762] | 4.629 | 0.019 | [4.594, 4.668] | 1.976 | 0.051 | [1.874, 2.076] |
| 3 | 4.778 | 0.016 | [4.750, 4.811] | 2.423 | 0.050 | [2.327, 2.519] | 4.778 | 0.015 | [4.747, 4.807] | 2.505 | 0.055 | [2.397, 2.612] |
| 4 | 3.860 | 0.018 | [3.825, 3.895] | 1.866 | 0.036 | [1.793, 1.934] | 3.859 | 0.017 | [3.825, 3.894] | 1.915 | 0.038 | [1.841, 1.991] |
| 5 | 4.258 | 0.016 | [4.226, 4.291] | 2.186 | 0.044 | [2.104, 2.274] | 4.258 | 0.016 | [4.224, 4.287] | 2.202 | 0.047 | [2.112, 2.295] |
| 6 | 3.739 | 0.017 | [3.707, 3.774] | 2.031 | 0.040 | [1.958, 2.116] | 3.739 | 0.017 | [3.706, 3.771] | 2.097 | 0.043 | [2.012, 2.179] |
| 7 | 4.190 | 0.016 | [4.158, 4.220] | 2.314 | 0.047 | [2.221, 2.406] | 4.189 | 0.017 | [4.156, 4.222] | 2.516 | 0.063 | [2.393, 2.638] |
| 8 | 4.522 | 0.018 | [4.487, 4.557] | 1.879 | 0.036 | [1.809, 1.950] | 4.522 | 0.018 | [4.488, 4.558] | 2.091 | 0.047 | [1.995, 2.180] |
| 9 | 4.377 | 0.020 | [4.338, 4.417] | 1.600 | 0.031 | [1.533, 1.656] | 4.379 | 0.021 | [4.339, 4.420] | 1.701 | 0.036 | [1.632, 1.771] |
| μξ | 4.316 | 0.202 | [3.901, 4.701] | 4.315 | 0.199 | [3.914, 4.708] | ||||||
| σξ2 | 0.367 | 0.217 | [0.103, 0.751] | 0.366 | 0.219 | [0.113, 0.763] | ||||||
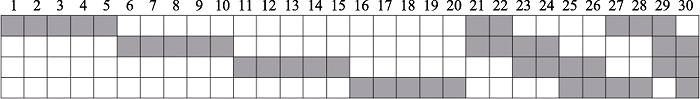
图2模拟研究1中K × I的Q′矩阵 注: 灰色为1、白色为0分别使用MLRTM和ULRTM去拟合生成数据。对于每组数据, 马尔可夫链数、迭代数和预热数等均与实证研究中保持一致。采用bias和RMSE来评估参数估计返真性; 另外, 也计算了各参数估计值与其真值之间的相关系数(Cor)。
图2模拟研究1中K × I的Q′矩阵 注: 灰色为1、白色为0分别使用MLRTM和ULRTM去拟合生成数据。对于每组数据, 马尔可夫链数、迭代数和预热数等均与实证研究中保持一致。采用bias和RMSE来评估参数估计返真性; 另外, 也计算了各参数估计值与其真值之间的相关系数(Cor)。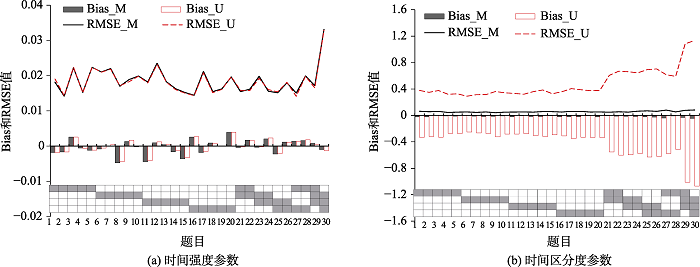
图3模拟研究1中题目参数返真性(题目水平) 注:U = 单维对数正态作答时间模型; M = 多维对数正态作答时间模型; RMSE = 均方根误差.
图3模拟研究1中题目参数返真性(题目水平) 注:U = 单维对数正态作答时间模型; M = 多维对数正态作答时间模型; RMSE = 均方根误差.表7模拟研究1中被试参数返真性的总结
| Parameter | MA_bias | M_RMSE | Cor |
|---|---|---|---|
| τ1 | 0.016 | 0.147 | 0.956 |
| τ2 | 0.017 | 0.147 | 0.955 |
| τ3 | 0.016 | 0.144 | 0.957 |
| τ4 | 0.017 | 0.143 | 0.958 |
表7模拟研究1中被试参数返真性的总结
| Parameter | MA_bias | M_RMSE | Cor |
|---|---|---|---|
| τ1 | 0.016 | 0.147 | 0.956 |
| τ2 | 0.017 | 0.147 | 0.955 |
| τ3 | 0.016 | 0.144 | 0.957 |
| τ4 | 0.017 | 0.143 | 0.958 |
表8模拟研究1中被试参数的方差协方差矩阵返真性
| Στ | τ1 | τ2 | τ3 | τ4 |
|---|---|---|---|---|
| τ1 | 0.00003 (0.00000) | |||
| τ2 | 0.00023 (0.00003) | 0.00069 (-0.00010) | ||
| τ3 | 0.00031 (0.00004) | 0.00015 (0.00002) | 0.00015 (0.00002) | |
| τ4 | 0.00015 (0.00002) | 0.00041 (-0.00006) | 0.00020 (0.00003) | 0.00079 (-0.00011) |
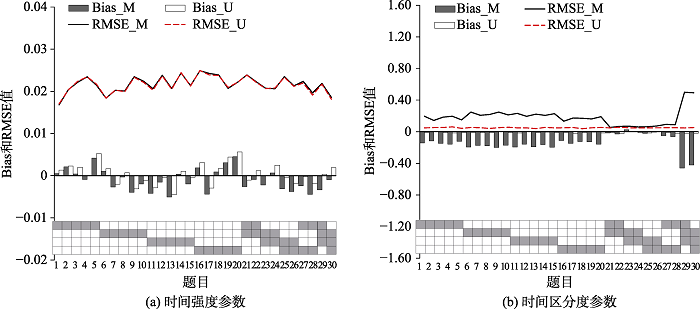
图4模拟研究2中题目参数返真性(题目水平) 注:U = 单维对数正态作答时间模型; M = 多维对数正态作答时间模型; RMSE = 均方根误差.
图4模拟研究2中题目参数返真性(题目水平) 注:U = 单维对数正态作答时间模型; M = 多维对数正态作答时间模型; RMSE = 均方根误差.表9模拟研究2中被试参数返真性
| 分析模型 | 参数 | MA_bias | M_RMSE | Cor |
|---|---|---|---|---|
| ULRTM | τ | 0.013 | 0.088 | 0.985 |
| MLRTM | τ1 | 0.023 | 0.197 | 0.974 |
| τ2 | 0.026 | 0.226 | 0.973 | |
| τ3 | 0.027 | 0.235 | 0.971 | |
| τ4 | 0.023 | 0.199 | 0.974 |
表9模拟研究2中被试参数返真性
| 分析模型 | 参数 | MA_bias | M_RMSE | Cor |
|---|---|---|---|---|
| ULRTM | τ | 0.013 | 0.088 | 0.985 |
| MLRTM | τ1 | 0.023 | 0.197 | 0.974 |
| τ2 | 0.026 | 0.226 | 0.973 | |
| τ3 | 0.027 | 0.235 | 0.971 | |
| τ4 | 0.023 | 0.199 | 0.974 |
参考文献 36
| [1] | Adams, R. J., Wilson, M., & Wang, W. (1997). The multidimensional random coefficients multinomial logit model. Applied Psychological Measurement, 21(1), 1-23. doi: 10.1177/0146621697211001URL |
| [2] | Bolsinova, M., & Tijmstra, J. (2018). Improving precision of ability estimation: Getting more from response times. British Journal of Mathematical and Statistical Psychology, 71(1), 13-38. doi: 10.1111/bmsp.12104URLpmid: 28635139 |
| [3] | Curran, P. J., & Bauer, D J. (2011). The disaggregation of within-person and between-person effects in longitudinal models of change. Annual Review of Psychology, 62, 583-619. doi: 10.1146/annurev.psych.093008.100356URL |
| [4] | de Boeck, P., & Jeon, M. (2019). An overview of models for response times and processes in cognitive tests. Frontiers in Psychology, 10, 102. doi: 10.3389/fpsyg.2019.00102URLpmid: 30787891 |
| [5] | Ferrando, P. J., & Lorenzo-Seva, U. (2007). A measurement model for Likert responses that incorporates response time. Multivariate Behavioral Research, 42(4), 675-706. doi: 10.1080/00273170701710247URL |
| [6] | Fox, J.-P. & Marianti, S. (2017). Person-fit statistics for joint models for accuracy and speed. Journal of Educational Measurement, 54(2), 243-262. doi: 10.1111/jedm.12143URL |
| [7] | Gelman, A., Carlin, J. B., Stern, H. S., Dunson, D. B., Vehtari, A., & Rubin, D. B. (2013). Bayesian data analysis. New York: Chapman & Hall. |
| [8] | Goudie, R. J., Turner, R. M., de Angelis, D., & Thomas, A. (2017). MultiBUGS: A parallel implementation of the BUGS modelling framework for faster Bayesian inference. arXiv Preprint arXiv:1704.03216. |
| [9] | Guo, L. Shang, P., & Xia, L. (2017). Advantages and illustrations of application of response time model in psychological and educational testing. Advances in Psychological Science, 25(4), 701-712. doi: 10.3724/SP.J.1042.2017.00701URL |
| [ 郭磊, 尚鹏丽, 夏凌翔. (2017). 心理与教育测验中反应时模型应用的优势与举例. 心理科学进展, 25(4), 701-712.] | |
| [10] | Guo, X., Luo, Z., & Yu, X. (2020). A speed-accuracy tradeoff hierarchical model based on cognitive experiment. Frontiers in Psychology, 10, 2910. doi: 10.3389/fpsyg.2019.02910URLpmid: 31969855 |
| [11] | Horwitz, B., Tagamets, M. A., & McIntosh, A. R. (1999). Neural modeling, functional brain imaging, and cognition. Trends in Cognitive Sciences, 3(3), 91-98. doi: 10.1016/s1364-6613(99)01282-6URLpmid: 10322460 |
| [12] | Hu, L. T., & Bentler, P. M. (1999). Cutoff criteria for fit indexes in covariance structure analysis: Conventional criteria versus new alternatives. Structural Equation Modeling: A Multidisciplinary Journal, 6(1), 1-55. doi: 10.1080/10705519909540118URL |
| [13] | Klein Entink, R. H., van der Linden, W. J., & Fox, J.-P. (2009). A Box-Cox normal model for response times. British Journal of Mathematical and Statistical Psychology, 62(3), 621-640. doi: 10.1348/000711008X374126URL |
| [14] | Lu, J., Wang, C., Zhang, J., & Tao, J. (2019). A mixture model for responses and response times with a higher-order ability structure to detect rapid guessing behaviour. British Journal of Mathematical and Statistical Psychology. Online First, https://doi.org/10.1111/bmsp.12175 doi: 10.1111/bmsp.12192URLpmid: 31705539 |
| [15] | Man, K., Harring, J. R., Jiao, H., & Zhan, P. (2019). Joint modeling of compensatory multidimensional item responses and response times. Applied Psychological Measurement, 43(8), 639-654. doi: 10.1177/0146621618824853URLpmid: 31551641 |
| [16] | Meng, X.-B. (2016). A log-skew-normal model for item response times. Journal of Psychological Science, 39, 727-734. |
| [ 孟祥斌. (2016). 项目反应时间的对数偏正态模型. 心理科学, 39(3), 727-734.] | |
| [17] | Mesulam, M. M. (1990). Large‐scale neurocognitive networks and distributed processing for attention, language, and memory. Annals of Neurology, 28(5), 597-613. doi: 10.1002/ana.410280502URLpmid: 2260847 |
| [18] | Muthén, L. K., & Muthén, B. (2019). Mplus: The comprehensive modeling program for applied researchers: User’s guide, 5. |
| [19] | Ntzoufras, I. (2009). Bayesian modeling using WinBUGS. Manhattan: John Wiley & Sons. |
| [20] | OECD, (2013). PISA 2012 assessment and analytical framework: Mathematics, reading, science, problem solving and financial literacy, OECD Publishing. http://dx.doi.org/ 10.1787/9789264190511-en |
| [21] | Reckase, M. D. (2009). Multidimensional item response theory. New York: Springer. |
| [22] | Steiger, J. H. (1990). Structural model evaluation and modification: An interval estimation approach. Multivariate Behavioral Research, 25(2), 173-180. doi: 10.1207/s15327906mbr2502_4URLpmid: 26794479 |
| [23] | Tatsuoka, K. K. (1983). Rule Space: An approach for dealing with misconceptions based on item response theory. Journal of Educational Measurement, 20(4), 345-354. doi: 10.1111/jedm.1983.20.issue-4URL |
| [24] | van der Linden, W. J. (2006). A lognormal model for response times on test items. Journal of Educational and Behavioral Statistics, 31(2), 181-204. http://dx.doi.org/10.3102/ 10769986031002181 doi: 10.3102/10769986031002181URL |
| [25] | van der Linden, W. J. (2007). A hierarchical framework for modeling speed and accuracy on test items. Psychometrika, 72, 287-308. http://dx.doi.org/10.1007/s11336-006-1478-z doi: 10.1007/s11336-006-1478-zURL |
| [26] | van der Linden, W. J. (2009). Conceptual issues in response- time modeling. Journal of Educational Measurement, 46(3), 247-272. http://dx.doi.org/10.1111/j.1745-3984.2009.00080.x doi: 10.1111/jedm.2009.46.issue-3URL |
| [27] | van der Linden, W. J. (2011). Test design and speededness. Journal of Educational Measurement, 48(1), 44-60. doi: 10.1111/jedm.2011.48.issue-1URL |
| [28] | van der Linden, W. J., Klein Entink, R., & Fox, J.-P. (2010). IRT parameter estimation with response times as collateral information. Applied Psychological Measurement, 34(5), 327-347. doi: 10.1177/0146621609349800URL |
| [29] | Wang, C., Chang, H. H., & Douglas, J. A. (2013). The linear transformation model with frailties for the analysis of item response times. British Journal of Mathematical and Statistical Psychology, 66(1), 144-168. doi: 10.1111/j.2044-8317.2012.02045.xURLpmid: 22506914 |
| [30] | Wang, C., Weiss, D. J., & Su, S. (2019). Modeling response time and responses in multidimensional health measurement. Frontiers in Psychology, 10, 51. doi: 10.3389/fpsyg.2019.00051URLpmid: 30761036 |
| [31] | Wang, C., & Xu, G. (2015). A mixture hierarchical model for response times and response accuracy. British Journal of Mathematical and Statistical Psychology, 68(3), 456-477. doi: 10.1111/bmsp.12054URLpmid: 25873487 |
| [32] | Wang, S., Zhang, S., Douglas, J., & Culpepper, S. (2018). Using response times to assess learning progress: A joint model for responses and response times. Measurement: Interdisciplinary Research and Perspectives, 16(1), 45-58. doi: 10.1080/15366367.2018.1435105URL |
| [33] | Wang, T., & Hanson, B. A. (2005). Development and calibration of an item response model that incorporates response time. Applied Psychological Measurement, 29(5), 323-339. doi: 10.1177/0146621605275984URL |
| [34] | Zhan, P. (2019). Joint modeling for response times and response accuracy in computer-based multidimensional assessments. Journal of Psychological Science, 42, 170-178. |
| [ 詹沛达. (2019). 计算机化多维测验中作答时间和作答精度数据的联合分析. 心理科学, 42, 170-178.] | |
| [35] | Zhan, P., Jiao, H., & Liao, D. (2018). Cognitive diagnosis modelling incorporating item response times. British Journal of Mathematical and Statistical Psychology, 71(2), 262-286. doi: 10.1111/bmsp.12114URLpmid: 28872185 |
| [36] | Zhan, P., Jiao, H., Wang, W.-C., and Man, K. (2018). A multidimensional hierarchical framework for modeling speed and ability in computer-based multidimensional tests. arXiv:1807.04003. Available online at: https://arxiv.org/abs/ 1807.04003 |
相关文章 2
| [1] | 詹沛达, 于照辉, 李菲茗, 王立君. 一种基于多阶认知诊断模型测评科学素养的方法[J]. 心理学报, 2019, 51(6): 734-746. |
| [2] | Klaus D. Kubinger. 当代客观化人格测验的技术—— 基于实验的行为评估:维也纳研究小组开发的多种计算机化测验介绍[J]. 心理学报, 2009, 41(10): 1024-1036. |
PDF全文下载地址:
http://journal.psych.ac.cn/xlxb/CN/article/downloadArticleFile.do?attachType=PDF&id=4797
