 )
) 1 北京教育科学研究院北京教育督导与教育评价研究中心, 北京 100036
2 北京师范大学中国基础教育质量监测协同创新中心
3 北京师范大学心理学部
4 北京师范大学心理学部应用实验心理北京市重点实验室, 北京 100875
出版日期:2020-04-25发布日期:2020-02-25通讯作者:刘红云E-mail:hyliu@bnu.edu.cnAnalysis of the Problem-solving strategies in computer-based dynamic assessment: The extension and application of multilevel mixture IRT model
LI Meijuan1,2, LIU Yue3, LIU Hongyun3,4() 1 Educational Supervision and Quality Assessment Research Center, Beijing Academy of Educational Sciences, Beijing 100036, China
2 Collaborative Innovation Center of Assessment toward Basic Education Quality, Beijing Normal University, Beijing 100875, China
3 Faculty of Psychology, Beijing Normal University, Beijing 100875, China
4 Beijing Key Laboratory of Applied Experimental Psychology, Faculty of Psychology, Beijing Normal University, Beijing 100875, China
Online:2020-04-25Published:2020-02-25Contact:LIU Hongyun E-mail:hyliu@bnu.edu.cn摘要/Abstract
摘要: 学生在完成计算机动态测验过程中, 会产生大量带有时间标记的过程性数据。本研究基于5个国家(地区) 3196名学生在PISA2012一道交通问题解决任务上的139990条数据, 将多水平混合IRT (MMixIRT)模型进行拓展, 用于探索问题解决过程策略的类别特点。结果表明, 该模型不仅可以基于行为序列对不同国家(地区)学生在解决问题时策略使用情况的典型特征进行分析, 还可以提供个体水平的能力估计值。拓展的MMixIRT模型可用于分析过程性数据的特征。
图/表 13
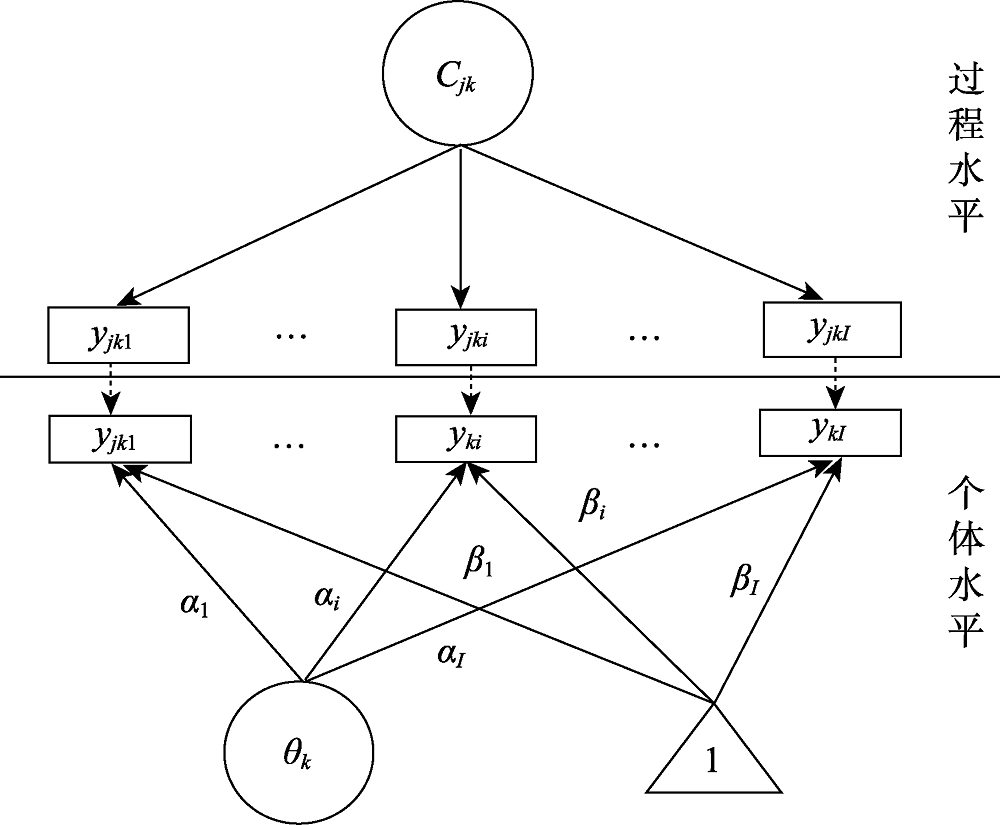
图1本研究使用的MMixIRT模型示意图
图1本研究使用的MMixIRT模型示意图表1整理后的过程性数据举例
| 序号 | 学生编号 | 路径选择 | P1 | P2 | … | P13 | … | P18 | … | P23 |
|---|---|---|---|---|---|---|---|---|---|---|
| 1 | 00017 | 01000000000000000000000 | 0 | 1 | … | 0 | … | 0 | … | 0 |
| 2 | 00017 | 11000000000000000000000 | 1 | 1 | … | 0 | … | 0 | … | 0 |
| 3 | 00017 | 11000000000010000000000 | 1 | 1 | … | 1 | … | 0 | … | 0 |
| 4 | 00017 | 11000000000010000100000 | 1 | 1 | … | 1 | … | 1 | … | 0 |
| 5 | 00017 | 11000000010010000100000 | 1 | 1 | … | 1 | … | 1 | … | 0 |
| 6 | 00017 | 11000000010010000101000 | 1 | 1 | … | 1 | … | 1 | … | 0 |
| 7 | 00017 | 11000000010000000101000 | 1 | 1 | … | 0 | … | 1 | … | 0 |
| 8 | 00017 | 01000000010000000101000 | 0 | 1 | … | 0 | … | 1 | … | 0 |
表1整理后的过程性数据举例
| 序号 | 学生编号 | 路径选择 | P1 | P2 | … | P13 | … | P18 | … | P23 |
|---|---|---|---|---|---|---|---|---|---|---|
| 1 | 00017 | 01000000000000000000000 | 0 | 1 | … | 0 | … | 0 | … | 0 |
| 2 | 00017 | 11000000000000000000000 | 1 | 1 | … | 0 | … | 0 | … | 0 |
| 3 | 00017 | 11000000000010000000000 | 1 | 1 | … | 1 | … | 0 | … | 0 |
| 4 | 00017 | 11000000000010000100000 | 1 | 1 | … | 1 | … | 1 | … | 0 |
| 5 | 00017 | 11000000010010000100000 | 1 | 1 | … | 1 | … | 1 | … | 0 |
| 6 | 00017 | 11000000010010000101000 | 1 | 1 | … | 1 | … | 1 | … | 0 |
| 7 | 00017 | 11000000010000000101000 | 1 | 1 | … | 0 | … | 1 | … | 0 |
| 8 | 00017 | 01000000010000000101000 | 0 | 1 | … | 0 | … | 1 | … | 0 |
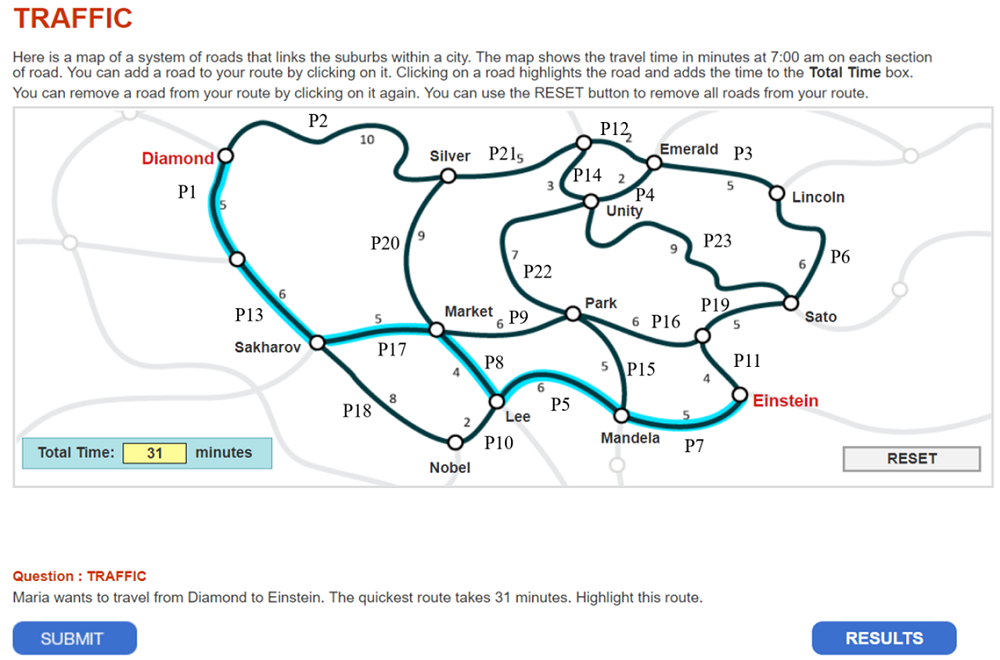
图2PISA2012交通问题题目及其正确路径 注:地图上两个节点之间的路线为一条路径, 标蓝的路径为正确路径。
图2PISA2012交通问题题目及其正确路径 注:地图上两个节点之间的路线为一条路径, 标蓝的路径为正确路径。表2编码后的过程性数据举例
| 序号 | 学生编号 | 路径选择 | CP1 | CP2 | … | CP13 | … | CP18 | … | CP23 |
|---|---|---|---|---|---|---|---|---|---|---|
| 1 | 00017 | 01000000000000000000000 | 0 | 0 | … | 0 | … | 1 | … | 1 |
| 2 | 00017 | 11000000000000000000000 | 1 | 0 | … | 0 | … | 1 | … | 1 |
| 3 | 00017 | 11000000000010000000000 | 1 | 0 | … | 1 | … | 1 | … | 1 |
| 4 | 00017 | 11000000000010000100000 | 1 | 0 | … | 1 | … | 0 | … | 1 |
| 5 | 00017 | 11000000010010000100000 | 1 | 0 | … | 1 | … | 0 | … | 1 |
| 6 | 00017 | 11000000010010000101000 | 1 | 0 | … | 1 | … | 0 | … | 1 |
| 7 | 00017 | 11000000010000000101000 | 1 | 0 | … | 0 | … | 0 | … | 1 |
| 8 | 00017 | 01000000010000000101000 | 0 | 0 | … | 0 | … | 0 | … | 1 |
表2编码后的过程性数据举例
| 序号 | 学生编号 | 路径选择 | CP1 | CP2 | … | CP13 | … | CP18 | … | CP23 |
|---|---|---|---|---|---|---|---|---|---|---|
| 1 | 00017 | 01000000000000000000000 | 0 | 0 | … | 0 | … | 1 | … | 1 |
| 2 | 00017 | 11000000000000000000000 | 1 | 0 | … | 0 | … | 1 | … | 1 |
| 3 | 00017 | 11000000000010000000000 | 1 | 0 | … | 1 | … | 1 | … | 1 |
| 4 | 00017 | 11000000000010000100000 | 1 | 0 | … | 1 | … | 0 | … | 1 |
| 5 | 00017 | 11000000010010000100000 | 1 | 0 | … | 1 | … | 0 | … | 1 |
| 6 | 00017 | 11000000010010000101000 | 1 | 0 | … | 1 | … | 0 | … | 1 |
| 7 | 00017 | 11000000010000000101000 | 1 | 0 | … | 0 | … | 0 | … | 1 |
| 8 | 00017 | 01000000010000000101000 | 0 | 0 | … | 0 | … | 0 | … | 1 |
表3模型拟合指标结果
| 潜类别数 | 自由估计参数数量 | Loglikelihood | AIC | BIC | aBIC | 熵 | |||
|---|---|---|---|---|---|---|---|---|---|
| 1 | 69 | -1249381.591 | 2498901.183 | 2499580.786 | 2499361.502 | — | |||
| 2 | 93 | -1042231.477 | 2084648.954 | 2085564.941 | 2085269.384 | 0.927 | |||
| 3 | 117 | -983675.008 | 1967584.017 | 1968736.388 | 1968364.557 | 0.935 | |||
| 4 | 141 | -932442.034 | 1865166.068 | 1866554.823 | 1866106.720 | 0.930 | |||
| 5 | 165 | -902308.165 | 1804946.330 | 1806571.468 | 1806047.092 | 0.935 | |||
| 6 | 189 | -873709.569 | 1747797.138 | 1749658.661 | 1749058.012 | 0.943 | |||
| 7 | 340 | -856672.635 | 1713771.269 | 1715869.176 | 1715192.253 | 0.943 | |||
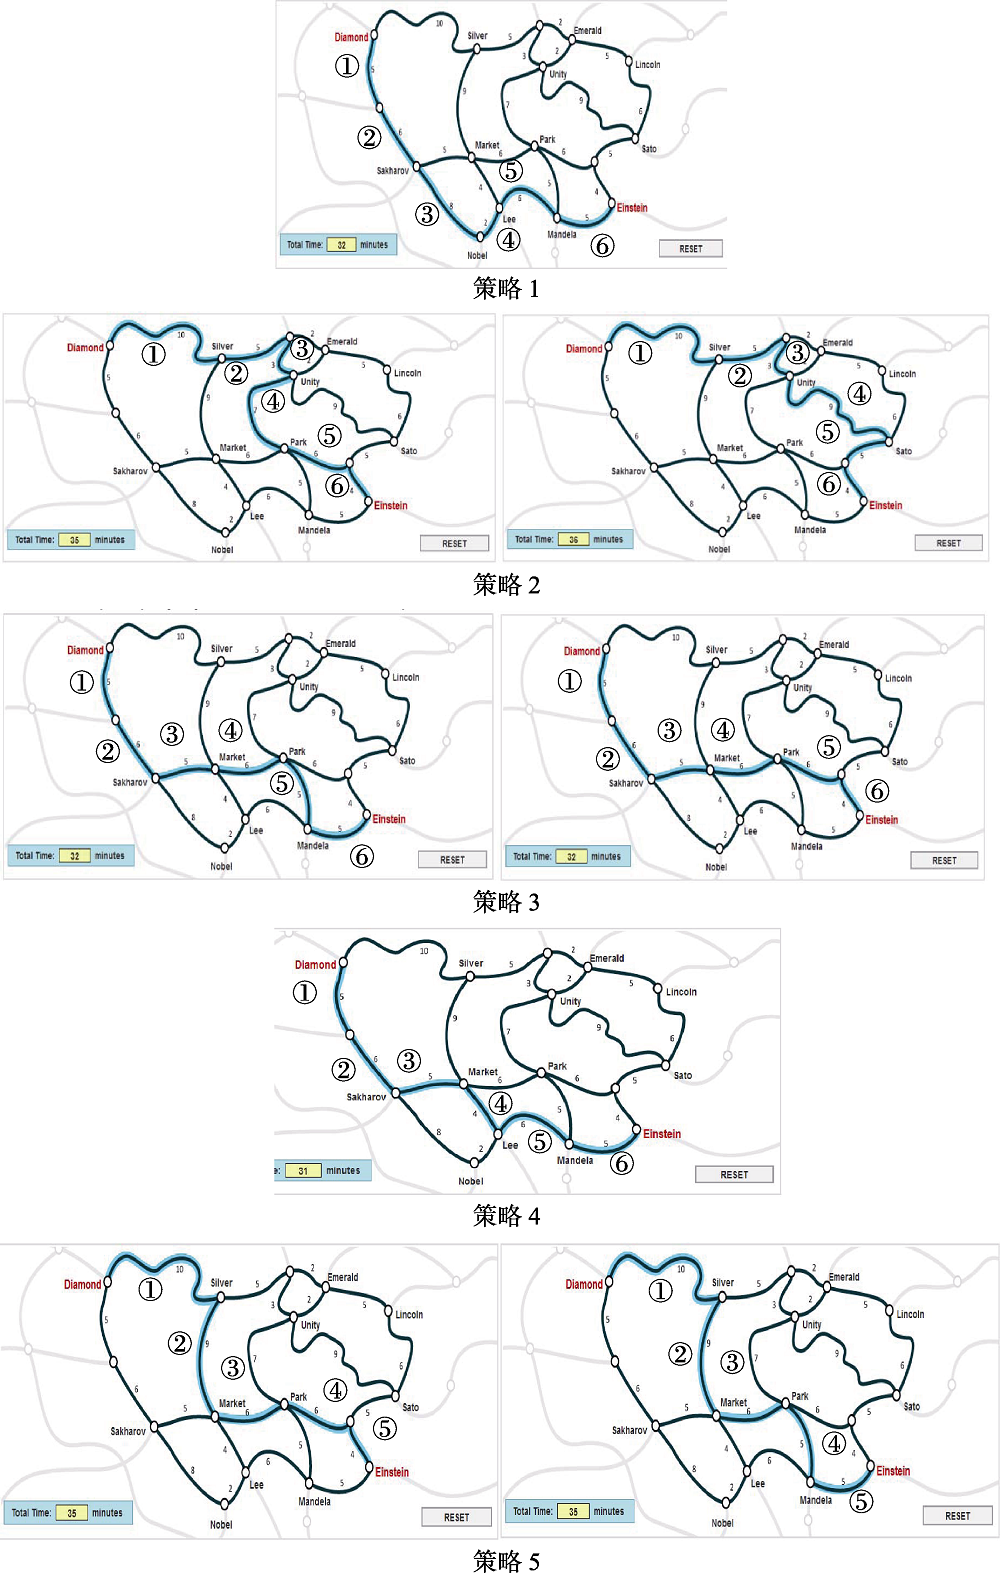
图3各策略选择路径情况
图3各策略选择路径情况表4各地区学生解题最后一步所用策略分布比例(%)
| 策略 | 加拿大 | 中国香港 | 中国上海 | 新加坡 | 美国 | |||||
|---|---|---|---|---|---|---|---|---|---|---|
| 总体 | 错误组 | 总体 | 错误组 | 总体 | 错误组 | 总体 | 错误组 | 总体 | 错误组 | |
| 策略1 | 5.9 | 25.6 | 6.9 | 32.3 | 4.9 | 21.5 | 3.5 | 19.0 | 7.9 | 32.3 |
| 策略2 | 3.0 | 12.8 | 3.2 | 15.1 | 2.2 | 9.7 | 2.2 | 11.9 | 3.7 | 15.2 |
| 策略3 | 7.6 | 32.8 | 6.9 | 32.3 | 8.3 | 36.6 | 6.1 | 33.3 | 6.2 | 25.3 |
| 策略4 | 77.1 | 0.9 | 78.5 | 0.0 | 77.6 | 1.1 | 81.6 | 0.0 | 75.6 | 0.0 |
| 策略5 | 6.4 | 27.9 | 4.4 | 20.4 | 7.1 | 31.2 | 6.6 | 35.7 | 6.7 | 27.3 |
表4各地区学生解题最后一步所用策略分布比例(%)
| 策略 | 加拿大 | 中国香港 | 中国上海 | 新加坡 | 美国 | |||||
|---|---|---|---|---|---|---|---|---|---|---|
| 总体 | 错误组 | 总体 | 错误组 | 总体 | 错误组 | 总体 | 错误组 | 总体 | 错误组 | |
| 策略1 | 5.9 | 25.6 | 6.9 | 32.3 | 4.9 | 21.5 | 3.5 | 19.0 | 7.9 | 32.3 |
| 策略2 | 3.0 | 12.8 | 3.2 | 15.1 | 2.2 | 9.7 | 2.2 | 11.9 | 3.7 | 15.2 |
| 策略3 | 7.6 | 32.8 | 6.9 | 32.3 | 8.3 | 36.6 | 6.1 | 33.3 | 6.2 | 25.3 |
| 策略4 | 77.1 | 0.9 | 78.5 | 0.0 | 77.6 | 1.1 | 81.6 | 0.0 | 75.6 | 0.0 |
| 策略5 | 6.4 | 27.9 | 4.4 | 20.4 | 7.1 | 31.2 | 6.6 | 35.7 | 6.7 | 27.3 |
表5各地区问题解决过程应用策略数分布比例(%)
| 应用 策略数 | 加拿大 | 中国香港 | 中国上海 | 新加坡 | 美国 | |||||
|---|---|---|---|---|---|---|---|---|---|---|
| 正确组 | 错误组 | 正确组 | 错误组 | 正确组 | 错误组 | 正确组 | 错误组 | 正确组 | 错误组 | |
| 0 | / | 7.6 | / | 6.5 | / | 5.4 | / | 7.1 | / | 4.0 |
| 1 | 7.2 | 19.5 | 9.1 | 17.2 | 8.8 | 25.8 | 8.3 | 22.6 | 10.1 | 21.2 |
| 2 | 17.4 | 14.0 | 18.2 | 15.1 | 15.1 | 15.1 | 21.0 | 9.5 | 18.6 | 19.2 |
| 3 | 19.8 | 17.7 | 19.1 | 16.1 | 17.9 | 10.8 | 19.6 | 20.2 | 20.5 | 18.2 |
| 4 | 23.2 | 36.6 | 22.4 | 37.6 | 26.4 | 33.3 | 23.9 | 35.7 | 27.0 | 35.4 |
| 5 | 32.4 | 4.7 | 31.2 | 7.5 | 31.8 | 9.7 | 27.2 | 4.8 | 23.8 | 2.0 |
表6学生总体应用策略之间的关系
| 序号 | 频繁项集 | 正确组 | 错误组 | ||
|---|---|---|---|---|---|
| 频次 | 置信度 | 频次 | 置信度 | ||
| 1 | 5==>1 | 301 | 0.23 | 110 | 0.26 |
| 2 | 1==>5 | 301 | 0.24 | 110 | 0.27 |
| 3 | 5==>2 | 386 | 0.29 | 131 | 0.30 |
| 4 | 2==>5 | 386 | 0.37 | 131 | 0.34 |
| 5 | 4==>3 | 661 | 0.27 | / | / |
| 6 | 3==>4 | 661 | 0.36 | / | / |
| 7 | 5==>3 | 683 | 0.51 | 161 | 0.37 |
| 8 | 3==>5 | 683 | 0.37 | 161 | 0.33 |
表7各地区学生应用策略之间的关系
| 序号 | 频繁项集 | 正确组置信度 | 错误组置信度 | ||||||||
|---|---|---|---|---|---|---|---|---|---|---|---|
| 加拿大 | 中国香港 | 中国上海 | 新加坡 | 美国 | 加拿大 | 中国香港 | 中国上海 | 新加坡 | 美国 | ||
| 1 | 5==>1 | 0.23 | 0.20 | 0.18 | 0.26 | 0.27 | 0.25 | 0.26 | 0.30 | 0.24 | 0.24 |
| 2 | 1==>5 | 0.23 | 0.21 | 0.22 | 0.26 | 0.29 | 0.27 | 0.29 | 0.36 | 0.27 | 0.21 |
| 3 | 5==>2 | 0.30 | 0.28 | 0.27 | 0.32 | 0.25 | 0.30 | 0.29 | 0.30 | 0.36 | 0.27 |
| 4 | 2==>5 | 0.37 | 0.35 | 0.42 | 0.40 | 0.35 | 0.35 | 0.31 | 0.34 | 0.37 | 0.29 |
| 5 | 4==>3 | 0.29 | 0.25 | 0.18 | 0.29 | 0.28 | / | / | / | / | / |
| 6 | 3==>4 | 0.37 | 0.34 | 0.25 | 0.40 | 0.39 | / | / | / | / | / |
| 7 | 5==>3 | 0.53 | 0.50 | 0.53 | 0.46 | 0.51 | 0.42 | 0.39 | 0.36 | 0.24 | 0.33 |
| 8 | 3==>5 | 0.37 | 0.37 | 0.46 | 0.32 | 0.35 | 0.37 | 0.36 | 0.31 | 0.21 | 0.30 |
表8过程变量的描述统计及其与个体水平能力估计值的相关
| 作答结果 | 过程变量 | 加拿大 | 中国香港 | 中国上海 | 新加坡 | 美国 | |||||
|---|---|---|---|---|---|---|---|---|---|---|---|
| 相关 | 均值 | 相关 | 均值 | 相关 | 均值 | 相关 | 均值 | 相关 | 均值 | ||
| 正确 | 路径点击数 | / | 93.56 | / | 92.71 | / | 87.24 | / | 88.84 | / | 79.76 |
| 重设数量 | / | 1.12 | / | 0.97 | / | 1.03 | / | 0.83 | / | 0.92 | |
| 反应时 | / | 679.57 | / | 628.69 | / | 660.47 | / | 740.34 | / | 675.54 | |
| 个体能力 | / | 0.40 | / | 0.40 | / | 0.40 | / | 0.40 | / | 0.40 | |
| 错误 | 路径点击数 | -0.01 | 99.64 | 0.18 | 123.83 | -0.04 | 109.46 | 0.04 | 121.73 | 0.00 | 93.03 |
| 重设数量 | 0.07 | 1.55 | 0.11 | 1.55 | -0.10 | 1.37 | 0.14 | 1.68 | 0.14 | 1.39 | |
| 耗时与正确作答时间的差异 | -0.02 | 5.91 | 0.08 | 4.19 | 0.10 | 3.12 | 0.16 | 4.42 | -0.04 | 23.74 | |
| 反应时 | 0.06 | 647.12 | 0.12 | 552.35 | 0.06 | 606.24 | -0.01 | 683.37 | 0.04 | 663.62 | |
| 个体能力 | / | -0.79 | / | -0.79 | / | -0.76 | / | -0.79 | / | -0.79 | |
| 总体 | 路径点击数 | -0.03 | 94.96 | -0.13** | 99.40 | -0.12* | 92.27 | -0.13** | 94.90 | -0.08 | 83.00 |
| 重设数量 | -0.09** | 1.22 | -0.11* | 1.09 | -0.09 | 1.10 | -0.17** | 0.98 | -0.10 | 1.03 | |
| 耗时与正确作时间的差异 | -0.39*** | 1.39 | -0.34*** | 0.90 | -0.32*** | 0.71 | -0.35** | 0.81 | -0.39*** | 24.32 | |
| 反应时 | 0.03 | 672.08 | 0.07 | 612.29 | 0.05 | 648.20 | 0.04 | 729.84 | 0.01 | 672.64 | |
| 个体能力 | / | 0.13 | / | 0.15 | / | 0.14 | / | 0.18 | / | 0.11 | |
附表1模拟研究中各类别数量比例及题目答对概率
| 题目 | 潜类别数为3 | 潜类别数为5 | ||||||
|---|---|---|---|---|---|---|---|---|
| 类别1 (33.33%) | 类别2 (33.33%) | 类别3 (33.33%) | 类别1 (20.00%) | 类别2 (20.00%) | 类别3 (20.00%) | 类别4 (20.00%) | 类别5 (20.00%) | |
| 1 | 0.85 | 0.85 | 0.10 | 0.85 | 0.85 | 0.10 | 0.10 | 0.10 |
| 2 | 0.85 | 0.85 | 0.20 | 0.85 | 0.85 | 0.20 | 0.20 | 0.20 |
| 3 | 0.85 | 0.85 | 0.10 | 0.85 | 0.85 | 0.10 | 0.10 | 0.10 |
| 4 | 0.85 | 0.85 | 0.20 | 0.85 | 0.85 | 0.20 | 0.20 | 0.20 |
| 5 | 0.85 | 0.85 | 0.10 | 0.85 | 0.85 | 0.10 | 0.10 | 0.10 |
| 6 | 0.85 | 0.85 | 0.20 | 0.85 | 0.10 | 0.85 | 0.20 | 0.20 |
| 7 | 0.85 | 0.85 | 0.10 | 0.85 | 0.20 | 0.85 | 0.10 | 0.10 |
| 8 | 0.85 | 0.85 | 0.20 | 0.85 | 0.10 | 0.85 | 0.20 | 0.20 |
| 9 | 0.85 | 0.85 | 0.10 | 0.85 | 0.20 | 0.85 | 0.10 | 0.10 |
| 10 | 0.85 | 0.85 | 0.20 | 0.85 | 0.10 | 0.85 | 0.20 | 0.20 |
| 11 | 0.85 | 0.10 | 0.85 | 0.85 | 0.20 | 0.20 | 0.85 | 0.10 |
| 12 | 0.85 | 0.20 | 0.85 | 0.85 | 0.10 | 0.10 | 0.85 | 0.20 |
| 13 | 0.85 | 0.10 | 0.85 | 0.85 | 0.20 | 0.20 | 0.85 | 0.10 |
| 14 | 0.85 | 0.20 | 0.85 | 0.85 | 0.10 | 0.10 | 0.85 | 0.20 |
| 15 | 0.85 | 0.10 | 0.85 | 0.85 | 0.20 | 0.20 | 0.85 | 0.10 |
| 16 | 0.85 | 0.20 | 0.85 | 0.85 | 0.10 | 0.10 | 0.10 | 0.85 |
| 17 | 0.85 | 0.10 | 0.85 | 0.85 | 0.20 | 0.20 | 0.20 | 0.85 |
| 18 | 0.85 | 0.20 | 0.85 | 0.85 | 0.10 | 0.10 | 0.10 | 0.85 |
| 19 | 0.85 | 0.10 | 0.85 | 0.85 | 0.20 | 0.20 | 0.20 | 0.85 |
| 20 | 0.85 | 0.20 | 0.85 | 0.85 | 0.10 | 0.10 | 0.10 | 0.85 |
附表2每个类别点击各路径的次数
| 路径 | 类别1 | 类别2 | 类别3 | 类别4 | 类别5 | 路径 | 类别1 | 类别2 | 类别3 | 类别4 | 类别5 |
|---|---|---|---|---|---|---|---|---|---|---|---|
| P1 | 31050 | 1010 | 26185 | 10450 | 1175 | P13 | 26422 | 535 | 27272 | 10874 | 276 |
| P2 | 358 | 20917 | 272 | 71 | 26673 | P14 | 70 | 12160 | 120 | 23 | 197 |
| P3 | 14 | 4771 | 10 | 4 | 10 | P15 | 766 | 1131 | 5969 | 345 | 4394 |
| P4 | 16 | 1942 | 45 | 10 | 12 | P16 | 740 | 3933 | 11056 | 158 | 9578 |
| P5 | 10752 | 320 | 396 | 8981 | 4465 | P17 | 836 | 430 | 28099 | 11113 | 785 |
| P6 | 33 | 3751 | 24 | 17 | 19 | P18 | 17576 | 266 | 374 | 64 | 157 |
| P7 | 7554 | 1027 | 4109 | 6684 | 7135 | P19 | 97 | 6384 | 196 | 11 | 549 |
| P8 | 1082 | 241 | 433 | 11053 | 4972 | P20 | 136 | 575 | 374 | 91 | 20809 |
| P9 | 860 | 800 | 22245 | 154 | 14474 | P21 | 80 | 21507 | 179 | 22 | 360 |
| P10 | 15100 | 380 | 728 | 259 | 394 | P22 | 60 | 5906 | 286 | 0 | 730 |
| P11 | 1468 | 6723 | 7752 | 477 | 9474 | P23 | 12 | 5436 | 120 | 2 | 6 |
| P12 | 27 | 7128 | 33 | 10 | 84 |
参考文献 33
| [1] | Akaike H . (1974). A new look at the statistical model identification. IEEE Transactions on Automatic Control, 19(6), 716-723. |
| [2] | Asparouhov T., & Muthén B . (2014). Auxiliary variables in mixture modeling: Three-step approaches using Mplus. Structural equation modeling: A multidisciplinary journal, 21(3), 329-341. |
| [3] | Bergner Y., Shu Z., & von Davier A. A. (2014, July). Visualization and confirmatory clustering of sequence data from a simulation-based assessment task. Proceedings of the 7th International Conference on Educational Data Mining, London, UK. pp. 177-184. |
| [4] | Cho S.-J., & Cohen A. S . (2010). A multilevel mixture IRT model with an application to DIF. Journal of Educational and Behavioral Statistics, 35(3), 336-370. |
| [5] | de la Torre J., & Douglas J. A . (2004). Higher-order latent trait models for cognitive diagnosis. Psychometrika, 69(3), 333-353. |
| [6] | Desmarais M. C., & Baker R. S. J. D . (2012). A review of recent advances in learner and skill modeling in intelligent learning environments. User Modeling and User-Adapted Interaction, 22(1-2), 9-38. |
| [7] | DiCerbo K. E., & Behrens J. T . (2012). Implications of the digital ocean on current and future assessment. In R. Lissitz & H. Jiao (Eds.), Computers and their impact on state assessment: Recent history and predictions for the future (pp. 273-306). Charlotte, NC: Information Age Publishing. |
| [8] | DiCerbo K. E., Liu J., Rutstein D. W., Choi Y., & Behrens J. T . (2011, April). Visual analysis of sequential log data from complex performance assessments. Paper presented at the annual meeting of the American Educational Research Association, New Orleans, LA. |
| [9] | Fan L. H., & Zhu Y . (2007). From convergence to divergence: the development of mathematical problem solving in research, curriculum, and classroom practice in Singapore. ZDM Mathematics Education, 39(5-6), 491-501. |
| [10] | Fox J. P., & Glas C. A. W . (2003). Bayesian modeling of measurement error in predictor variables using item response theory. Psychometrika, 68(2), 169-191. |
| [11] | Funke J . (2001). Dynamic systems as tools for analysing human judgement. Thinking & Reasoning, 7(1), 69-89. |
| [12] | Garofalo J., & Lester F. K . (1985). Metacognition, cognitive monitoring, and mathematical performance. Journal for Research in Mathematics Education, 16(3), 163-176. |
| [13] | Goldstein H . (1987). Multilevel models in education and social research. Higher Education Research & Development, 28(6), 664-645. |
| [14] | Greiff S., Wüstenberg S., & Avvisati F . (2015). Computer- generated log-file analyses as a Window into students’ minds? A show case study based on the PISA 2012 assessment of problem solving. Computers & Education, 91, 92-105. |
| [15] | Kerr D., Chung G., & Iseli M . (2011). The feasibility of using cluster analysis to examine log data from educational video games (CRESST Report 790). Los Angeles, CA: National Center for Research on Evaluation, Standards, and Student Testing (CRESST). |
| [16] | Lee W. Y., Cho S. J., Sterba S. K . (2017). Ignoring a multilevel structure in mixture item response models: impact on parameter recovery and model selection. Applied Psychological Measurement, 42(2), 136-154. |
| [17] | Liao D. D., He Q. W., & Jiao H . (2019). Mapping background variables with sequential patterns in problem-solving environments: an investigation of United States adults’ employment status in PIAAC. Frontiers in Psychology, 10, 646. |
| [18] | Li J . (2012). Cultural foundations of learning: east and west New York, NY: Cambridge University Press. |
| [19] | Liu H. Y., Liu Y., & Li M. J . (2018). Analysis of process data of PISA 2012 computer-based problem solving: application of the modified multilevel mixture IRT model. Frontiers in Psychology, 9, 1372. |
| [20] | Mayer R. E. (1982). The psychology of mathematical problem solving. in F. K. lester, & J. garofalo (Eds.), Mathematical problem solving: issues in research (pp. 1-13). Franklin Institute Press, Philadelphia. |
| [21] | Muthén L. K., & Muthén B. O . (2005). Mplus: Statistical analysis with latent variables: User's guide. Los Angeles: Muthén & Muthén. |
| [22] | Nylund K. L., Asparouhov T., & Muthén B. O . (2007). Deciding on the number of classes in latent class analysis and growth mixture modeling: A monte carlo simulation study. Structural equation modeling: A multidisciplinary Journal, 14(4), 535-569. |
| [23] | OECD (2003). PISA 2003 assessment framework: Mathematics, reading, science, and problem solving knowledge and skills. Paris: OECD Publishing. |
| [24] | OECD (2003). PISA 2012 assessment and analytical framework: Mathematics, reading, science, problem solving and financial literacy. Paris: OECD Publishing. |
| [25] | Peter H . (2013). Machine learning in action (R. Li, P. Li, Y. Qu, & B. Wang, Trans.). Beijing: The Posts and Telecommunications Press. |
| [ Peter H . (2013). 机器学习实战 (李锐, 李鹏, 曲亚东, 王斌译). 北京: 人民邮电出版社.] | |
| [26] | Qiao X., & Jiao H . (2018). Data mining techniques in analyzing process data: A didactic. Frontiers in Psychology, 9, 2231. |
| [27] | Rosato N. S., & Baer J. C . (2012). Latent class analysis: A method for capturing heterogeneity. Social Work Research, 36(1), 61-69. |
| [28] | Schwarz G. E . (1978). Estimating the dimension of a model. The Annals of Statistics, 6(2), 461-464. |
| [29] | Shu Z., Bergner Y., Zhu M. X., Hao J. G., & von Davier A. A. (2017). An item response theory analysis of problem- solving processed in scenario-based tasks. Psychological Test and Assessment Modeling, 59(1), 109-131. |
| [30] | Tofighi D., & Enders C. K. . (2008). Identifying the correct number of classes in growth mixture models. In G. R. Hancock, & K. M. Samuelsen (Eds.), Advances in latent variable mixture models (pp. 317-342). Charlotte, NC: Information Age Publishing Inc. |
| [31] | Vermunt J. K . (2003). Multilevel latent class models. Sociological Methodology, 33(1), 213-239. |
| [32] | Wang C., Xu G. J., Shang Z. R., & Kuncel N . (2018). Detecting aberrant behavior and item preknowledge: A comparison of mixture modeling method and residual method. Journal of Educational and Behavioral Statistics, 43(4), 469-501. |
| [33] | Zoanetti N . (2010). Interactive computer based assessment tasks: How problem-solving process data can inform instruction. Australasian Journal of Educational Technology, 26(5), 585-606. |
相关文章 15
| [1] | 刘红云, 袁克海, 甘凯宇. 有中介的调节模型的拓展及其效应量[J]. 心理学报, 2021, 53(3): 322-336. |
| [2] | 罗芬, 王晓庆, 蔡艳, 涂冬波. 基于基尼指数的双目标CD-CAT选题策略[J]. 心理学报, 2020, 52(12): 1452-1465. |
| [3] | 詹沛达, Hong Jiao, Kaiwen Man. 多维对数正态作答时间模型:对潜在加工速度多维性的探究[J]. 心理学报, 2020, 52(9): 1132-1142. |
| [4] | 汪大勋, 高旭亮, 蔡艳, 涂冬波. 基于类别水平的多级计分认知诊断Q矩阵修正:相对拟合统计量视角[J]. 心理学报, 2020, 52(1): 93-106. |
| [5] | 高旭亮,汪大勋,王芳,蔡艳,涂冬波. 基于分部评分模型思路的多级评分认知诊断模型开发[J]. 心理学报, 2019, 51(12): 1386-1397. |
| [6] | 王璞珏,刘红云. 让自适应测验更知人善选——基于推荐系统的选题策略[J]. 心理学报, 2019, 51(9): 1057-1067. |
| [7] | 詹沛达,于照辉,李菲茗,王立君. 一种基于多阶认知诊断模型测评科学素养的方法[J]. 心理学报, 2019, 51(6): 734-746. |
| [8] | 辛潇洋,李瑛,毕研玲,晏碧华. 一种齐当别思想下的量子决策模型:对囚徒困境中的分离效应的解释[J]. 心理学报, 2019, 51(6): 724-733. |
| [9] | 温忠麟,汤丹丹,顾红磊. 预测视角下双因子模型与高阶因子模型的一般性模拟比较[J]. 心理学报, 2019, 51(3): 383-391. |
| [10] | 彭亚风, 罗照盛, 李喻骏, 高椿雷. 不同认知结构被试的测验设计模式[J]. 心理学报, 2018, 50(1): 130-140. |
| [11] | 魏丹, 刘红云, 张丹慧. 多维题组反应模型:多维随机系数多项 Logistic模型的应用拓展[J]. 心理学报, 2017, 49(12): 1604-1614. |
| [12] | 王孟成, 邓俏文, 毕向阳, 叶浩生, 杨文登. 分类精确性指数Entropy在潜剖面分析中的 表现:一项蒙特卡罗模拟研究[J]. 心理学报, 2017, 49(11): 1473-1482. |
| [13] | 刘玥, 刘红云. 基于双因子模型的测验总分和 维度分的合成方法[J]. 心理学报, 2017, 49(9): 1234-1246. |
| [14] | 徐霜雪, 俞宗火, 李月梅. 预测视角下双因子模型与高阶模型的模拟比较[J]. 心理学报, 2017, 49(8): 1125-1136. |
| [15] | 祝玉芳,丁树良. 基于等级反应模型的属性层级方法[J]. 心理学报, 2009, 41(03): 267-275. |
PDF全文下载地址:
http://journal.psych.ac.cn/xlxb/CN/article/downloadArticleFile.do?attachType=PDF&id=4690
