Fund Project:Project supported by the National Natural Science Foundation of China (Grant No. 11063004) and a Reserve of Young and Middle-age Academic and Technical Leader in Yunnan Province, China (Grant No. 2017HB020)
Received Date:19 April 2021
Accepted Date:09 June 2021
Available Online:15 August 2021
Published Online:05 November 2021
Abstract:In this paper, CGRaBS J2345-1555’s long-term radio band, gamma ray flux and optical V-band magnitude data are collected from Fermi/LAT, Catalina, and OVRO dataset. The correlation between multi-bands is evaluated by the discrete correlation function method. The results show that the correlation coefficient between gamma band and radio band is 0.53, and the time delay is about 90 days, a variation of the gamma band is about 90 days ahead of radio band; the correlation coefficient between radio band and optical V-band is 0.84, and the time delay is about –300 days, a variation of the optical V-band is about 300 days ahead of radio band; there is no significant correlation between gamma and optical V-band. These results show that the optical band is dominated by synchrotron radiation, and the time delay between the radio band and the optical band can be explained as the fact that the radiation region of the optical band is upstream, and the radio band is downstream. The gamma band and the radio band are both homologous. The distribution of brightness temperature is used to calculate the Doppler factor of the celestial body’s radio band. The averaged Doppler factor is 12.64, and it oscillates with the light curve. So the jet has obvious bunching effect, and the variation of radiation flux in radio band comes from the jet. Keywords:discrete correlation function method/ correlations/ time delay/ Doppler factor
OVRO 40 m望远镜工作在13—18 GHz频段, 分辨率为3弧秒, 观测误差约为4 mJy (典型值为3%)[14]. 为支持Fermi/LAT伽马射线太空望远镜, 自2007年以来, 该望远镜进行了大规模、快速的15 GHz观测活动, 观测目标约7000个. 图1是我们从OVRO 40 m射电望远镜(https://sites.astro.caltech.edu/ovroblazars/)观测项目中收集的CGRaBS J2345-1555长期15 GHz数据. 光变曲线中有8个明显的大爆发, 分别在图1中编号为3, 4, 5, 7, 8, 9, 10和12的矩形内. 5个明显小爆发, 分别在图1中编号为0, 1, 2, 6和11的矩形内. 图 1 从2008年1月5日至2020年7月1日射电波段15 GHz流量数据, 红色矩形内为大爆发, 绿色矩形内为小爆发 Figure1. 15 GHz radio frequency data from January 5, 2008 to July 1, 2020. Strong bursts are inside the red rectangles, weak bursts are inside the green rectangles.
22.3.费米太空望远镜(Fermi/LAT) -->
2.3.费米太空望远镜(Fermi/LAT)
Fermi/LAT是1个大面积巡天望远镜, 可每3 h扫描整个天空. LAT可观测20 MeV至1 TeV以上的伽马射线. CGRaBS J2345-1555数据具有高统计意义, 我们从费米科学支持中心(https://fermi.gsfc.nasa.gov/ssc/data/access)得到目标源的长期费米数据(3FGL), 共131个数据点. 为方便观察伽马波段与15 GHz、光学V波段的相关性, 图2给出了伽马波段向左移动90天后的光变曲线, 可以看出伽马波段与光学V波段具有较好相关性, 与15 GHz相关性较差. 图 2 从2008年8月19日至2019年4月24日伽马波段流量数据, 红色矩形内为爆发 Figure2. Gamma band data from August 19, 2008 to April 24, 2019. Bursts are inside the red rectangles.
22.4.卡特琳娜光学望远镜(Catalina) -->
2.4.卡特琳娜光学望远镜(Catalina)
Catalina的测光原理是孔径测光, 由于孔径测光在光源混杂时不准确, 因此除银河平面附近, 对大量星的V波段进行了校准. 图3是通过J2000d坐标在CRST网站(http://nesssi.cacr.caltech.edu/DataRelease/)上得到的CGRaBS J2345-1555的长期光学V波段数据. 为方便观察光学V波段与15 GHz、伽马波段的相关性, 给出了光学V波段向左移动300天后的光变曲线. 容易看出在JD = 2455500之前V波段相对平坦, 有几个微弱的爆发, 但在JD = 2455500之后有两个大的爆发和两个小爆发, 与射电波段的爆发时间很接近. 图 3 从2005年11月30日至2010年8月13日光学V波段流量数据 Figure3. Optical V-band data from November 30, 2005 to August 13, 2010. Bursts are inside the red rectangles.
对CGRaBS J2345-1555的射电、伽马射线、光学V波段两两之间进行互相关分析, 射电、伽马、光学V波段光变曲线如图1—3所示, 相关性计算结果如图4—6所示. 通过局部归一化, 离散相关函数中的点被限制在–1到1之间, 每个点都直接表示每个滞后的线性相关系数[16]. 图4是伽马波段和射电波段离散相关函数计算结果, 峰值在(90, 0.53), 超过99.7%置信曲线. 对相关系数的峰进行高斯拟合, 得到的时间延迟约为106天, 相关系数为0.484, 时间延迟为正值表示伽马波段领先射电波段, 与Fuhrmann等[7]研究的54个源的结果相似. 图5是射电波段和光学V波段离散相关函数的计算结果, 峰值在(–300, 0.84), 超过99.9%置信曲线. 对峰值进行高斯拟合, 拟合得到的时间延迟约为–310天, 相关系数为0.720, 负值表明射电波段落后于光学V波段310天, 与Zhang等[9]的估计相似. 图6为伽马波段和光学V波段离散相关函数计算结果, 可见离散相关函数分布弥散, 在–500—500天之间没有明显的峰值存在, 说明伽马和光学V波段之间不存在具体相关性. 图 4 红色曲线为99.7%置信曲线, 黑色点为伽马和射电15 GHz波段离散相关函数的计算结果 Figure4. Red curve is the 99.7% confidence curve, and the black points are the calculation results of the discrete correlation function of the gamma band and the radio 15 GHz band.
图 5 红色曲线为99.9%置信曲线, 黑色点为射电波段和光学V波段离散相关函数计算结果 Figure5. Red curve is the 99.9% confidence curve, and the black points are the calculation results of the discrete correlation function of the radio band and the optical V band.
图 6 伽马波段和光学V波段离散相关函数计算结果 Figure6. Calculation results of the discrete correlation function of the gamma band and the optical V band.
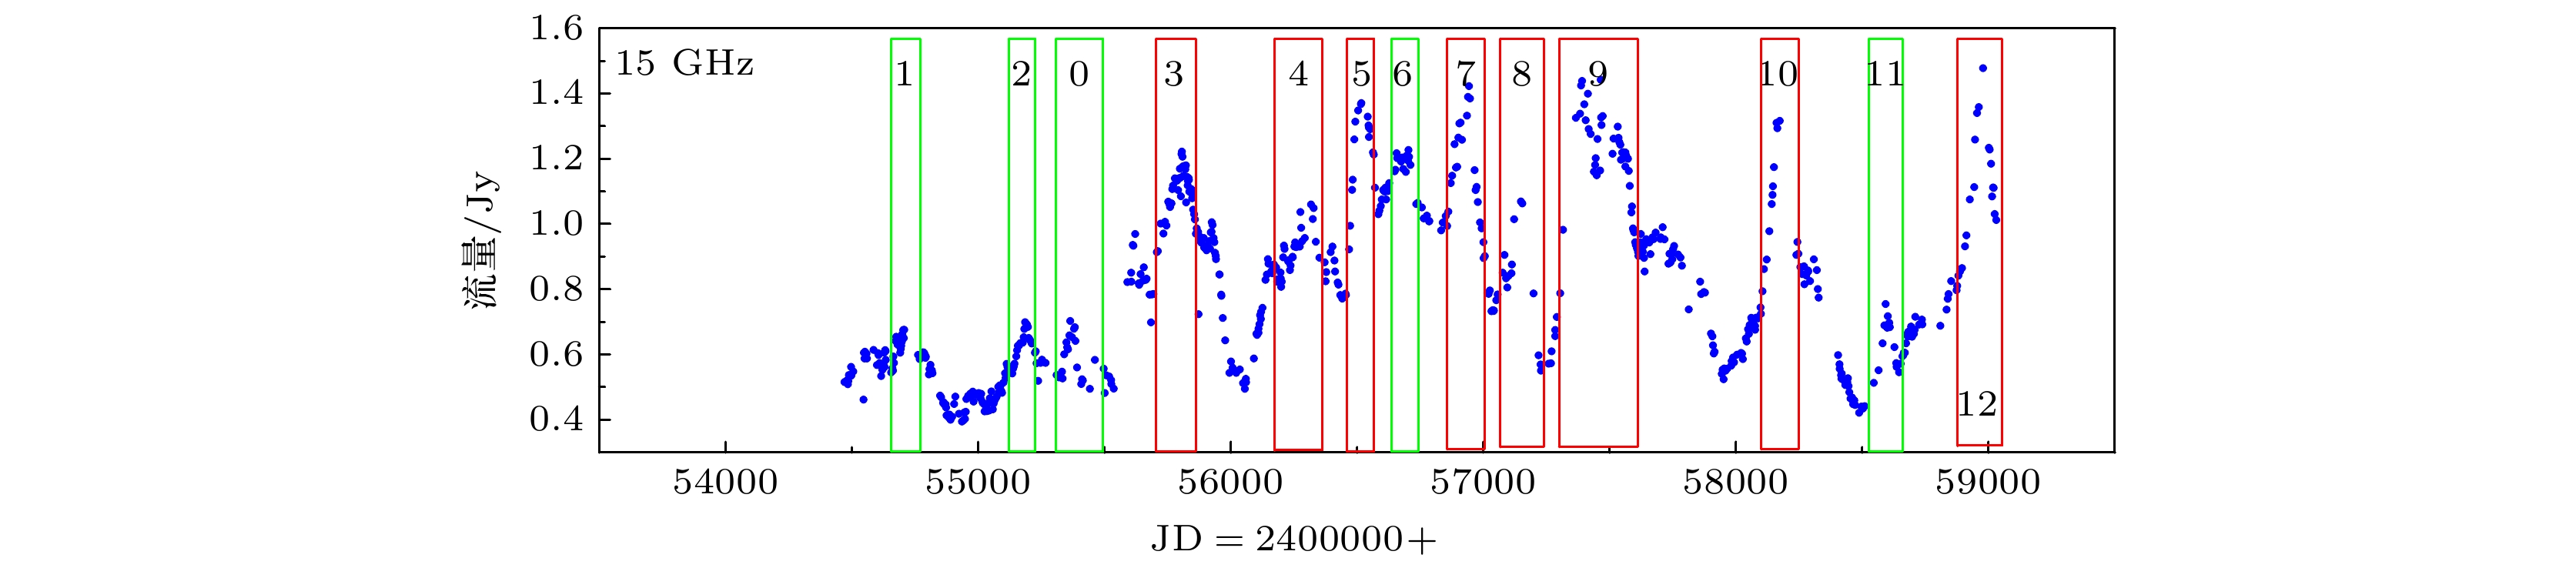 图 1 从2008年1月5日至2020年7月1日射电波段15 GHz流量数据, 红色矩形内为大爆发, 绿色矩形内为小爆发
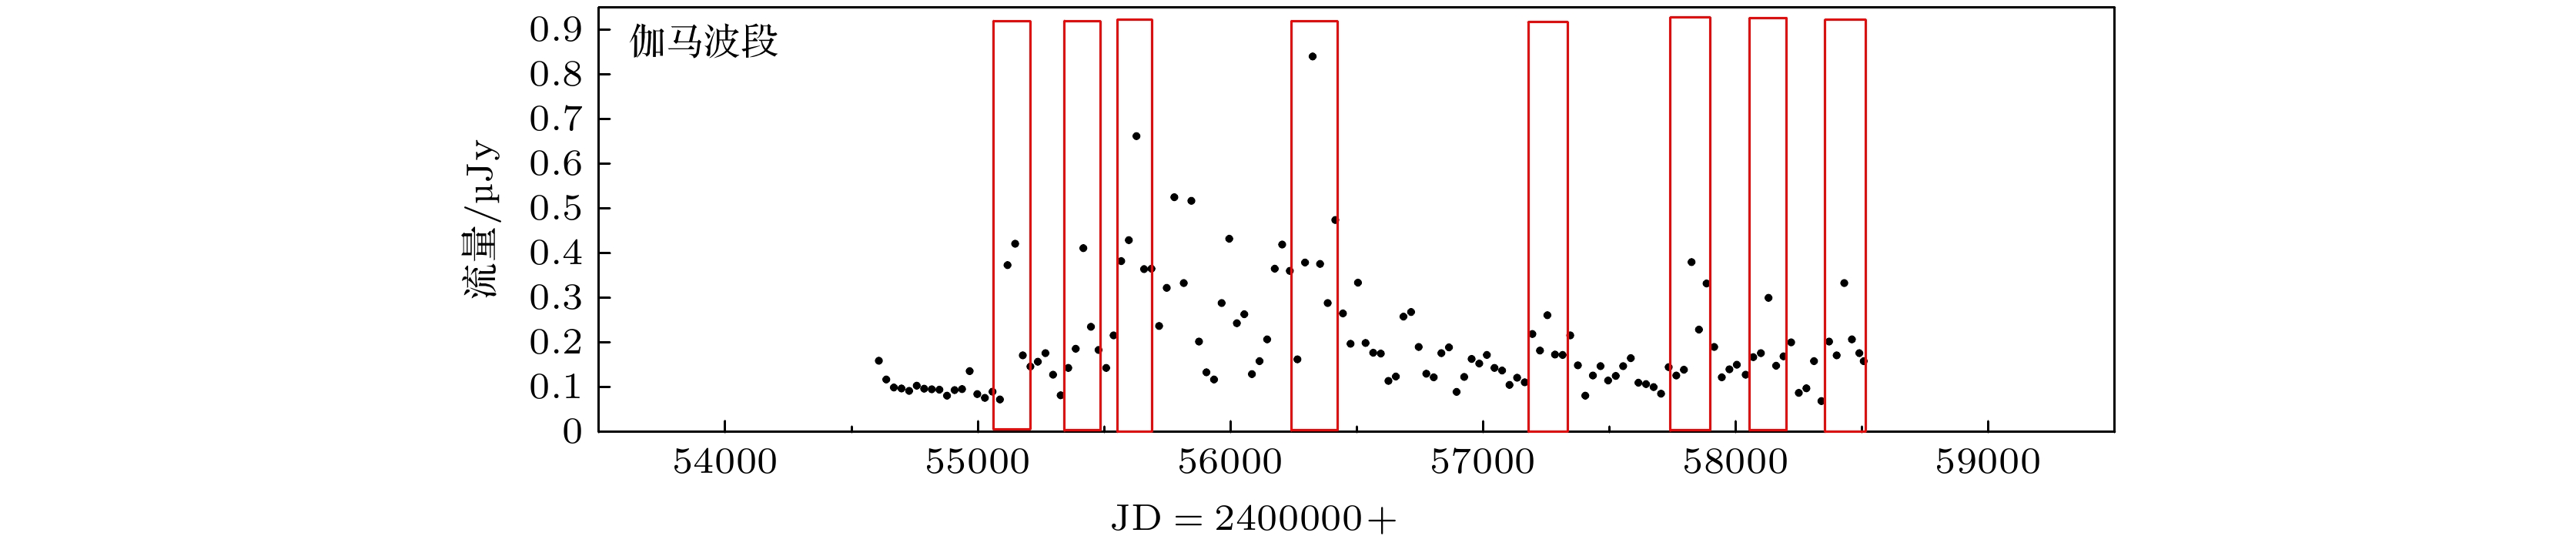 图 2 从2008年8月19日至2019年4月24日伽马波段流量数据, 红色矩形内为爆发
 图 3 从2005年11月30日至2010年8月13日光学V波段流量数据


 图 4 红色曲线为99.7%置信曲线, 黑色点为伽马和射电15 GHz波段离散相关函数的计算结果
 图 5 红色曲线为99.9%置信曲线, 黑色点为射电波段和光学V波段离散相关函数计算结果
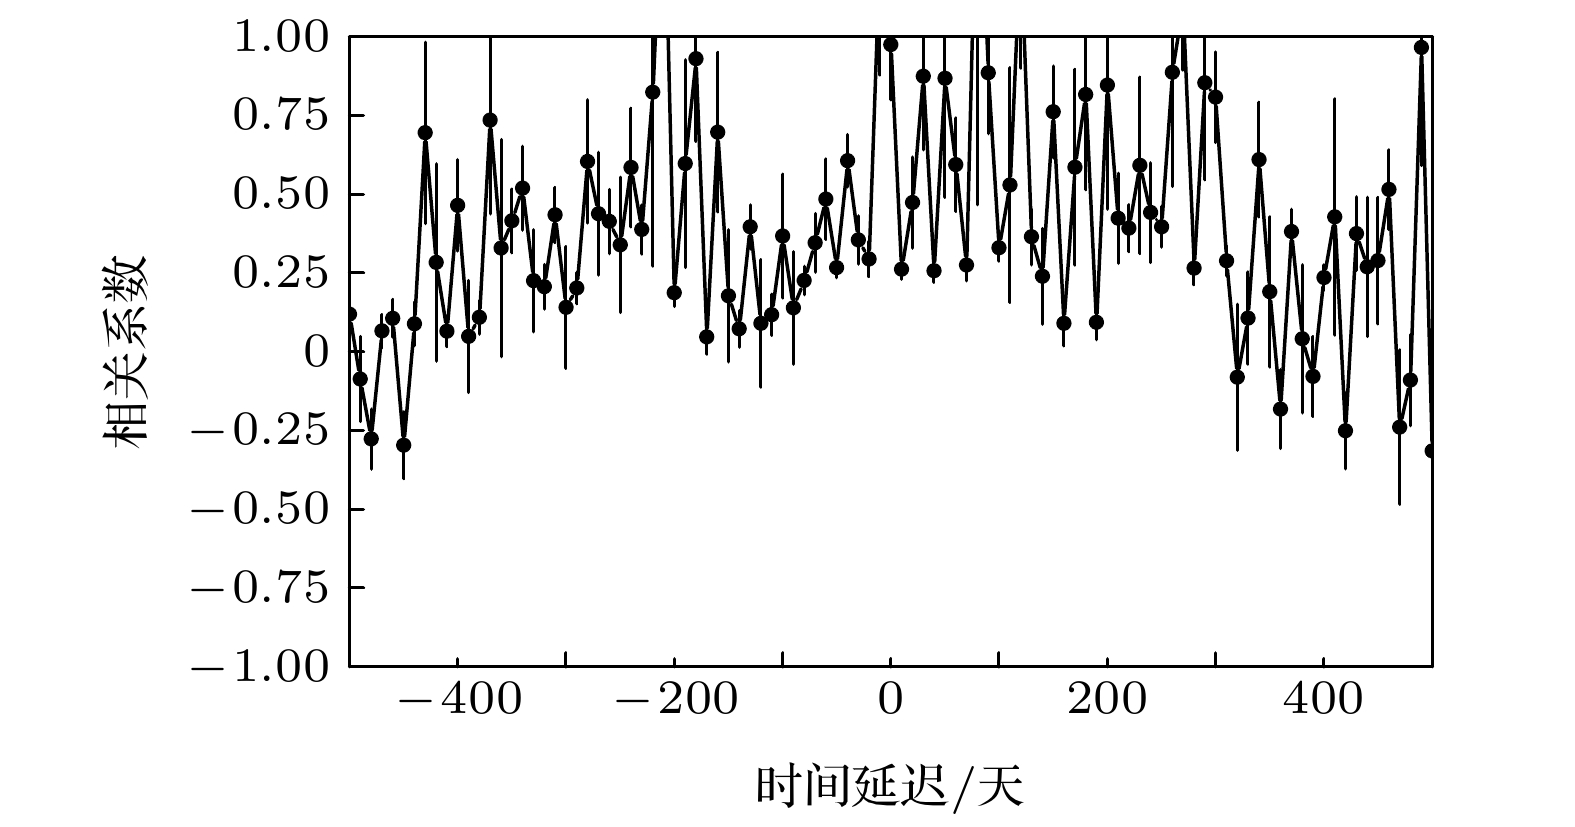 图 6 伽马波段和光学V波段离散相关函数计算结果


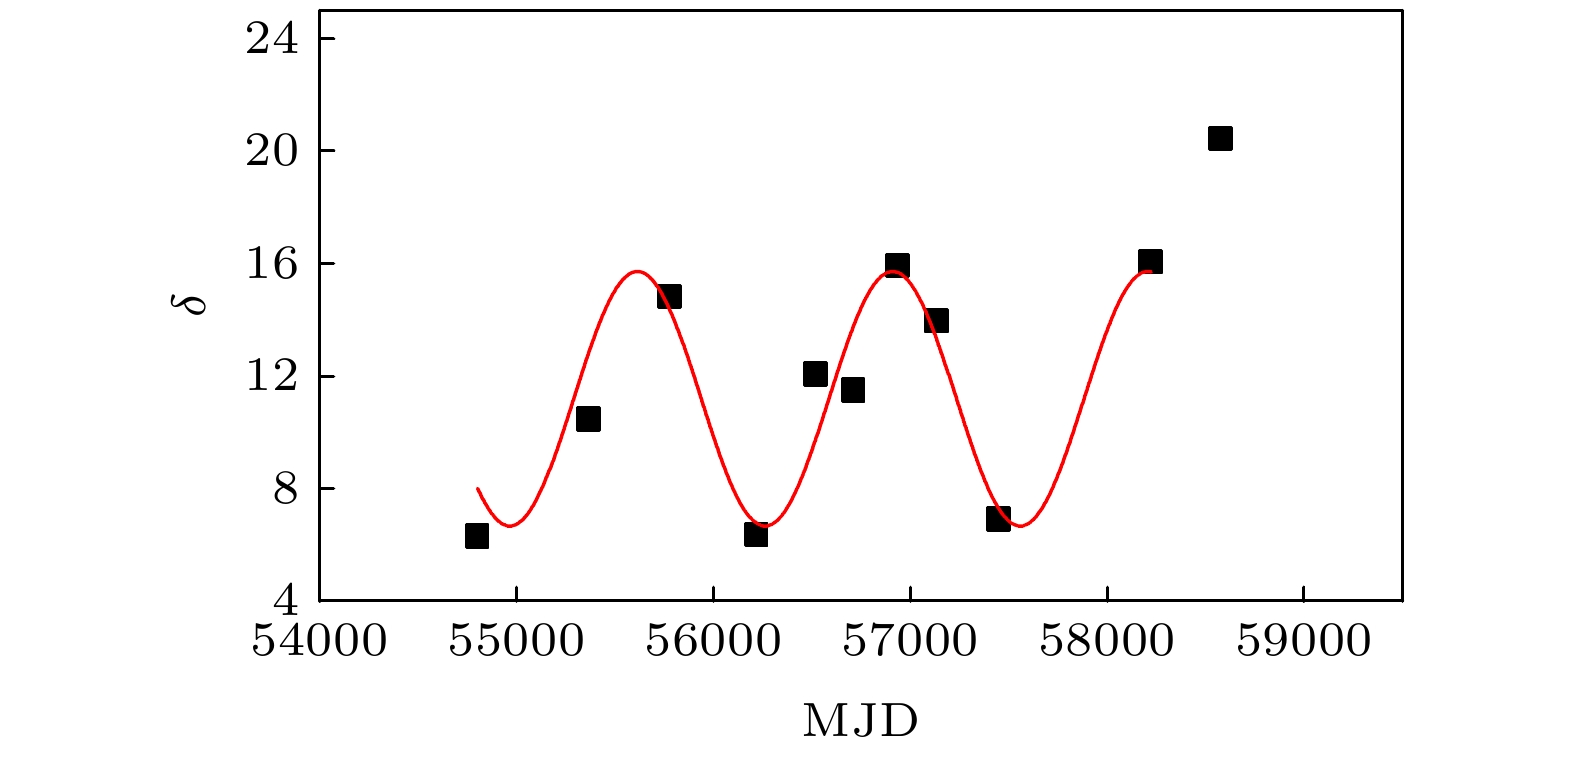 图 7 15 GHz多普勒因子的分布