Center for Soft Condensed Matter Physics and Interdisciplinary Research, School of Physical Science and Technology, Soochow University, Suzhou 215006, China
Fund Project:Project supported by the National Natural Science Foundation of China (Grant Nos. 21774092, U1532108, U1932121)
Received Date:11 March 2021
Accepted Date:14 April 2021
Available Online:07 June 2021
Published Online:05 September 2021
Abstract:In recent years, the emergence and development of single-molecule tracking technology has provided a new way to study the biological process in a cell membrane. However, the heterogeneity of biomolecular motions in cell membranes makes it difficult to distinguish and separate different molecular motion patterns from a large number of molecular trajectories. In this work, taking the system of interaction between melittin and a single-component supported phospholipid bilayer (SLB) membrane as an example, a type of data analysis method is developed through using the frequency distribution of standard deviations of single molecular motion displacements to distinguish and separate lipid molecules in different motion modes. It provides higher accuracy and more quantitative information than traditional analysis methods based on the frequency distribution of displacement or radius of gyration. By using this method, we successfully separate the two moving states of lipids in the SLB, and find that such a distribution is partly consistent with the location distribution of lipids in the upper leaflet and lower leaflet. Under the influence of surface adsorption or transmembrane poration of melittin at different concentrations, the movements of these two types of lipids are disturbed in different ways. In this work, a data analysis method for the separation of molecular motion patterns is developed according to the complex heterogeneity of molecular motions in a phospholipid membrane system. The different effects on the upper leaflet and lower leaflet of a lipid membrane due to melittin actions at different stages are obtained. The method developed in this work will be of great help in studying the dynamic processes of biological systems by using single-molecule tracking technology. Keywords:single-molecule tracking/ molecular dynamics/ melittin/ cell membrane
表1不同浓度蜂毒肽影响下磷脂膜中磷脂分子运动Dstd频数分布的拟合结果 Table1.Fittings of the Dstd PDF of lipid trajectories in membrane incubated with melittin at different concentrations.
R2
F-value
σ = 1/σ = 1.25
0.99
24362.45
σ = 1/σ = 1.5
0.99
4661.03
σ = 1/σ = 2
0.99
5739.05
表A1正文中图2所示高斯拟合的拟和优度 TableA1.Goodness of the Gaussian fittings in Fig. 2 in the main text.
23.2.平板磷脂双层膜: 脂分子轨迹的Dstd频数分布分析 -->
3.2.平板磷脂双层膜: 脂分子轨迹的Dstd频数分布分析
使用传统的囊泡融合法制备了平板支撑DOPC磷脂双层膜, 利用单粒子追踪技术追踪了磷脂分子在膜内的运动轨迹. 图3(a)和图3(b)为典型的单个磷脂分子位置变化的时间序列照片和轨迹曲线, 清晰显示了该分子在膜内的扩散运动行为. 此外, 导致磷脂分子具有不同运动模式的原因之一是其上下叶所处的环境不同, 因此我们在原始脂膜体系中加入荧光淬灭剂碘化钾和硫代硫酸钠, 以淬灭脂膜上叶的绝大部分荧光基团[17]. 然后, 利用Dstd频数分布法对基于原始脂膜和上叶荧光淬灭后脂膜内的脂分子轨迹数据(每种条件>1300条)分别进行了分析. 图 3 DOPC支撑脂双层膜内磷脂分子运动轨迹的Dstd的频数分布分析 (a), (b) 典型的单个磷脂分子时间序列荧光成像照片(拍摄速率30 frames/s)及运动轨迹(总时长4.38 s). (c)—(e) 原始以及加入荧光淬灭剂之后的脂膜: (c)示意图; (d)分子轨迹Dstd频数分布情况; (e) $ {T}_{\rm{slow}} $与 $ {T}_{\rm{fast}} $比例柱状图. 图(c)中红色为荧光脂分子, 蓝色为无荧光脂分子 Figure3. PDF of Dstd of the lipid trajectories in a DOPC SLB before or after fluorescence quenching: (a), (b) Representative lipid molecule in a pristine membrane, its time-serial images (at 30 frames/s) and trajectory (with a time duration of 4.38 s); (c)?(e) schematic diagram, PDF of Dstd, and percentage histogram of the $ {T}_{\rm{slow}} $ and $ {T}_{\rm{fast}} $, of the membrane before and after outer-leaflet fluorescence quenching.
表A2单组分DOPC磷脂膜淬灭前后磷脂分子运动Dstd频数分布的拟合数值 TableA2.Fittings of the Dstd PDF of lipid trajectories in a SLB membrane before and after quenching.
作为比较, 我们同样使用了传统的$ {R}_{\rm{g}} $频数分布方法对磷脂运动轨迹进行了分析. 如附录图A2(a)所示, $ {T}_{\rm{mixed}} $的频数分布在$ {R}_{\rm{g}}\approx 0. 7 $的区域会呈现出反常高水平分布, 这是由原本两种轨迹的标准差差距很大导致的. 在现有文献中, 也有****直接利用$ {R}_{\rm{g}} $值的大小以区分不同运动模式的轨迹. 尽管在一定程度上, 利用$ {R}_{\rm{g}} $分离轨迹与利用Dstd实现轨迹分离的结果有一定的相似度(附录图A2(b)和图A2 (c)), 然而这一方法强烈依赖于分析者的主观判断来进行临界$ {R}_{\rm{g}} $值的选择, 并且分离阈值的确定会受频数分布步长的影响. 但Dstd频数分析法由两个高斯函数的交点作为阈值来定量区分, 且不会受到步长选择的影响(附录图A3). 图 A2 原始脂膜内脂分子运动行为的回旋半径PDF分析 (a) 不同步长下的 ${R_{\rm{g}}}$频数分布以及相应的阈值; (b) 分别以${R_{\rm{g}}}$和${D_{\rm{std}}}$为标准分离轨迹得到的${T_{\rm{slow}}}$占比柱状图; (c) 纯DOPC脂膜中磷脂分子运动轨迹的回旋半径以及位移标准差之间的关系, 其中黑色线为拟合曲线, 二者呈现正相关 FigureA2. PDF analysis of ${R_{\rm{g}}}$ for the lipids in a pristine membrane: (a) PDF of ${R_{\rm{g}}}$ acquried with different step values (Step = 0.1, 0.2 or 0.3). Dashed lines show determination of the threshold value separating the trajectories. (b) Percentage of ${T_{\rm{slow}}}$ obtained by ${R_{\rm{g}}}$ or ${D_{\rm{std}}}$ analysis. (c) Relationship between ${R_{\rm{g}}}$ and ${D_{\rm{std}}}$ for a pure DOPC bilayer.
图 A3 不同步长的Dstd的频数分布以及相应的高斯拟合 (a) 步长为0.05; (b) 步长为0.02; (c) 步长为0.04 FigureA3. PDF of Dstd by different step and corresponding Gaussian fittings: (a) step = 0.05; (b) step = 0.02; (c) step = 0.04.
23.3.蜂毒肽导致的磷脂分子异常扩散行为 -->
3.3.蜂毒肽导致的磷脂分子异常扩散行为
根据之前的研究结果, 蜂毒肽实现杀菌功能的细胞膜作用过程主要包括两步: 多肽在细胞膜表面的吸附和聚集, 以及多肽的插膜和跨膜孔的形成. 基于巨囊泡泄露测试的实验结果显示, 蜂毒肽导致跨膜孔道形成的临界浓度约为3.0 μg/mL, 仅在高于此临界浓度时, 脂膜上吸附的多肽分子能够形成跨膜孔道并造成显著的物质跨膜泄露(附录图A4(a)—图A4 (d))[5]. 因此在实验中, 我们选择了远低于或高于此临界值的两个多肽浓度体系(0.5与5.0 μg/mL)以实现多肽不同的作用状态: 在0.5 μg/mL蜂毒肽浓度的体系中, 多肽主要呈现为脂膜表面吸附的状态, 该状态恰好对应于多肽跨膜成孔的中间态时间过程; 而当浓度达到5.0 μg/mL, 部分多肽分子会在脂膜内形成跨膜孔道(附录图A4(e)—(f))[10]. 因此对这两个浓度体系下蜂毒肽与细胞膜相互作用状态的研究, 有助于深入了解蜂毒肽杀菌活性的浓度依赖性, 以及它破膜杀菌的动力学过程. 图 A4 不同浓度的蜂毒肽作用下的GUV泄露实验 (a)—(c) 分别在0.5, 5.0以及8 μg/mL的蜂毒肽的作用下的GUV泄露情况, 其中绿色通道为GUV中包裹的钙黄绿素, 红色通道代表GUV所在的轮廓; (d) 0—10 μg/mL各浓度的蜂毒肽对GUV的扰动情况; (e)浓度3 μg/mL蜂毒肽的作用下, 典型的GUV荧光泄露曲线; (f) 低浓度蜂毒肽吸附在脂膜以及高浓度蜂毒肽形成跨膜孔道的示意图 FigureA4. GUV leakage experiment incubated with different concentration of melittin: (a)–(c) Confocal images of GUV leakage incubated with 0.5, 5.0 and 8 μg/mL of melittin; (d) influence on GUV by different concentration of melittin; (e) typical leakage curve of GUV incubated with 3 μg/mL; (f) sketch of absorption or poration of melittin interacted with membrane.
基于对不同蜂毒肽浓度(0.5或5.0 μg/mL)的脂膜体系中、大量脂分子扩散行为追踪(每种条件下约600条轨迹)、Dstd频数分布分析及相应的双高斯峰拟合, 分别得到了$ {T}_{\rm{slow}} $以及$ {T}_{\rm{fast}} $轨迹组(图4(a),(b), 拟合结果见表1, 相应拟合优度见附录表A3). 与原始脂膜相比, 高浓度体系中$ {T}_{\rm{fast}} $峰位显著左移(由0.37到0.29, 降低了约21.6%), 意味着$ {T}_{\rm{fast}} $轨迹组的脂分子运动速率明显变慢; 峰的宽度显著变窄(半高宽由原始的0.11降至0.08, 降低了约27.3%), 同时$ {T}_{\rm{fast}} $组脂分子所占比例发生了明显提高(由纯脂膜中的78.7%提高到87.3%), 这些现象表明体系中脂分子运动的异质性大大降低, 即大部分脂分子呈现出较为均匀的、比原始脂膜中$ {T}_{\rm{fast}} $组脂分子慢的运动状态. 这一结果证明高浓度下多肽形成跨膜孔对磷脂分子运动扩散能力不仅起到显著阻碍作用、也起到了均一化作用. 相较之下, 低浓度蜂毒肽体系则出现了不同的情况. 该体系中, $ {T}_{\rm{fast}} $峰位与原始膜接近(0.37—0.36)且呈现较宽的分布(半高宽保持在0.11), $ {T}_{\rm{fast}} $所占比例由纯脂膜中的78.7%提高到87.9%. 这意味着大量的脂分子(包括原始的快速运动及部分慢速运动分子)共同呈现出了不均一的运动行为, 证明了低浓度多肽在脂膜表面的吸附并没有影响$ {T}_{\rm{fast}} $组脂分子整体的运动速率. 需要注意的是, 不同浓度多肽都增强了$ {T}_{\rm{slow}} $和$ {T}_{\rm{fast}} $组脂分子(主要为下叶和上叶脂分子)之间的耦合, 使他们呈现了更相似的运动状态. 图 4 蜂毒肽作用下的脂分子运动行为分析 (a), (b) 蜂毒肽影响下磷脂分子运动轨迹的Dstd频数分布, 多肽浓度为 (a) 0.5 μg/mL, (b) 5.0 μg/mL; (c), (d) 三种实验体系内$ {T}_{\rm{fast}} $与$ {T}_{\rm{slow}} $的系综平均均方位移; (e) 三个体系中多肽与脂膜作用示意图 Figure4.Dstd PDF analysis of the melittin-exposed lipid membrane: (a), (b) PDF of Dstd of lipids incubated with melittin at (a) 0.5 μg/mL and (b) 5.0 μg/mL; (c), (d) EA-MSD of $ {T}_{\rm{fast}} $ and $ {T}_{\rm{slow}} $ in the three systems; (e) cartoons showing melittin-membrane interactions in the three systems.
表A4不同浓度的蜂毒肽影响下磷脂分子运动轨迹的系综平均均方位移的扩散方程拟合结果 TableA4.Fittings of the EA-MSD of lipid trajectories in membrane incubated with melittin at different concentrations.
图 A5 分子动力学模拟中蜂毒肽影响下脂分子的扩散情况 (a) 代表性俯视截图, 显示蜂毒肽在脂膜表面的吸附; (b)脂分子的扩散图谱[10] FigureA5. Diffusion of lipids upon melittin exposure in molecular dynamics simulations: (a) Representative snapshot of melittin binding on a membrane (top view); (b) diffusion map of individual lipids[10].
表A3不同浓度蜂毒肽影响下磷脂膜中磷脂分子运动Dstd频数分布的拟合数值 TableA3.Fittings of the Dstd PDF of lipid trajectories in membrane incubated with melittin at different concentrations.


 图 1 利用传统的位移和回旋半径PDF进行轨迹分析 (a) 轨迹的位移频数分布情况, 包括两类原始轨迹


 图 2 利用Dstd频数分布进行轨迹分析举例 (a)


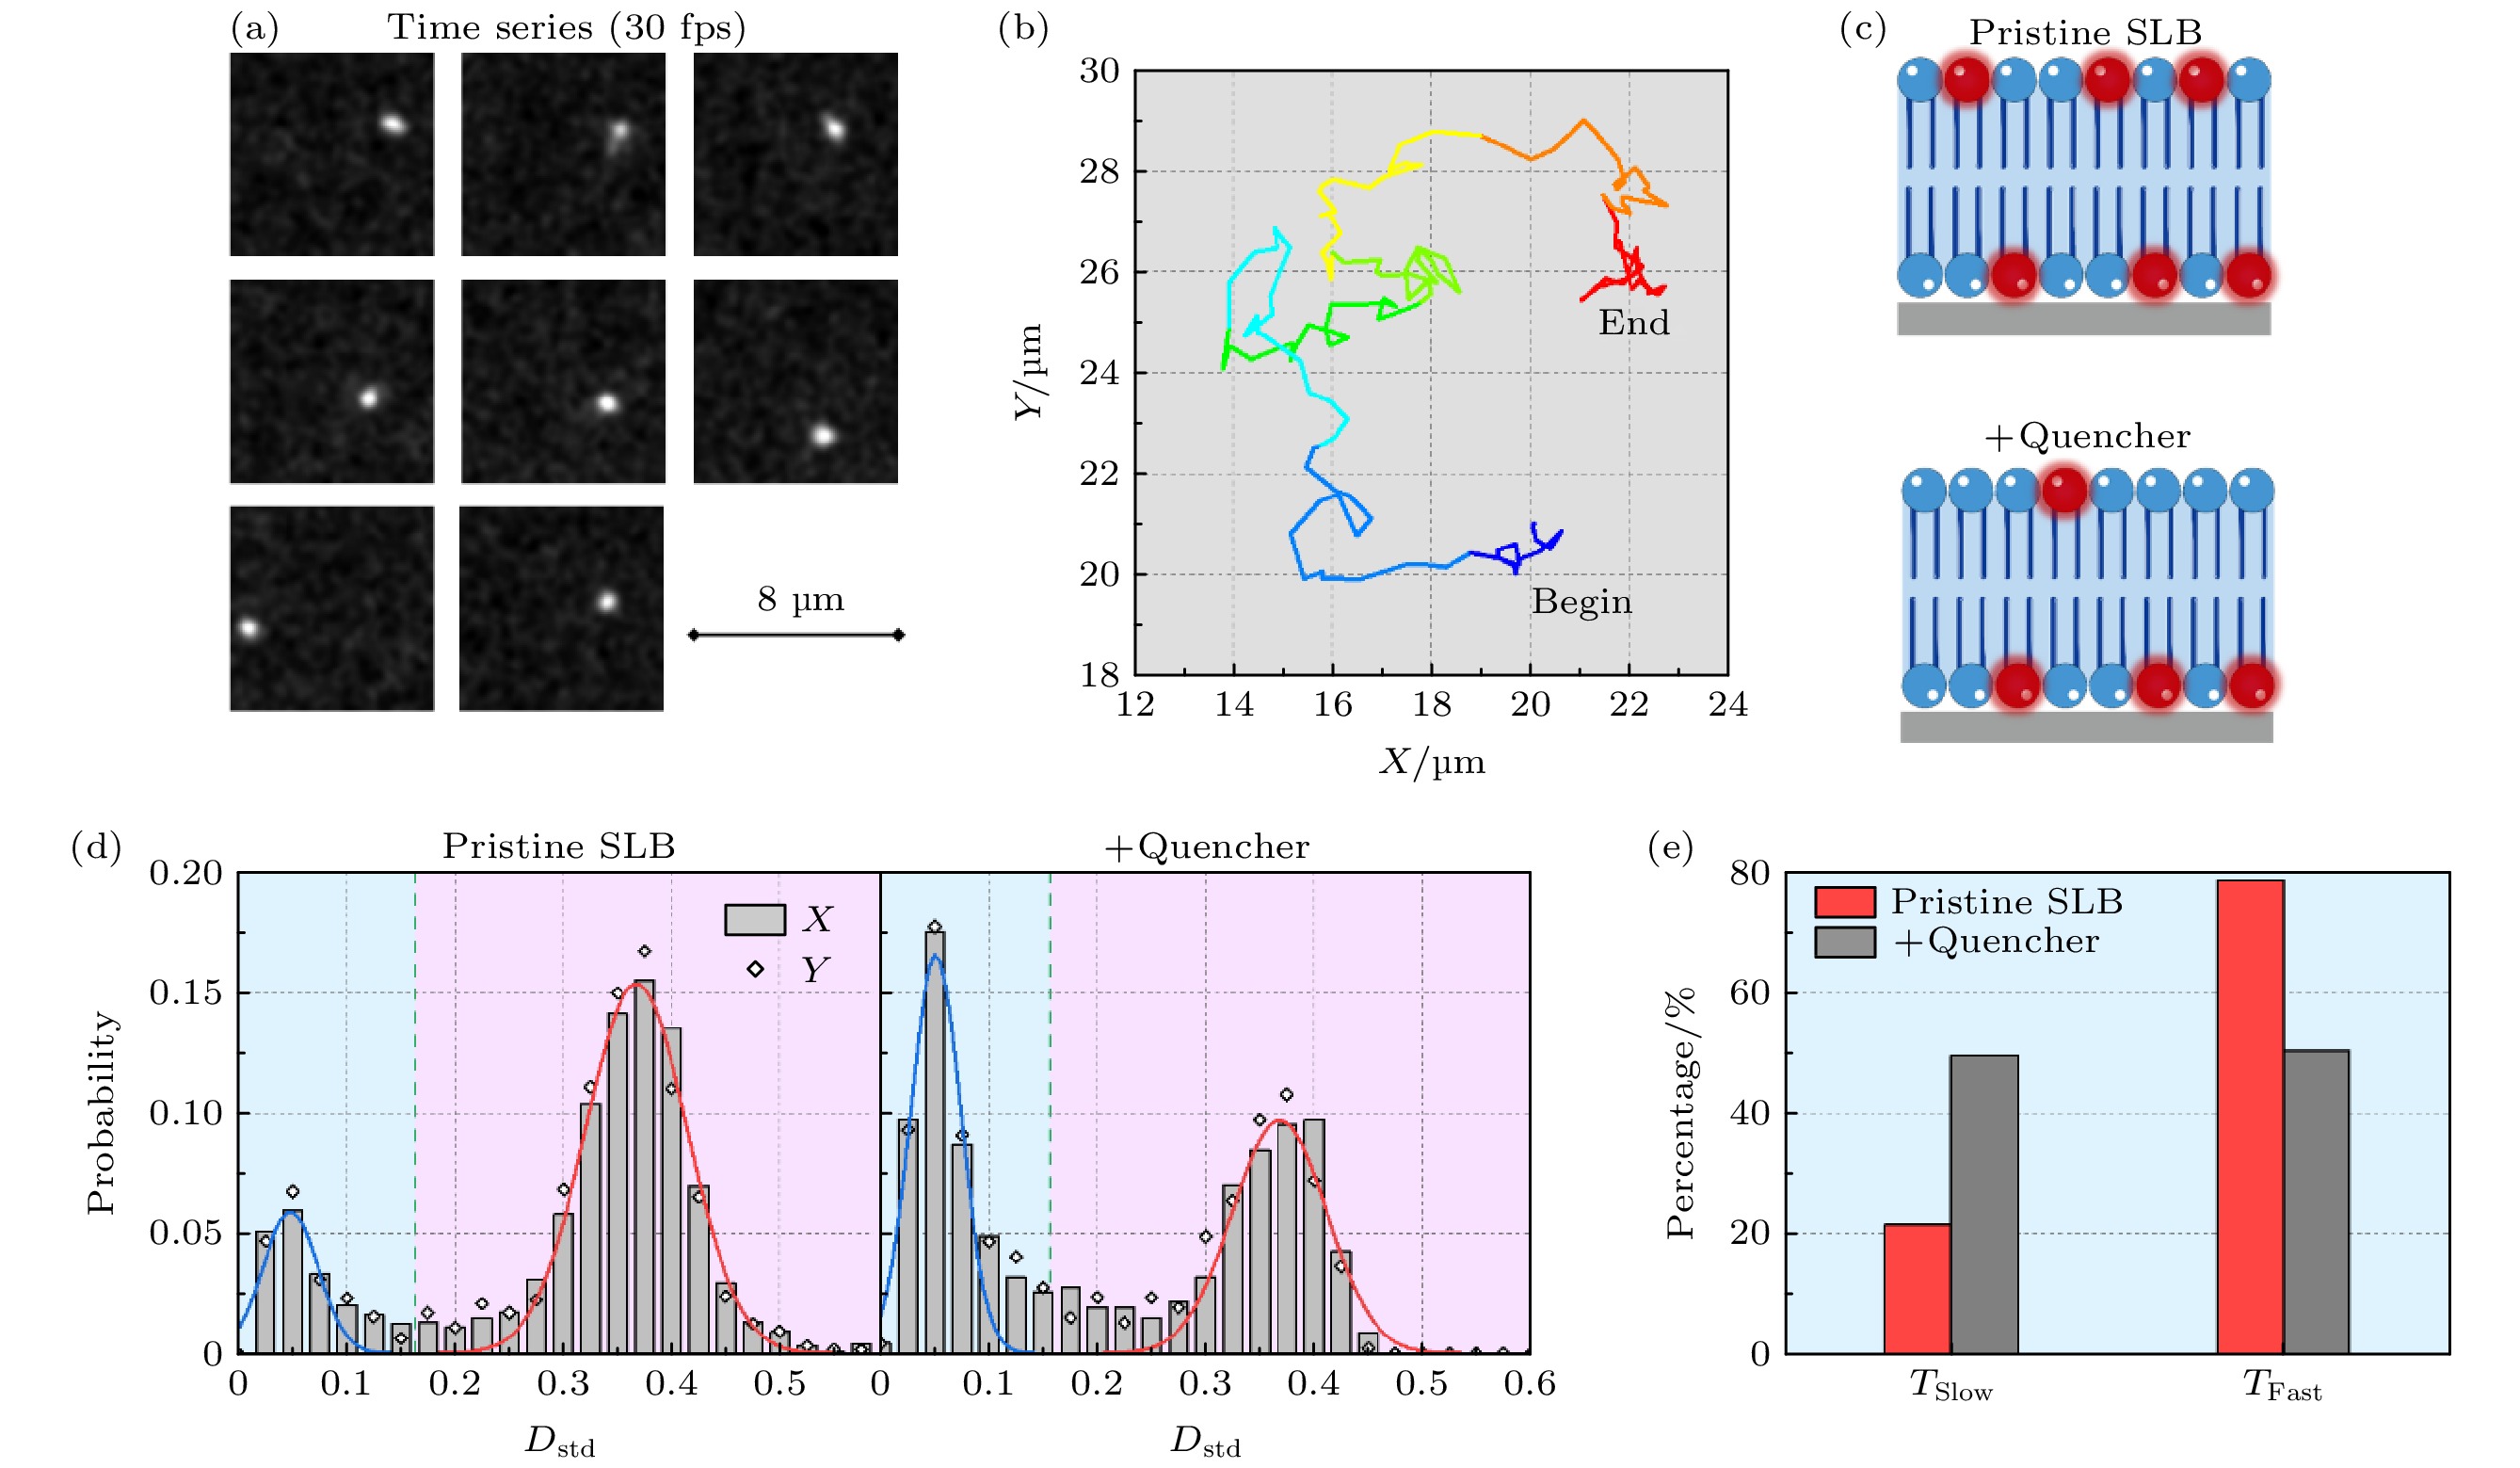 图 3 DOPC支撑脂双层膜内磷脂分子运动轨迹的Dstd的频数分布分析 (a), (b) 典型的单个磷脂分子时间序列荧光成像照片(拍摄速率30 frames/s)及运动轨迹(总时长4.38 s). (c)—(e) 原始以及加入荧光淬灭剂之后的脂膜: (c)示意图; (d)分子轨迹Dstd频数分布情况; (e)


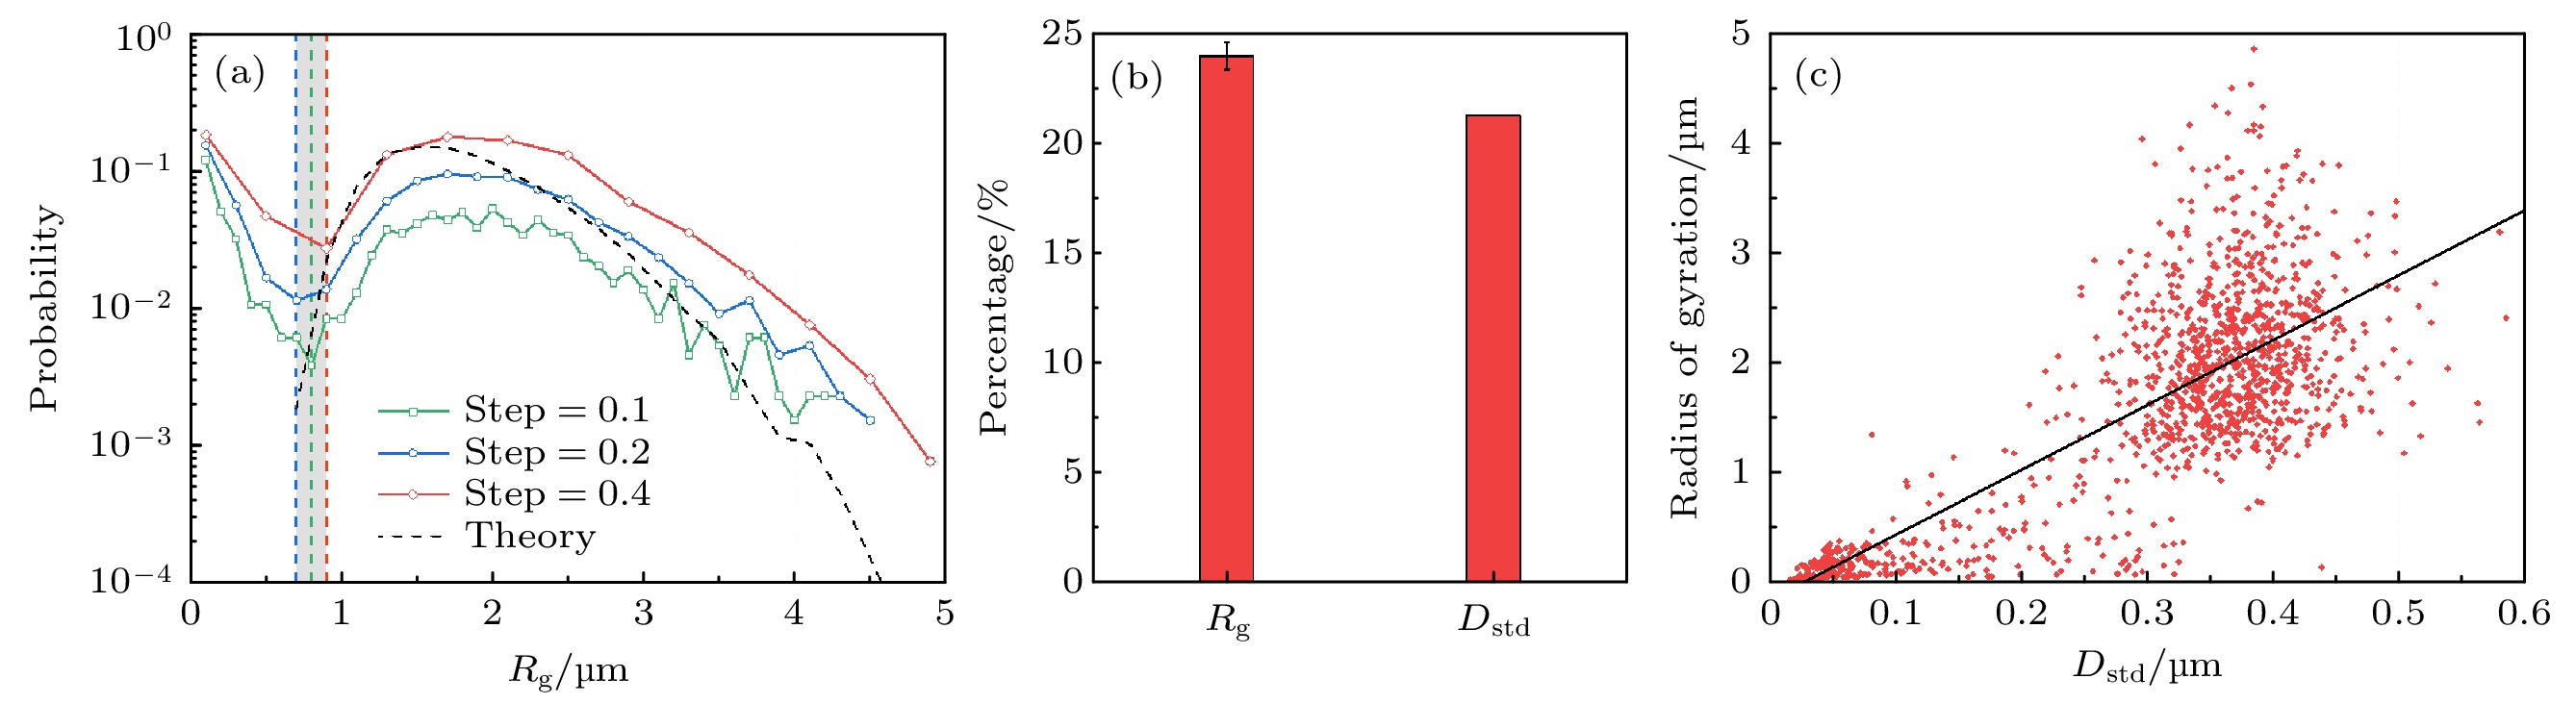 图 A2 原始脂膜内脂分子运动行为的回旋半径PDF分析 (a) 不同步长下的


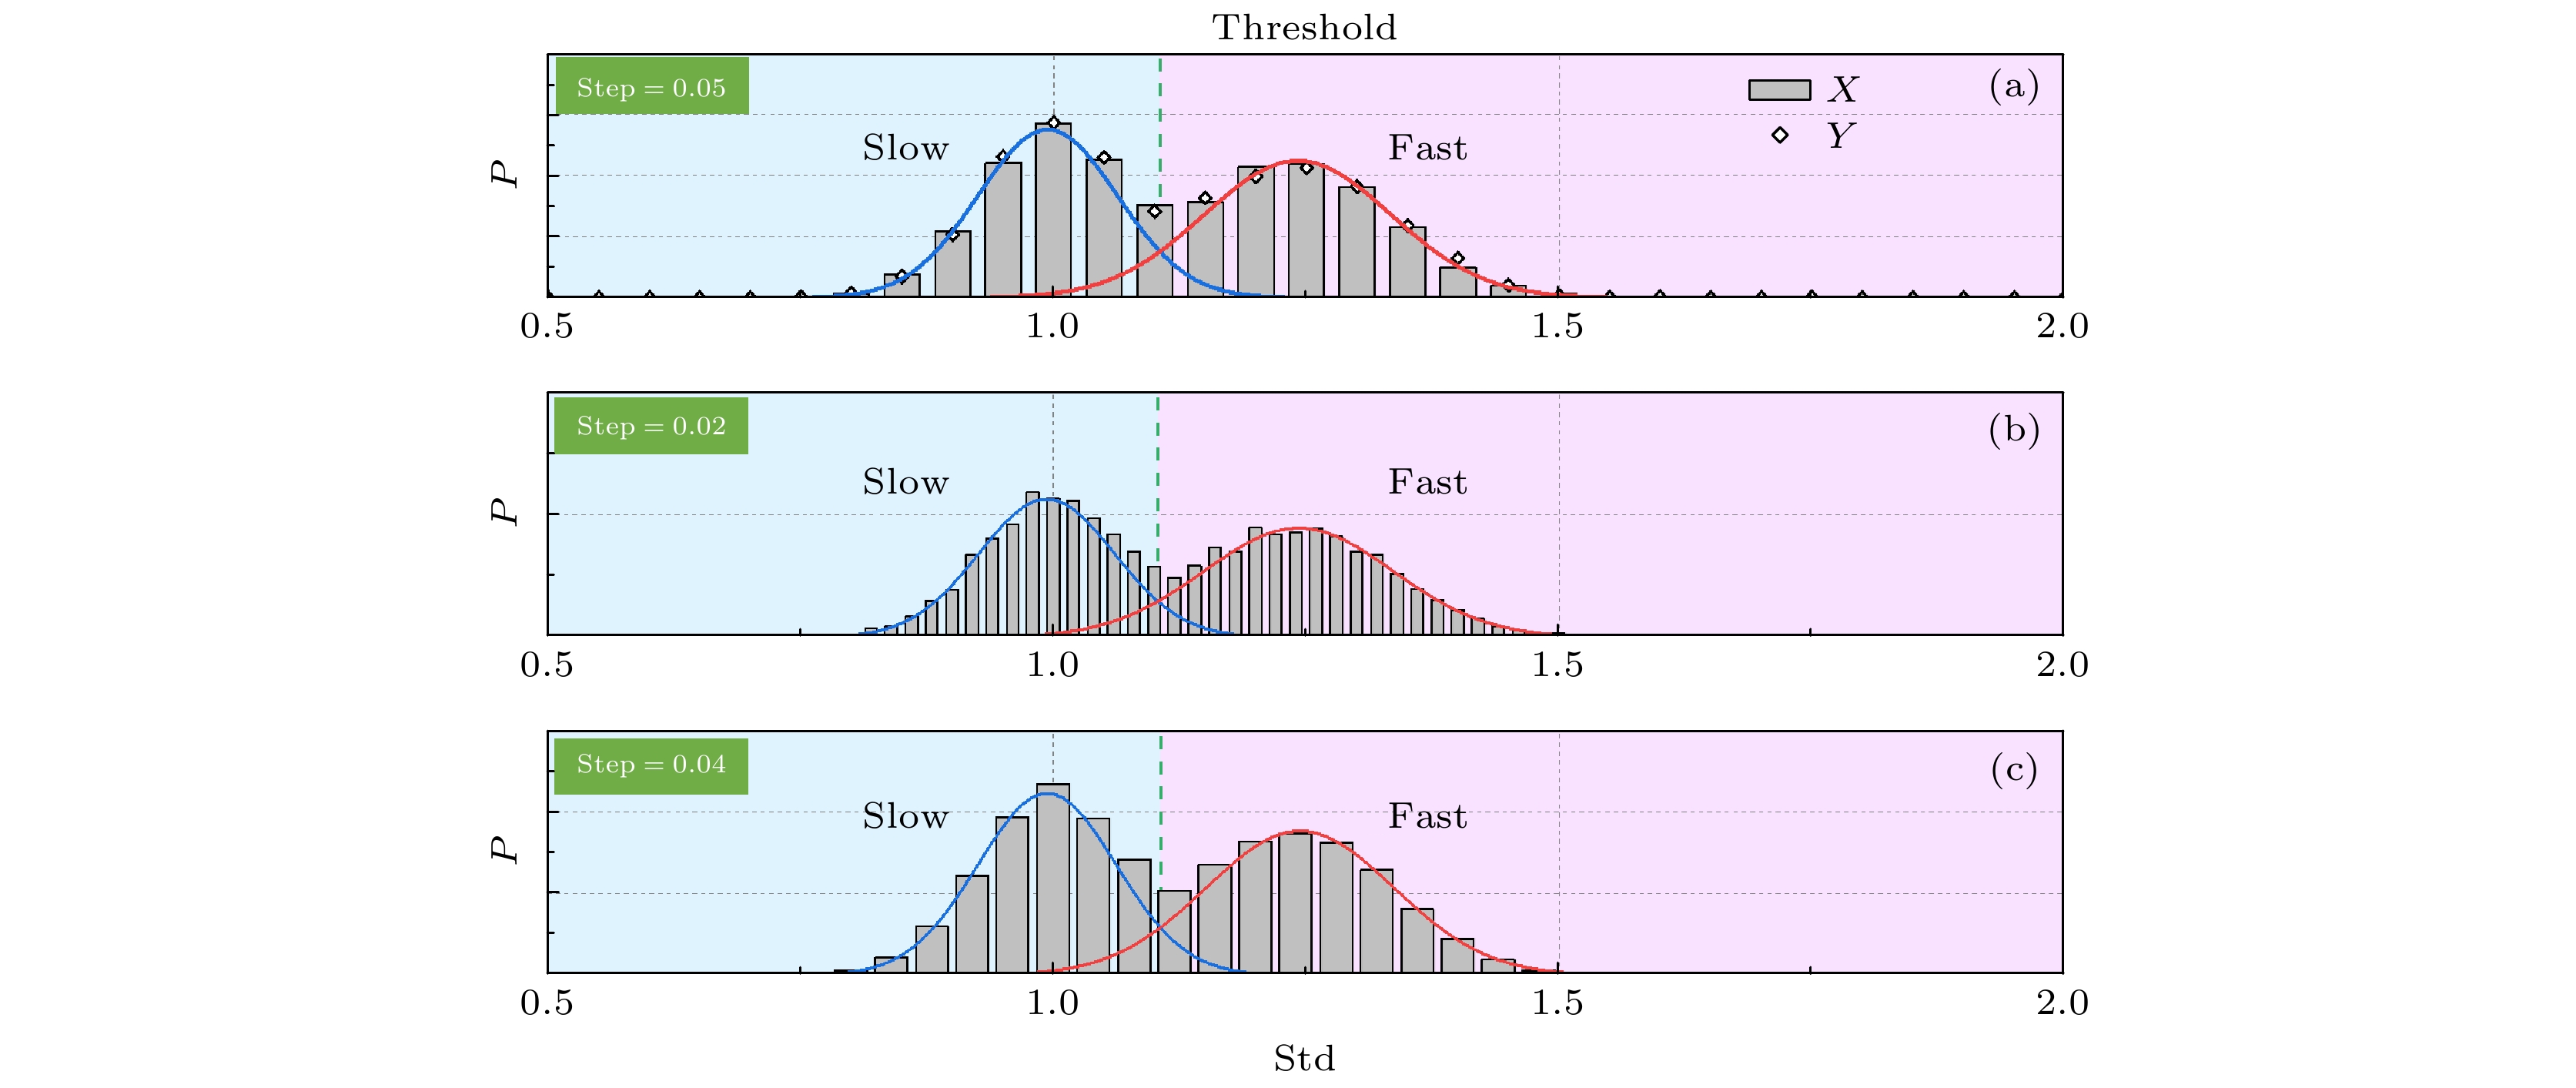 图 A3 不同步长的Dstd的频数分布以及相应的高斯拟合 (a) 步长为0.05; (b) 步长为0.02; (c) 步长为0.04
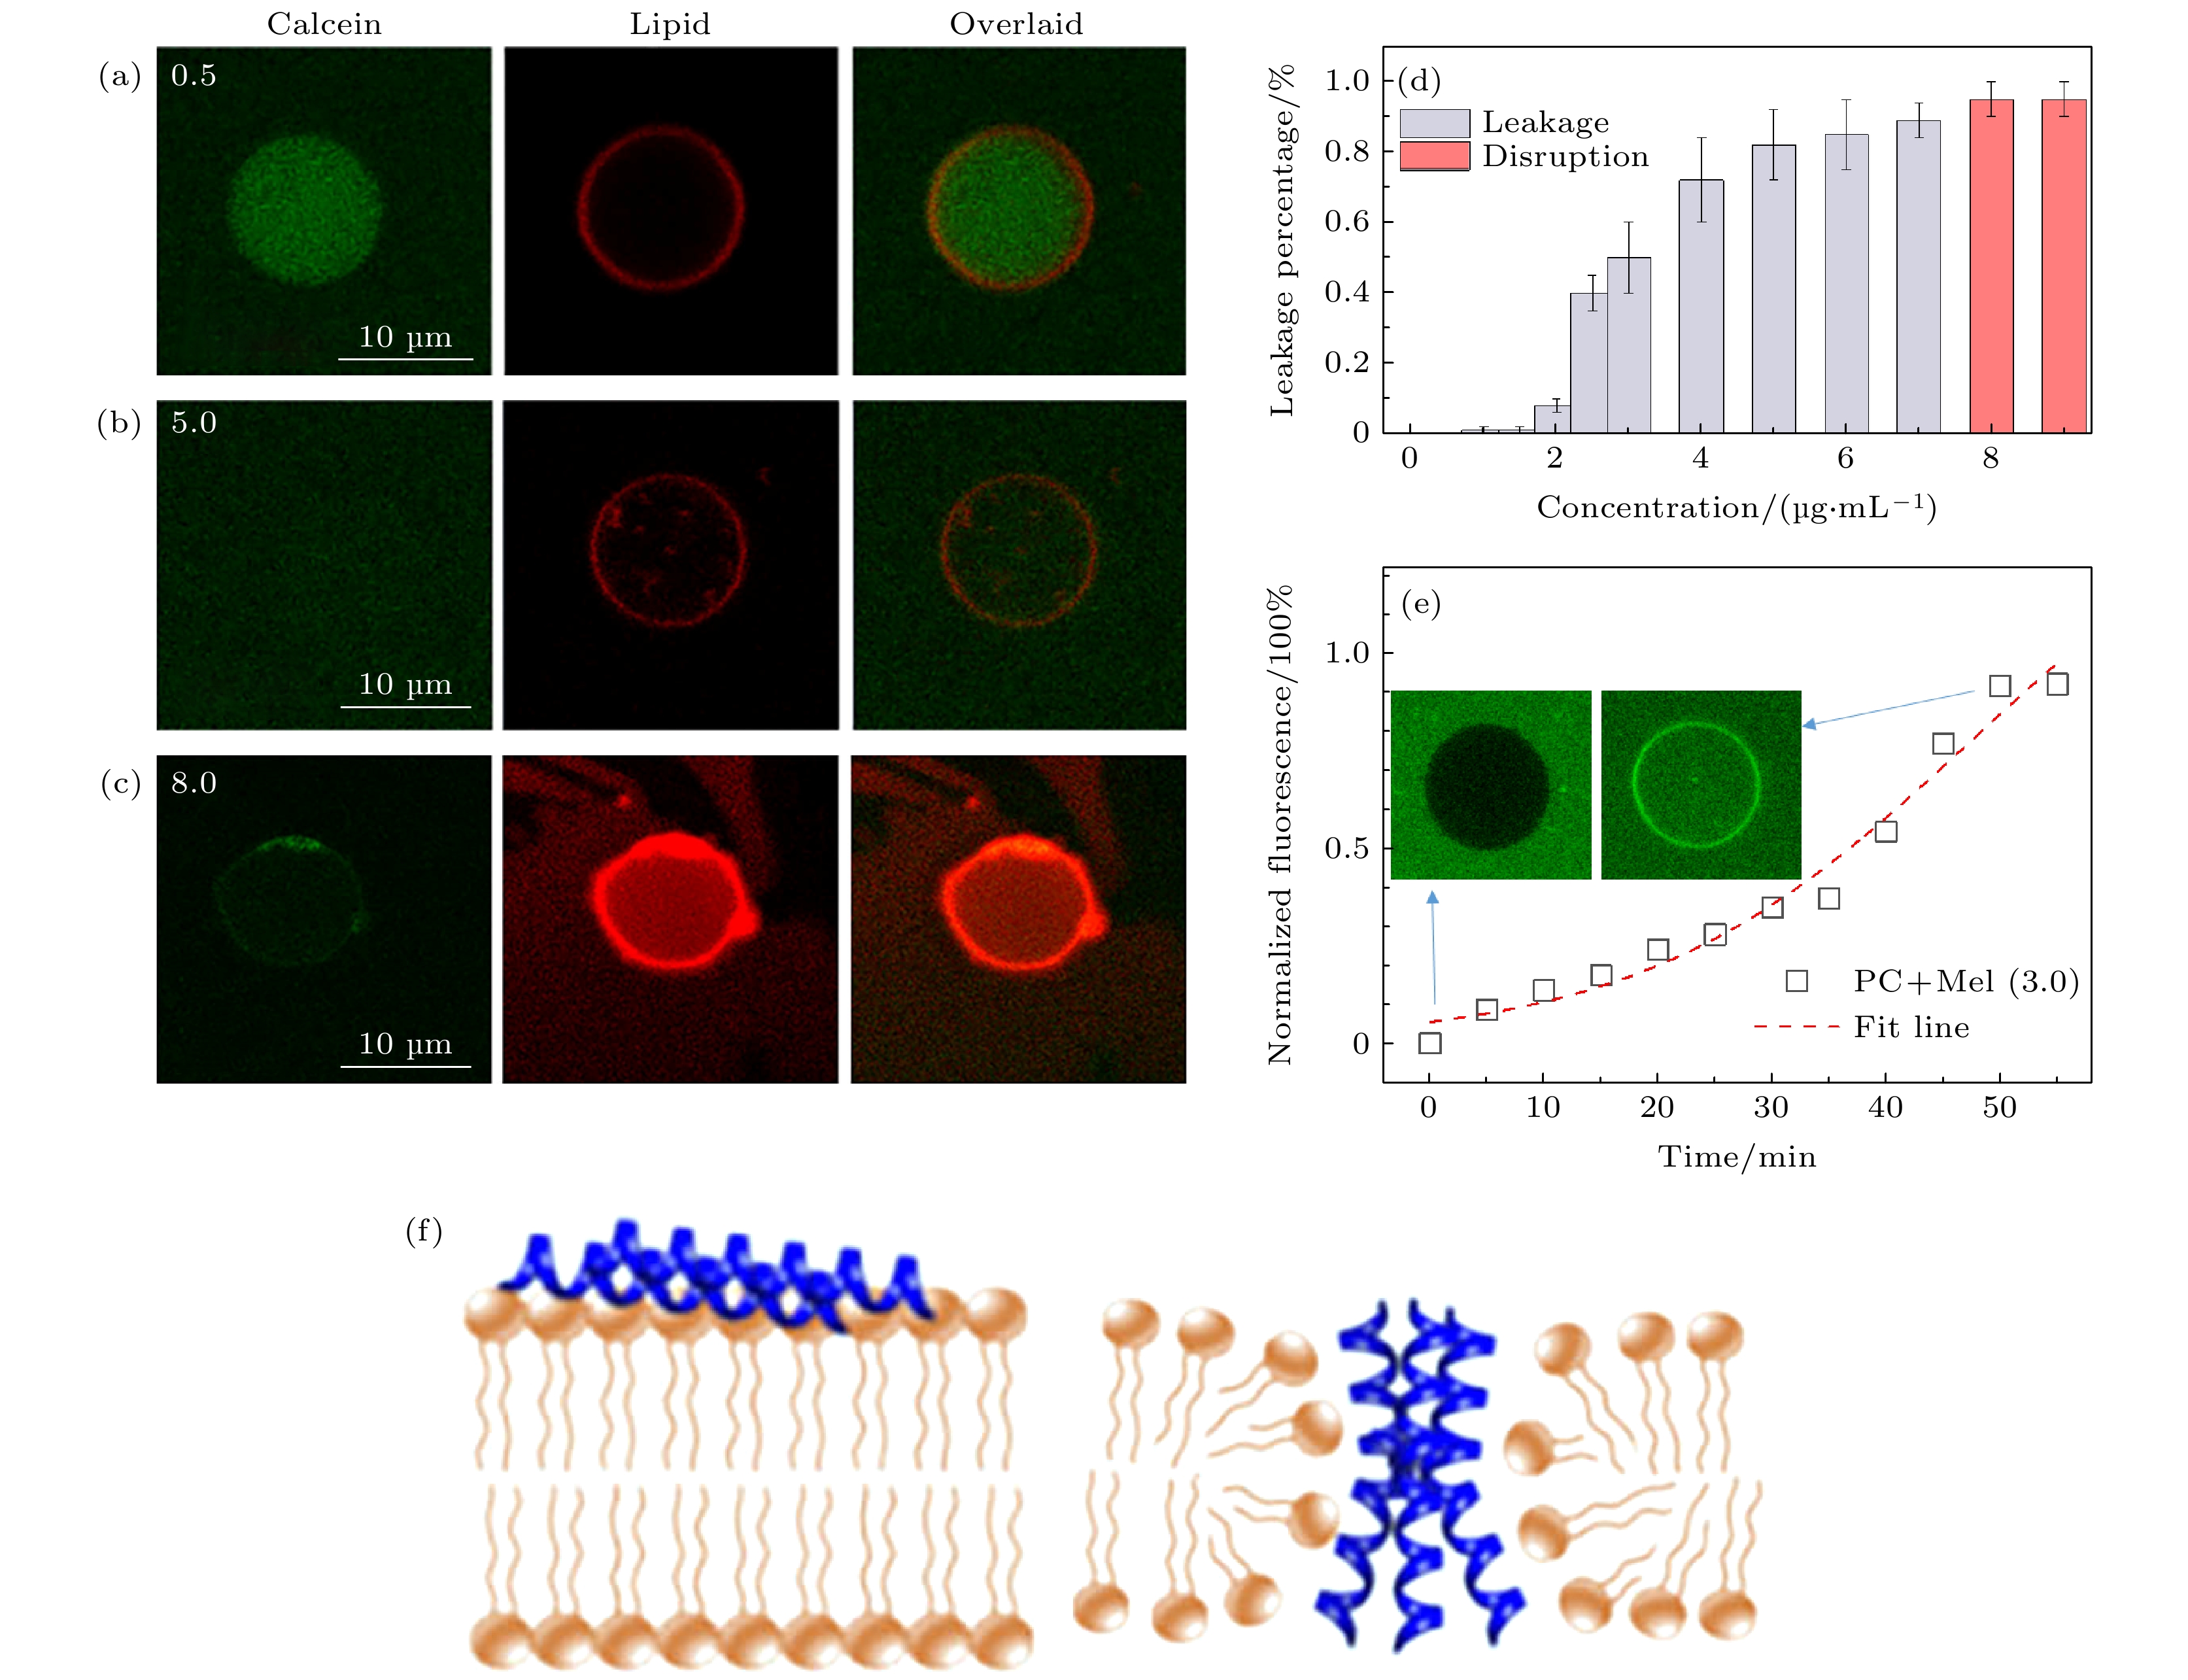 图 A4 不同浓度的蜂毒肽作用下的GUV泄露实验 (a)—(c) 分别在0.5, 5.0以及8 μg/mL的蜂毒肽的作用下的GUV泄露情况, 其中绿色通道为GUV中包裹的钙黄绿素, 红色通道代表GUV所在的轮廓; (d) 0—10 μg/mL各浓度的蜂毒肽对GUV的扰动情况; (e)浓度3 μg/mL蜂毒肽的作用下, 典型的GUV荧光泄露曲线; (f) 低浓度蜂毒肽吸附在脂膜以及高浓度蜂毒肽形成跨膜孔道的示意图


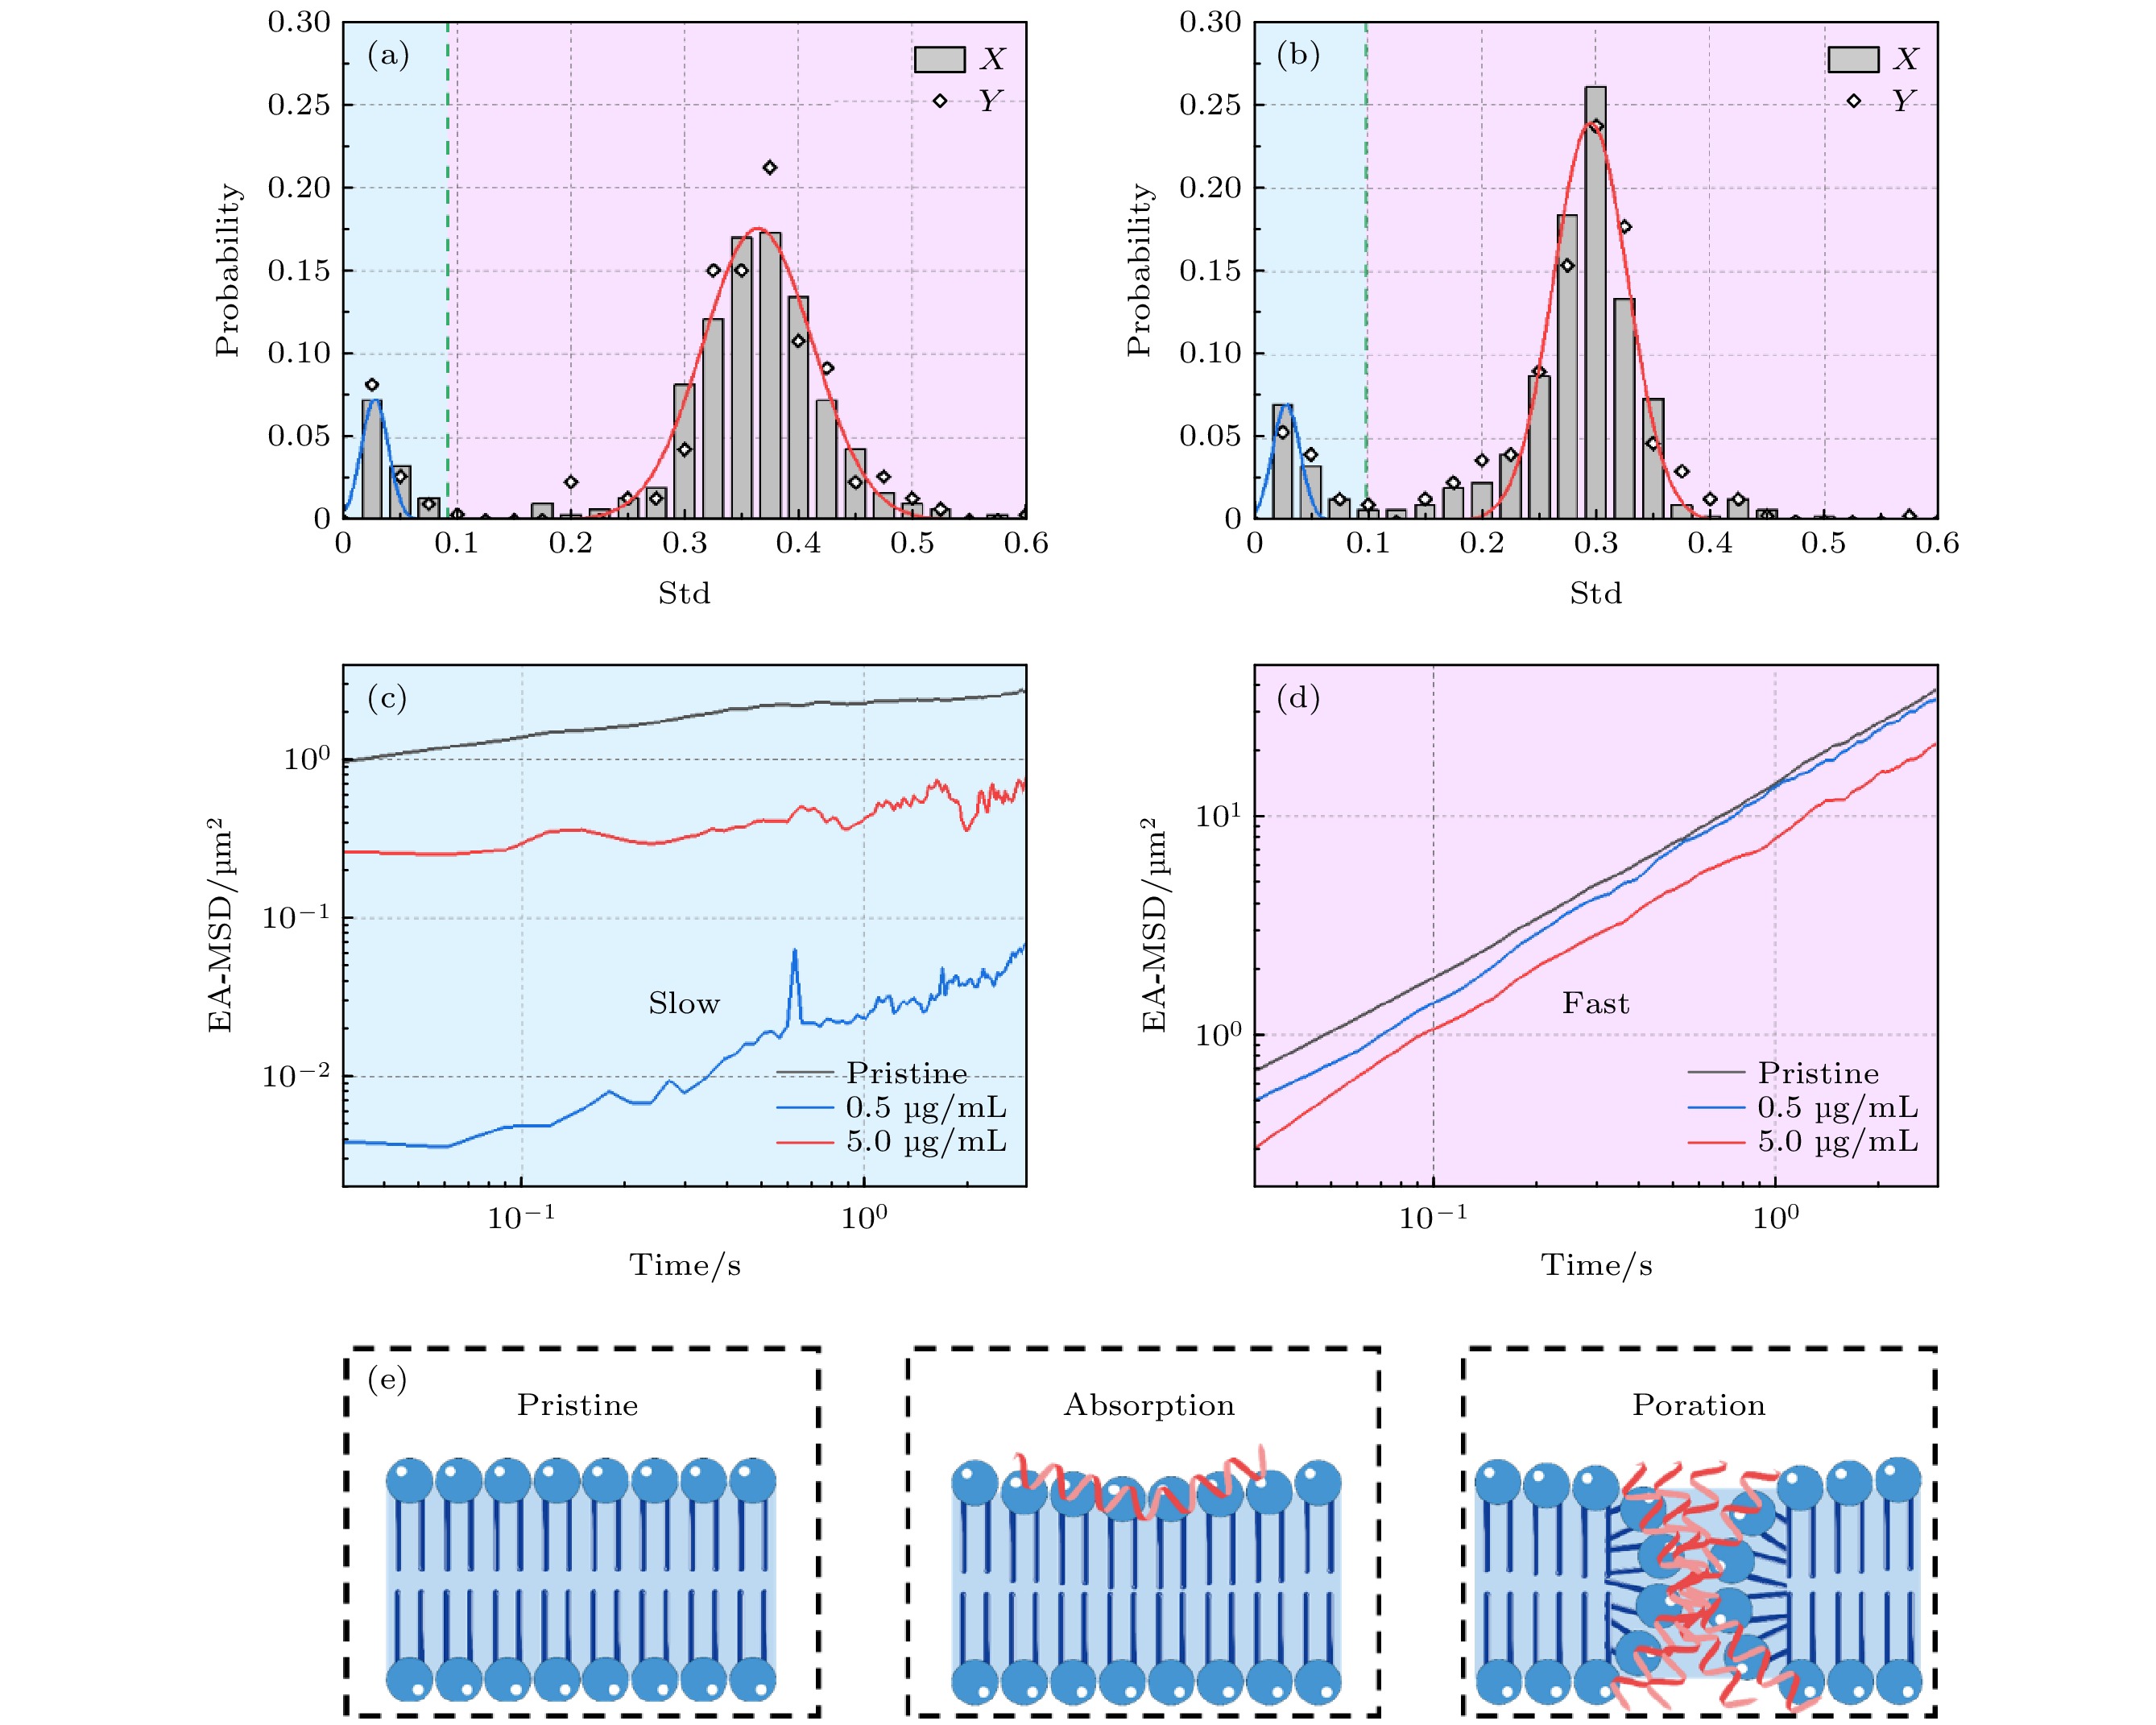 图 4 蜂毒肽作用下的脂分子运动行为分析 (a), (b) 蜂毒肽影响下磷脂分子运动轨迹的Dstd频数分布, 多肽浓度为 (a) 0.5 μg/mL, (b) 5.0 μg/mL; (c), (d) 三种实验体系内


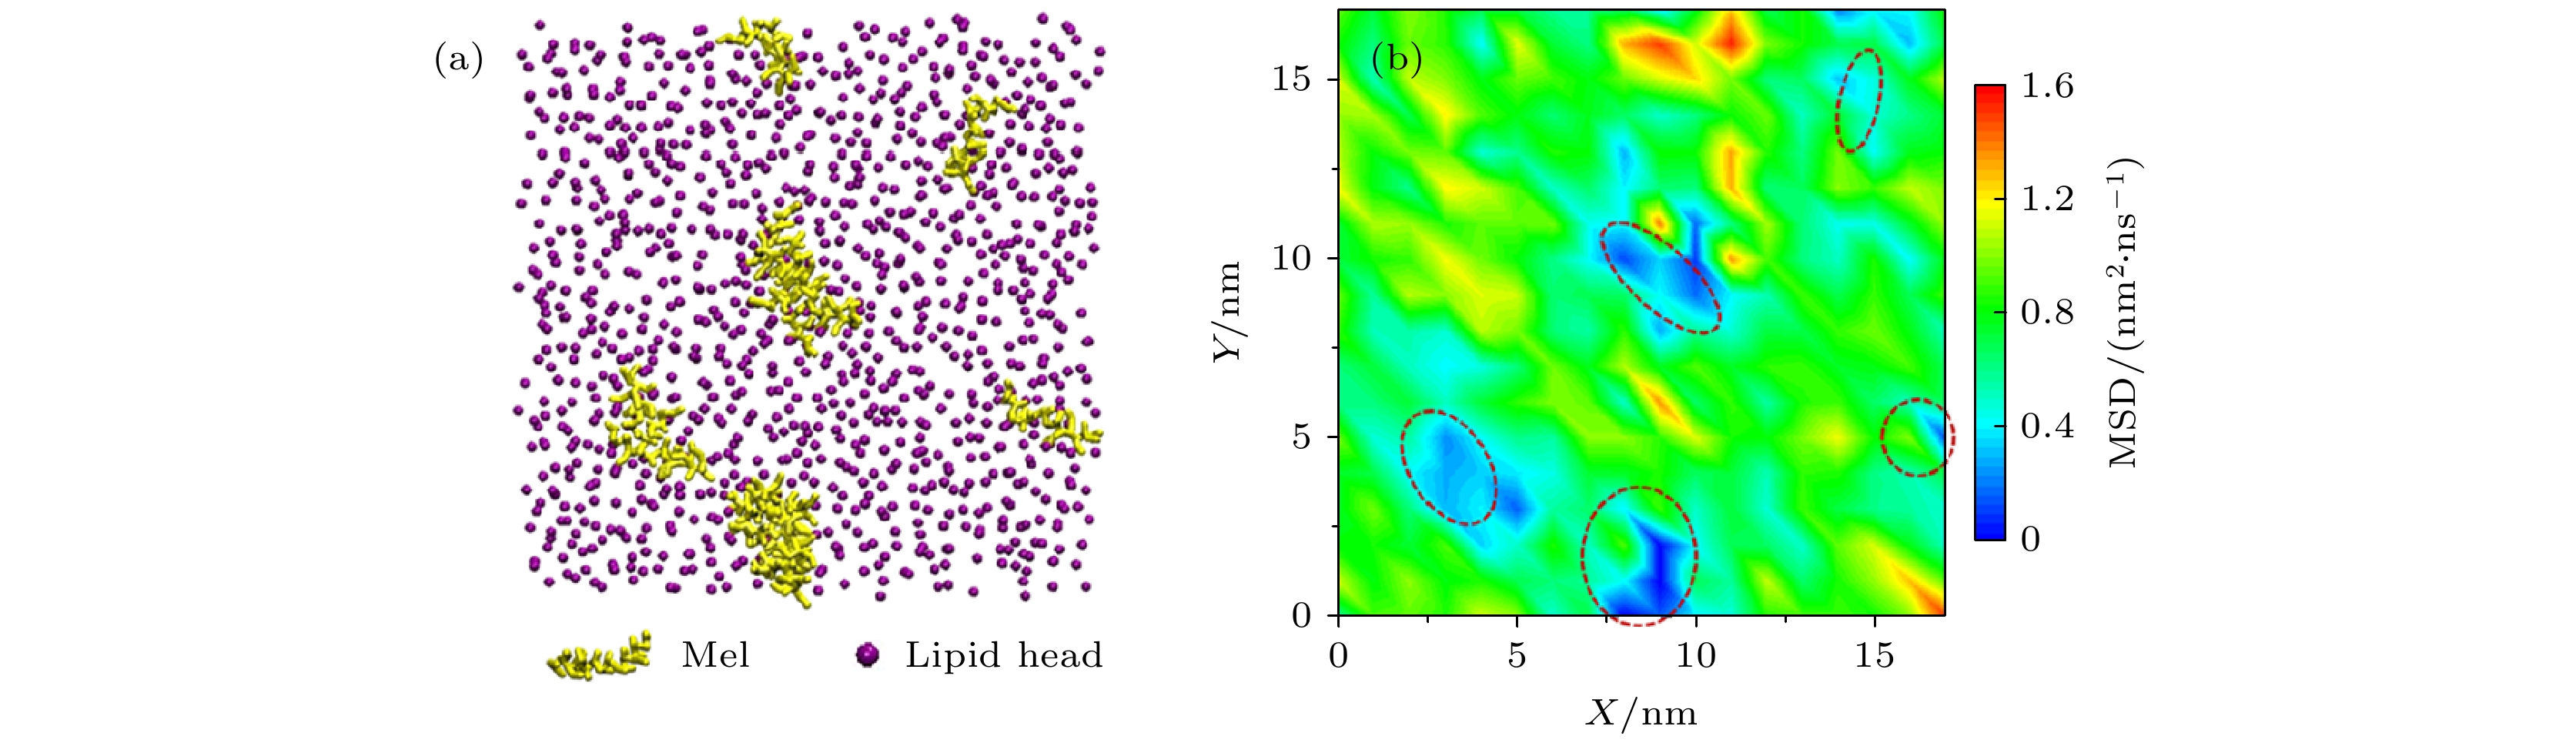 图 A5 分子动力学模拟中蜂毒肽影响下脂分子的扩散情况 (a) 代表性俯视截图, 显示蜂毒肽在脂膜表面的吸附; (b)脂分子的扩散图谱[10]
 图 A1 数值模拟所得的σ = 1的四条代表轨迹


