1.College of Physical Science and Technology, Guangxi Normal University, Guilin 541004, China 2.Guangxi Key Laboratory of Nuclear Physics and Technology, Guilin 541004, China
Fund Project:Project supported by the Joint Funds of the National Natural Science Foundation of China (Grant No. U1867212), the National Natural Science Foundation of China (Grant Nos. 11965003, 11505035, 11675266), the Natural Science Foundation of Guangxi (Grant Nos. 2017GXNSFAA198160, 2017GXNSFGA198001), and the Basic Scientific Research Ability of Young and Middle-aged Teachers in Guangxi Colleges and Universities, China (Grant No. 2019KY0061)
Received Date:19 October 2020
Accepted Date:30 December 2020
Available Online:07 May 2021
Published Online:20 May 2021
Abstract:The reliability and prediction ability of 8 global nuclear mass models is systematically analyzed in terms of the accuracy of the model and the new neutron magic number predicted by experiments based on the ground-state nuclear mass data from AME2016. The root-mean-square (RMS) deviations of nuclear mass predicted by 8 nuclear mass models are calculated by subregion, and find that the Bhagwat and WS4 models possess better accuracy to describe the existing experimental data. By analyzing the trend of the neutron shell energy gap varying with neutron number, it is found that the KTUY, WS3 and WS4 models can well represent the mutation behavior caused by the new magic number N = 32, and it is predicted that N = 32 is likely to be a new magic number in the Cl isotope chain and Ar isotope chain. By analyzing the variation trend of α decay energy in the superheavy region, it is found that the FRDM12, WS3 and WS4 models can reproduce the phenomena of subshell with N = 152 and N = 162 well, and predict the relatively long life of nuclei at the neutron number N = 184 for the isotope chain with proton number Z = 108—114. The comprehensive analysis shows that the mass model with good accuracy cannot reproduce shell evolution behavior. For example, the Bhagwat model has the same accuracy as the WS4 model, but it cannot reproduce the mutation behavior of the new magic number N = 32, 152 and 162. But the KTUY model and FRDM12 model can reproduce the new magic number behavior of N = 32, 152 and 162, respectively, although the RMS deviation is slightly larger. The RMS deviation of WS4 model is small and can describe the shell evolution behavior in the nuclear mass well. Keywords:nuclear mass model/ root-mean-square deviation/ new magic number
表1八个核质量模型的基态质量、单中子分离能、单质子分离能、双中子分离能及双质子分离能的均方根偏差 Table1.Root-mean-square deviations of the ground state mass, single-neutron separation energy, single-proton separation energy, two-neutron separation energy and two-proton separation energy of the 8 nuclear mass models.
为了进一步检验这八个核质量模型对从轻到重体系描述的精度, 我们对实验上已有的基态质量数据($Z, N\geqslant 8$)进行了分区. 类似文献[44-46]中的做法, 主要分成轻核($8\leqslant Z < 28$)、中等-I($28\leqslant Z < 50$)、中等-II($50\leqslant Z < 82$)、重核($82\leqslant $$ Z < 100$)和超重($Z\geqslant 100$)五个区域, 并分别计算了每个模型在这五个区域的均方根偏差, 结果如图1所示. 可以看出, HFB27, WS3和WS4三个模型对从轻核区到超重核区质量描述的均方根偏差逐渐降低, WS3和WS4两个模型在超重区域给出了基本一致的结果; 而DZ31, FRDM12, INM12和Bhagwat四个模型对从轻核区到重核区域质量描述虽然也呈现类似的降低趋势, 但在超重区域的描述均方根偏差却均呈现变大的趋势; KTUY模型相比其他几个模型对五个区域质量描述的均方根偏差较大. 综合对比不难发现WS4模型对现有实验数据的描述是最好的, 其次是Bhagwat模型. 图 1 八个核质量模型对轻核(8 ≤ Z < 28)、中等-I(28 ≤ Z < 50)、中等-II(50 ≤ Z < 82)、重核(82 ≤ Z < 100)以及超重(Z ≥ 100>)五个区域质量描述的均方根偏差 Figure1. Root-mean-square deviations of the mass of light (8 ≤ Z < 28), medium-I (28 ≤ Z < 50), medium-II (50 ≤ Z < 82), heavy (82 ≤ Z < 100), and super-heavy (Z ≥ 100) are calculated by the 8 nuclear mass models.
正如在引言中介绍的, 丰中子核的质量是天体物理研究中r过程的重要输入量[47]. 因此, 核质量模型对质量的描述从稳定线向滴线拓展时其精度的研究是极其重要的. 类似文献[47-49]的做法, 定义了一个远离β稳定线程度的物理量$\varepsilon ={Z}_{0}- $$ Z$, 其中${Z}_{0}=\dfrac{A}{1.98+0.0155{A}^{2/3}}$并就近取整数, 而Z和A分别表示核的电荷数与质量数. $ \varepsilon =0 $代表是β稳定线上的核素; $ \varepsilon <0 $表示缺中子核素, ε越小代表这个核素越靠近质子滴线; 而$ \varepsilon >0 $表示丰中子核素, ε越大代表这个核素越靠近中子滴线. 如图2所示, 呈现了八个核质量模型的理论值与实验值的均方根偏差随 ε 的变化趋势. 可以看出, DZ31, INM12, WS3, WS4以及Bhagwat五个模型计算β稳定线上核素质量的结果与实验值的均方根偏差基本在0.26—0.33 MeV之间, 而HFB27, FRDM12和KTUY三个模型的均方根偏差达到了0.5 MeV或以上. 对于β稳定线左侧(缺中子)区域的描述, HFB27, DZ31, INM12, Bhagwat及WS3五个模型的均方根偏差基本可以达到0.5 MeV以下, 而WS4模型甚至可以达到0.3 MeV以下. 对于β稳定线右侧(丰中子)区域的描述, 模型的均方根偏差几乎都随远离β稳定线而增大, 其中较好的是Bhagwat和WS4两个模型, 其均方根偏差可以控制在0.4 MeV以下. 综合分析图2, 不难发现Bhagwat和WS4两个模型向质子滴线和中子滴线外推结果相对更可靠. 图 2 八个核质量模型的理论值与实验值的均方根偏差随ε的变化趋势 Figure2. Root-mean-square deviation between the predictions of the 8 nuclear mass models and the experimental values varies with the ε.
其中$ {S}_{2{\rm{n}}}\left(N, Z\right)={E}_{{\rm{B}}}\left(N, Z\right)-{E}_{{\rm{B}}}\left(N-2, Z\right) $表示双中子分离能, 而$ {E}_{{\rm{B}}}\left(N, Z\right) $表示原子核的结合能, 可以由模型计算或者实验测量得到. 图3呈现了K, Ca, Sc, Ti和V同位素链的中子壳能隙随中子数的变化趋势, 其结合能由实验上测出的核质量计算得到. 首先可以在图3中看到, K, Ca和Sc三条同位素链的中子壳能隙在传统幻数$ N=20 $的地方出现了明显的突起, 其数值可以达到7—9 MeV. 对于幻数$ N=28 $而言, 五条同位素链的中子壳能隙均出现了明显的突起, 但是峰值的高度明显低于$ N=20 $处的高度. 此外可以明显地看到Ca和Sc两条同位素链在$ N=32 $处也形成了显著的突起, 而在Ti和V同位素链中逐渐消失, 文献[5, 6]基于实验数据计算得到的双中子分离能随中子数的变化趋势确认了$ N=32 $在K同位素链中也属于新幻数, 因此可以确认在K, Ca和Sc三条同位素链中$ N=32 $属于新的幻数, 而从Ti同位素链开始逐渐消失. 图 3 K, Ca, Sc, Ti和V同位素链的中子壳能隙随中子数的变化趋势 Figure3. Variation trend of neutron shell gaps in K, Ca, Sc, Ti and V isotope chains with neutron number.
基于在K, Ca和Sc三条同位素链中出现的新幻数$ N=32 $可以进一步检验核质量模型的可靠性. 图4给出了基于八个核质量模型计算的K, Ca, Sc, Ti和V同位素链的中子壳能隙随中子数的变化趋势. 从图4可以看出, 八个模型对于传统幻数$ N=28 $几乎都可以较好的再现, 而对于传统幻数$ N=50 $而言Bhagwat, DZ31, FRDM12, WS3及WS4五个模型的预言都出现了较明显的突起, 其他三个模型突起的行为较为混乱或消失. 对于K, Ca和Sc同位素链中出现的新幻数$ N=32 $而言, 只有KTUY, WS3和WS4三个模型能够较好地再现, 但是WS3和WS4两个模型对于新幻数$ N= $$ 32 $在Ti同位素链中的变弱行为并没有很好地再现. 图 4 八个核质量模型计算的K, Ca, Sc, Ti和V同位素链的中子壳能隙随中子数的变化趋势 Figure4. Neutron shell gaps of K, Ca, Sc, Ti and V isotopic chains calculated by 8 nuclear mass models vary with the neutron number
基于基态核质量的实验数据不难判断新幻数$ N=32 $从Ti同位素链开始变弱, 在V同位素链中基本消失, 那么新幻数$ N=32 $是否从K同位素链开始? 为此在图5中给出了Cl和Ar同位素链中子壳能隙随中子数的变化趋势. 可以看出, Cl和Ar同位素链的中子壳能隙的实验测量值虽然没有触及到中子数$ N=32 $, 但基于AME2016质量表发布的评估值及KTUY, WS3和WS4三个模型预言的核质量结果计算得到的Cl和Ar同位素链的中子壳能隙在中子数$ N=32 $处存在明显的突起行为, 这预示着在Cl和Ar同位素链中$ N=32 $也极有可能是新的幻数. 因此, 实验测量Cl和Ar同位素链中这一区域的原子核质量对于鉴别$ N=32 $中子壳尤为重要. 同样对于传统幻数$ N=20 $在图5的两条同位素链中没有看到明显的突起行为, 基本可以认为$ N=20 $这一传统幻数在Cl和Ar同位素链中消失; 对于在中子数$ N=14 $处, KTUY, WS和WS4三个理论模型同时预言出现了较高的突起行为, 这说明$ N=14 $在Cl和Ar同位素链中可能为新的幻数, 这些现象可能预示着中子闭壳效应受同位旋不对称度的影响. 在Ar同位素链中, $ N=18 $处可以看到更高的突起行为, 这可能是由于质子数与中子数相等导致36Ar存在更稳定的结构. 图 5 Cl和Ar同位素链中子壳能隙随中子数的变化趋势, 竖线表示误差 Figure5. Variation trend of neutron shell gaps of Cl and Ar isotope chains with neutron number, the vertical bar represents the error.
其中α粒子的结合能$ {E}_{{\rm{B}}}\left({2, 2}\right)=-28.296\;{\rm{MeV}} $, 取自文献[29]. 图6给出了质子数$ Z=100-110 $为偶数同位素链的α衰变能随中子数的变化趋势, 数据来自核质量表AME2016. 从图6可以看出, 在中子数$ N=152 $和162两个子壳位置α衰变能出现了明显的低洼现象, 因此可以通过α衰变能进一步检验核质量模型, 看其能否再现超重区域的壳演化趋势. 图7给出了八个核质量模型计算的质子数$ Z=100-110 $为偶数同位素链的α衰变能随中子数的变化趋势, 可以看出, 只有FRDM12, WS3和WS4三个模型可以再现子壳$ N=152 $和162的低洼趋势, 而FRDM12和KTUY两个模型预言在中子数$ N=184 $处出现了明显低洼现象, 且α衰变能都小于8 MeV. 从图7(g)和图7(h)可以看到WS3和WS4两个模型给出的α衰变能随中子数的变化趋势基本一致, 而预言中子数$ N=184 $的低洼现象是从质子数$ Z=108 $处才开始呈现, 这与FRDM12和KTUY两个模型的结果有明显的不同. 图 6 质子数$ Z=100-110 $为偶数同位素链的α衰变能随中子数的变化趋势 Figure6. Alpha decay energy of even isotope chains for the proton number $ Z=100-110 $ vary with the neutron number.
图 7 八个核质量模型计算的质子数$ Z=100-110 $为偶数同位素链的α衰变能随中子数的变化趋势 Figure7. Alpha decay energy of even isotope chains for the proton number Z = 100-110 calculated by 8 nuclear mass models vary with the neutron number.
此外, 图8也给出了FRDM12和WS4两个模型预言的质子数$ Z=112-124 $为偶数同位素链的α衰变能随中子数的变化趋势, 图中较大的黑色实心圆点表示$ Z=112, 114, 116 $和118同位素链的α衰变能, 数值取自核质量表AME2016. 从图8可以看出, WS4模型的结果比FRDM12模型更接近AME2016给出的值, 并且发现$ N=152 $和162的子壳现象到了$ Z=114 $附近慢慢消失. 对于理论预言的中子幻数$ N=184 $处两个模型呈现出了相似的结果, 就是到了$ Z=114 $之后的同位素链的α衰变能在$ N=184 $处都大于8 MeV, 而对于$ Z=108-114 $同位素链的α衰变能在$ N=184 $附近都在8 MeV左右, 这可能预示虽然$ N=184 $对于$ Z>114 $的同位素链仍属于幻数, 但是这部分核素的寿命应该比$ Z=108-114 $同位素链在$ N=184 $附近的核素寿命短. 图 8 FRDM12和WS4模型计算的质子数$Z=112- $$ 124$为偶数同位素链的α衰变能随中子数的变化趋势, 竖线表示误差 Figure8. Alpha decay energy of even isotope chains for the proton number Z = 100–110 calculated by the FRDM12 and WS4 models vary with the neutron number, the vertical bar represents the error.


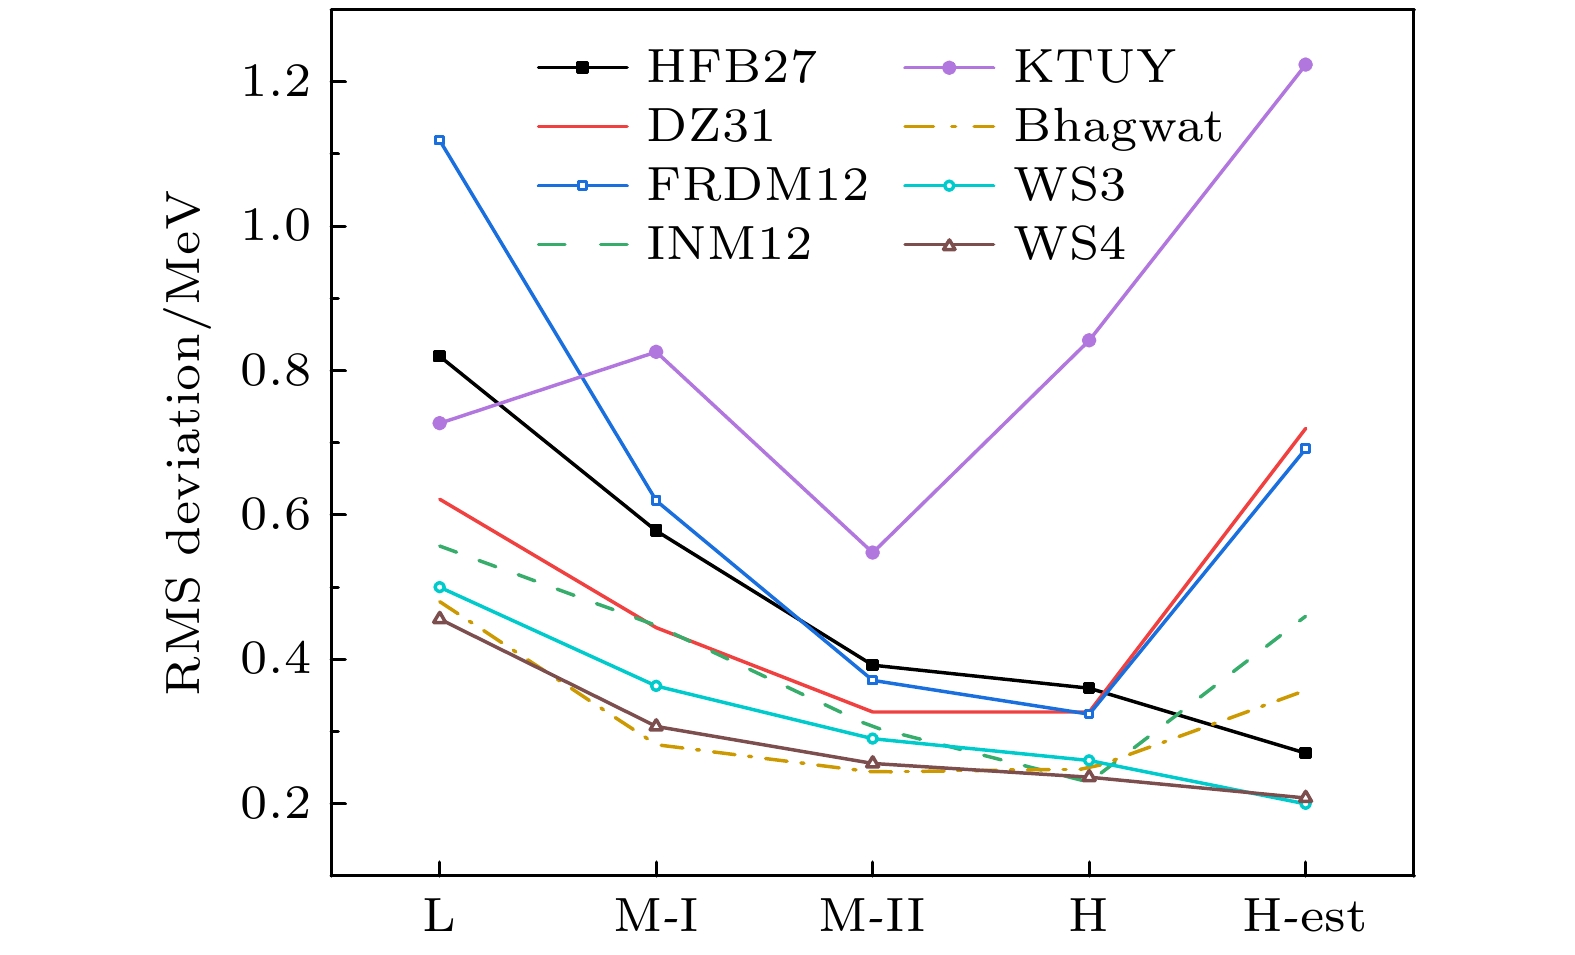 图 1 八个核质量模型对轻核(8 ≤ Z < 28)、中等-I(28 ≤ Z < 50)、中等-II(50 ≤ Z < 82)、重核(82 ≤ Z < 100)以及超重(Z ≥ 100>)五个区域质量描述的均方根偏差


 图 2 八个核质量模型的理论值与实验值的均方根偏差随ε的变化趋势


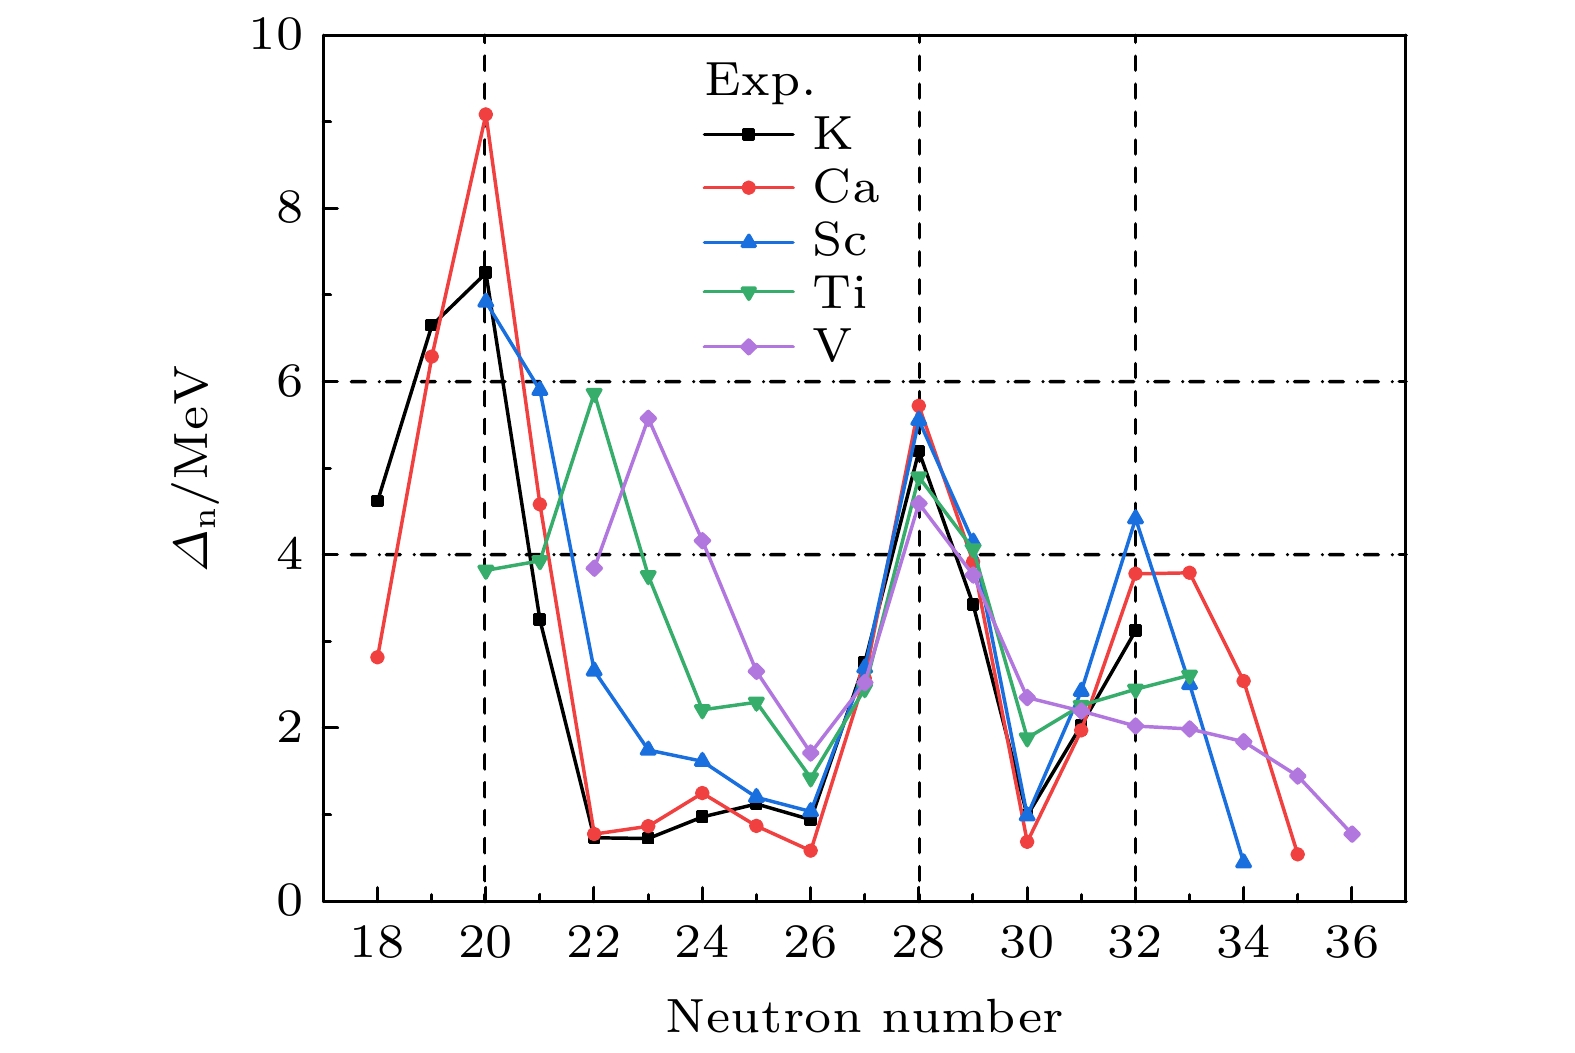 图 3 K, Ca, Sc, Ti和V同位素链的中子壳能隙随中子数的变化趋势


 图 4 八个核质量模型计算的K, Ca, Sc, Ti和V同位素链的中子壳能隙随中子数的变化趋势


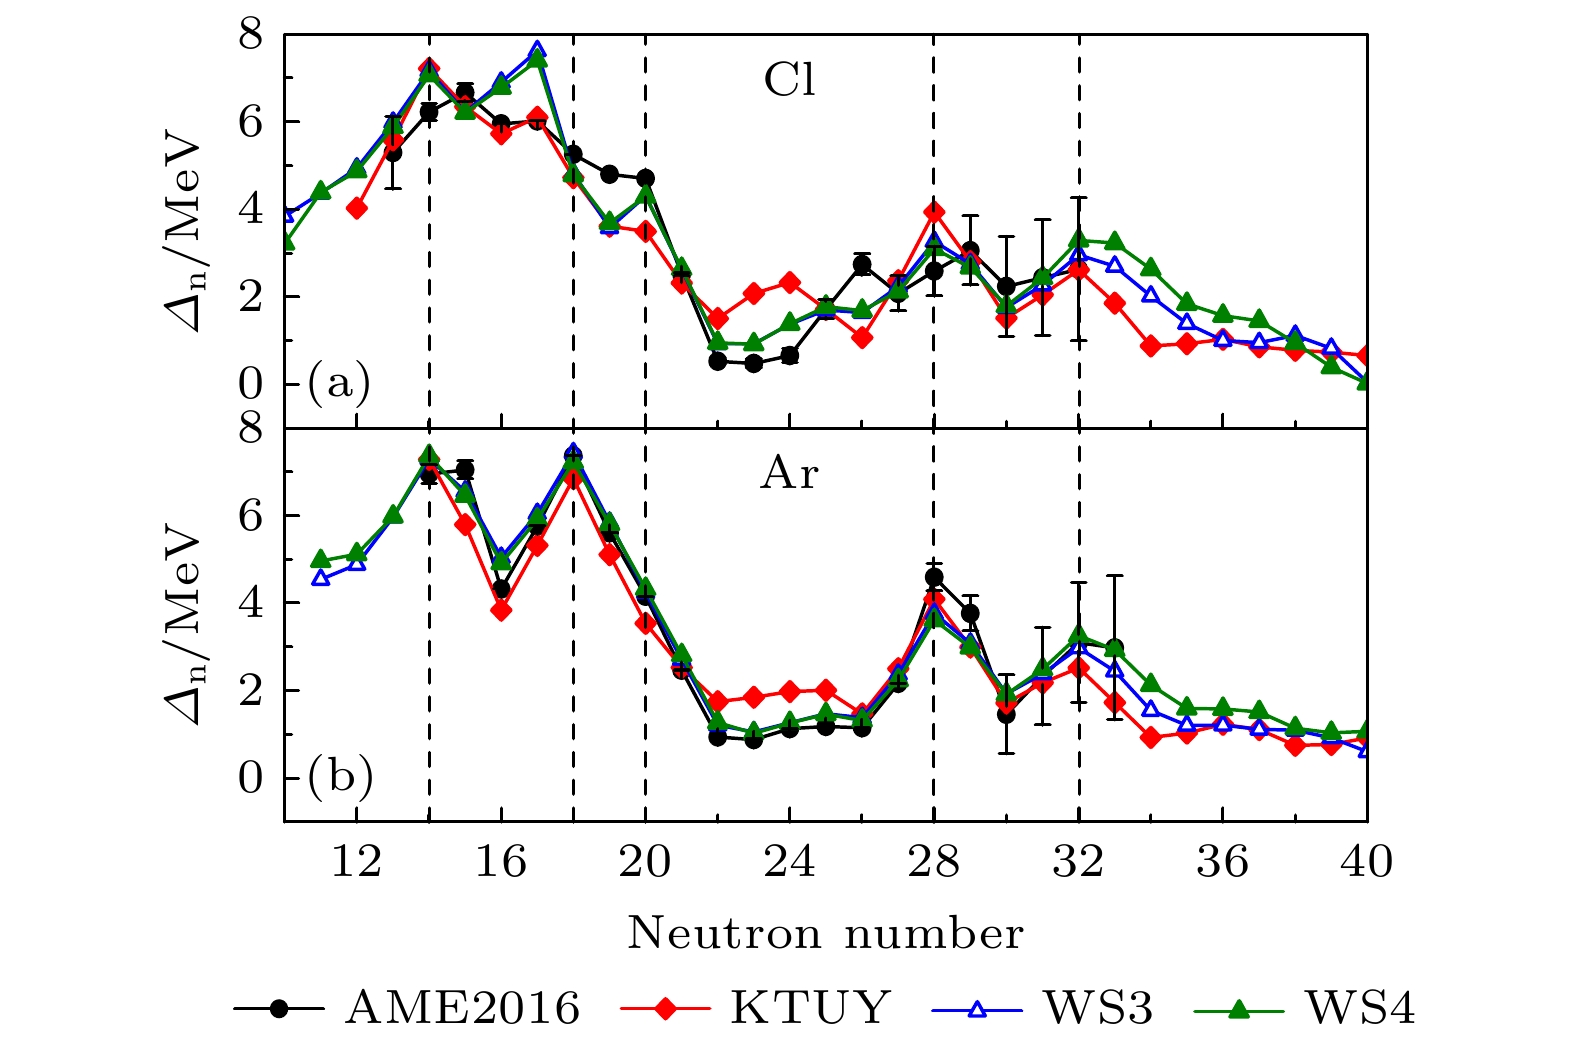 图 5 Cl和Ar同位素链中子壳能隙随中子数的变化趋势, 竖线表示误差


 图 6 质子数

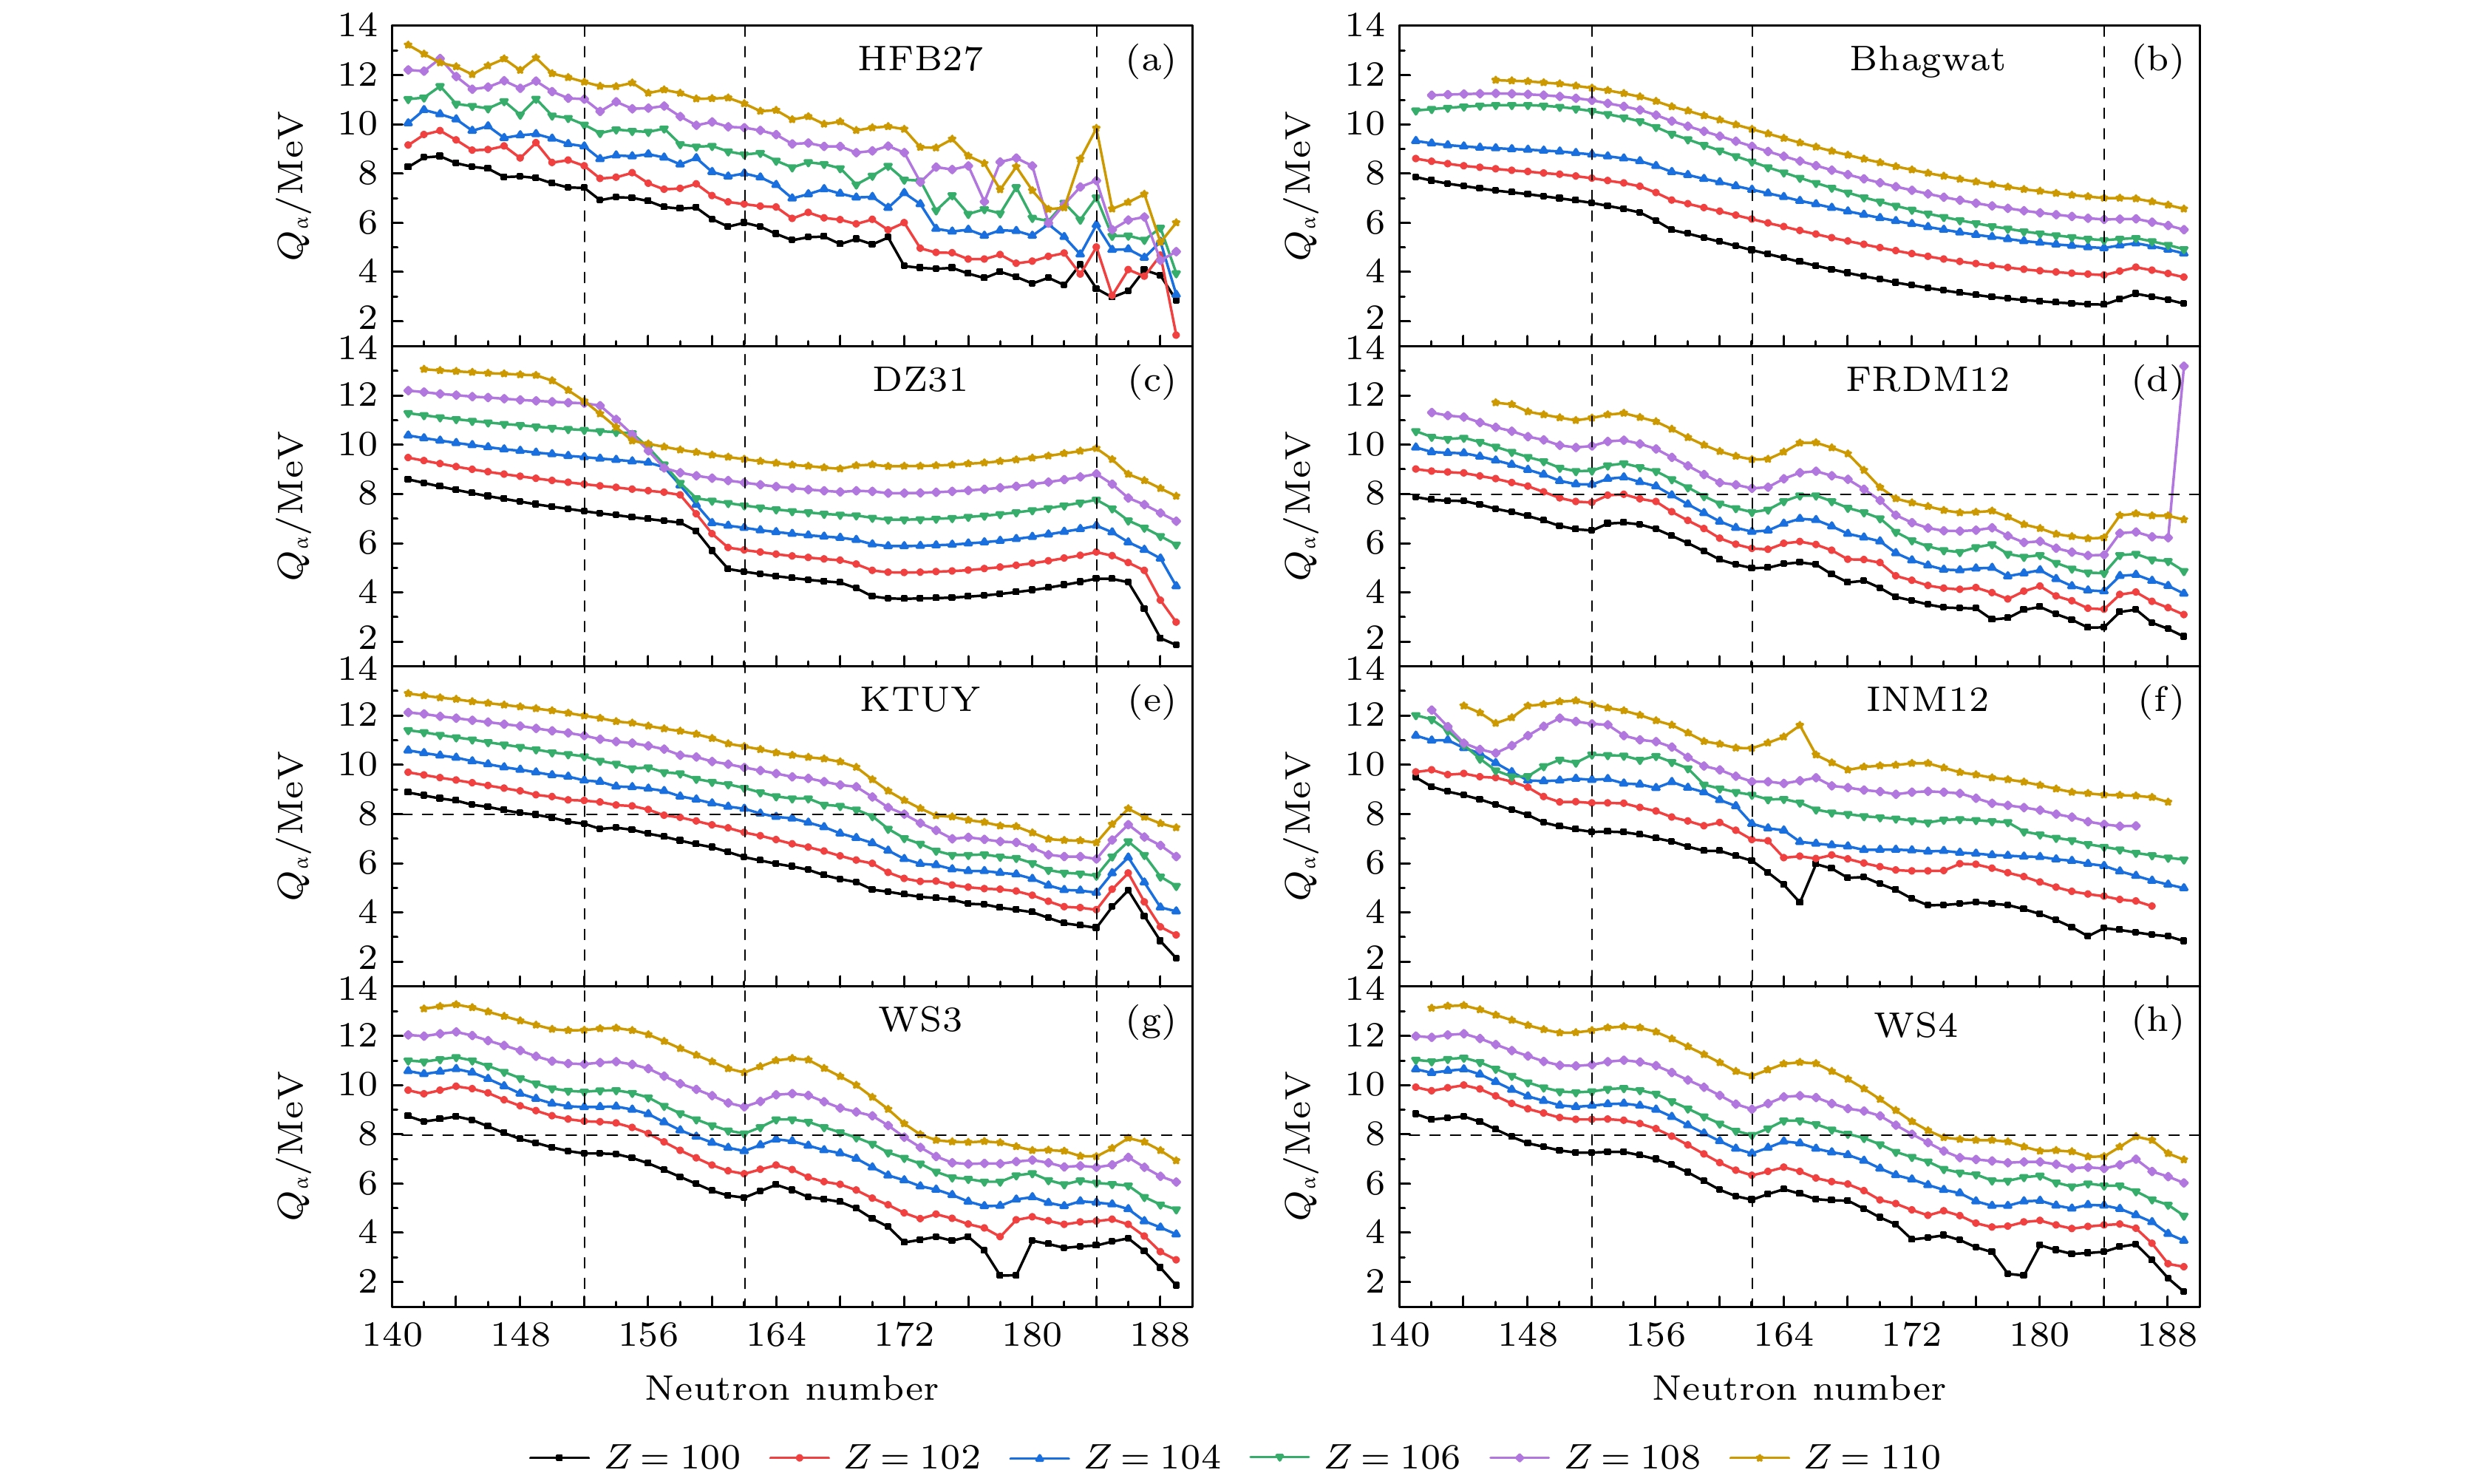 图 7 八个核质量模型计算的质子数


 图 8 FRDM12和WS4模型计算的质子数


