Fund Project:Project supported by the National Key R&D Program of China (Grant No. 2018YFA0404202) and the National Natural Science Foundation of China (Grant No. 11947404)
Received Date:09 October 2020
Accepted Date:23 December 2020
Available Online:08 May 2021
Published Online:20 May 2021
Abstract:The ground level enhancement (GLE) event energy spectrum provides important information about the acceleration and propagation of cosmic ray. In this paper, we analyze the proton flux peak energy spectrum of recent GLE event (2017.09 GLE72) by using GOES15 satellite and neutron monitor experiment data. The method of adjacent averaging smoothing and weighted average are applied to study GOES15 satellite data, and obtain the flux peak and flux peak time. By fitting, the energy spectrum index of proton flux peak is 1.88 in the satellite observation energy range. Again, the energy spectrum index of the neutron monitor observation energy range, 4.86, is obtained by using the new neutron monitor yield function. It can be seen that the peak energy spectrum index given by satellites in the lower energy range (5–433 MeV) is much smaller than that given by the neutron monitor in the higher energy range (0.44–19 GeV). This means that, the energy spectrum in the lower energy range is harder than that in the higher energy range. Hence, the results of the energy spectrum could be explained qualitatively by the re-acceleration mechanism of high energy solar particles. In the low corona region, first, the particles released by the solar flare are accelerated, and the energy spectrum index of the high-energy range is twice that of the low-energy range. Then part of the solar high energy particles from the low corona enter into the CME, where they will be re-acceleration by the shock wave. The GLE72 event high energy range energy spectrum index given by the neutron monitor experiment is 4.86, so the energy spectrum index in low energy range should be 4.86/2 = 2.43. However, the low energy range energy spectrum index is 1.88 (lower than 2.43 in low energy range). The reason may be that the energy spectrum index is further reduced due to the re-acceleration effect in the shock wave generated by the CME. The observation of GLE event is one of the main research subjects of the Large High Altitude Air Shower Observatory (LHAASO). Also, the GLE72 proton peak energy spectrum results provide important information to observe solar high energy particles in the LHAASO experiment. Keywords:solar cosmic rays/ energy spectrum/ GLE event
全文HTML
--> --> --> 1.引 言自1912年奥地利科学家Hess[1]发现宇宙线以来, 宇宙线的起源、加速和传播机制一直是宇宙线物理长期研究的重要问题. 太阳是离我们最近的一颗恒星, 也是一个明确的宇宙线源, 太阳宇宙线的研究可以对上述问题的解决提供重要基础. 太阳宇宙线地面流强增长事件(ground level enhancement, GLE)[2]是指太阳耀斑爆发产生的高能粒子在地面的强度短时间增加, 其中高能粒子能量可以超过500 MeV. 产生GLE事件的太阳高能粒子会穿过地球大气层并与大气发生级联簇射[3], 产生大量的次级粒子, 对这些次级粒子观测可间接得到太阳高能粒子的性质. GLE事件的高能粒子可以利用分布于世界范围内的地面中子堆站和地面探测阵列来进行地面观测, 也可以利用卫星和气球探测器进行空间观测. 现有卫星空间探测的太阳高能粒子能量最高达到几百MeV, 地面探测的能量一般在GeV以上. 目前地面探测到的太阳高能粒子能量最高达500 GeV[4]. GLE事件一般在太阳活动周的最大阶段或下降阶段发生[5], GLE事件期间的太阳耀斑活动可能伴随日冕物质抛射. 自1946年Forbush[6]首次观测到GLE 事件以来, 已经记录到72个GLE 事件, 大部分是质子事件. GLE事件中粒子的能谱、成份、加速机制和最大能量对研究太阳活动和宇宙线基本物理问题具有重要作用. GLE事件粒子的能谱与成份、加速机制和最大能量密切相关, 因此GLE事件粒子能谱是研究GLE事件的首要问题. GLE事件粒子能谱一般为能量或刚度的幂律函数形式. GLE事件有一个发生、发展的过程. 在这个过程中, 粒子流强上升到最大值(峰值)后又逐渐恢复到正常水平. 粒子流强峰值和峰值时间对研究GLE事件中粒子的最大能量具有特别的意义, GLE事件粒子流强峰值能谱(流强峰值随能量的变化)对太阳宇宙线及银河宇宙线研究具有重要意义. 人们开展了许多关于流强峰值与峰值能谱的研究, Oh等[7]利用GOES卫星各个能量通道的太阳高能粒子流强峰值数据对2010年以前的太阳高能粒子事件进行了分析; 2006年, Vashenyuk等[8]利用地面中子堆数据研究了GLE事件双峰结构; 2007年, Mottl和Nymmik[9]将卫星和中子堆观测数据结合给出22太阳活动周中的13个GLE事件的平均峰值能谱. 2017年9月10日太阳爆发的X8.2级大耀斑引发了GLE72事件, 这是最新的一个GLE质子事件, 该事件成为近几年GLE研究的主要对象. Bruno等[10]、Gopalswamy等[11]利用卫星数据给出了GLE72事件的低能端能谱; Mishev等[12]利用新的中子堆yiled function[13]结合中子堆数据给出了GLE72事件在不同时间的能谱和各向异性特征. 而发生在太阳活动周期的低活动期的GLE72事件, 峰值能谱目前还没有详细研究结果的报道. 本文利用GOES15卫星和中子堆实验数据分析和研究GLE72事件的质子峰值能谱. 本文使用的卫星实验数据来源于https://www.swpc.noaa.gov/products/goes-proton-flux 和http://lpsc.in2p3.fr/crdb, 中子堆实验数据来源于http://www.nmdb.eu/nest/index.php和http://gle.oulu.fi/#/dose. 2.GLE72事件卫星与地面观测数据处理2017年9月6—10日太阳爆发了剧烈活动, AR2673活动区共爆发了19个M级和4个X级太阳耀斑. 图1给出了地面中子堆DOMB站点2017年9月5—18日期间记录的宇宙线计数率. 第一个X级(X2.2, 蓝线)耀斑在2017年9月6日08:57 UT 爆发, 第二个X级(X9.3, 粉线)耀斑在11:53 UT爆发, 第三个X级(X1.3, 绿线)耀斑在2017年9月7日14:20 UT 爆发, 2017年9月10日15:35 UT太阳爆发第四个X级(X8.2, 红线)耀斑. 在这一系列的太阳活动中, X9.3级耀斑引起了宇宙线Forbush下降[14](由日冕物质抛射(CME)驱动的行星际激波所引发的银河宇宙线(GCR)突然下降). 图1中可以清楚看到这次Frobush下降. 在Forbush下降的恢复阶段, 伴随CME的X8.2级大耀斑引发了GLE72事件, 其中CME发生在2017年9月10日16:00 UT, 在2017年9月12日19:26 UT到达地球[15], 最初的速度高达3620 km/s[12]. 地面中子堆记录到了这一GLE事件. 图1中2017 年9月10日15:35 UT (X8.2 级耀斑爆发)后计数率突然显著增大, 这就是GLE72事件. 中子堆DOMB站点记录的GLE72事件显著性为$ 7.7\sigma $. GLE72事件从上升到恢复大概持续3天多, 在这段时间GOES15卫星EPEAD-A 仪器观测到高能粒子(Proton, Alpha)的流强如图2所示. 可以明显看出, 在X8.2级耀斑爆发后, GOES15卫星记录的质子(Proton)和氦核(Alpha)的流强都有明显上升, 也就是说卫星也记录到了这次GLE事件的高能粒子爆发. 在GLE72事件中, 质子的流强峰值比氦核的流强峰值高出几百倍, 即在GLE72事件中的高能粒子以质子为主. 图 1 地面中子堆DOMB站点在2017年9月5—18日的计数率(1小时平均)随时间的变化. X2.2级耀斑爆发于2017年9月6日08:57 UT (蓝色竖线), X9.3级耀斑爆发于2017年9月6日11:53 UT (粉色竖线), X1.3级耀斑爆发于2017年9月7日14:20 UT (绿色竖线), X8.2级耀斑爆发于2017年9月9日15:35 UT (红色竖线). GLE72事件的显著性为$ 7.7\sigma $ Figure1. Count-rate (hour averaged) variation of the DOMB on September 5–18, 2017. X2.2 flares erupt at 08:57 UT (blue) on September 6, 2017, X9.3 flares break out at 11:53 UT (pink) on September 6, 2017, X1.3 flares explode at 14:20 UT (green) on September 7, 2017, and X8.2 flare burst out at 15:35 UT (red) on September 9, 2017. The significance of GLE72 event is $ 7.7\sigma $.
图 2 GOES15卫星的EPEAD-A记录的能量为433 MeV的Proton (紫色)和Alpha (土红色)流强(5 min)随时间变化. 红色竖线表示2017年9月10日15:35 UT X8.2级耀斑爆发时刻 Figure2. Profile of the time of Proton (purple) and Alpha (earth red) flux (433 MeV, 5 min) recorded by the EPEAD-A of GOES15 satellite. The red line indicates the X8.2 flare at 15:35 UT on September 10, 2017.
22.1.GOES15卫星数据处理 -->
2.1.GOES15卫星数据处理
太阳活动爆发所释放的大量高能粒子经过行星际空间传播到1 AU时, 这些太阳高能粒子会被地球轨道上的卫星(如GOES, ACE, STEREO和SAMPEX等)观测到, 本文主要利用GOES15卫星观测数据来分析GLE72事件. GOES15 卫星由NOAA和NASA研发、发射和运行, 对高能粒子探测的仪器主要是HEPAD和EPEAD, 探测质子的能量范围为2—700 MeV. 图3为2017年9月9—14日GOES15卫星EPEAD仪器观测的6个能量通道(6.5, 11.6, 30.6, 63.1, 165, 433 MeV)的质子流强随时间的变化. 图中横坐标1指2017年9月10日15:35 UT, 也就是X8.2级太阳耀斑爆发时刻. 可以看到, 各能量质子流强随时间变化都有一个快速上升和缓慢恢复的过程, 有着复杂的结构. 我们对观测各能量质子流强进行了数学平滑, 平滑结果如图3中的红色曲线所示. 由平滑曲线可以给出流强峰值$ I(E) $, 利用加权平均法给出流强峰值时间$ t_{\max} $. 流强峰值时间随能量的变化如图4 所示. 图中纵坐标为峰值时间, 1表示X8.2 级耀斑爆发时刻. 由图4可以看到, 流强达到峰值的时间大致表现为随能量的增大而减小, 即更高能量的太阳宇宙线粒子更早到达观测卫星处, 这可能与不同能量的粒子在行星际空间的传播速度不同有关. 各能量通道(6.5, 11.6, 30.6, 63.1,165, 433 MeV)的流强峰值分别为(268 ± 37), (69.7 ± 7.6), (32.3 ± 2.4), (4.97 ± 0.14), (0.45 ± 0.04), (0.13 ± 0.01) (cm–2·s–1·sr–1·MeV–1), 如图5所示. 考虑各测量点误差, 拟合得到质子峰值能谱为$I(E) = (1.05\; \pm $$ 0.63)\!\times\!10^{4}E^{-1.88\pm0.14}\; ({\rm{cm}}^{-2}·{\rm{s}}^{-1}·{\rm{sr}}^{-1}·{\rm{MeV}}^{-1})$. 图 3 GOES15卫星的EPEAD-A仪器测量的6个粒子能量通道(6.5, 11.6, 30.6, 63.1, 165, 433 MeV)的质子的流强随时间变化(黑色), 红色为平滑结果 Figure3. Profile of the time of proton flux (black) in the six channels (6.5, 11.6, 30.6, 63.1 165, 433 MeV). The red line is the result obtained by Smoothing.
图 4 各能量点峰值时间随能量的变化. 其中纵坐标1表示2017年9月10日15:35 UT耀斑爆发的时刻(黑色实线). 下三角为加权平均法得到的GOES15卫星各能量点流强到达峰值的时刻, 红色实线为下三角数据点拟合结果 Figure4. Peak time as a function of the energy. The black solid line indicates the X8.2 flare at 15:35 UT on September 10, 2017. The lower triangle refers to the time of flux peak in different energies, which is obtained by the weighted average method. The red solid line is the fitting result.
图 5 各能量点流强峰值随能量的变化. 黑正方形为平滑得到的GOES15卫星各能量点的流强峰值, 红色实线为黑正方形数据点(带有误差)拟合结果 Figure5. Flux peak as a function of energy. The black square refers to flux peak in different energies obtained by Smoothing. The red solid line is the fitting result (with error).
其中, $\Delta N(R_{\rm {cut}}, t)$表示相较于太阳平静期太阳活动期观测的计数率的增量; $R_{\rm {cut}}$为中子堆站点的截止刚度, 如1.14 GV (KERG), 1.65 GV (YKTK), 2.09 GV (MGDN), ···; $ R_{\rm {max}} $(20 GV)为中子堆记录的太阳高能粒子的最大刚度; $ I(R, t)$为太阳活动产生的太阳高能粒子能谱; $ Y(R) $为中子堆的响应函数(yiled function[13,19]). 将中子堆站记录的GLE72峰值计数率增量$ \vartriangle N(R_{\rm {cut}}, t) $ 代入(1)式, 就可计算出GLE72事件高能粒子的峰值能谱. 利用中子堆站点的观测结果, 计算得到GLE72事件高能质子在1—20 GV能区的峰值能谱为$I(R) = $$ (9.77\pm0.36) \times 10^{5}R^{-6.59\pm0.03} ({\rm{m}}^{-2}·{\rm{s}}^{-1}·{\rm{sr}}^{-1}·{\rm{GV}}^{-1})$. 3.结果分析与讨论利用GOES15卫星和中子堆的实验观测数据分析得到GLE72事件质子峰值能谱, 如图6所示. 卫星观测峰值能谱$ I = I_{0}E^{-\gamma} $在5—433 MeV能区的$ I_{0} = (2.41\pm0.98)\times10^{5}\; ({\rm{m}}^{-2}·{\rm{s}}^{-1}·{\rm{sr}}^{-1}·{\rm{GeV}}^{-1}) $, 能谱指数$ \gamma = 1.88\pm0.14 $. 中子堆观测得到的峰值能谱$ I = I_{0}E^{-\gamma} $在0.43—19 GeV 能区的$I_{0} = (3.13\pm $$ 0.10)\times10^{4}\; ({\rm{m}}^{-2}·{\rm{s}}^{-1}·{\rm{sr}}^{-1}·{\rm{GeV}}^{-1})$, 能谱指数$\gamma = $$ 4.86\pm 0.03$. 为了比较, 图6中给出了银河宇宙线能谱[20,21](黑色实线). 可以看到, 当能量大于3.5 GeV时, GLE72质子流强峰值就低于银河宇宙线背景(黑色实线)的流强. 图6中也给出了2017 年9月10日17:00, 17:30, 18:00, 18:30和19:00 UT 等5个时刻的卫星和中子堆观测的GLE72质子能谱. 卫星实验数据给出5个时刻的能谱指数平均为 $ \gamma = 1.43\pm0.25 $, 中子堆实验数据给出的5个时刻的能谱指数平均为$ \gamma\approx5.40 $. 峰值能谱指数与这5个时刻的能谱指数差别不大, 而各时刻的流强相比流强峰值小了一个数量级. 较低能区(5—433 MeV)卫星给出的峰值能谱指数为1.88, 比高能段(0.44—19 GeV)中子堆给出的能谱指数4.86小很多, 即低能段能谱比高能段能谱更硬. 这个结果可以利用如下的太阳高能粒子加速过程进行解释. 图 6 GLE72事件质子峰值能谱. GOES15卫星各能点(6.5, 11.6, 30.6, 63.1, 165, 433 MeV)的流强峰值(黑色方块), GOES15卫星各能量点流强峰值随能量变化的拟合结果(红色实线), GOES15卫星峰值能谱延长至100 GeV的流强随能量变化(红色实线段). GOES15卫星在各个能量点的各个时间17:00 UT(上三角)、17:30 UT(下三角)、18:00 UT(圆形)、18:30 UT(五角形)、19:00 UT(十字架)的流强. 中子堆实验数据计算得到的峰值能谱(粉色实线), 中子堆峰值能谱延长到100 GeV流强随能量的变化(粉色线段). Mashev等[12]给出的不同时间(17:00, 17:30, 18:00, 18:30, 19:00 UT) 的能谱(虚线). AMS02卫星测量银河宇宙线H[20]和He[21]的能谱(黑色实线) Figure6. Proton peak energy spectrum of GLE72 event. The flux peak (black block) of GOES15 satellite in different energies (6.5, 11.6, 30.6, 63.1, 165, 433 MeV). Fitting results of flux peak in different energies (red solid line). The flux of GOES15 satellite with the peak energy spectrum extending to 100 GeV as a function of energy (red line segment). The flux of GOES15 satellite in different energies and times [17:00 UT (upper triangle), 17:30 UT (lower triangle), 18:00 UT (circle), 18:30 UT (pentagonal), 19:00 UT (cross)]. The peak energy spectrum obtained from the experimental data of the neutron monitor (pink solid line). The flux of neutron monitor with the peak energy spectrum extending to 100 GeV as a function of energy (pink line segment). Energy spectra (dashed lines) at different times given by Mashev et al.[12]. The result of the energy spectrum of the galactic cosmic rays H[20] and He[21] measured by AMS02 satellite (black).
关于太阳高能粒子的加速, 文献[22-24]指出太阳活动(伴随CME的太阳耀斑爆发)所释放的太阳高能粒子会经历两个加速过程. 首先由太阳耀斑所释放的粒子在低日冕区加速, 在日冕中加速的太阳高能粒子一部分以辐射形式被释放; 另一部分继续向上传播入射到CME 中, 在CME产生的激波中进行重加速. 两个加速过程示意图如图7所示. 太阳高能粒子在低日冕区加速后注入CME, 对于高能段的太阳高能粒子, 在CME中的逃逸时间小于加速时间, 粒子很快就从CME中逃逸出来, 从而在CME中没有对高能段粒子进行有效的重加速, 使高能段粒子能谱与低日冕中加速得到的能谱一样陡. 而对于低能段的太阳高能粒子, 在CME中的逃逸时间大于加速时间, 从而在CME中低能段粒子进行了充分的重加速, 使低能段粒子能谱相比于日冕中加速得到的能谱要硬. 另外, 太阳耀斑释放的粒子在低日冕[23]的加速过程, 主要是粒子在太阳耀斑所引发的激波等离子体上端和下端来回加速. 低能段与高能段能谱指数分别表示为$S_{\rm l} = \dfrac{1}{2}(r+2)/(r-1)$, $ S_{\rm t} = (r+2)/(r-1) $, 高能段的能谱指数是低能段的2倍. 在低日冕加速的太阳高能粒子的能谱指数$ S_{\rm l} $和$ S_{\rm t} $只依赖激波压缩比$ r = u_{1}/u_{2} $, $ u_{1} $和$ u_{2} $分别表示激波上端和下端等离子体流动的速度, 激波压缩比$ r $的取值一般为1.6—3[26]. 中子堆实验给出的GLE72 事件高能段能谱指数为4.86, 由此计算得到的激波压缩比$ r = $$ 1.78 $, 在1.6—3范围内. 那么低能段能谱指数就应该是$ 4.86/2 = 2.43 $. 但低能段粒子除了受上述日冕加速外, 还受到CME激波的加速, CME激波加速进一步减小了粒子能谱指数, 也就是说CME 加速后粒子能谱指数应该小于2.43. 利用卫星数据给出的能谱指数$ \gamma = 1.88 < 2.43 $, 与该结论相符合. 图 7 太阳高能粒子加速示意图, 左边表示在低日冕层区加速的太阳高能粒子, 右边表示从低日冕区加速出来的一部分太阳高能粒子向上传播进入CME 进行重加速 [22,24,25] Figure7. A schematic representation of the acceleration of solar energetic particles. The acceleration in the low corona region (left). Part of the solar high-energy particles from the low corona enter into the CME, and be re-accelerated (right)[22,24,25].

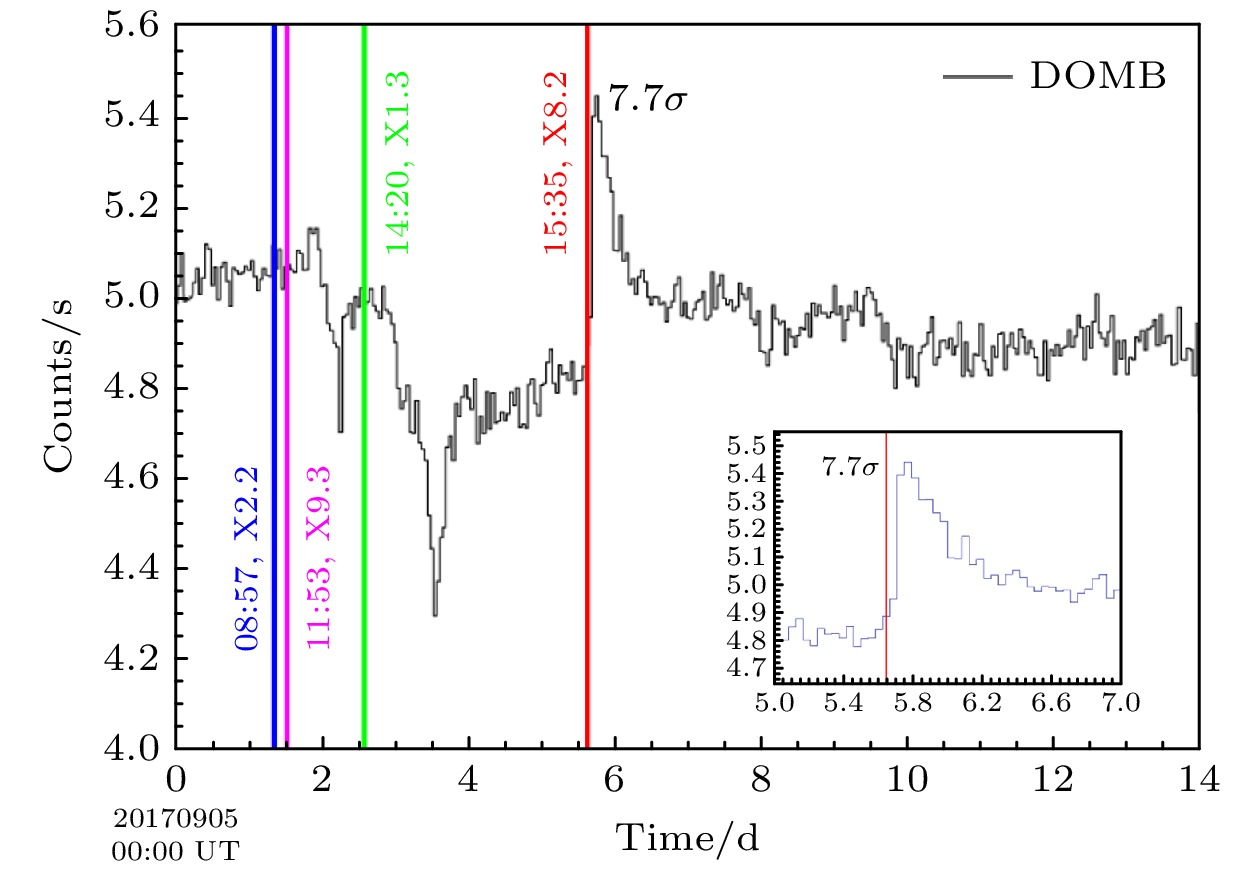 图 1 地面中子堆DOMB站点在2017年9月5—18日的计数率(1小时平均)随时间的变化. X2.2级耀斑爆发于2017年9月6日08:57 UT (蓝色竖线), X9.3级耀斑爆发于2017年9月6日11:53 UT (粉色竖线), X1.3级耀斑爆发于2017年9月7日14:20 UT (绿色竖线), X8.2级耀斑爆发于2017年9月9日15:35 UT (红色竖线). GLE72事件的显著性为

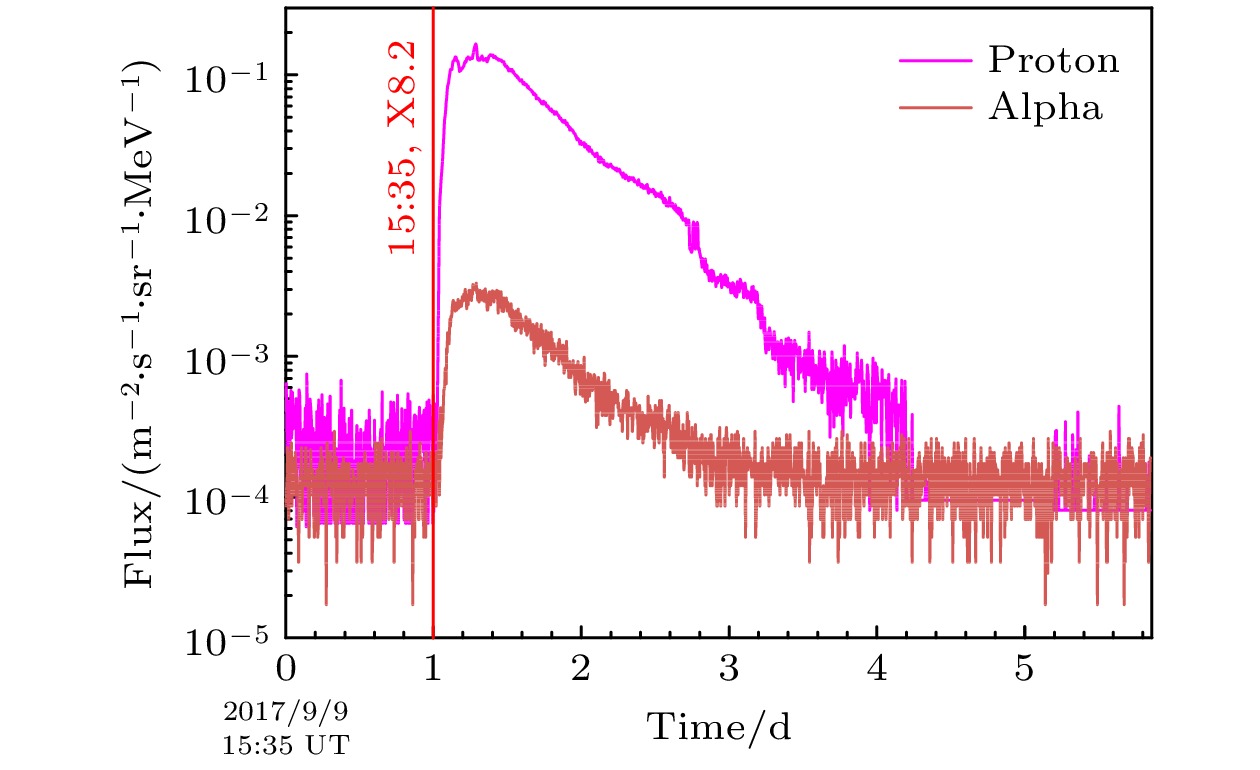 图 2 GOES15卫星的EPEAD-A记录的能量为433 MeV的Proton (紫色)和Alpha (土红色)流强(5 min)随时间变化. 红色竖线表示2017年9月10日15:35 UT X8.2级耀斑爆发时刻


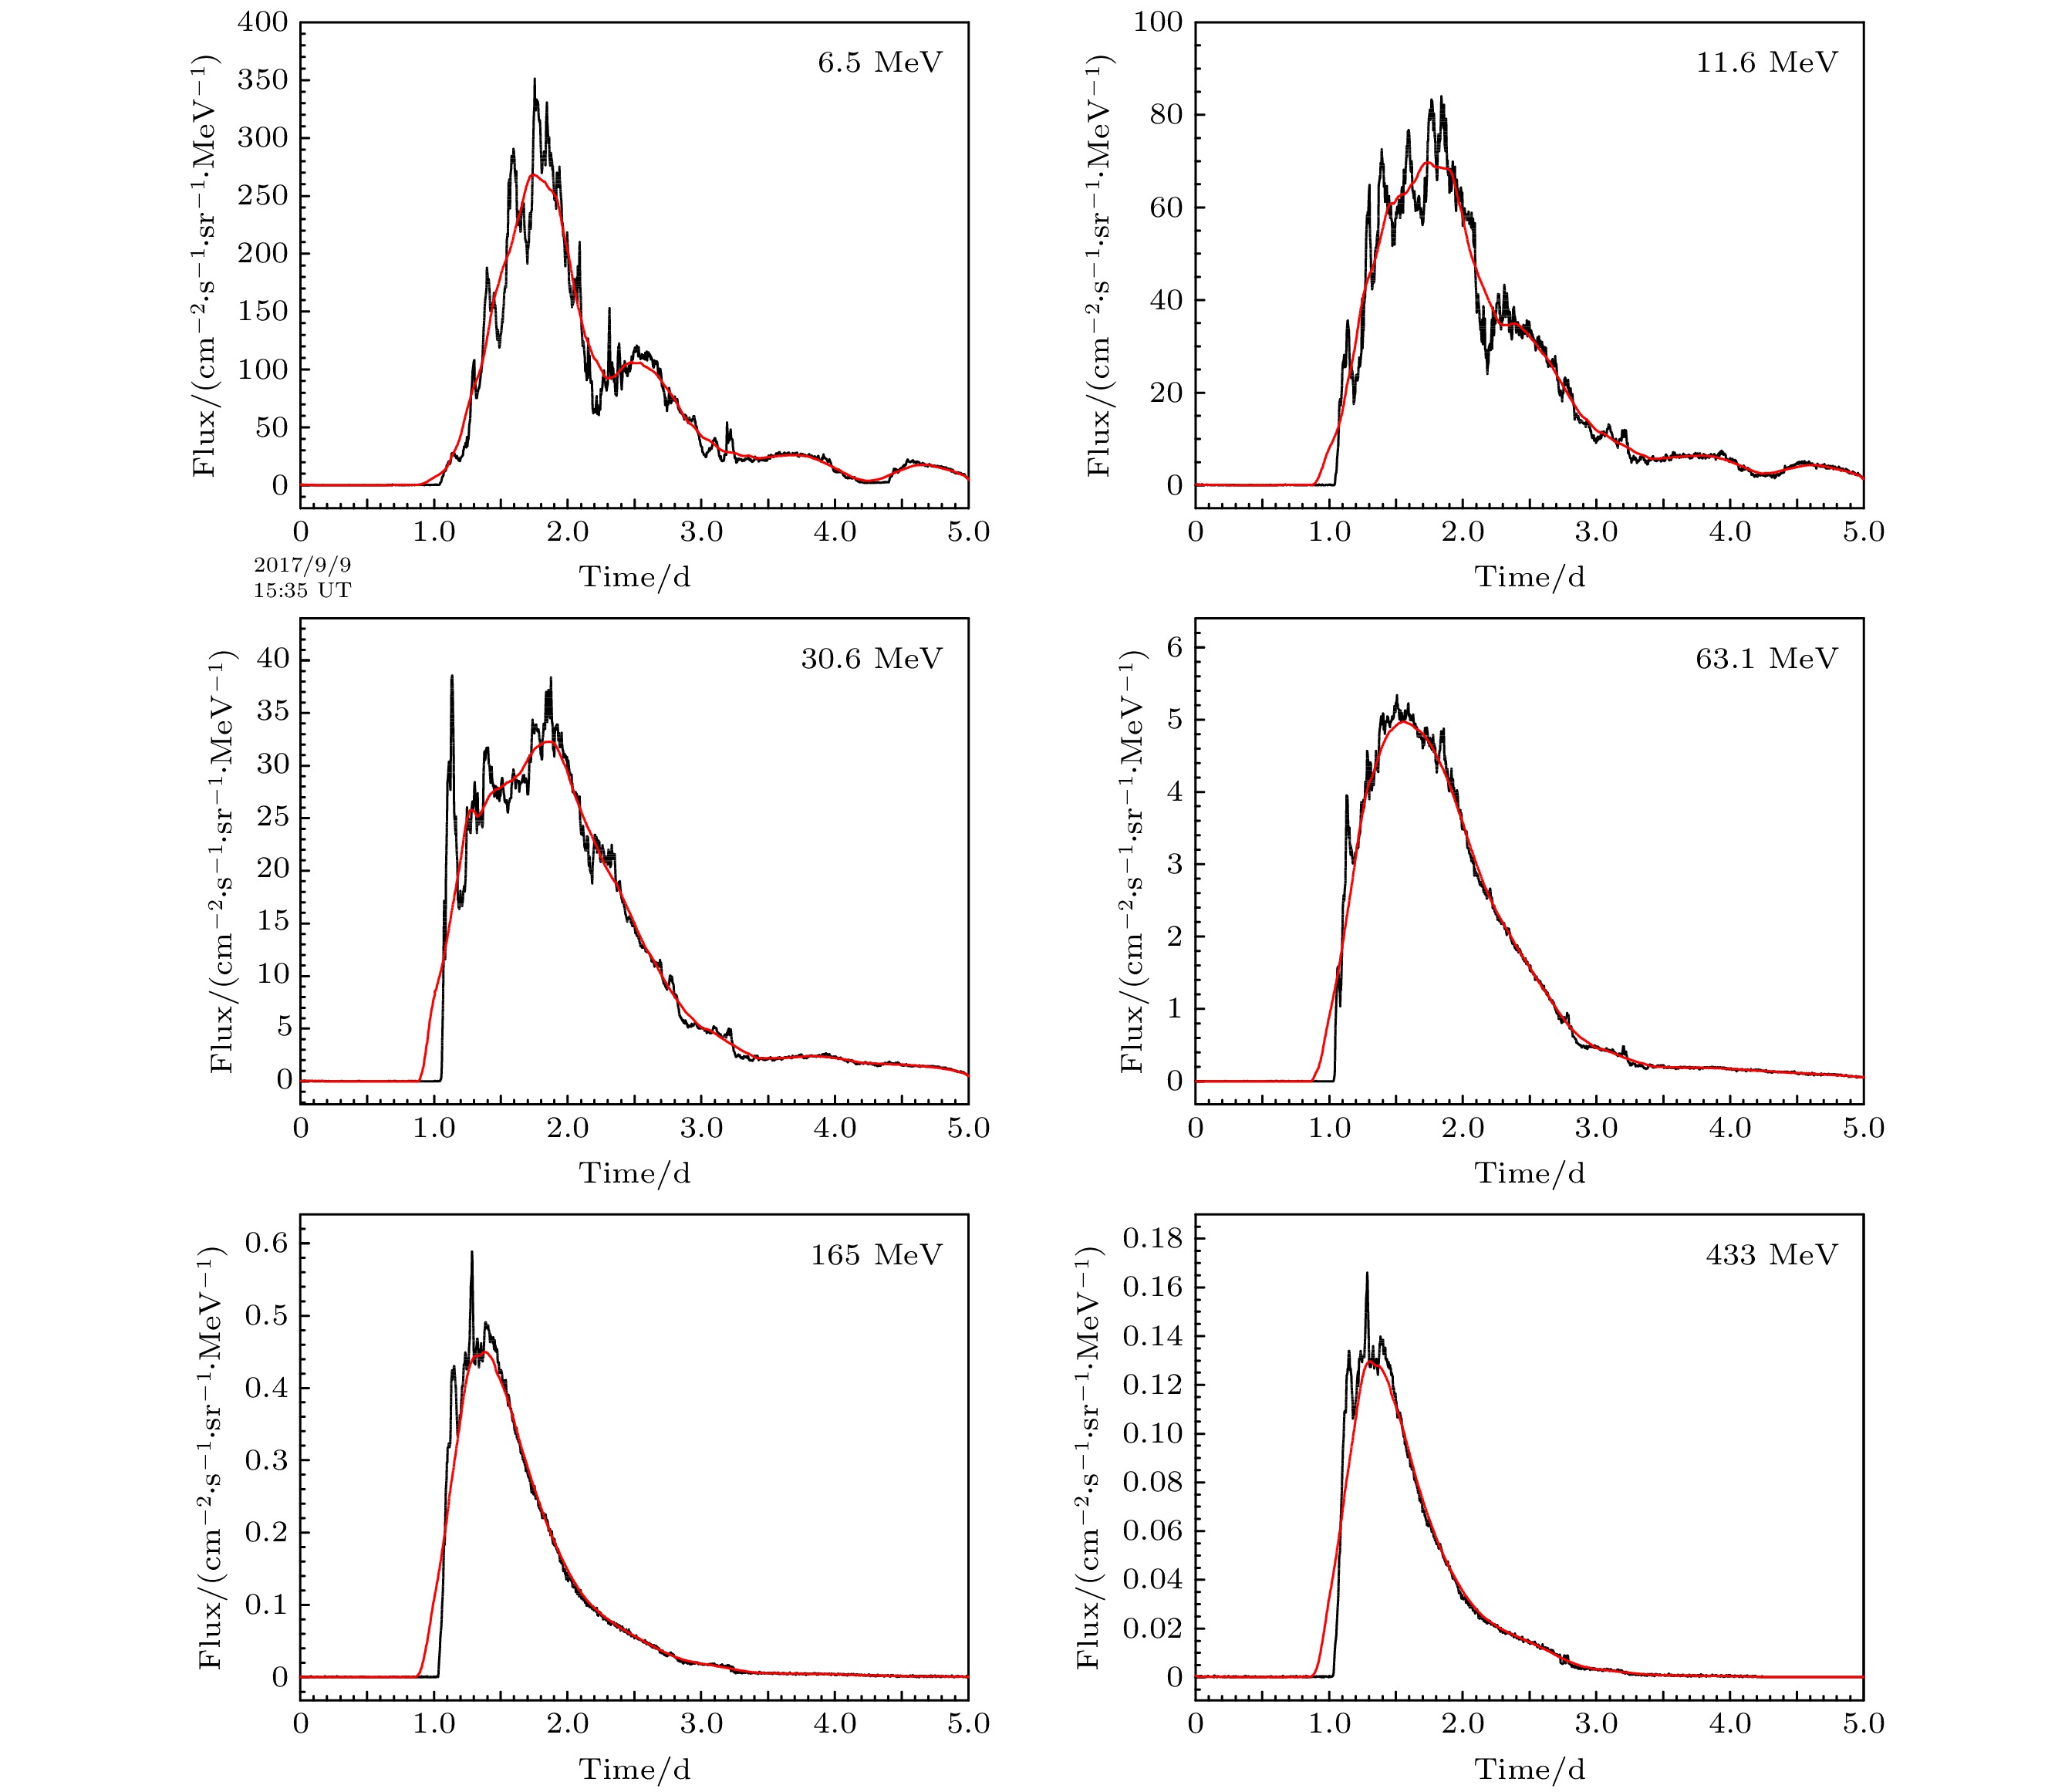 图 3 GOES15卫星的EPEAD-A仪器测量的6个粒子能量通道(6.5, 11.6, 30.6, 63.1, 165, 433 MeV)的质子的流强随时间变化(黑色), 红色为平滑结果
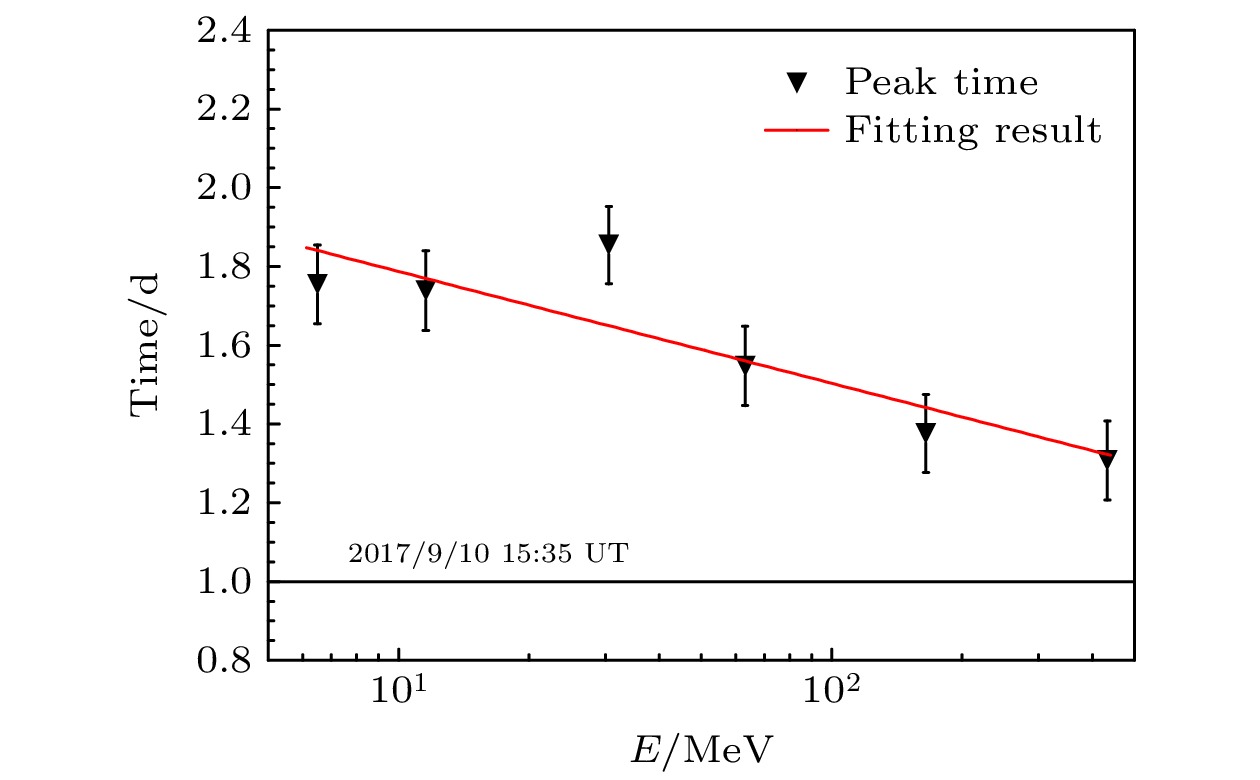 图 4 各能量点峰值时间随能量的变化. 其中纵坐标1表示2017年9月10日15:35 UT耀斑爆发的时刻(黑色实线). 下三角为加权平均法得到的GOES15卫星各能量点流强到达峰值的时刻, 红色实线为下三角数据点拟合结果
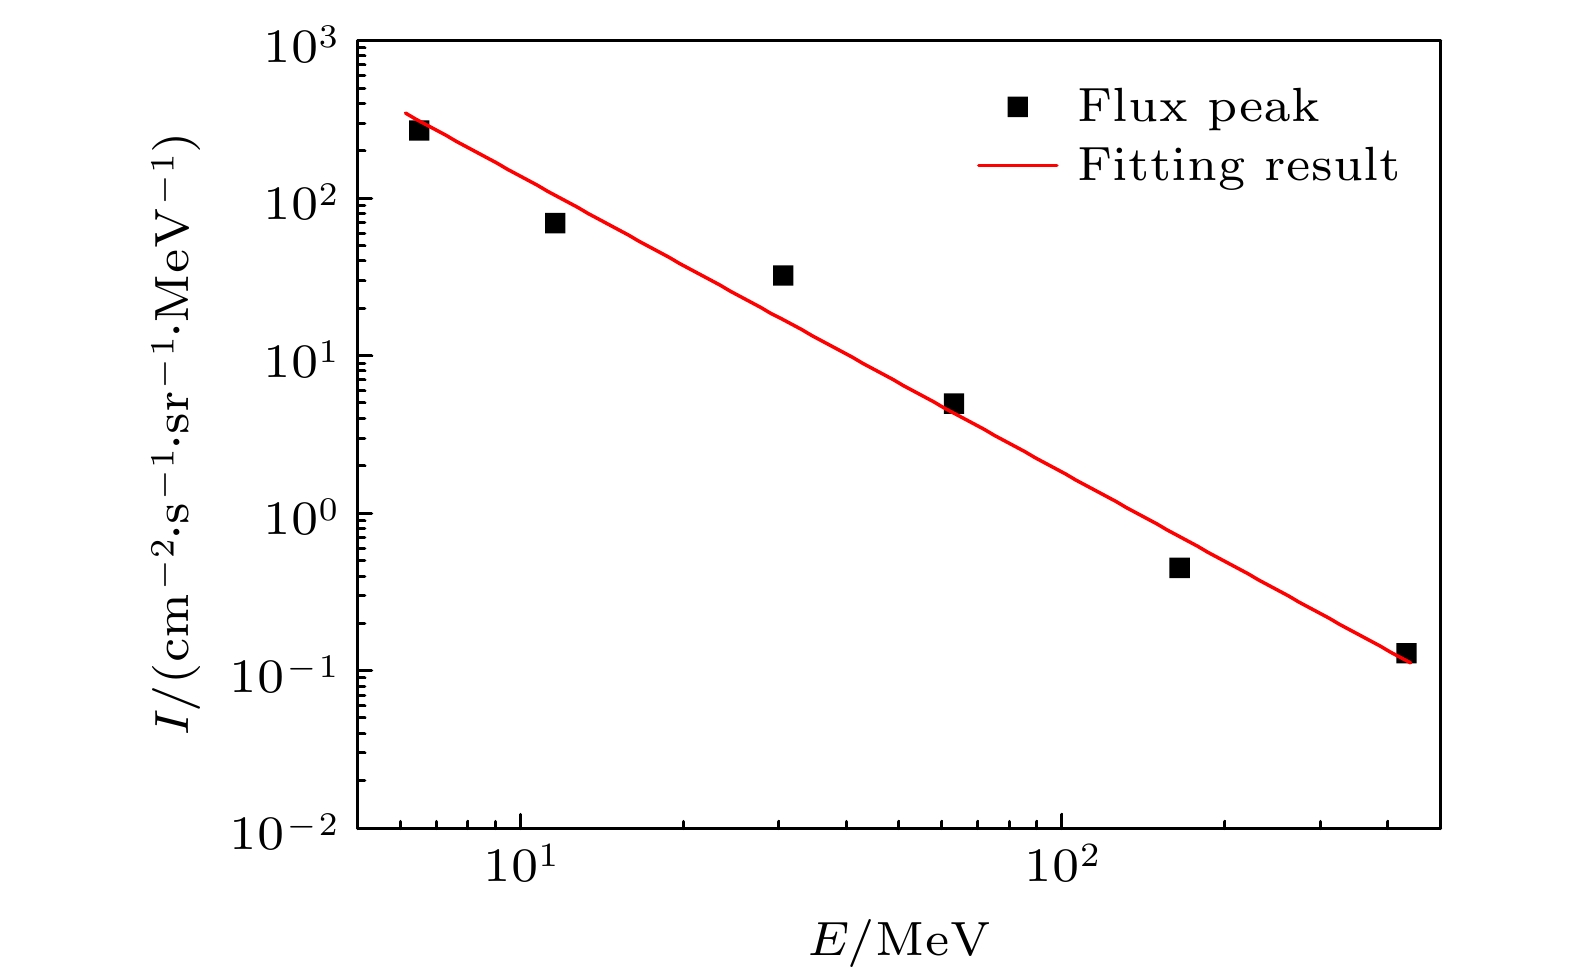 图 5 各能量点流强峰值随能量的变化. 黑正方形为平滑得到的GOES15卫星各能量点的流强峰值, 红色实线为黑正方形数据点(带有误差)拟合结果


 图 6 GLE72事件质子峰值能谱. GOES15卫星各能点(6.5, 11.6, 30.6, 63.1, 165, 433 MeV)的流强峰值(黑色方块), GOES15卫星各能量点流强峰值随能量变化的拟合结果(红色实线), GOES15卫星峰值能谱延长至100 GeV的流强随能量变化(红色实线段). GOES15卫星在各个能量点的各个时间17:00 UT(上三角)、17:30 UT(下三角)、18:00 UT(圆形)、18:30 UT(五角形)、19:00 UT(十字架)的流强. 中子堆实验数据计算得到的峰值能谱(粉色实线), 中子堆峰值能谱延长到100 GeV流强随能量的变化(粉色线段). Mashev等[12]给出的不同时间(17:00, 17:30, 18:00, 18:30, 19:00 UT) 的能谱(虚线). AMS02卫星测量银河宇宙线H[20]和He[21]的能谱(黑色实线)


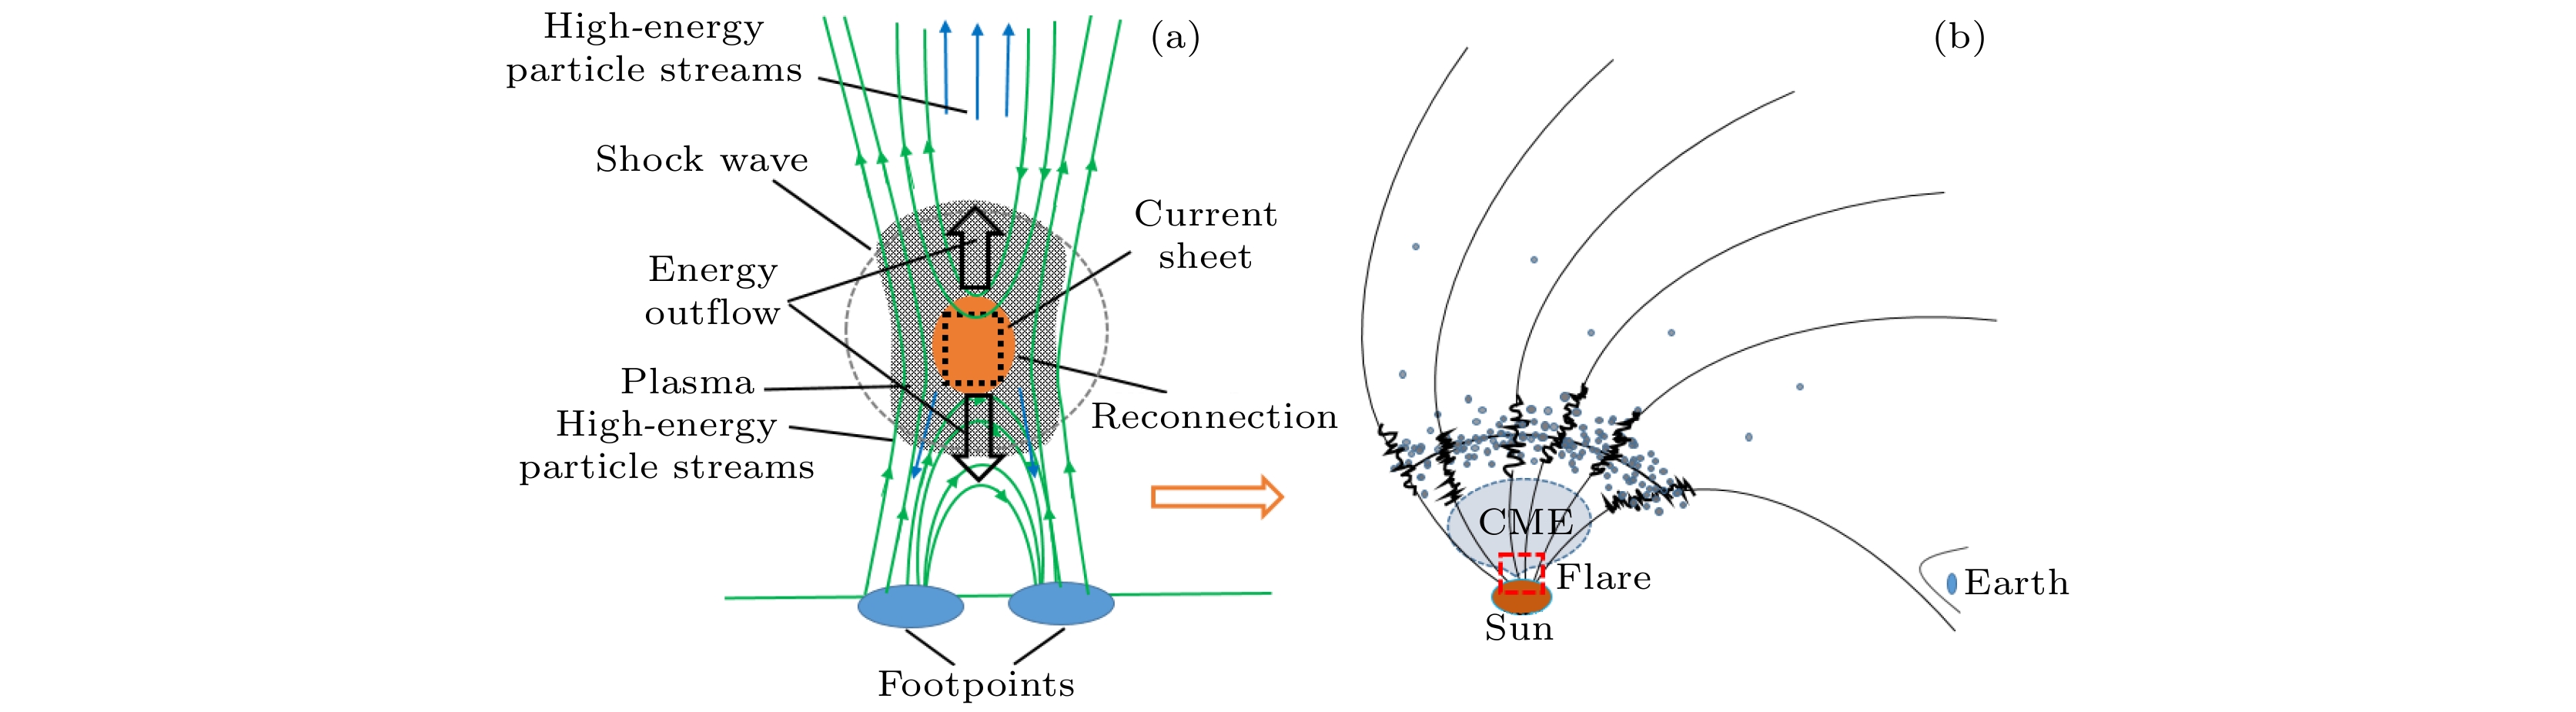 图 7 太阳高能粒子加速示意图, 左边表示在低日冕层区加速的太阳高能粒子, 右边表示从低日冕区加速出来的一部分太阳高能粒子向上传播进入CME 进行重加速 [22,24,25]