1.School of Environmental Science and Optoelectronic Technology, University of Science and Technology of China, Heifei 230026, China 2.Key Laboratory of Environmental Optics and Technology, Anhui Institute of Optics and Fine Mechanics, Hefei Institute of Physical Science, Chinese Academy of Sciences, Hefei 230031, China 3.National Field Scientific Observation and Research Station of Atmospheric Composition Background in Longfeng Mountain, Heilongjiang Province, Harbin 150209, China
Fund Project:Project supported by the National Natural Science Foundation of China (Grant No. 41941011), the Key Research Program of Frontier Sciences of Chinese Academy of Sciences (Grant No. QYZDY-SSW-DQC016), the National Key R&D Program of China (Grant Nos. 2016YFC0201002, 2016YFC0803001-08), the Key RD Program of Anhui Province, China (Grant No. 1804d08020300)
Received Date:10 October 2020
Accepted Date:23 November 2020
Available Online:26 March 2021
Published Online:05 April 2021
Abstract:The CO2, CH4 and other greenhouse gases are measured by using a home-made Fourier transform infrared spectrometer at the Longfengshan atmospheric background station. Compared with the measurement results of the instrument from the background station which meets the standards of the World Meteorological Organization, the correlation coefficient and the root mean square error of the CO2 concentration value are 0.9576 and 18.6015, so the measurement results from the home-made instrument are reliable. In the home-made instrument the calibration spectrum of standard temperature and the calibration spectrum of stand pressure are used to invert the concentration. With the temperature changing, the temperature of the measured gas will vary, thus resulting in error. The research of environmental variable factors can improve the accuracy of concentration inversion. For example, compared with CO2 absorption spectrum under 296 K, the CO2 absorption spectrum under 297 K will have 1.8% spectrum deviation and its inversion concentration error is 0.41%. This is the main cause of inversion concentration error. Based on the above analysis, the absorption cross section is calculated by using the high-resolution transmission molecular absorption database parameters. Combining with the instrument line shape, the calibration spectra at different temperatures and pressures can be obtained. The calibration spectra at different temperatures and pressures are used to calibrate the concentration inversion. After calibration, compared with the measurement results of the background station instrument, the correlation coefficient and the root mean square error of the CO2 concentration value are 0.9637 and 6.7803. The correlation coefficient of CO2 concentration value measured by self-developed instrument is improved and root mean square error is reduced. The result shows that the calibration algorithm enhances the accuracy of the measurement results to a certain extent. The above results illustrate the reliability of the home-made FTIR instrument and this experiment provides important data, which lay the foundation forstudying the home-made Fourier transform infrared spectrometer. Of course, improvement can be made in the following areas. Other minor factors may affect the effect of the inversion algorithm. The concentration inversion will have subtle differences at different bands of calibration spectra. So in order to improve the measurement accuracy, we need to choice more reasonable band inversion and more precise parameters from the high-resolution transmission molecular absorption database. Keywords:FTIR/ greenhouse gases/ temperature/ pressure
气体为均匀非色散吸光物质是(1c)式成立的前提. A (单位1)为气体定量分析光谱区域的吸光度, k (1/molecule × cm–2)为样品的吸收系数, c (mol/mol)为气体的浓度, l (m)为光程长度. 利用校准光谱进行浓度反演的过程为: HITRAN中光谱参数逐线积分计算得到标准温度、压力下的校准光谱, 实际测量的吸光度谱最小二乘拟合校准光谱得到气体浓度[13,14]. 22.2.实验条件 -->
2.2.实验条件
自研FTIR仪器在龙凤山大气本底站的观测现场, 如图2所示. 其中图2(a)为仪器主机在线测量状态, 图2(b)为仪器外界进气口. 图 2 (a)仪器主机在线测量状态; (b)仪器外界进气口 Figure2. (a) Online measurement status of instrument host; (b) external air inlet of the instrument.
以上介绍了吸光度谱的算法过程, 以CO2在2290—2380 cm–1为例, 光谱线强度(红色)、吸收系数(蓝色)、吸光度(橘黄色)如图3所示. 图 3 (a) CO2在2290—2380 cm–1的光谱线强度Sij; (b) CO2在2290—2380 cm–1的吸收系数kij; (c) CO2仿真吸光度谱Aij Figure3. (a) the spectral line intensity Sij at 2290–2380 cm–1 of CO2; (b) absorption coefficient kij at 2290–2380 cm–1 of CO2; (c) simulated absorbance spectrum Aij of CO2.
22.4.温度、压力校正算法 -->
2.4.温度、压力校正算法
计算CO2不同温度(297—306 K)下的吸收光谱与296 K吸收光谱在拟合区域的残差. 残差谱进行二次拟合, 进行温度、压力的校正. 图4(a)为296 —306 K下CO2在2290—2380 cm–1的吸收光谱, 297—305 K吸收光谱与296 K吸收光谱在2290—2380 cm–1的残差在图4(b)中, 残差与吸收光谱之间相差两个数量级, 有非常丰富的信息. 图 4 (a) CO2在2290—2380 cm–1的仿真吸光度谱Aij; (b) 297—306 K下仿真吸光度谱相比于296 K仿真吸收光谱在拟合波段的残差 Figure4. (a) The simulated absorbance spectrum Aij under 286–306 K of CO2; (b) the residual of the simulated absorbance spectrum at 297–306 K compared to the simulated absorption spectrum at 296 K in the fitted band.
均方根误差越小说明两者测量时间内浓度越接近. 分析2019年07月23日到2019年08月01日测量的CO2浓度数据, 在图6(a)中使用同一坐标轴显示了CO2浓度. 计算了FTIR与CRDS仪器测量的CO2浓度的相关系数, 结果如图6(b)所示. FTIR与CRDS仪器测量的CO2浓度值的相关系数为0.9576, RMS误差为18.6015. 经过温度、压力校准算法后, FTIR与CRDS仪器测量的CO2浓度值相关系数为0.9637, 均方根误差为6.7800. 校正后CO2浓度对比结果如图6(c)所示, 线性拟合FTIR与CRDS仪器测量CO2浓度值的结果如图6(d)所示. 图 6 (a) CO2浓度趋势对比; (b) CO2浓度值线性拟合; (c)校准后CO2浓度趋势对比; (d)校准后CO2浓度值线性拟合 Figure6. (a) CO2 concentration trend comparison; (b) CO2 concentration value linear fitting; (c) CO2 concentration trend comparison after calibration; (d) linear fitting of CO2 concentration value after calibration.
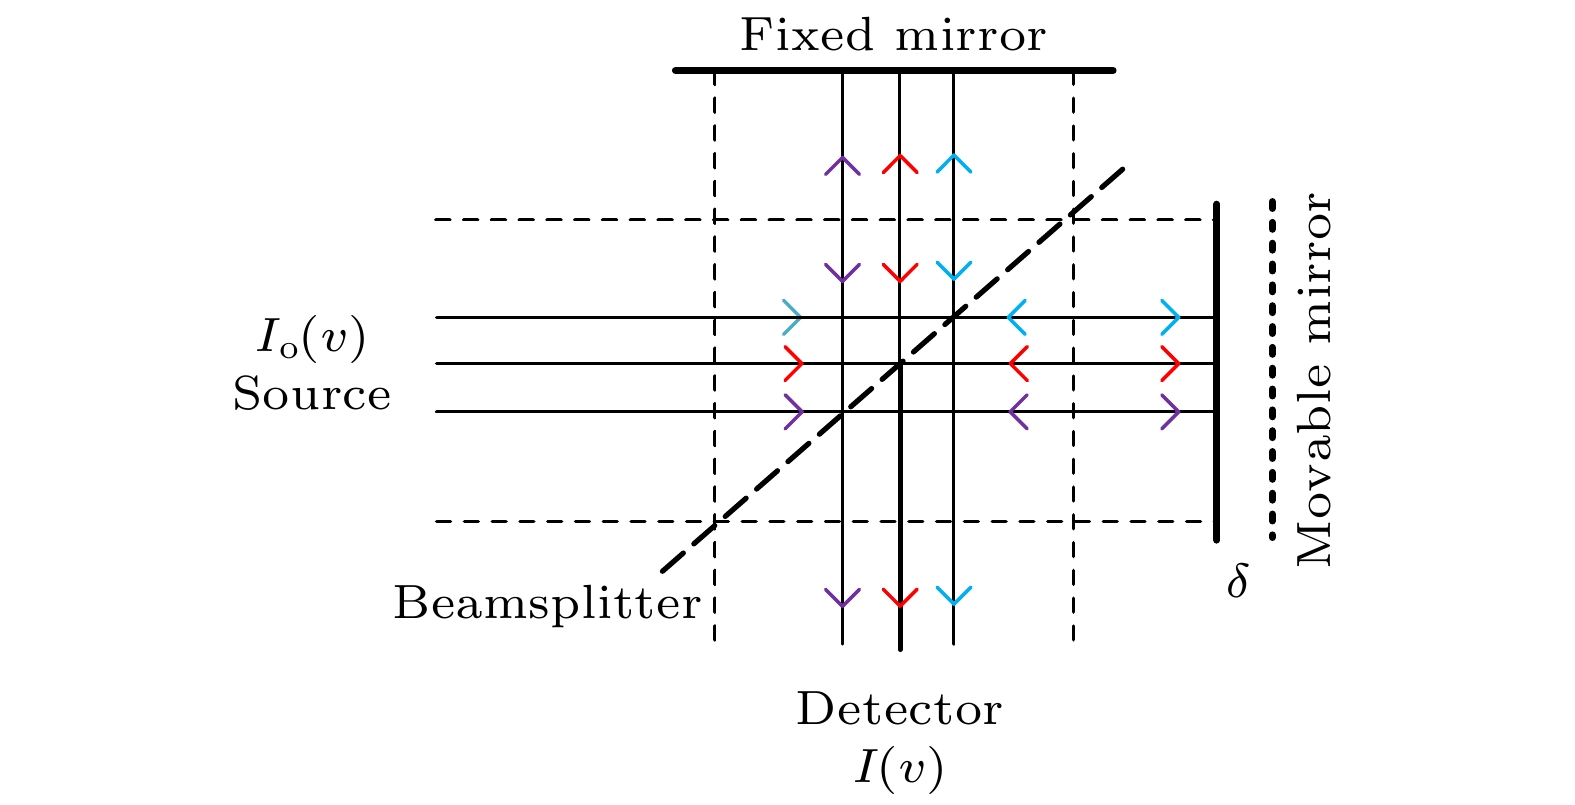 图 1 干涉仪
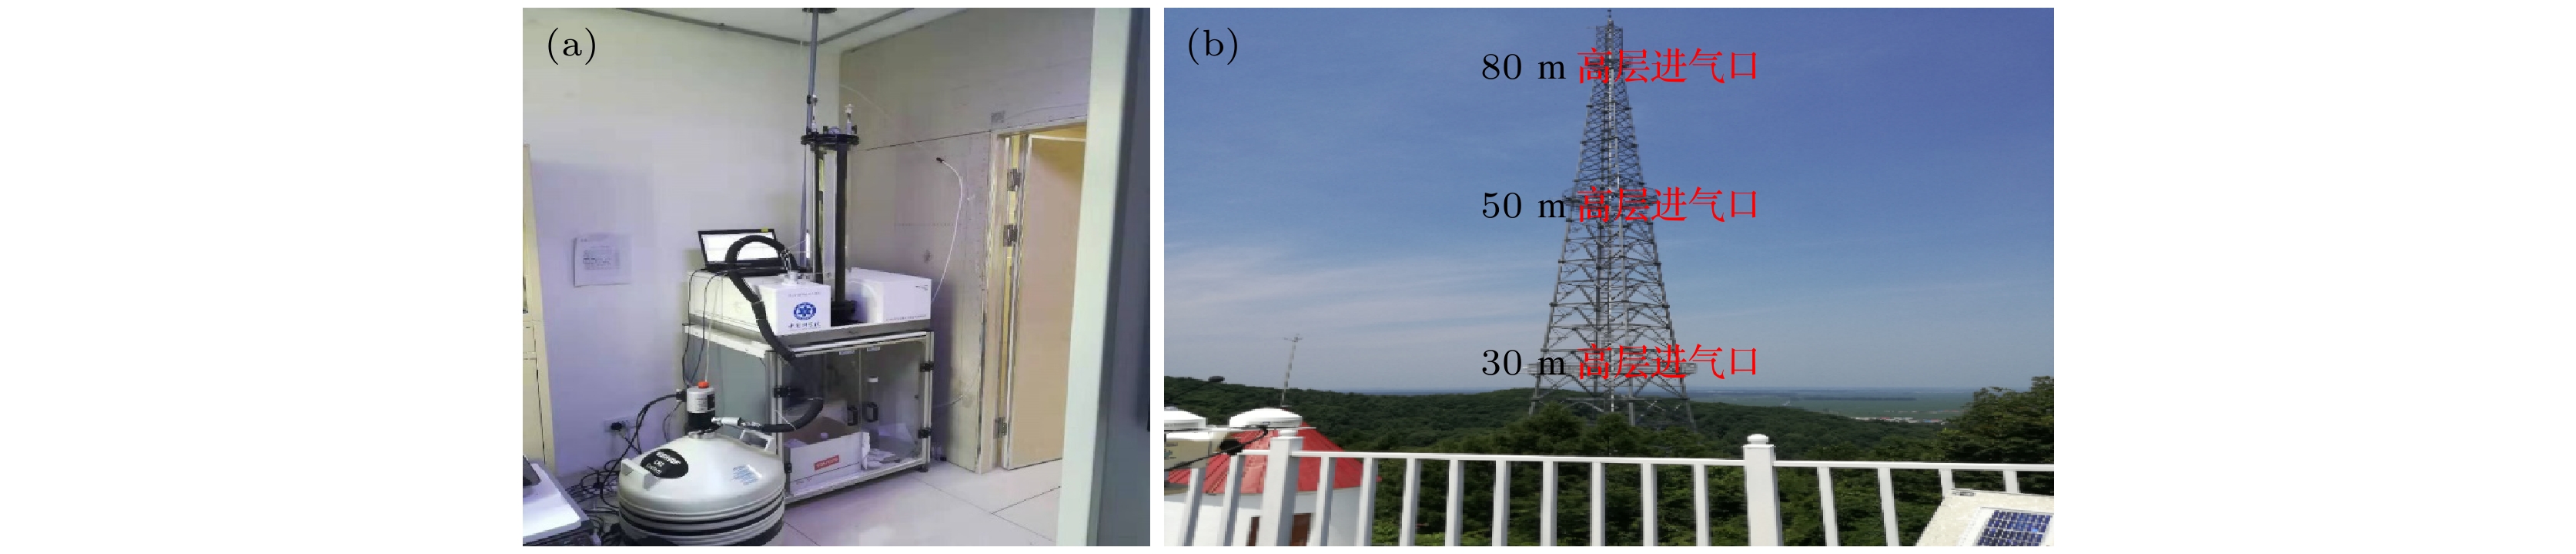 图 2 (a)仪器主机在线测量状态; (b)仪器外界进气口
 图 3 (a) CO2在2290—2380 cm–1的光谱线强度Sij; (b) CO2在2290—2380 cm–1的吸收系数kij; (c) CO2仿真吸光度谱Aij
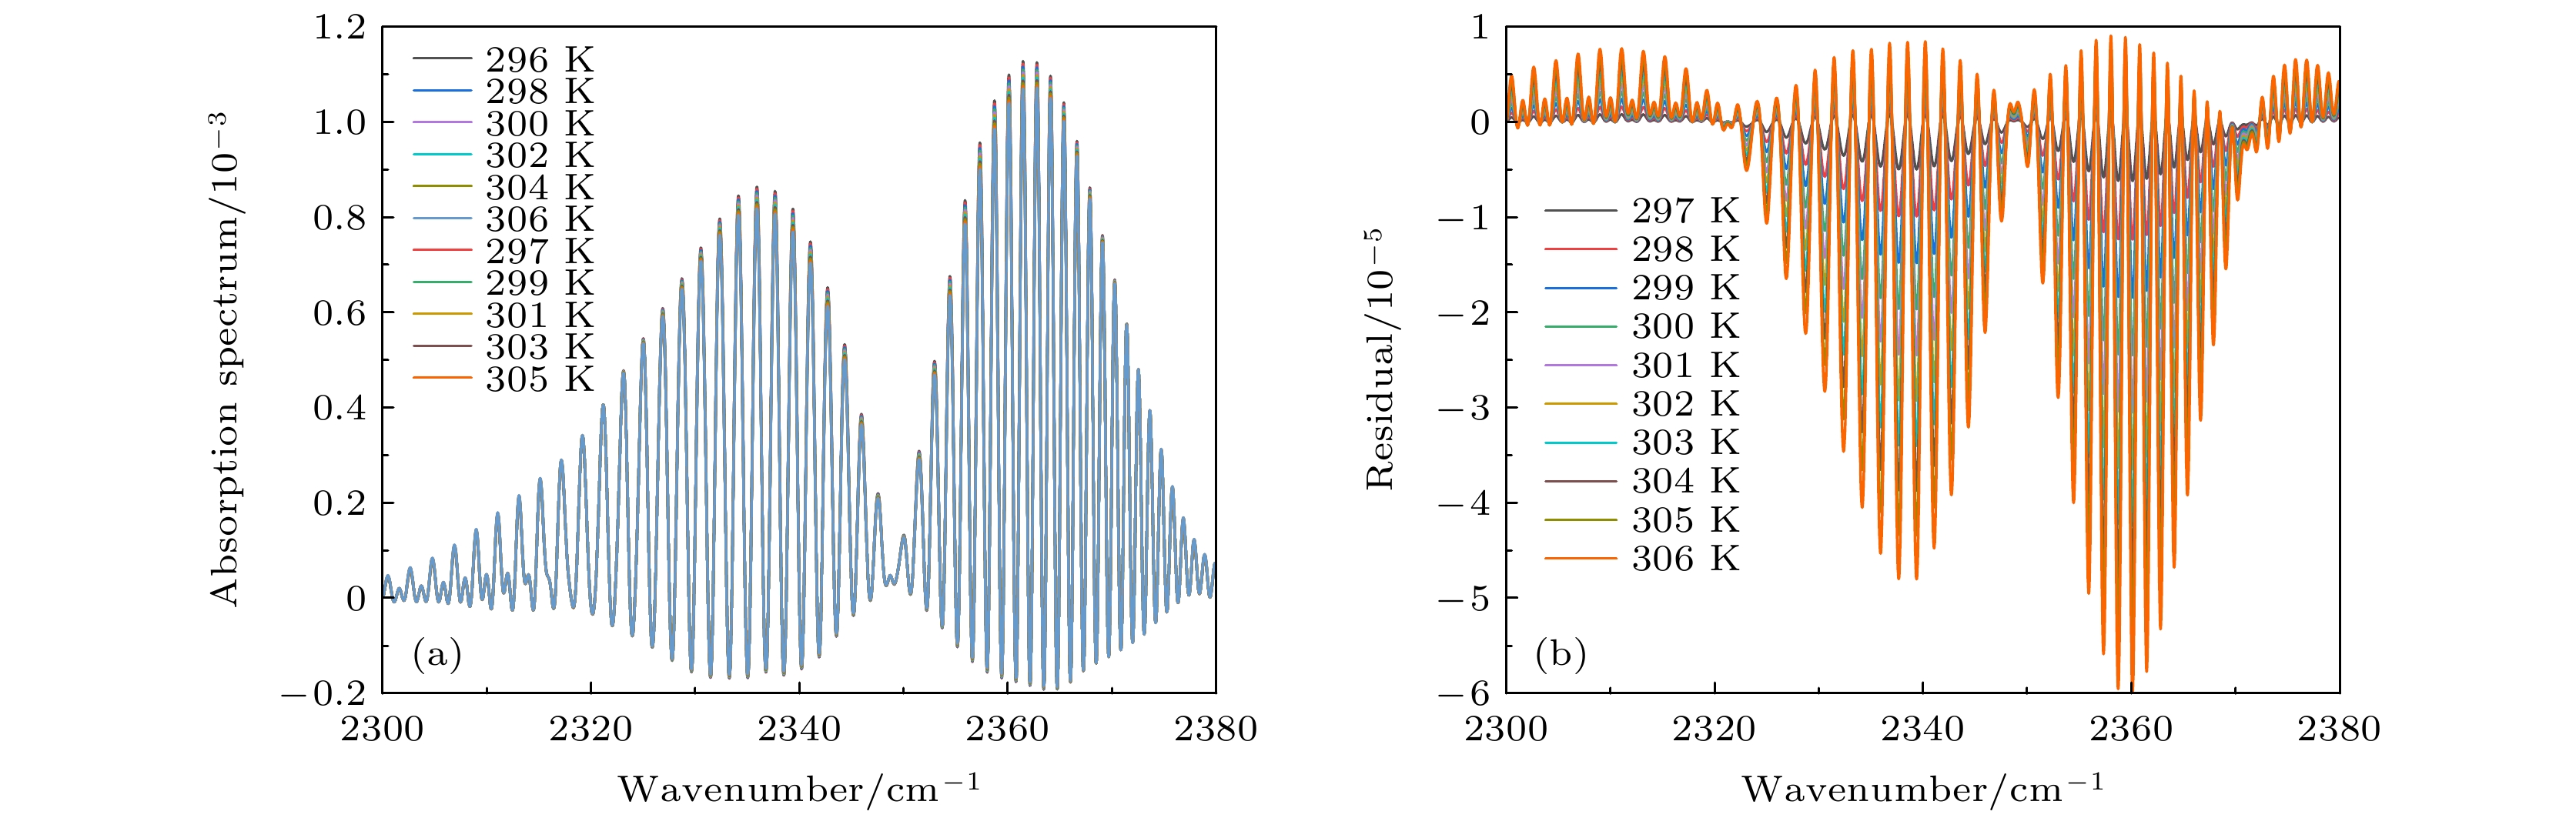 图 4 (a) CO2在2290—2380 cm–1的仿真吸光度谱Aij; (b) 297—306 K下仿真吸光度谱相比于296 K仿真吸收光谱在拟合波段的残差
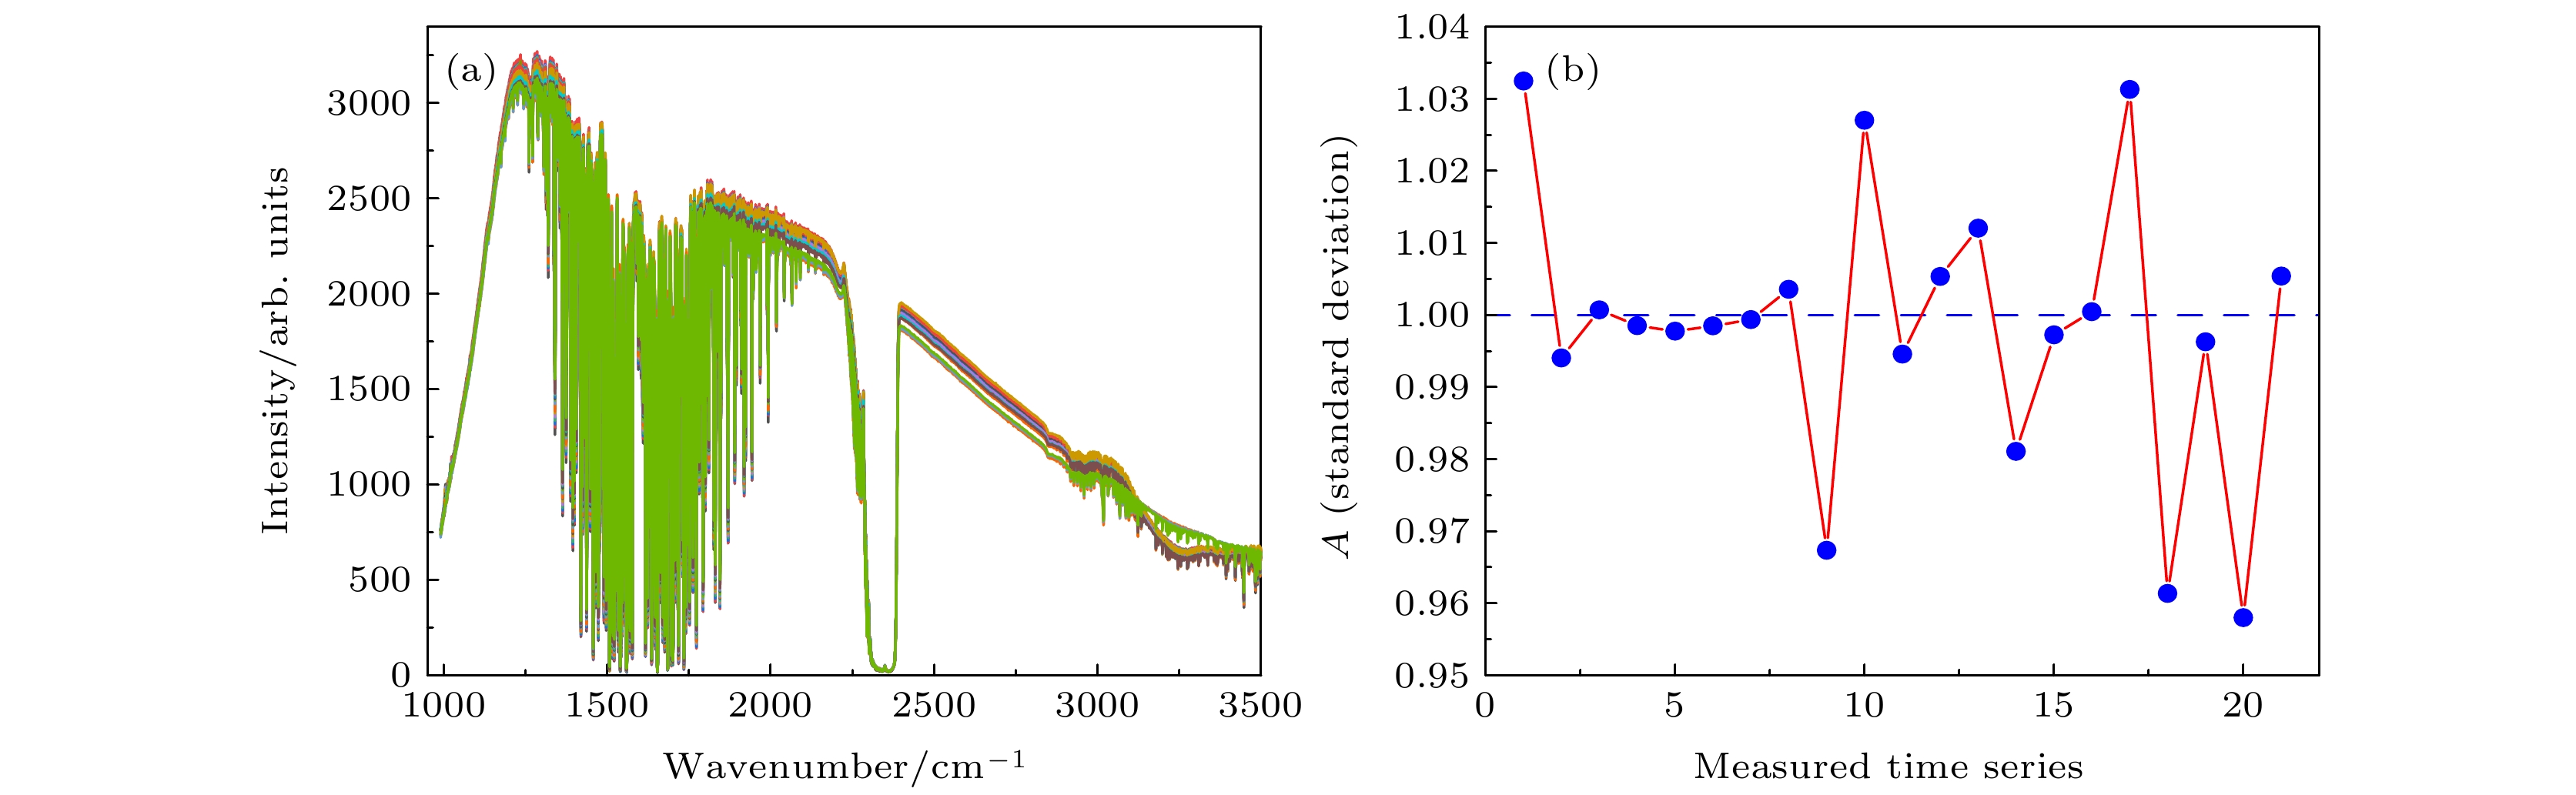 图 5 (a)光谱数据(1000—3500 cm–1); (b)光谱数据的一致性
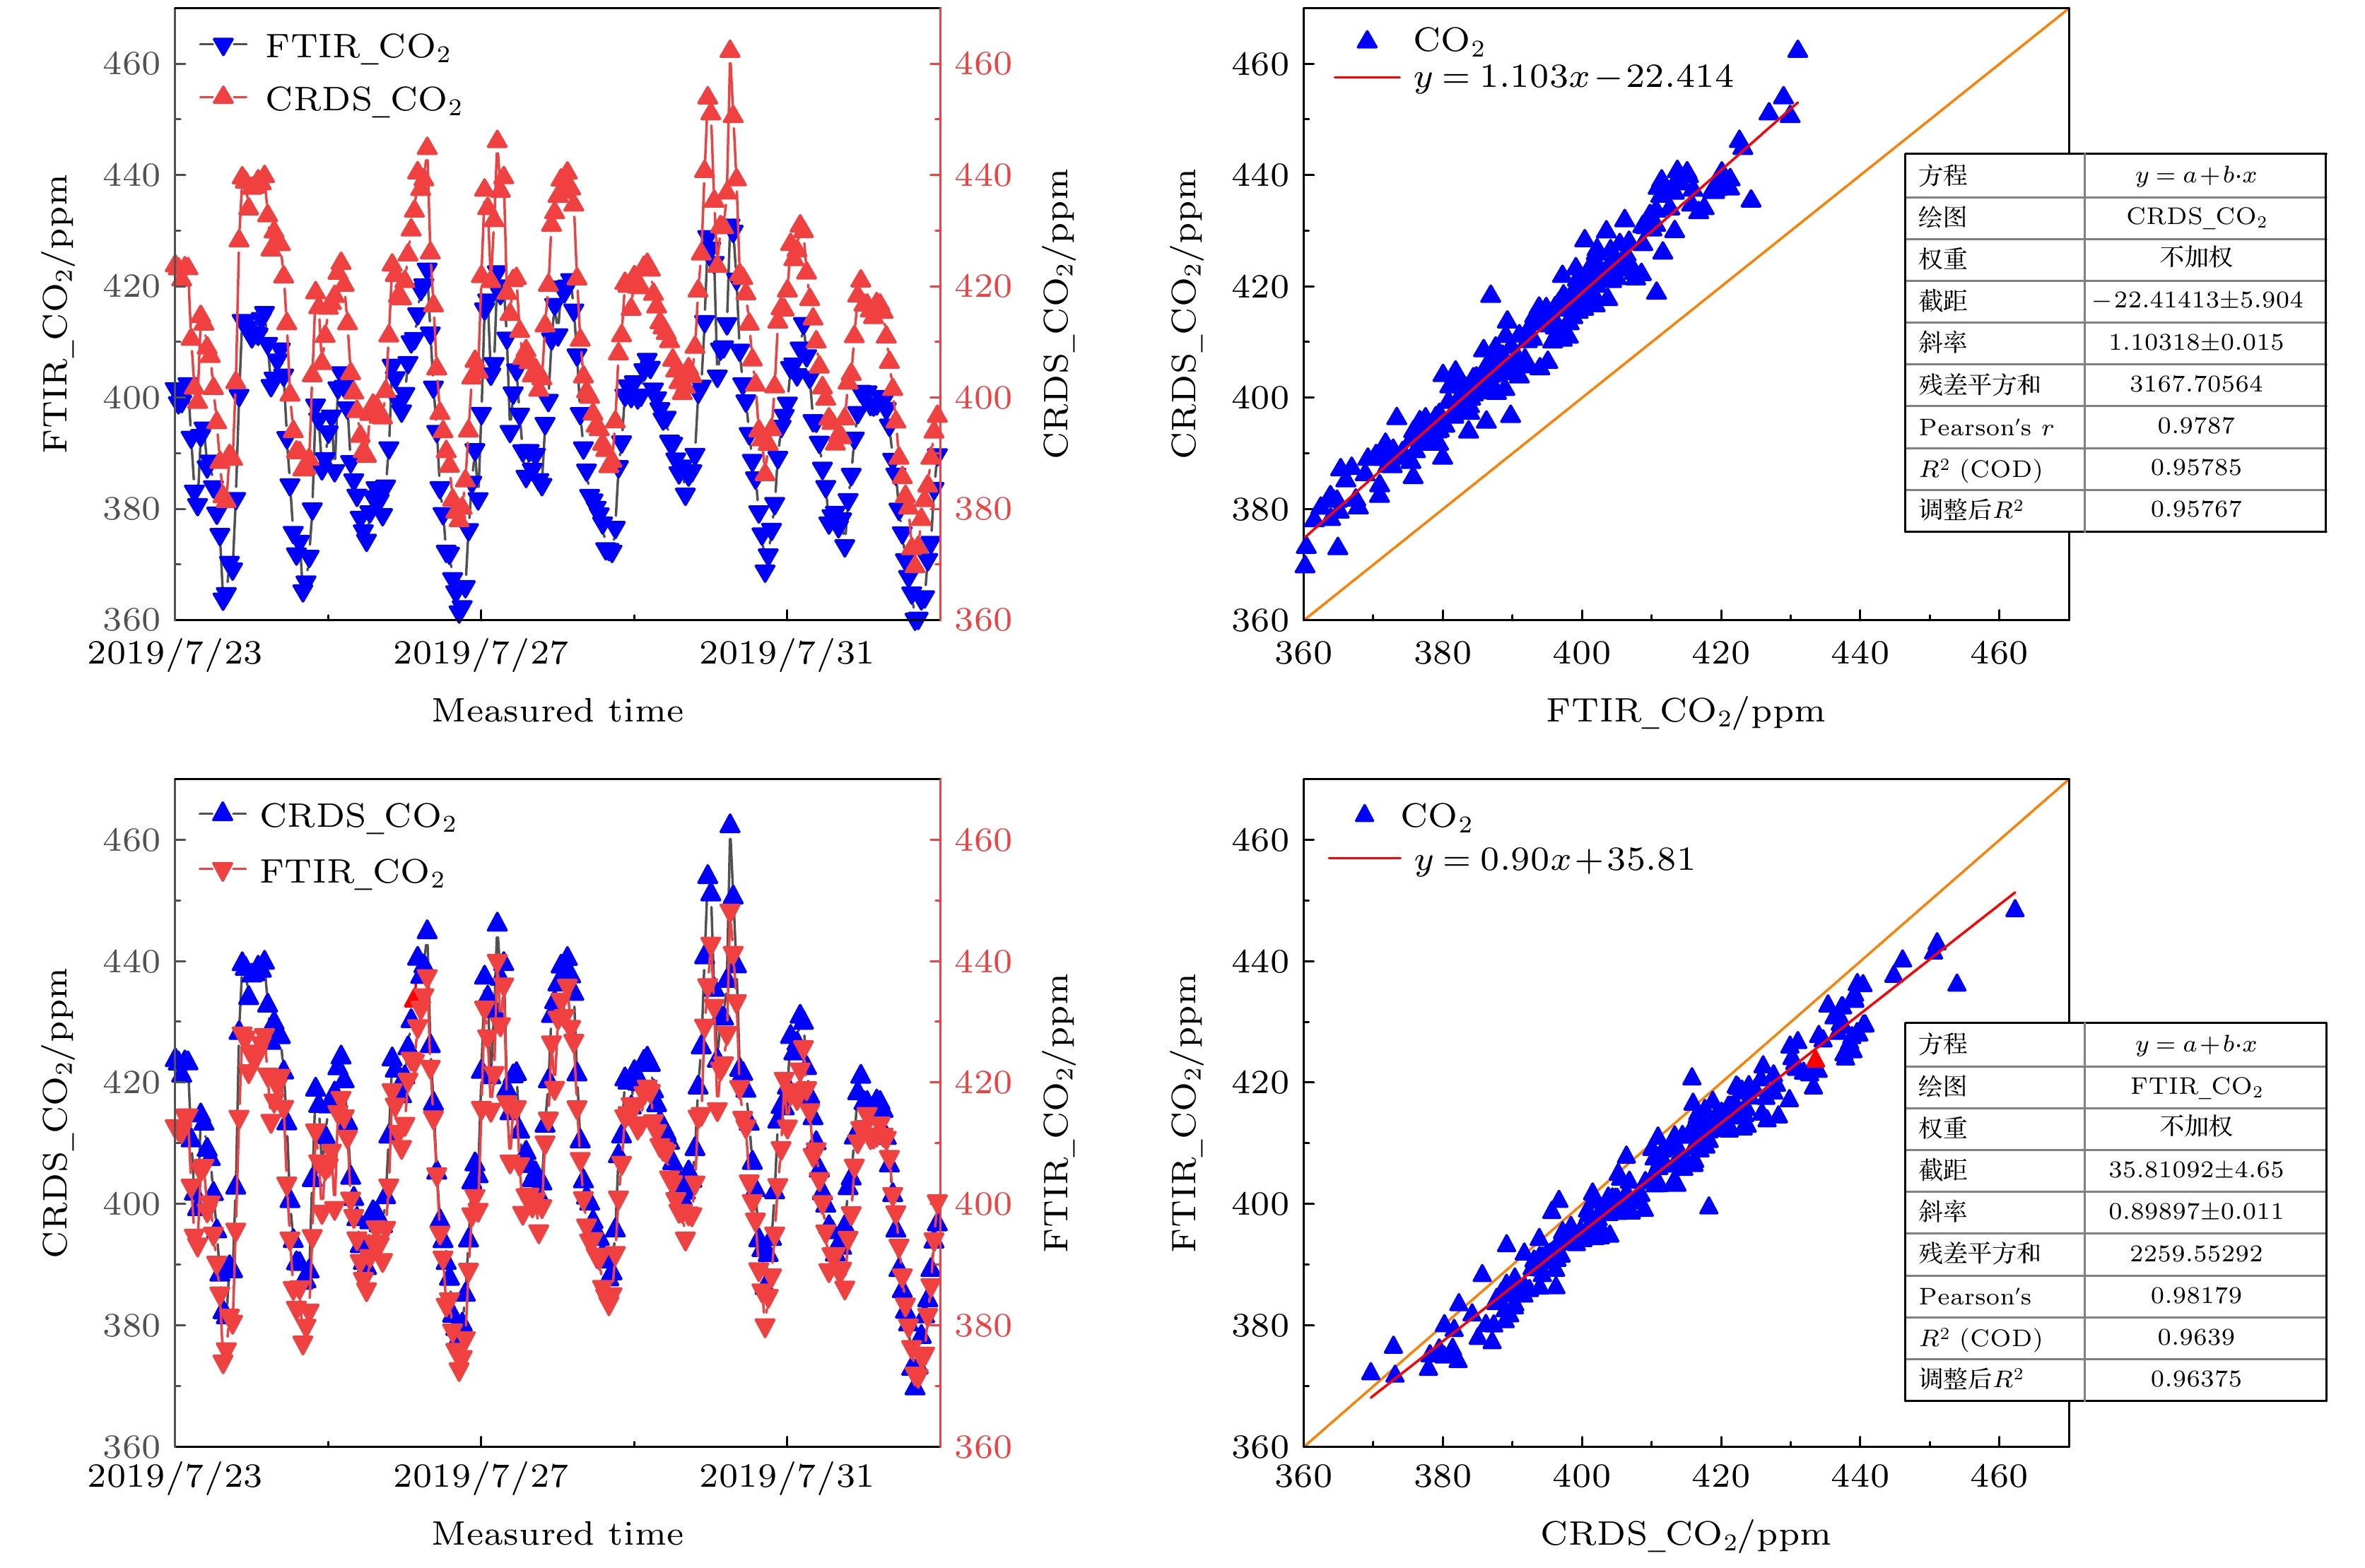 图 6 (a) CO2浓度趋势对比; (b) CO2浓度值线性拟合; (c)校准后CO2浓度趋势对比; (d)校准后CO2浓度值线性拟合