全文HTML
--> --> -->传统的“五行”“六体”识别方法对人参种类和质量的判断易受人为因素影响. 随着现代科技的发展, 通过对药效成分含量的测定来确定不同产地药材的差异是重要的中草药识别方法. 光谱技术因能客观地反映药材内在质量从而被广泛应用于中草药鉴定中, 常用的光谱检测方法主要有近红外光谱(near infrared spectroscopy, NIR)技术、拉曼光谱(Raman spectroscopy)技术、荧光光谱(fluorescence spectroscopy)技术等[3-6]. 常规的光谱技术由于光谱信号微弱很容易受到背景光的影响, 且检测样品时处理时间长且复杂, 无法实现实时、在线和快速检测. 因此, 亟需一种快速可靠的人参产地检测方法.
激光诱导击穿光谱技术(laser inducted breakdown spectroscopy, LIBS)是一种原子发射光谱技术[7-9], 适用于所有物质(气态、液态、固态), 具有快速、微损、样品准备简单和多元素同时探测等优点, 广泛地应用于爆炸物检测[10]、文化遗产[11]、生物医学分析[12]、土壤重金属检测[13]、地质分析[14]、食品安全[15]等领域. 利用LIBS技术和化学计量学方法结合可实现待测样品的分类识别. Junjuri和Gundawar[16]利用主成分分析(principal component analysis, PCA)方法和人工神经网络(artificial neural network, ANN)两种算法结合LIBS技术, 采用PCA方法对样品进行分析, 以主成分数据作为ANN的输入量实现了对5种消费塑料进行鉴定, 最终识别精确度为97%—99%; Velioglu等[17]利用LIBS结合PCA实现了纯下脚料和混合下脚料掺假牛肉样品的识别; Lin等[18]使用LIBS技术结合偏最小二乘(PLS-LDA)及支持向量机(support vector machines, SVM)方法实现了钢种的识别, 采用偏最小二乘支持向量机算法(LSSVM)将识别精度由96.25%和95%提高到了100%; Wang等[19]利用LIBS结合PCA算法和ANN算法对不同产地、不同部位的当归、党参、川芎3种中药材进行分析鉴定, 达到99.89%的识别精度; 郑培超等[20]利用随机森林分类模型结合LIBS技术对石斛进行价格等级分类, 利用袋外数据误差率估计随机森林在不同的决策树个数和分裂属性集中属性个数下的分类效果, 选取最优参数, 将平均识别率提高到了96.46%.
目前关于LIBS结合机器学习算法对人参产地分类还有待研究. 本文基于LIBS技术结合机器学习算法对人参产地快速识别, 首先通过PCA提取人参样品的LIBS光谱数据的特征量, 分别采用BP神经网络(back propagation artificial neural network, BP-ANN)算法、SVM算法建立人参产地识别模型, 对东北5个产地的同种人参(白参)进行聚类分析, 实现了人参产地的识别. 结果表明, LIBS结合机器学习方法是实现人参产地快速识别的有效方法.
2.1.实验装置
激光诱导击穿光谱技术用于人参产地识别的实验装置如图1所示. 激光光源为输出波长1064 nm, 脉宽10 ns, 重复频率10 Hz的Nd:YAG激光器(Continuum, surellite II), 激光光束直径为6 mm, 激光光束通过由半波片和格兰棱镜组成的能量调节系统对诱导击穿人参等离子体的脉冲能量进行调控, 激光光束经焦距为120 mm的熔石英玻璃平凸透镜聚焦在人参样品表面诱导击穿产生等离子体. 激光光束聚焦焦点位于人参样品表面内0.8 mm, 目的为避免诱导击穿空气等离子体, 减少对人参光谱分析带来干扰. 在与人参等离子体膨胀轴向方向成45°的人参等离子体发射光谱方向上, 用焦距为75 mm的熔石英透镜收集耦合人参等离子体发射光谱耦合到配有ICCD探测器(1024 × 1024 pixel, DH334)的中阶梯光栅光谱仪(Andor, Me5000)的光纤探头, 光谱仪焦距为195 mm, 光谱分辨率为
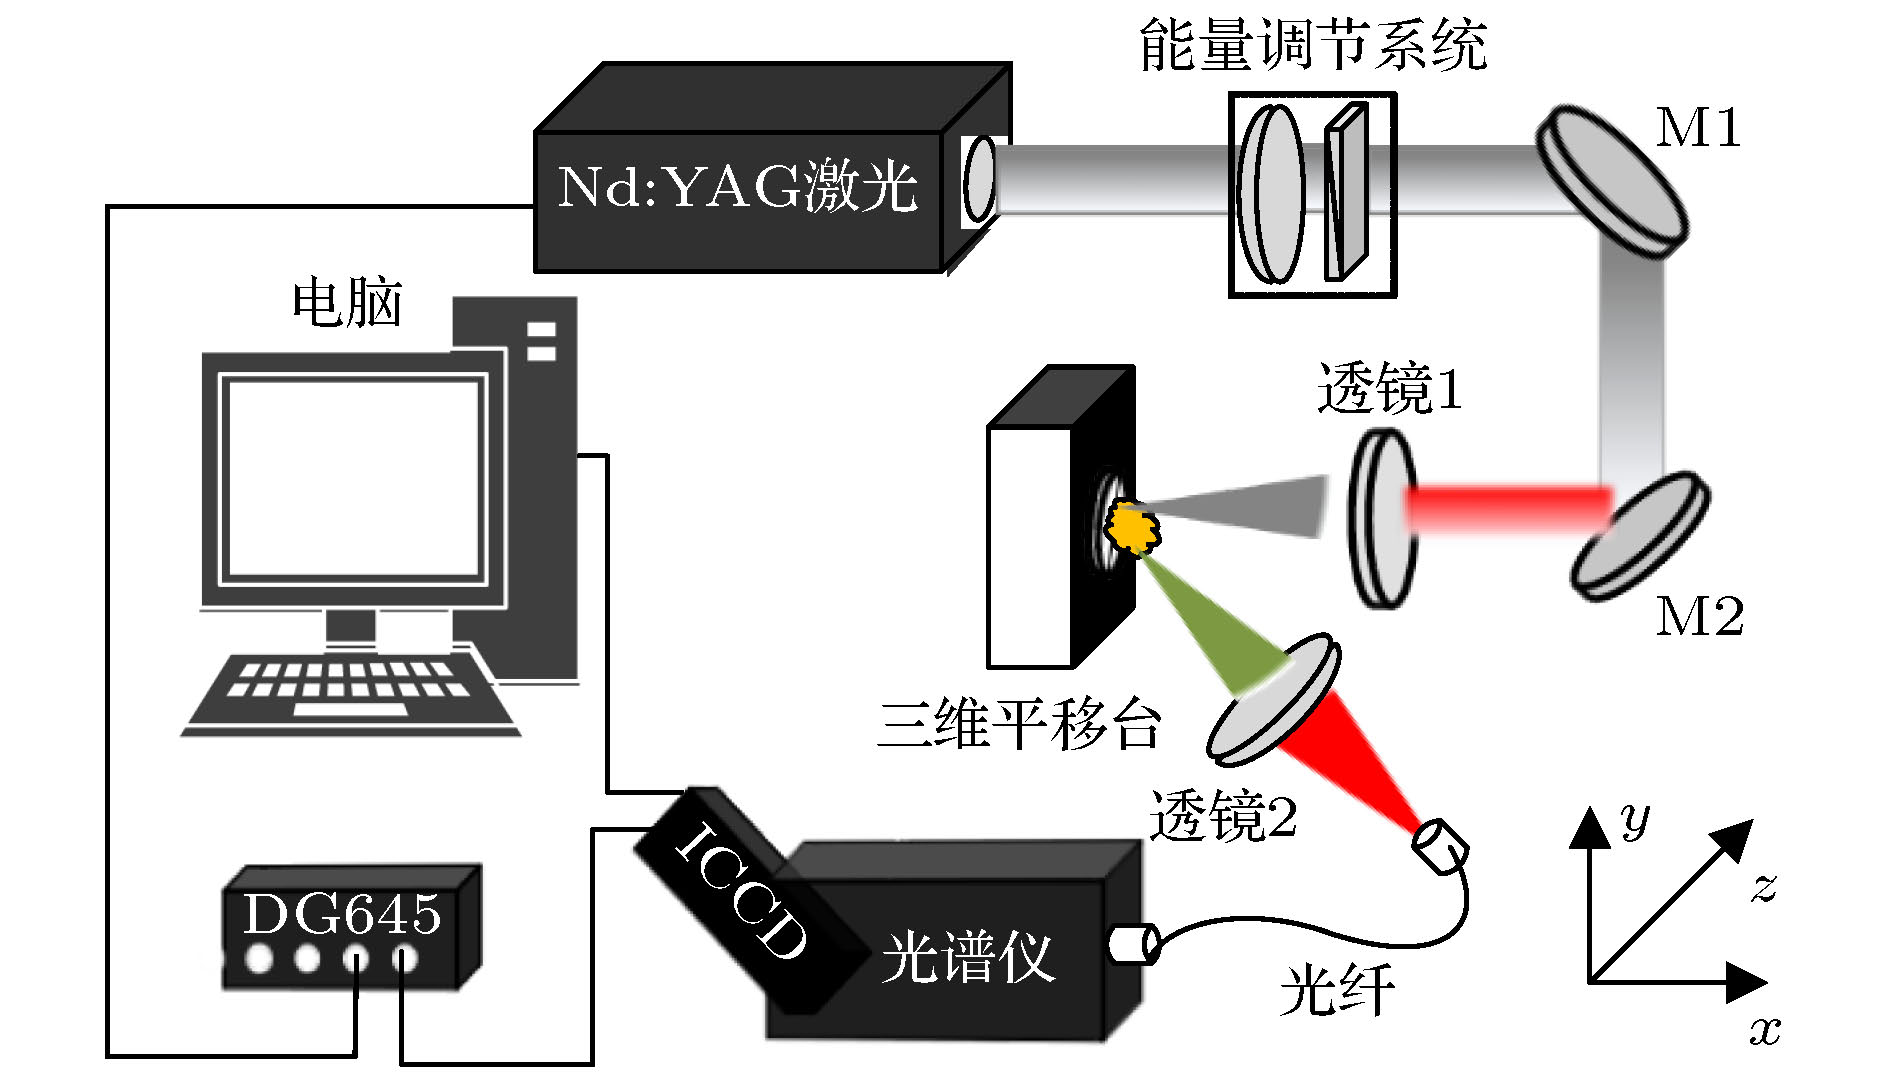 图 1 激光诱导击穿光谱实验装置示意图
Figure1. Schematic diagram of the experimental setup of LIBS.
2
2.2.样品制备
实验所用的人参样品均为生长年限15年的白参, 产地分别为辽宁省石柱(SZ)、恒仁(HR), 黑龙江省大兴安岭(DXAL), 吉林省抚松(FS)、集安(JA). LIBS光谱信号受样品密度、干燥度及研磨均匀性等物理属性的影响, 在实验前先对5个产地的人参样品进行纯净、干燥处理, 取干燥后的人参中间支干部位, 使用振动研磨机(安合盟(天津)科技发展有限公司, PrepM-01)研磨至粉末, 分别经50目和100目过筛, 取1.5 mg样品过筛人参粉末, 使用机械压片机(安合盟(天津)科技发展有限公司, FW-40)在25 MPa压力下压制25 min, 制成直径30 mm、厚度为2 mm的圆形人参样品, 用于人参产地识别实验样品.2
2.3.主成分分析算法
主成分分析(principal component analaysis, PCA)算法是一种数据降维的高效信息处理方法, 它采用特征分解获得最大方差的主成分代替原来变量, 可以消除原变量的相关性, 降低数据的维数, 提高建模速度和稳定性. PCA分析方法为将人参样品LIBS光谱的采样值整理并代入向量


2
2.4.BP神经网络算法
误差反向传播(back-propagation algorithm, BP)神经网络[21]是一种按误差逆传播算法训练的多层前馈网络, 它利用大量的数据进行训练获得输入与输出间的映射关系, 再通过梯度下降法不断调整网络的权值和阈值, 使网络的误差达到最小. 图2为典型的BP人工神经网络结构示意图. 网络


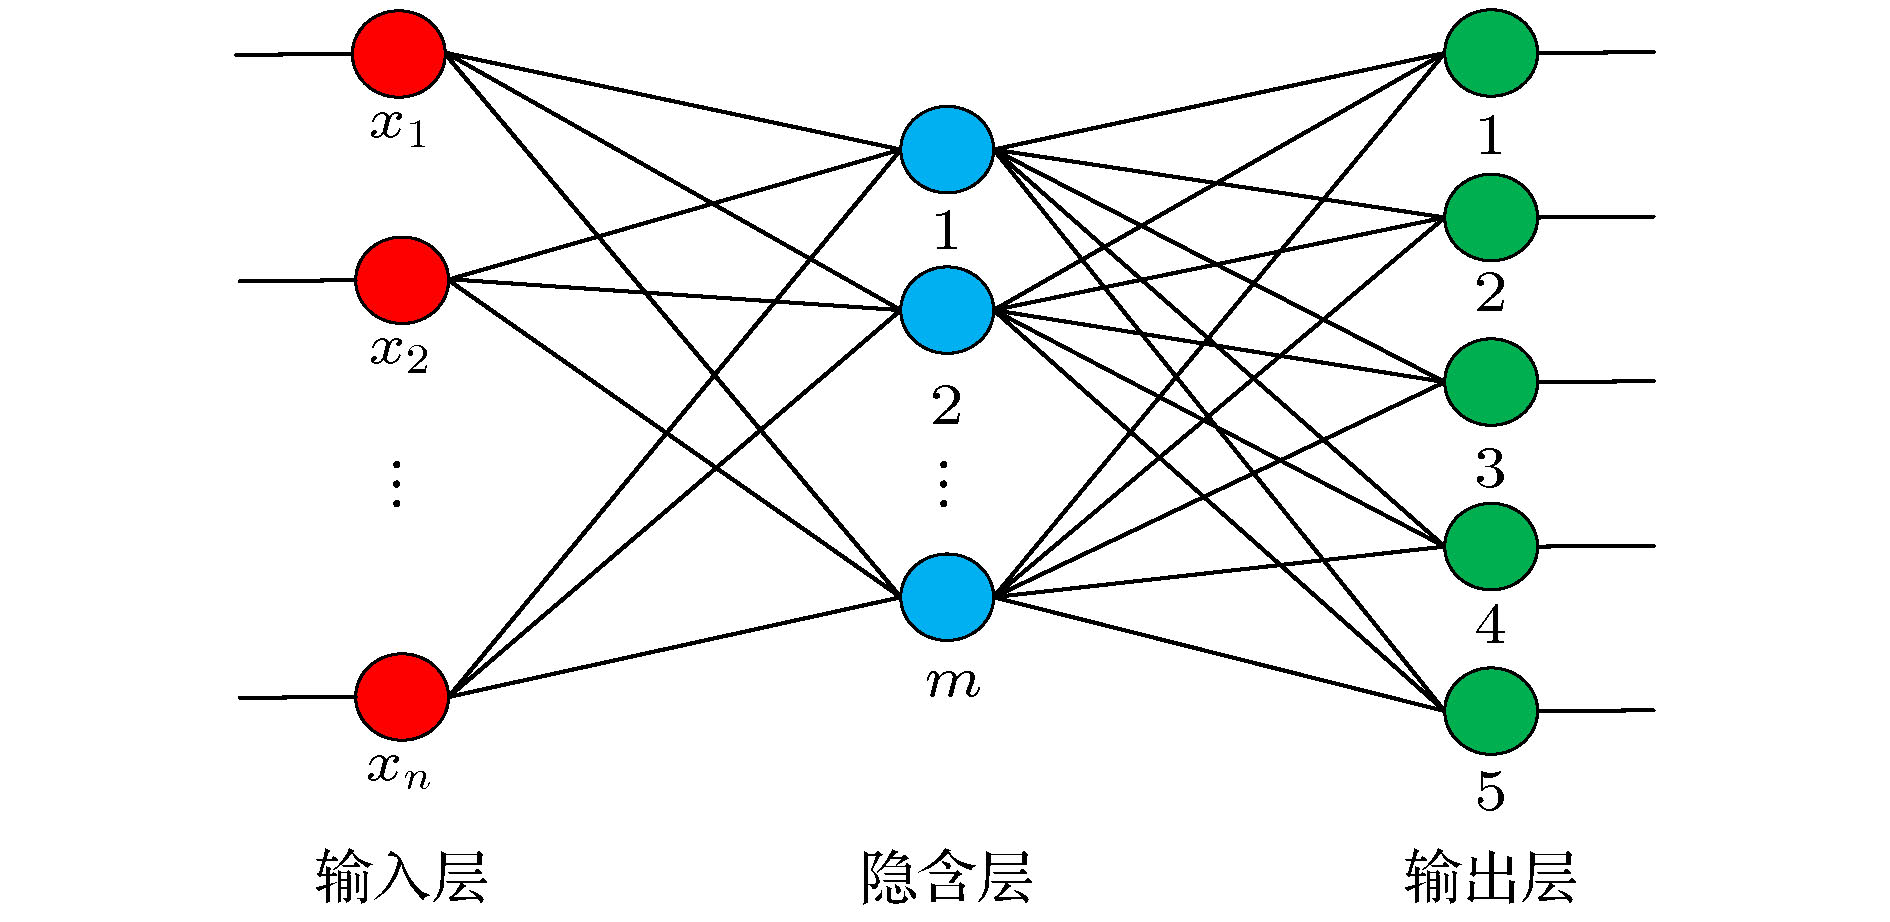 图 2 BP神经网络结构示意图
Figure2. Structure of BP neural network.
BP神经网络通常由输入层(input layer)、输出层(output layer)、一个或多个隐含层(hidden layer)组成. 传递函数对误差和训练时间会有很大的影响, 合理地选择传递函数能够降低网络误差, 四种传递函数为trainlm, trainda, traindm, Traindx. 激活函数以及传递函数的确定需要根据训练数据来进行测试、对比与筛选. 在进行BP神经网络仿真前, 还需要先进行LIBS光谱数据的训练集和测试集选择, 从而能够快速实现人参产地鉴定识别.
2
2.5.SVM算法
支持向量机[22] (support vector machine, SVM)实现分类的本质是找一条分割线, 将所有样本点尽可能远离分割线, 即最优超平面. 设训练样本集


分类超平面


3.1.特征光谱的选取
进行人参产地识别, 需要考虑实验待测产地人参的LIBS全光谱信息, 但LIBS全光谱信息量很大, 进而导致机器学习算法计算量过大, 从而人参产地的识别快速性不能得到保证. 为此, 选取合适的特征谱线代表人参样品的全光谱信息, 从而实现快速人参产地识别尤为重要. 激光诱导人参的等离子体发射光谱由线状光谱叠加在连续光谱上组成, 连续背景光谱的存在, 导致了LIBS光谱的信背比变低, 本文采用窗口平移平滑法降低背景连续光谱, 5个产地人参的激光诱导击穿光谱如图3所示. 根据美国NIST原子光谱数据库对人参LIBS光谱进行了元素标记, LIBS光谱中存在Mg, Ca, Fe等矿质营养元素以及C, H, N, O等人参组成元素的原子发射光谱. 不同产地人参中元素含量不同, 对应的LIBS特征谱线强度有一定的差异, 因而通过多条元素特征光谱强度可对人参产地进行识别. 特征光谱的选择应满足光谱线的重叠少、自吸收现象弱、谱线强度大(信背比高)等条件, 最终选取Mg, Ca, Fe, C, H, N, O共7个元素8条特征谱线进行人参产地识别(特征谱线信息如表1所列). 图 3 人参LIBS光谱(产地分别为大兴安岭、集安、恒仁、石柱、抚松)
Figure3. LIBS spectra of ginseng(the ginseng origins are DXAL, JA, HR, SZ and FS).
| 元素 | 波长/nm |
| C I | 247.80 |
| Mg II | 279.56 |
| Ca II | 393.40; 396.87 |
| Fe I | 422.71 |
| H I | 656.39 |
| N I | 747.07 |
| O I | 777.42 |
表1人参特征谱线及波长
Table1.Characteristic line and wavelength of ginseng.
在LIBS实验过程中, LIBS光谱强度受到外部气体流动、激光脉冲能量抖动及样品表面元素含量的变化等因素影响, 从而导致在给定实验条件下的LIBS光谱强度存在一定的起伏, 这将对依据LIBS光谱谱线强度作为元素定量分析产生一定的误差. 因此, 选取LIBS光谱中多次重复性实验较为稳定且光谱强度值较大的特征谱线进行LIBS光谱强度归一化处理, 能够有效降低外部实验环境等因素造成的LIBS光谱强度起伏对定量分析的影响. 本文人参样品LIBS光谱中Ca I 393.40 nm特征谱线强度最大, 且多次重复实验的光谱强度稳定, 因此选取谱线强度最大的Ca I 393.40 nm作为归一化标准. 为降低谱线强度波动对分类结果的影响, 每个LIBS光谱中的8条特征谱线强度均以Ca:393.40 nm光谱强度作归一化处理, 最终得到5个产地人参的657组数据(DXAL 117组、JA 150组、HR 153组、SZ 96组、FS 141组), 每组数据有8个属性, 作为PCA的输入:

2
3.2.主成分分析
由PCA分析出人参LIBS光谱中Mg, Ca, Fe, C, H, N, O共7个元素8条特征谱线对LIBS全谱的主成分贡献情况, 得到前10个主成分的贡献率和主成分的累计贡献率如图4(a)所示, PC1, PC2 和 PC3主成分累计贡献率为92.5%, 可认为PC1, PC2, PC3包含了原始人参LIBS光谱的大量信息. PC1, PC2 和 PC3 3个主成分向量组成的三维散点图如图4(b)所示. 图4中每个散点代表一个人参样本, 可以看出同产地人参样品的特征LIBS光谱经PCA处理后存在特定的聚集区域, 显示了良好的聚类效果. 结果表明结合PCA处理后的LIBS光谱数据能够表征人参的产地特征信息, 且能将不同产地人参间的差异进行有效区分. 由图4(b)可知, HR, FS和DXAL等产地人参的聚类性较好, 相互之间区分度高, JA和SZ产地人参样品也可聚在一起, 但存在部分重叠.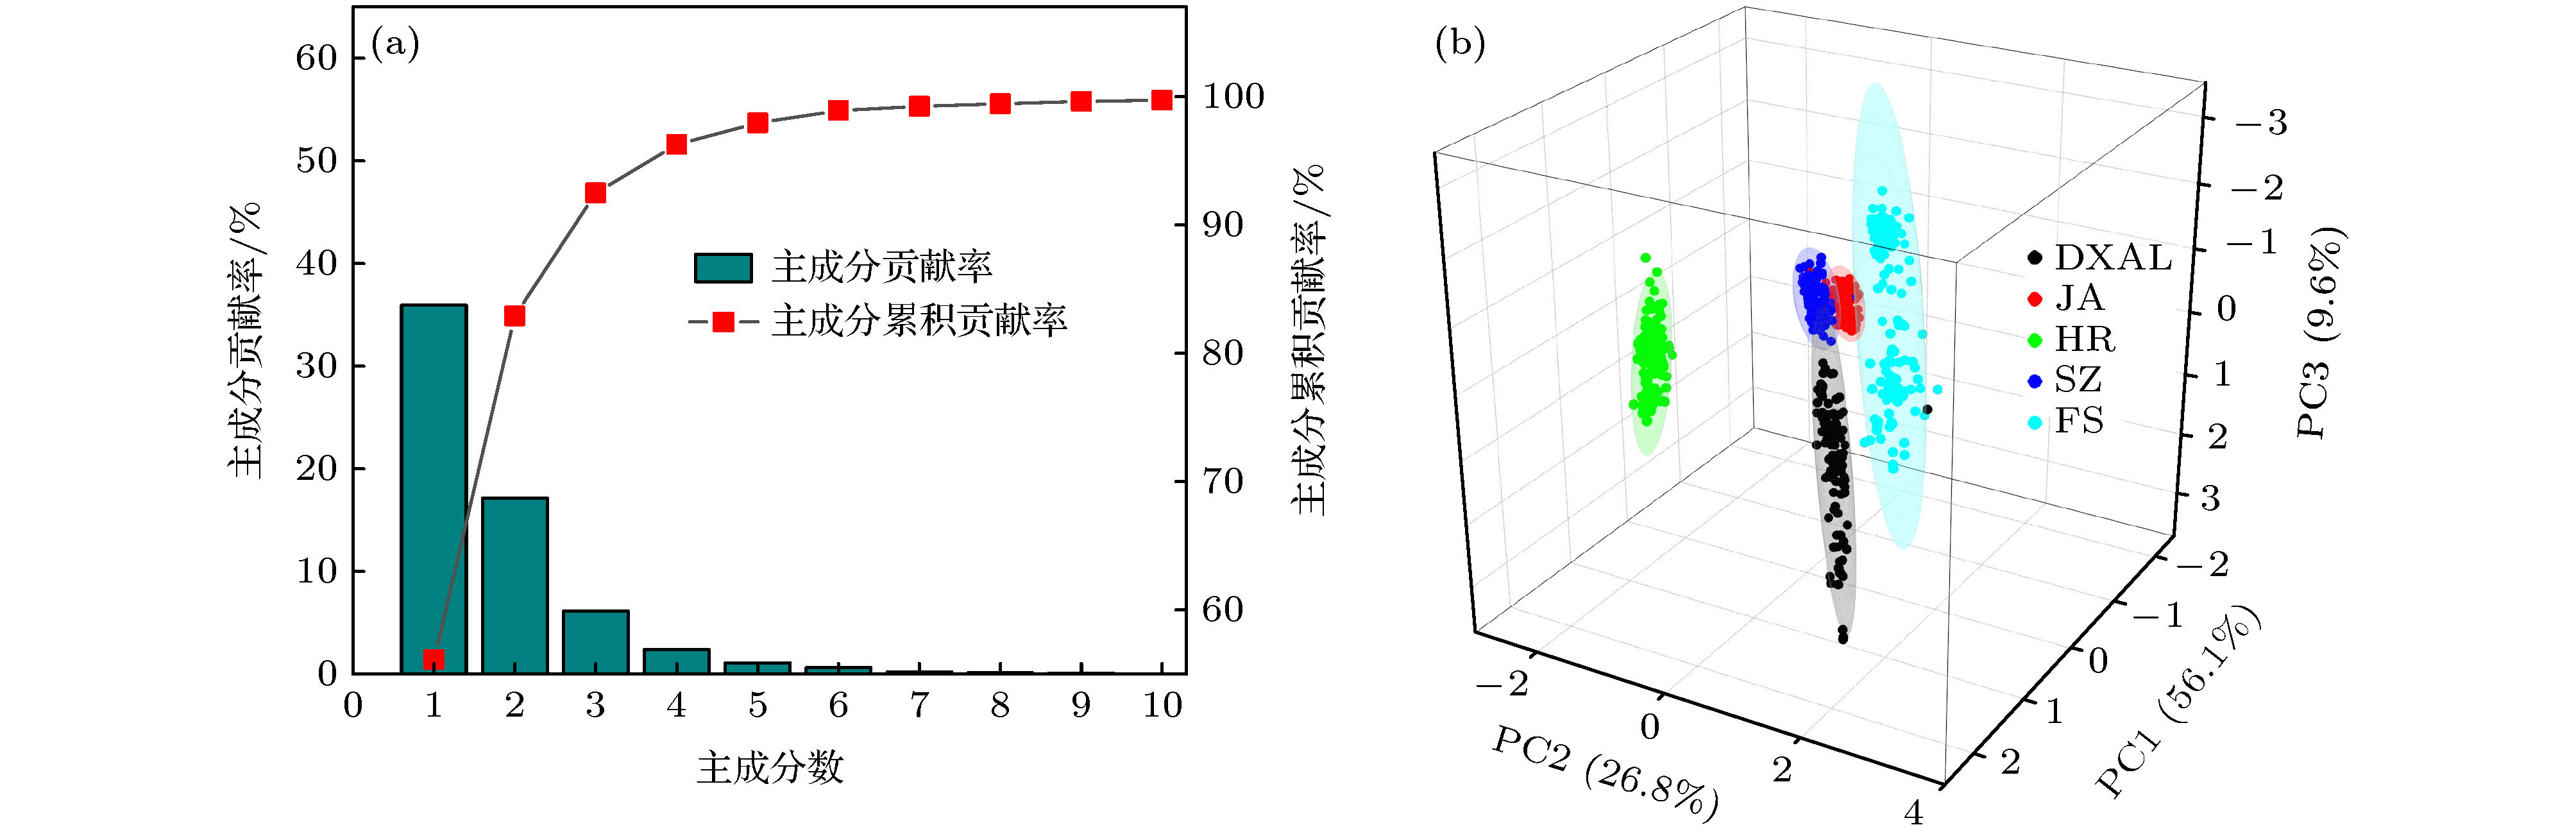 图 4 (a)各主成分贡献率和主成分累积贡献率; (b)前3个主成分的三维散点图
Figure4. (a) Contribution rate of each principal component and cumulative contribution rate of principal component; (b) three-dimensional scatter plot of first three principal components.
2
3.3.结合机器学习对人参产地进行识别
通过PCA算法对5个人参产地、共657组LIBS数据进行光谱数据降维处理, 优化PCA算法参量, 实现PC1, PC2 和 PC3前3个主成分累计贡献率为92.5%, 就以PC1, PC2 和 PC3主成分代替人参的LIBS特征光谱, 从而构建出人参样品LIBS光谱的特征空间向量, 特征向量构成的

图5(a)为BP神经网络最佳验证性能图, 训练误差随训练次数不断减小, 测试均方差(MSE)也趋于平缓, 验证曲线MSE不再变化时网络训练截止, 网络性能最佳坐标为(28, 0.03), 达到了最佳网络识别精度. 在此基础上, 以BP神经网络机器学习对人参产地分类结果如图5(b)所示, 图中“*”表示测试标签, “○”表示实际标签. 当“*”和“○”重合时表明预测准确, 结果显示有2个JA产地的人参被误判为SZ产地, 其他产地100%识别, 平均识别精度达到99.08%, 人参产地识别算法模型运行时间为2.48 s, 同时结果表明神经网络收敛性良好, 误差个数稳定, 高质量地实现了人参产地判别.
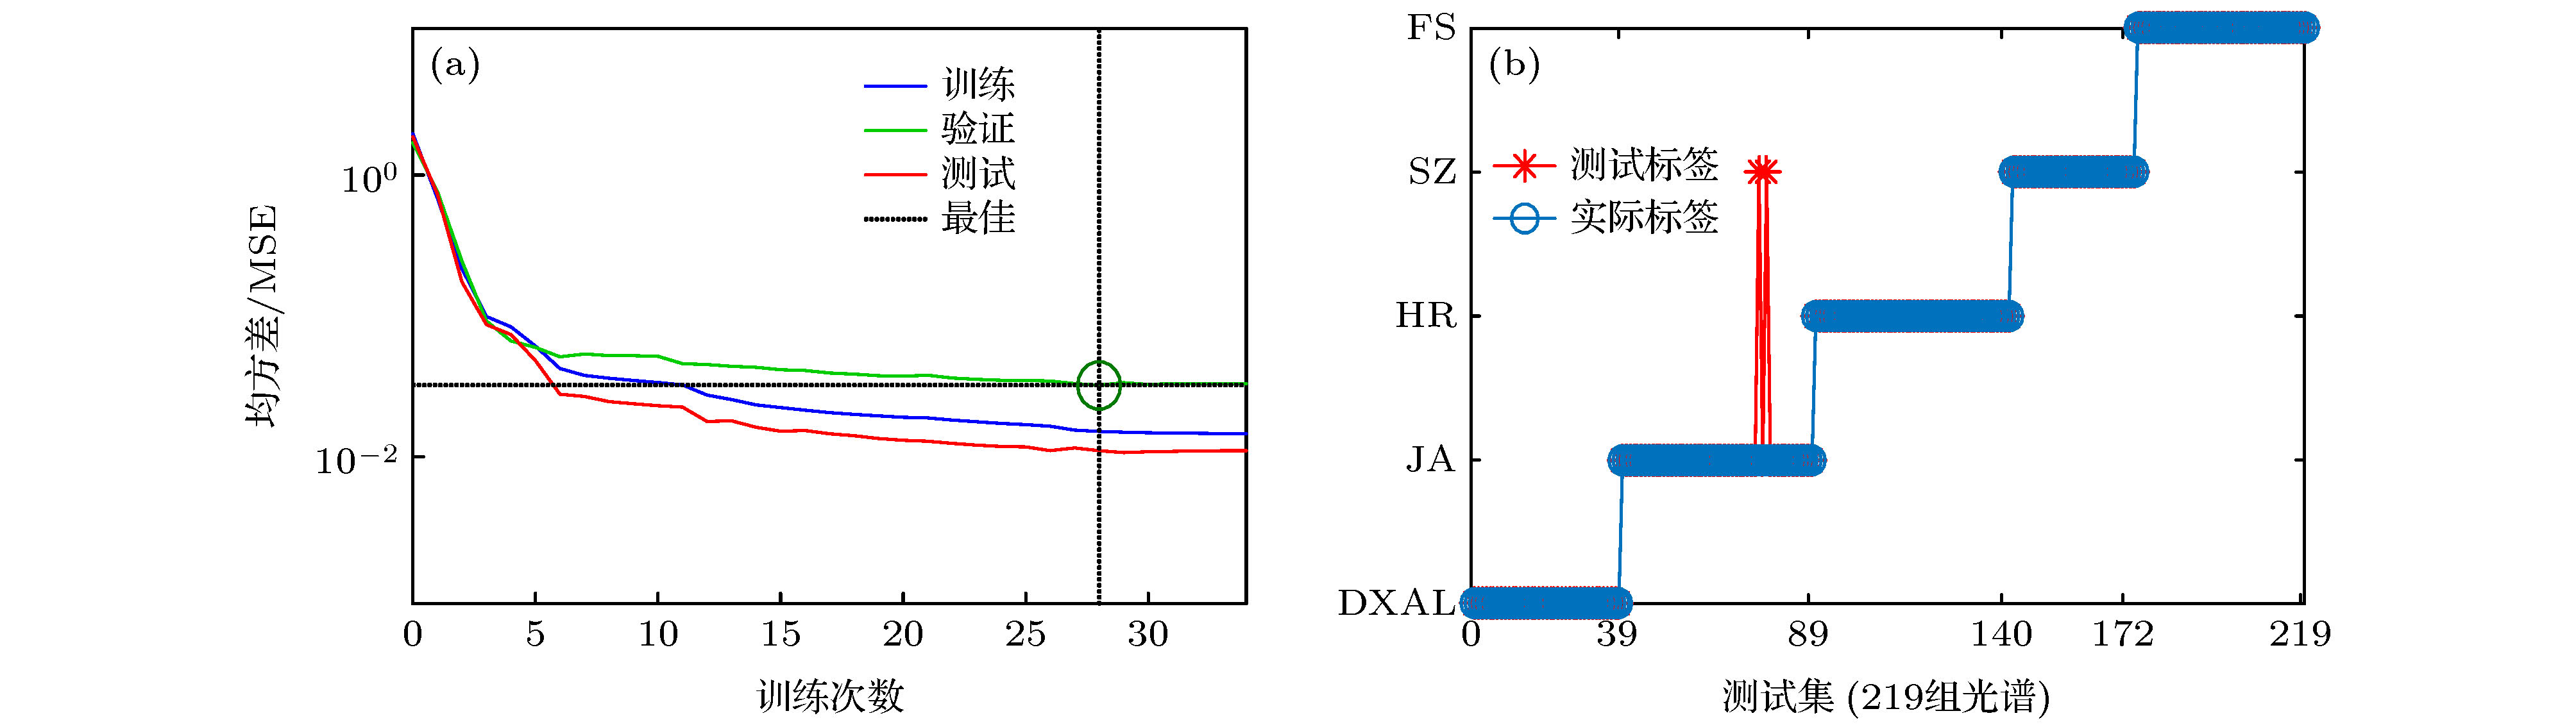 图 5 (a) BP神经网络训练性能曲线; (b) 分类结果图
Figure5. (a) BP neural network training performance curve; (b) classification results.
人参产地识别的SVM算法的数据选取经主成分降维处理的657组数据, 建立与BP神经网络算法相同的训练集和测试集, 使用交互检验法优化参数, 得到PCA-SVM的网格参数优化如图6(a)所示. 图6(a)的x, y轴分别表示C, g取以2为底的对数的值, 使用网格搜索方法的分类(SVC)参数计算出最佳惩罚因子

 图 6 (a) PCA-SVM网格参数优化; (b)分类识别结果图
Figure6. (a) PCA-SVM grid parameter optimization; (b) classification recognition result graph.
PCA-BP, PCA-SVM分类算法对人参产地的识别结果如表2所列. 由LIBS技术结合机器学习的研究结果可知, PCA-BP和PCA-SVM两种分类算法的分类精度均达到了99%以上, 实现了目标分类精度, 但在JA人参产地的识别上均发生了一定数量的误判. 在算法模型运行时间上, PCA-BP算法和PCA-SVM算法的人参产地识别运算时间分别为2.48和14.03 s, PCA-BP算法相对于PCA-SVM算法的建模速度快了11.545 s, 有明显优势. 主要原因可能为BP神经网络算法具有自主学习能力, 而SVM算法需通过核函数将非线性问题实现线性的转化, 识别能力依靠分类超平面的划分, 需寻找最优的核函数以满足识别精度要求, 因而建模时间较BP神经网络算法慢.
| 算法 | 测试集识别结果 | 平均识别精度 | 建模时间/s | |
| 产地 | 识别精度 | |||
| PCA-BP | DXAL | 100% | ||
| JA | 96% | |||
| HR | 100% | 99.08% | 2.48 | |
| SZ | 100% | |||
| FS | 100% | |||
| PCA-SVM | DXAL | 100% | ||
| JA | 98% | |||
| HR | 100% | 99.5% | 14.03 | |
| SZ | 100% | |||
| FS | 100% | |||
表2人参产地识别结果对比
Table2.Comparison of ginseng origin identification results.
人参的品质主要由人参皂苷及人参多糖的含量决定, 人参皂苷是固醇类化合物, 人参中皂苷和多糖主要由C, H, O等元素决定. 通过分析5个产地人参C I 247.8 nm, H I 656.39 nm, O I 777.42 nm元素在Ca II 394.2 nm元素谱线强度下的归一化强度结果如图7所示. 可以看出, JA和SZ两地人参在组成成分上虽因产地的不同导致金属元素的原子发射谱线强度存在差异, 但其H I 656.39 nm与O I 777.42 nm两条谱线强度的归一化强度几乎相同, 从而导致JA和SZ人参产地分类时发生误判.
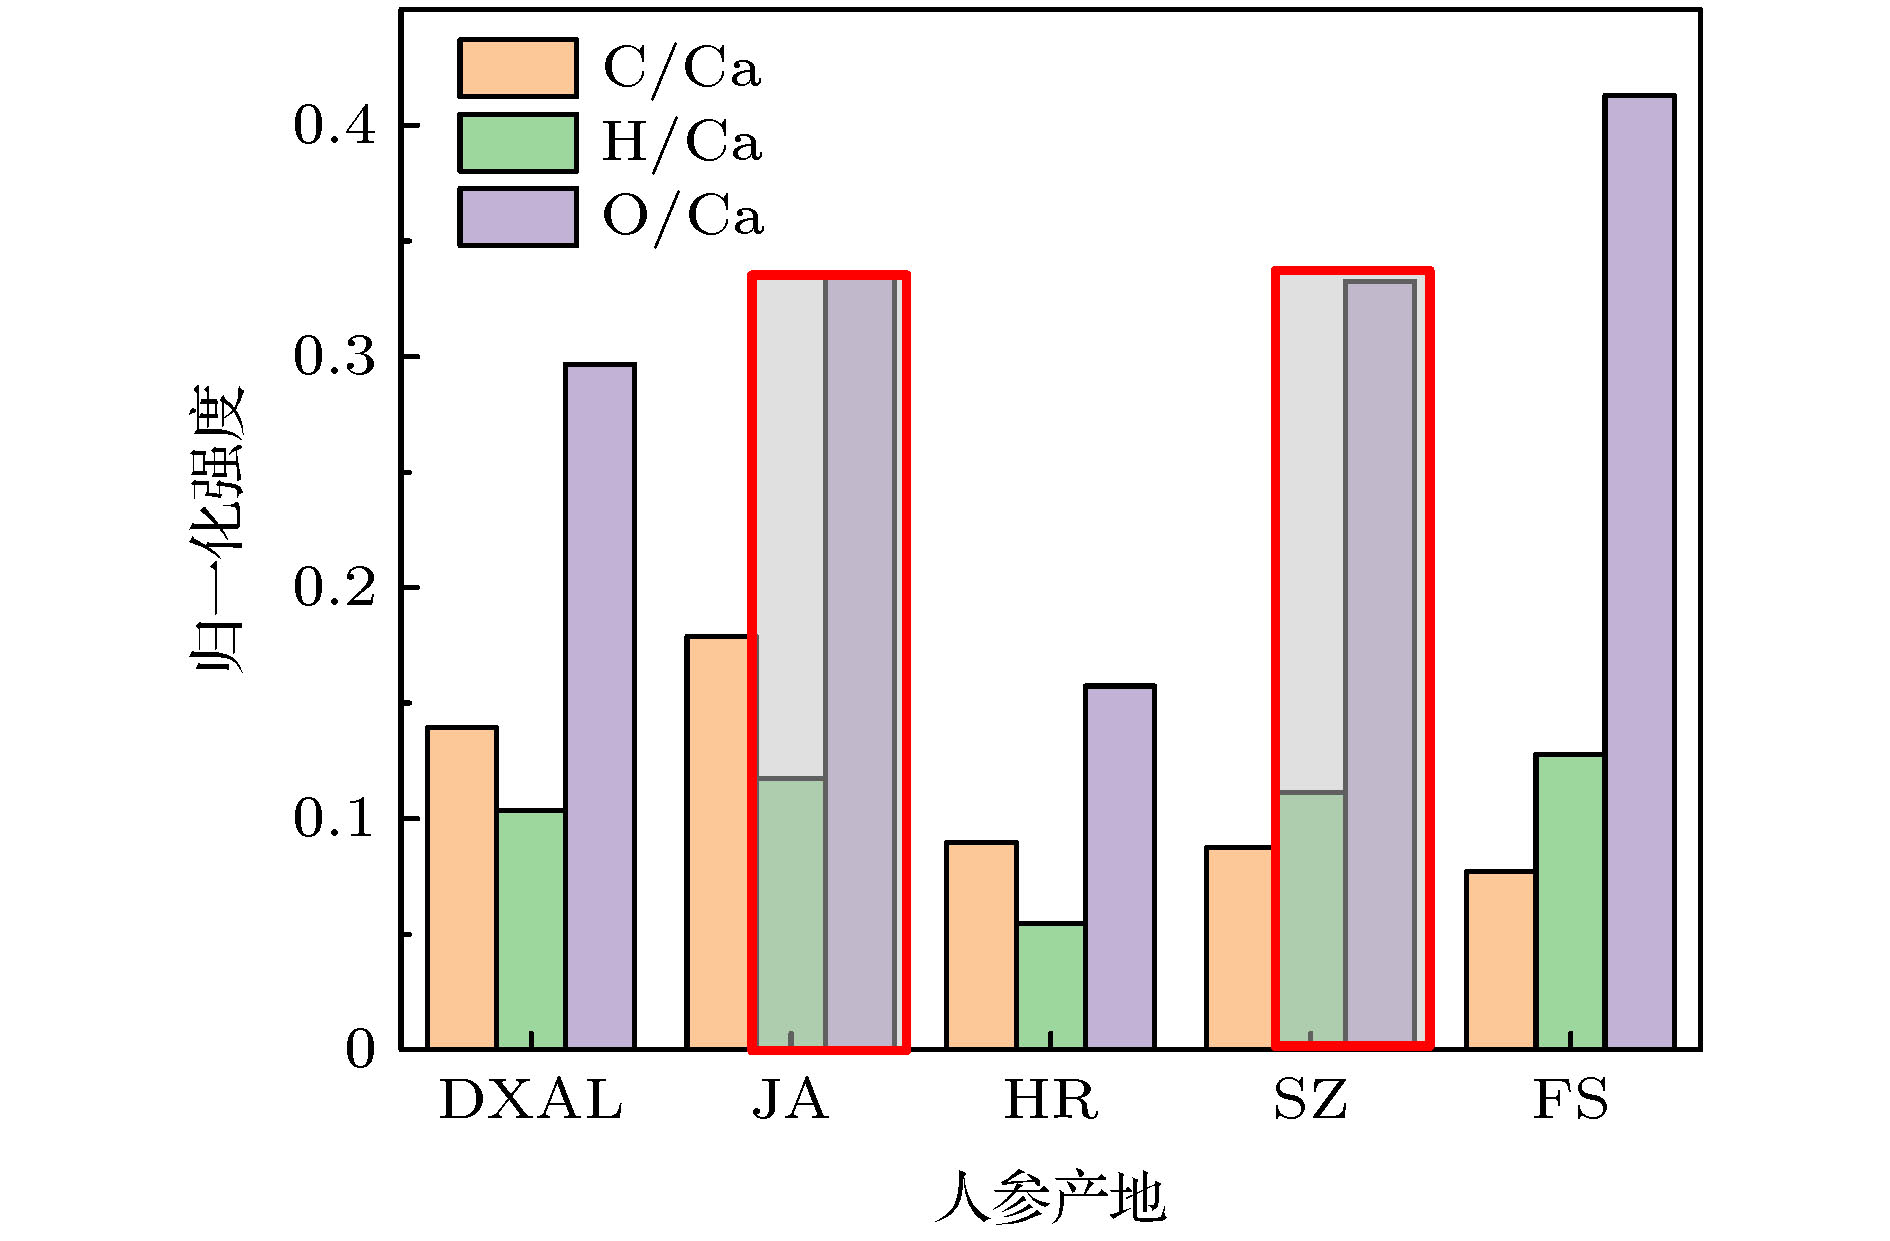 图 7 人参LIBS谱中C, H, O元素谱线的归一化强度比
Figure7. Normalized intensity ratios of C, H and O element lines in the LIBS spectrum.
