1.State Key Laboratory of Quantum Optics and Quantum Optics Devices, Institute of Laser Spectroscopy, Shanxi University, Taiyuan 030006, China 2.School of Mathematics and Physics, Jinzhong University, Jinzhong 030619, China 3.Collaborative Innovation Center of Extreme Optics, Shanxi University, Taiyuan 030006, China
Fund Project:Project supported by the National Basic Research Program of China (Grant No. 2017YFA0304203), the Key Program of the National Natural Science Foundation of China (Grant No. 61835007), the National Natural Science Foundation of China (Grant No. 61575115), the Program for Changjiang Scholars and Innovative Research Team in University of Ministry of Education of China (Grant No. IRT_17R70), the 111 Project (Grant No. D18001), and the Project for Shanxi ‘‘1331 Project” Key Subjects Construction, China
Received Date:05 August 2020
Accepted Date:04 November 2020
Available Online:21 February 2021
Published Online:05 March 2021
Abstract:Ionization energy (IE) is an important characteristic parameter of atoms or molecules. It plays an important role in the process of photophysics and photochemistry. The precise ionization energy is very important for relevant research. Especially, it is very useful for adjusting the signal of the zero-kinetic energy (ZEKE) spectrum, and it also plays a key role in judging the number of rotamers and molecular configuration. In linear time-of-flight mass spectrometers, pulsed electric fields are usually used to drive photo-ionized ions to the detector to produce the photoionization efficiency (PIE) spectrum. The ionization energy is directly obtained from the PIE curve. The uncertainty of the measured IE is usually greater than or equal to ± 10 cm–1. The ZEKE spectroscopy is based on the long-lived Rydberg state field ionization technology. In the ZEKE experiments, the laser excites molecules to the Rydberg state and then a pulsed field ionization (PFI) is used for measurement. A peak with high signal-to-noise ratio and narrow linewidth signal appears near the ionization threshold. Therefore, the more accurate ionization energy can be obtained, and the uncertainty of the measured value is about ± 5 cm–1. The 1,3-diethoxybenzene is an important benzene derivative, and experiments have confirmed that there are two rotamers, i.e. I (down-up) and III (down-down) in the supersonic molecular beam. In this paper, a linear time-of-flight mass spectrometer is used to measure the photoionization efficiency curves of 1,3-diethoxybenzene in electrostatic fields. From the linear fitting of the ionization energy values measured under different electric fields (Stark effect) to the square root of the field strengths, the precise ionization energy values of rotamer I and rotamer III are determined to be (62419 ± 2) cm–1 and (63378 ± 2) cm–1, respectively. Compared with the accuracies of the values measured by the usual pulsed electric field acceleration mechanism and the ZEKE spectroscopy, the accuracy is improved from about ± 10 and ± 5 to ± 2 cm–1, respectively. The physical mechanism, advantages and disadvantages of different methods are analyzed and discussed. The present research results show that the ionization energy measured in the electrostatic field is more accurate, the physical meaning of the measurement process is clear, and the threshold data are easy to collect. This is the first report on the precise ionization energy of 1,3-diethoxybenzene rotamers. Keywords:ionization energy/ photoionization efficiency/ Stark effect/ 1,3-diethoxybenzene
全文HTML
--> --> --> 1.引 言光电离效率(photoionization efficiency, PIE)曲线通常能够较方便地给出所测样品的电离能, 许多分子的电离能就是首先通过这种技术直接测量的[1-7]. 在光电离效率曲线上包含一个离子数量突然陡增的上升沿, 上升沿所在位置对应的激光光子能量通常就等于所要测量的电离能. 但上升沿从底部到顶部所占据的能量宽度比较大, 而且通常情况下对于不同分子测量的上升沿宽度并不相等的, 有的分子比较窄[8-12], 大约有20 cm–1, 有的分子由于电离阈值附近包含有取代基的转动或者由于分子自身的特性, 上升沿比较宽[13-20], 甚至宽度可达40 cm–1或更多[21,22]. 通常经验性地选取上升沿3/4处对应的能量作为测量的电离能[23], 这样使得测量误差可能在10—20 cm–1, 甚至更大. 这种经验性的选取电离能的方法也缺少理论上的直接的支持, 因为从上升沿的底部开始就意味着分子已经开始电离了, 并不是只有在离子数上升到上升沿3/4处分子才电离. 为了获得更加精确的电离能, 本文首次测量了1,3-二乙氧基苯异构物在不同直流电场中的光电离效率曲线, 选取不同电场中光电离效率谱的上升沿开始处作为外电场中分子的电离能, 根据Stark效应外推获得1,3-二乙氧基苯两个异构物的零场的精确电离能. 测量结果与零动能光谱结果相一致. 2.实验方法实验在自行设计的直线式飞行时间质谱仪上进行. 详细的实验细节可参考文献[23-26], 这里简单介绍与本论文相关的实验条件. 实验原理如图1所示, 氪气作为载气夹带着样品分子通过脉冲阀绝热膨胀产生超声分子束, 经过Skimmer准直后, 水平方向飞行的分子束进入激光与分子相互作用区I, 第一束激光(激发激光)共振激发分子(某种异构分子)到达第一电子激发态, 调谐第二束激光(电离激光)的光子频率, 当两束激光光子能量之和等于或大于电场中分子的电离能时, 激发态分子吸收第二束激光光子能量后被电离. 实验中电极P1电压从+600 V开始每隔300 V增加一次电压测量PIE曲线, 电极P2施加固定电压+400 V, P3和P5接地, P4为聚焦极, 实验中P4上施加了+50 V恒定电压. P1, P2电极间距为14 mm, P2, P3, P4, P5电极之间相邻间距为7 mm. 分子电离后P1和P2之间直流高压使离子加速并与中性粒子分开, 离子飞行到达P2和P3电极间后进一步加速. 经过聚焦区域III后进入飞行距离约48 cm的无场区或称为自由飞行区, 这个区域使不同质量的离子进一步分离, 使质谱和光谱具有更好的分辨率. 采用两片微通道板(MCP, 山西长城微光器材有限公司)叠加探测离子信号, 信号经过光子计数器SR430 (Stanford research system, SRS)累加300次后再传输到电脑进行数据存储. 整个系统的工作频率为10 Hz, 两束激光和分子束的时序通过延时脉冲发生器DG645(SRS)控制. 图 1 直线式飞行时间质谱仪原理图. P1, P2, P3, P4, P5为离子透镜的片状电极; P1与P2间区域I为激光和分子束相互作用区. MCP为微通道板探测器 Figure1. Schematic diagram of a linear time-of-flight mass spectrometer. P1, P2, P3, P4, P5 are the electrodes of the electrostatic lens; the region I between P1 and P2 is the interaction area between lasers and molecular beam. MCP is a microchannel plate detector.
实验中1,3-二乙氧基苯液体样品由上海贤鼎生物科技有限公司生产, 纯度为97%, 没有进一步提纯. 为了获得足够蒸气压, 将样品加热到90 ℃, 氪气作为载气, 压强为3个大气压. YAG激光器(INDI-40-10, Spectra Physics)的三倍频355 nm激光泵浦染料激光器(CBR-D-24, Sirah)产生可见光输出, 并用BBO晶体进一步二倍频获得紫外激光作为激发光; 另一台YAG激光器(Q-smart 850, Quantel)的二倍频532 nm激光泵浦另一台染料激光器(Precision Scan-D, Sirah)并进一步用BBO晶体二倍频后产生紫外激光作为电离光. 实验中两套染料激光器采用的染料为分别为C540A和LDS751, 标称的输出线宽分别为0.04和0.05 cm–1. 染料激光输出波长采用HighFinesse WS-7波长计进行了校准. 3.实验结果1,3-二乙氧基苯是苯的间位的两个氢原子分别被乙氧基取代后形成的苯的衍生物, 两个乙氧基的相对取向(up或down)不同将形成不同的异构物. 为了方便比较和讨论, 异构物命名参考文献[27,28]的方法. 理论上预言有3个稳定构型, 即I (down-up), II (up-up)和III (down-down), 如图2所示. 但构型II具有较高的基态能量, 目前实验中无法观察到. 即在超声分子束中只发现两个稳定的异构物, 分别为构型I和III. 关于确定各种构型的理论计算和实验方法(包括共振多光子电离光谱、烧孔光谱和质量分辨阈值电离光谱等)超出了本文题目讨论范畴, 我们将另文详细介绍. 实验测量的异构物I和III的第一激发能分别为36091 cm–1 (277.08 nm)和36165 cm–1 (276.51 nm). 当选择激发激光的波长与异构物I的第一激发能共振, 即光子能量为36091 cm–1时, 扫描电离激光波长或频率, 在电极P1电压分别为600, 900, 1200, 1500, 1800, 2100和2400 V, 电极P2固定于400 V条件下(对应的I区间电场强度分别为142.86, 357.14, 571.43, 785.71, 1000.00, 1214.29和1428.57 V/cm), 测量获得的PIE曲线如图3(a)所示, 图中每条曲线上的箭头指向了电离开始的位置, 即静电场中分子异构物I的电离阈值. 在电场中由于电场与价电子的相互作用, 导致产生Stark效应[29-34], 即分子的能级将产生移动和分裂, 电离能降低, 降低的多少随电场强度的大小而改变. 理论上静电场对分子电离能的改变满足公式$ \Delta E \!=\! - 6.1\sqrt F $[18,35], 其中F是以V/cm为单位的电场强度, ΔE是以cm–1为单位的电离能改变. 在上述电场中测量的PIE曲线给出的电离能(图3(a)中箭头所指能量值)分别为62347.33, 62304.66, 62277.20, 62251.17, 62230.66, 62209.50和62192.45 cm–1. 用测量的电离能和电场数据拟合公式$ {E_{\rm{f}}} = {\rm{I}}{{\rm{E}}_0} + \alpha \sqrt F $, 其中Ef代表外场中的电离能, IE0是零场的电离能, F是电场强度, α是斜率系数. 拟合结果如图3(b)所示, 确定零场时分子的电离能IE0为 (62418.87 ± 1.25) cm–1. 考虑到激光线宽、阈值取点等其它因素和误差的影响, 测量的1, 3-二乙氧基苯异构物I的准确的电离能确定为(62419 ± 2) cm–1. 与零动能光谱测量的电离能 (62420 ± 5) cm–1相一致. 拟合决定的系数α值为–5.98 ± 0.04, 与理论值–6.1符合得很好. 图 2 1,3-二乙氧基苯分子的三种构型, 根据取代基OC2H5的方向命名三种构型分别为I, down-up; II, up-up; III, down-down Figure2. Three configurations of 1,3-diethoxybenzene molecule. The three configurations are named according to the direction of the substituent OC2H5 as I, down-up; II, up-up; III, down-down.
图 3 异构物I在不同电场中的光电离效率曲线(a)及其测量的电离能对电场强度平方根的线性拟合(b). 图(a)中箭头指向了电场中电离阈值的取值点 Figure3. The photoionization efficiency curves of isomer I (down-up) in different electric fields (a), and the linear fitting of the measured ionization energy to the square root of the electric field intensity (b). The arrows in figure (a) point to the ionization thresholds in the electric fields.
对异构物III也进行了类似于异构物I的PIE光谱测量. 固定激发光子的能量与第一电子激发态能量共振, 即固定于36165 cm–1 (276.51 nm), I区间的电场强度分别为142.86, 357.14, 571.43, 785.71, 1000.00, 1214.29, 1428.57 V/cm的条件下, 扫描电离激光的波长, 获得了图4(a)所示的7条光电离效率曲线, 每条曲线上用箭头表示了分子开始电离的双光子能量值, 即电离阈值. 用测量的电离阈值和相应电场强度拟合公式$ {E_{\rm{f}}} = {\rm{I}}{{\rm{E}}_0} + \alpha \sqrt F $, 结果如图4(b)所示, 确定了异构物III的零场的电离能IE0 = (63377.59 ± 1.09) cm–1. 考虑到激光线宽等其他因素和误差的影响, 测量的1,3-二乙氧基苯异构物III的电离能确定为(63378 ± 2) cm–1, 与零动能光谱测量的电离能(63380 ± 5) cm–1相一致. 拟合决定的系数α值为–5.99 ± 0.04, 也与理论值–6.1符合得很好. 图 4 异构物III在不同电场中的光电离效率曲线(a)及其测量的电离能对电场强度平方根的线性拟合(b). 图(a)中箭头指向了电场中电离阈值的采集点 Figure4. The photoionization efficiency curves of isomer III (down-down) in different electric fields (a), and the linear fitting of the measured ionization energy to the square root of the electric field intensity (b). The arrows in figure (a) point to the ionization thresholds in the electric fields.
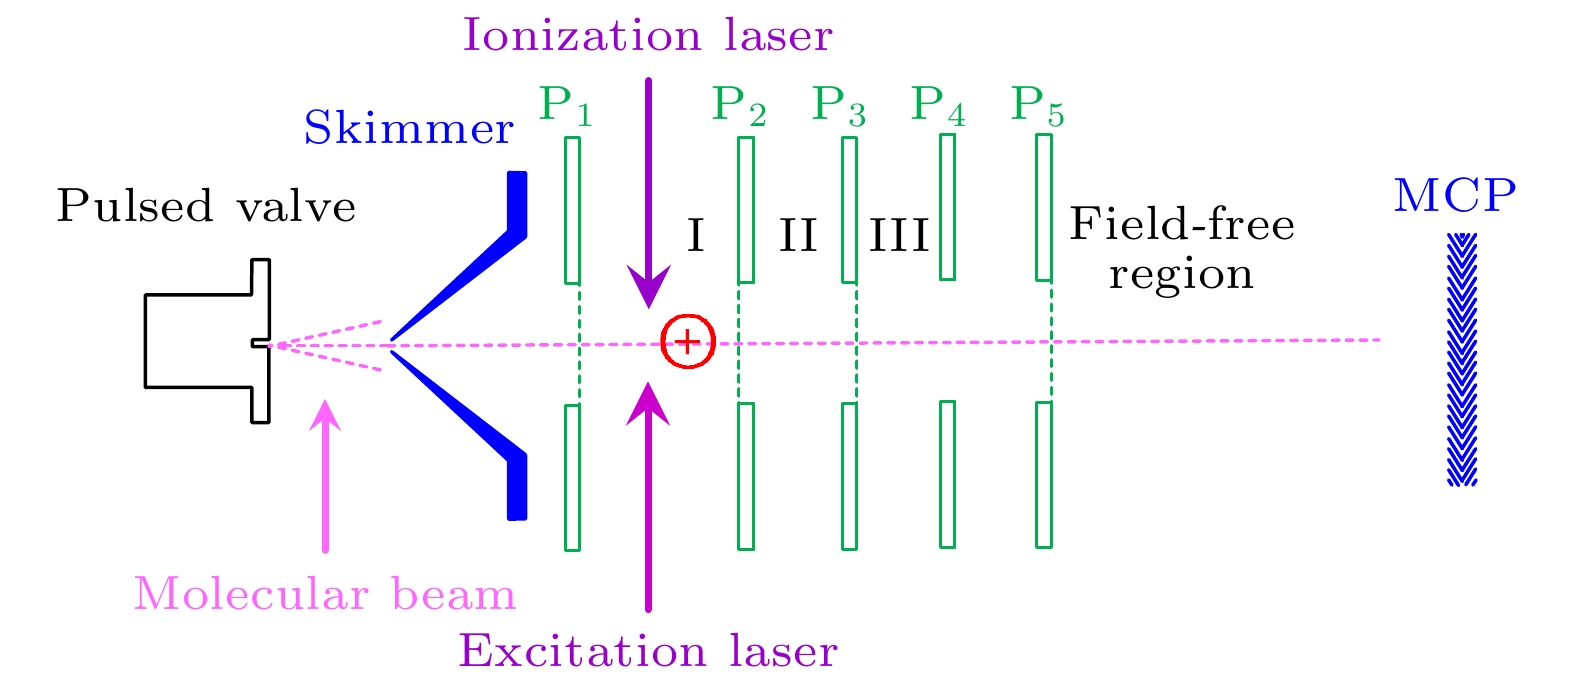 图 1 直线式飞行时间质谱仪原理图. P1, P2, P3, P4, P5为离子透镜的片状电极; P1与P2间区域I为激光和分子束相互作用区. MCP为微通道板探测器

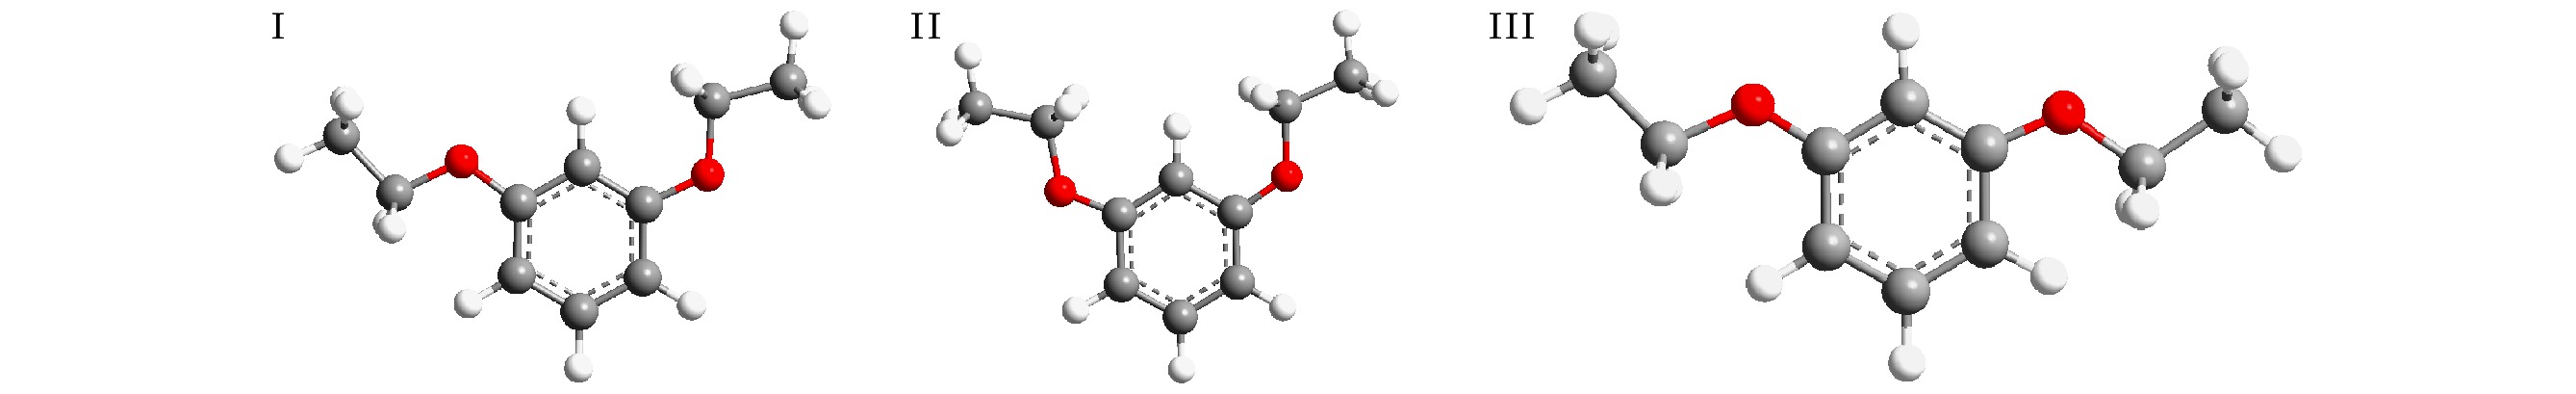 图 2 1,3-二乙氧基苯分子的三种构型, 根据取代基OC2H5的方向命名三种构型分别为I, down-up; II, up-up; III, down-down
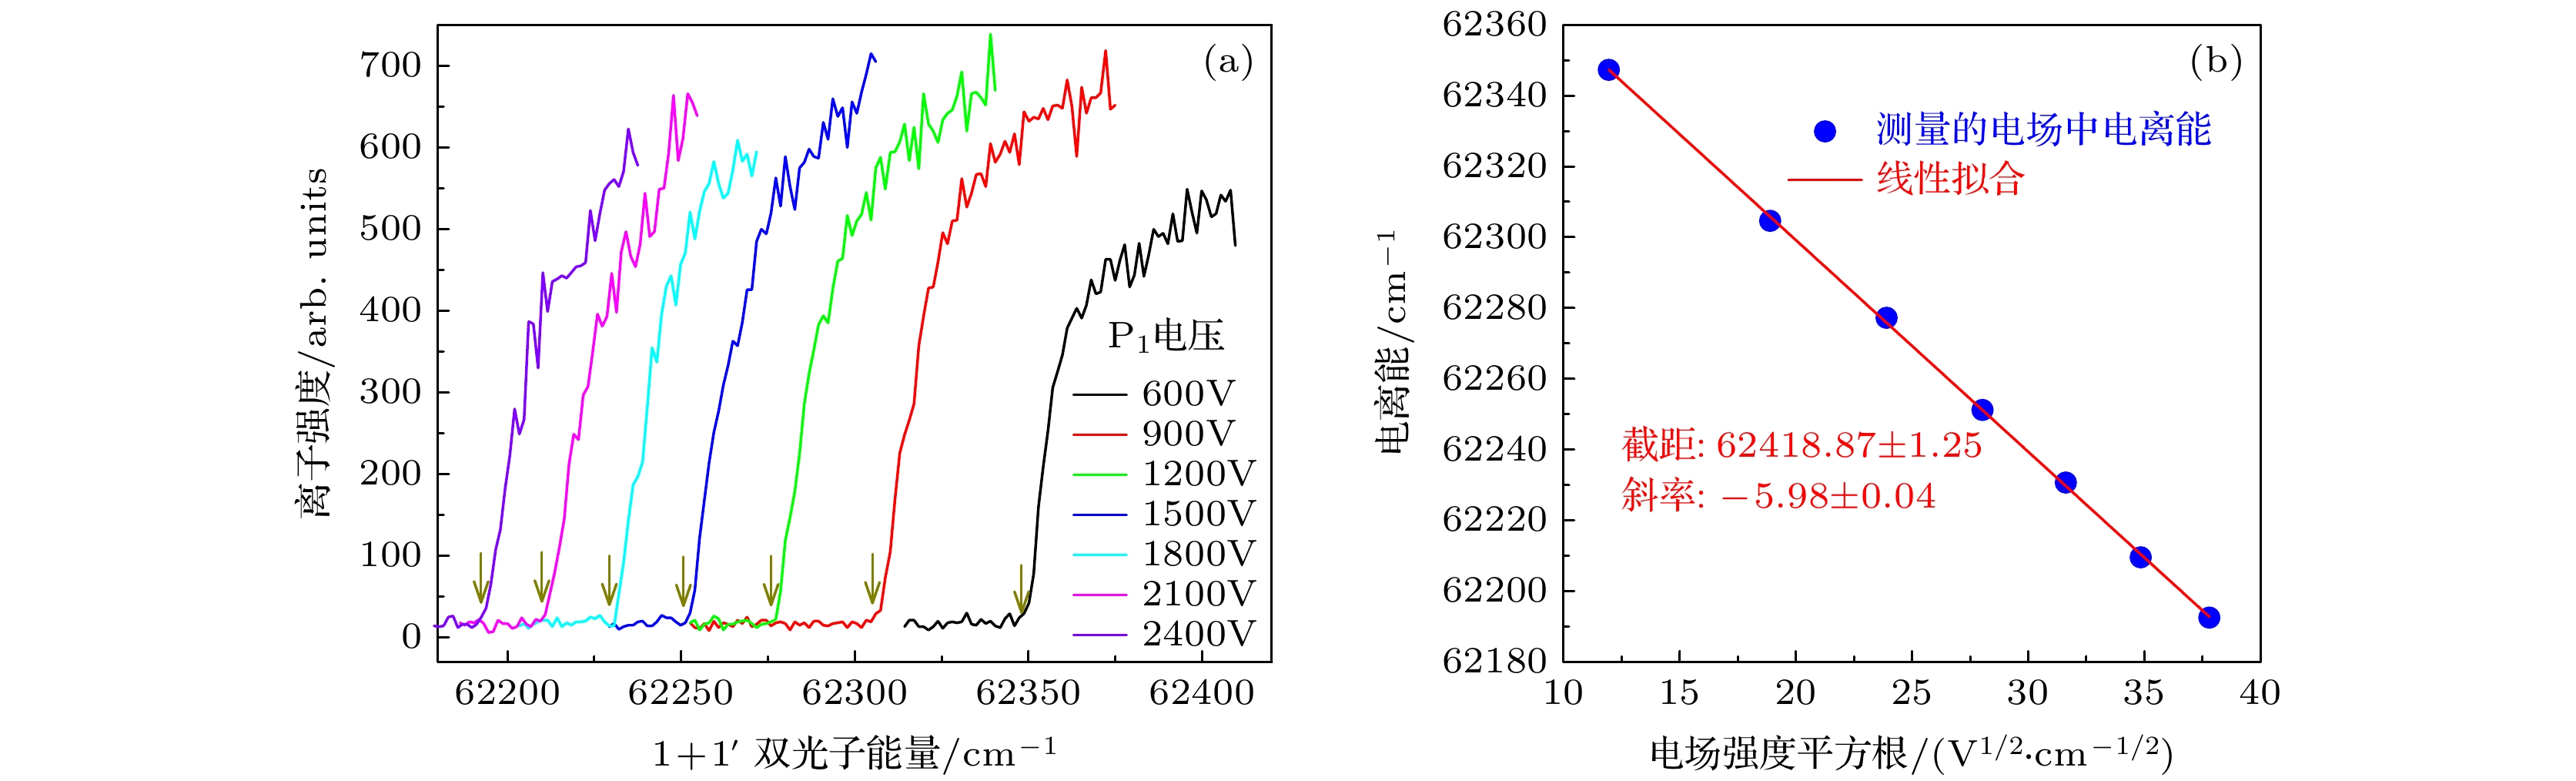 图 3 异构物I在不同电场中的光电离效率曲线(a)及其测量的电离能对电场强度平方根的线性拟合(b). 图(a)中箭头指向了电场中电离阈值的取值点
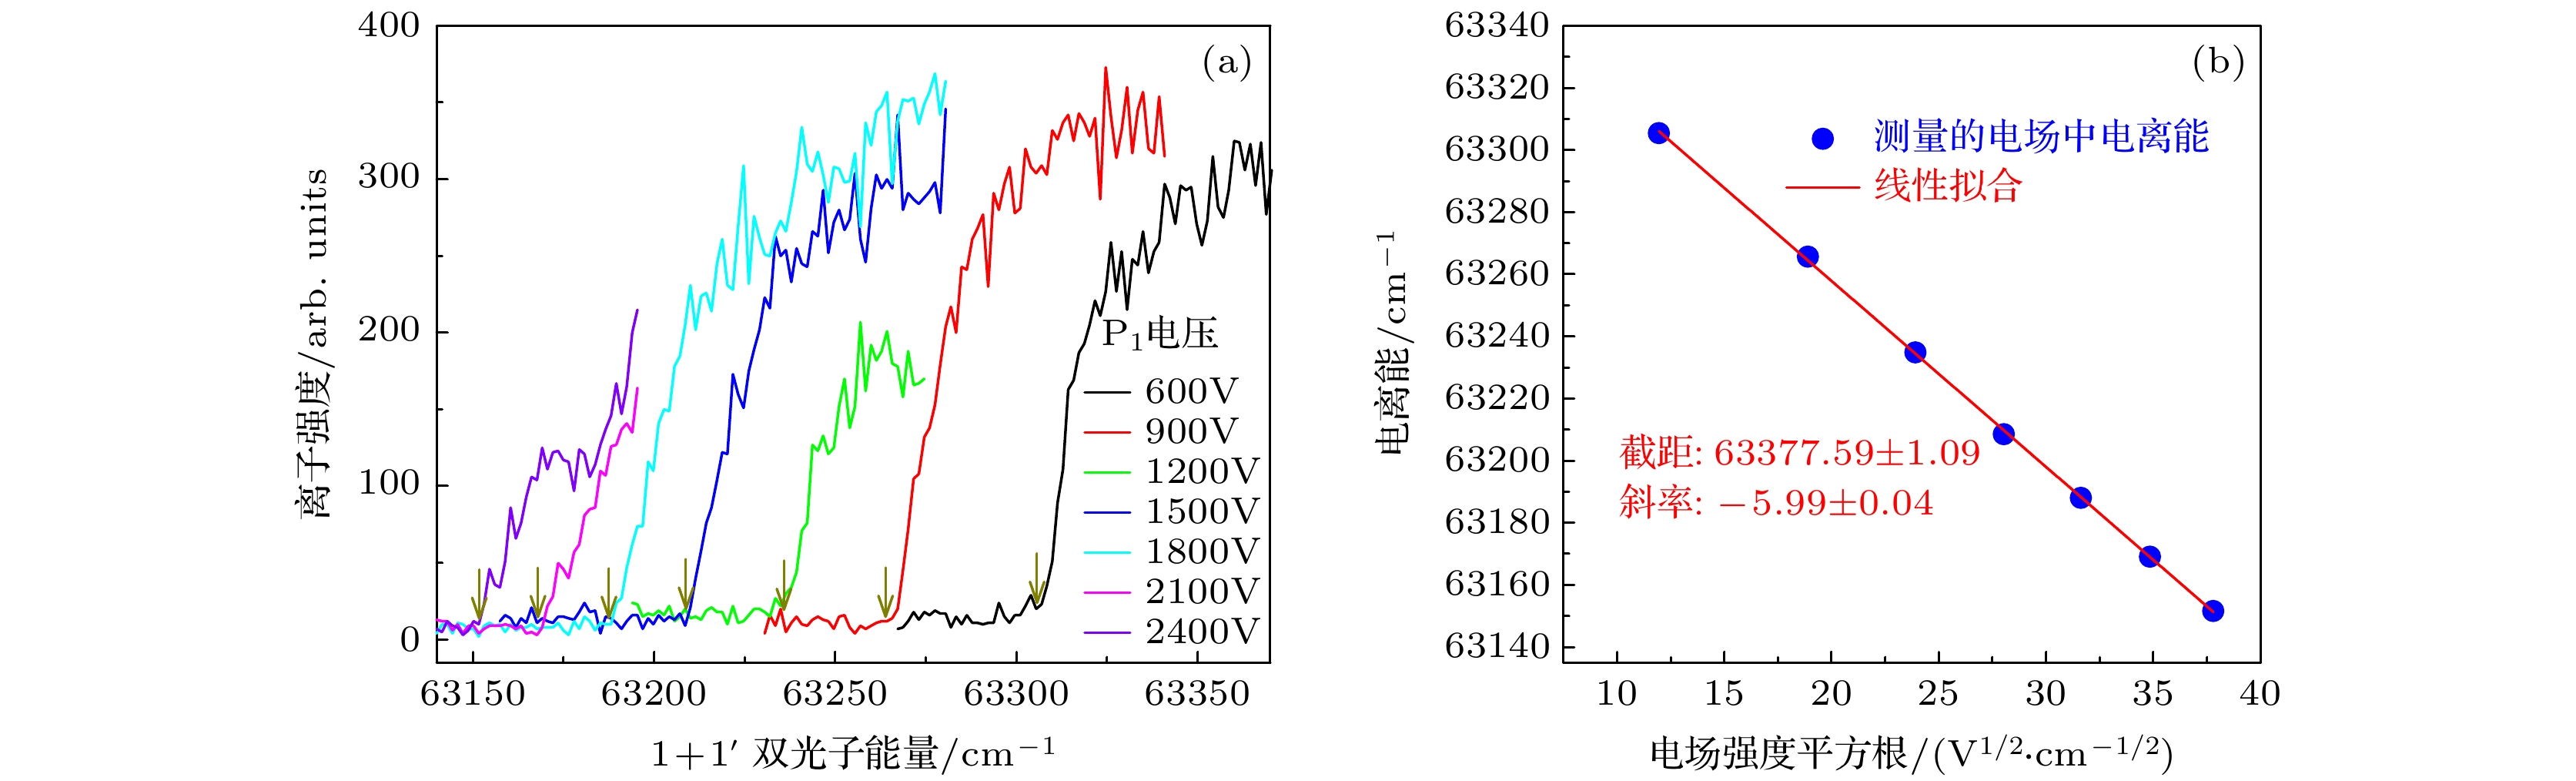 图 4 异构物III在不同电场中的光电离效率曲线(a)及其测量的电离能对电场强度平方根的线性拟合(b). 图(a)中箭头指向了电场中电离阈值的采集点
