1.School of Information Science and Engineering, Yunnan University, Kunming 650091, China 2.College of Science, Yunnan Agricultural University, Kunming 650201, China
Abstract:In this paper, the dual-band and four-band plamon-induced transparency(PIT) hybrid model based on silver nanorod and silver nanodisk hybrid model are proposed. The electromagnetic characteristics of the two PIT hybrid models are also estimated respectively. The results show that in the double-band PIT model, the silver nanodisk (bright mode) and the silver nanorod (dark mode) can form the bright-dark-dark mode coupling. Because of the destructive interference produced by nanodisk and nanorod and the emergence of new SPs resonance modes between nanorod and nanorod, the double-band PIT model can produce two transparent windows. When the length of the nanorods and the distance between the nanorods and nanodisk are changed, the resonant frequencies and transmission amplitudes of two transparent windows will be changed accordingly. In the four-band PIT model, the silver nanodisk and the silver nanorods will form the dark-dark-bright-dark-dark mode coupling. The resonant peaks of four transparent windows almost coincide with those of the two asymmetric double-band PIT models. Therefore, the four-band PIT model can be regarded as the superposition of two asymmetric double-band PIT models. The resonant frequencies and transmission amplitudes of four transparent windows also vary with the the length of nanorods and the distance between nanorods and nanodisk.Finally, the sensing performance of the four-band PIT model is investigated. It is found that the model can produce four transparent windows from beginning to end when the refractive index of the background material is changed. As the refractive index is changed from 1.0 to 1.4, the resonant frequencies in four transparent windows are approximately linearly related to the refractive index. At the same time, the maximum sensitivity of the four transparent windows can reach 326.2625 (THz/RIU) and the maximum figure of merit can arrive at 26.4 (1/RIU), which is higher than those of similar similar sensors in other literatures. This work provides the theoretical support for these models’ potential applications in many areas such as optical storage, absorption, filtering and the design of sensors in infrared band. Keywords:multiband plasmon-induced transparency/ metamaterials/ Finite Difference Time Domain
3.双频段PIT模型仿真结果与分析图2给出了双频段PIT模型的透射率曲线, 作为参考, 图中同时给出了银纳米盘阵列、银纳米棒阵列、单频段PIT模型的透射率曲线. 通过图2可以发现, 当光波入射方向沿-Z轴传播, 极化方向沿Y方向时, 由于银纳米盘阵列的偶极等离子体辐射特性, 银纳米盘阵列产生了典型的洛伦兹线型的谐振, 因此可以将其视作被光场直接激发的明模. 但对于银纳米棒阵列而言, 由于电场极化方向与它的长轴方向相垂直, 因而银纳米棒阵列没有产生谐振, 所以可将其看作暗模. 在单频段PIT模型中, 当银纳米盘和银纳米棒彼此间隔较小时, 由于二者之间的耦合作用, 银纳米盘中的明模可以通过两种通道激发: $|I \rangle \to |B \rangle$和$|I \rangle\to |B \rangle\to | D \rangle \to |B \rangle$. 其中, $|I\rangle, |B \rangle, |D \rangle$分别代表入射光、明模和暗模. 这两个通道所产生的相消干涉导致了单频段PIT现象的产生[21]. 随后, 在单频段PIT模型的基础之上, 双频段PIT模型在下方新添加一个的银纳米棒单元, 形成明模-暗模-暗模耦合方式. 其中, 新添加的下方银纳米棒将会与中间的银纳米棒继续发生耦合作用, 这会产生新的表面等离激元谐振, 进而导致新的透明窗口的产生[22]. 图 2 纳米盘阵列、纳米棒阵列、单频段PIT模型、双频段PIT模型的透射曲线 Figure2. Transmission spectra of the sole nanodisk array, the sole nanorod array, the single-band PIT model
为了进一步研究双频段PIT模型的物理原理, 图3给出了波谷A (368.8890 THz)、波谷B (397.7780 THz)、波谷C (480.0000 THz)、波峰D (380.0000 THz)、波峰E (464.4440 THz)的电场分布. 通过图3可以发现, 在波谷A、波谷B、波谷C处, 由于明模和暗模之间的相长干涉, 银纳米盘和银纳米棒的电场都得到了增强. 波谷A处的电场主要集中在盘和棒、棒和棒之间, 波谷B处的电场主要集中在棒和棒之间, 波谷C处的电场主要集中在盘和棒之间. 同时, 由于暗模的四极模式, 在波谷A和波谷B处银纳米棒之间产生了三个节点的电场分布. 另一方面, 在波峰D和波峰E处, 由于明模和暗模之间的相消干涉, 银纳米盘的电场强度被压缩, 电场主要分布在棒和棒以及盘和棒之间. 在波峰D处, 电场主要分布在棒和棒之间, 呈三节点分布, 证明了波峰D是由下方银纳米棒与中间的银纳米棒生成的新表面等离激元谐振而产生的. 在波峰E处, 电场主要分布在盘和棒之间, 说明波峰E是由于$|I \rangle \to |B \rangle$和$|I \rangle \to |B \rangle \to | D \rangle \to |B \rangle$两个通道所产生的相消干涉产生的. 图 3 双频段PIT模型在(a) dip A, (b) dip B, (c) dip C, (d) peak D, (e)peak E的电场分布 Figure3. Distribution of electric field of dual-band PIT model at (a) dip A, (b) dip B, (c) dip C, (d) peak D and (e) peak E.and the dual-band PIT model.
图4给出了当银纳米盘与银纳米棒、银纳米棒与银纳米棒的间隔g改变时, 透明窗口的变化规律. 当g的值由40 nm变化到10 nm时, 波峰D和波峰E的谐振频率逐渐减小, 发生红移. 波峰D谐振频率从415.556 THz减小到333.333 THz, 波峰E从466.667 THz减小到448.889 THz. 同时, 由于盘与棒之间的耦合增强, 波峰E的透射振幅逐渐增大, 从0.9369增大到0.967. 但波峰D透射振幅却先减小后增大, g = 30 nm的时候最小, g = 10 nm的时候最大. 图 4 改变银纳米盘与银纳米棒、银纳米棒与银纳米棒间隔g时透射率随频率的变化情况 Figure4. Variation of transmission with frequency of different g.
图5进一步分析了银纳米棒长度L对透明窗口的影响, 当L值由0.31 μm增大到0.37 μm时, 波峰D和波峰E谐振频率逐步减小, 发生红移. 波峰D谐振频率从380 THz减小到331.111 THz, 波峰E从464.444 THz减小到422.222 THz. 另一方面, 波峰D透射振幅逐渐增大, 从0.6333增大到0.8387, 而波峰E透射振幅略有减小但几乎保持不变. 因此, 通过改变间隔g和银纳米棒长度L都可以实现双频段PIT模型谐振频率和透射振幅的可调性. 图 5 改变银纳米棒长度L时, 透射率随频率的变化情况 Figure5. Variation of transmission with frequency of different L
为了分析四频段PIT的形成原理, 图8给出了四频段PIT和两个双频段PIT模型的透射曲线对比. 通过对比后发现, 四频段PIT模型的四个谐振峰与两个双频段PIT模型的谐振峰几乎重合. 其中, 波峰A和波峰C与上棒长度${L_2} = 0.37\;{\text{μm}}$的双频段PIT模型的谐振峰重合, 波峰B和波峰D与下棒长度${L_1} = 0.31\;{\text{μm}}$的双频段PIT模型的谐振峰重合. 这表明: 四频段PIT可以看作是两个双频段PIT模型的叠加, 由于模型的非对称性(${L_1} \ne {L_2}$), 因此两个双频段PIT模型的谐振峰不相同, 所以叠加后形成四个谐振峰, 产生四个透明窗口. 图 8 两种双频段PIT模型与四频段PIT模型透射率对比 Figure8. The comparison of transmission between two dual-band PIT models and four-band PIT model.
为了进一步验证四频段PIT的形成原理, 图9给出了四频段PIT模型中波峰A, 波峰B, 波峰C, 波峰D的电场分布. 图中, 波峰B和波峰D的电场分布与图3类似, 波峰B的电场主要分布在下棒与下棒之间, 呈三节点分布, 波峰D的电场主要分布在盘与下棒之间. 这验证了波峰B和波峰D是下棒长度${L_1} = 0.31\;{\text{μm}}$的双频段PIT模型形成的. 此外, 波峰A的电场主要分布在上棒与上棒之间, 呈三节点分布, 与波峰B类似. 波峰C的电场主要分布在盘与上棒之间, 和波峰D类似. 这说明波峰A和波峰C是上棒长度${L_2} = 0.37\;{\text{μm}}$的双频段PIT模型形成的. 图 9 四频段PIT模型在(a) peak A, (b) peak B, (c) peak C, (d) peak D的电场分布 Figure9. Distribution of electric field of four-band PIT model at (a) peak A, (b) peak B, (c) peak C, (d) peak D.
图10和图11分析了四频段PIT模型下棒长度${L_1}$和上棒长度${L_2}$对透明窗口的影响. 在图10中, 当上棒长度${L_2}$从$0.33\;{\text{μm}}$增加到$0.37\;{\text{μm}}$时, 由于下棒长度没有变化, 所以波峰B和波峰D的谐振频率和透射振幅几乎没有改变. 而波峰A和波峰C的谐振频率则随着${L_2}$的增大而减小, 发生红移. 同时, 波峰A的透射振幅随着${L_2}$的增大而增大, 波峰C的透射振幅逐渐减小, 但基本保持不变. 图 10 改变上棒长度L2时, 透射率随频率的变化 Figure10. Variation of transmission with frequency of different L2.
图 11 改变下棒长度L1时, 透射率随频率的变化 Figure11. Variation of transmission with frequency of different L1.
在图11中, 由于下棒长度${L_1}$从$0.31\;{\text{μm}}$增加到$0.35\;{\text{μm}}$, 上棒长度没有改变, 所以波峰A和波峰C的谐振频率和透射振幅没有明显改变. 但波峰B和波峰D的谐振频率发生了红移. 波峰D的透射振幅产生了轻微的减小, 波峰B的透射窗口随着${L_1}$的增大而增大. 以上的结论都与图5一致. 图12给出了盘与棒之间、棒与棒之间的间隔g改变时, 四频段PIT模型透射窗口的变化规律. 当g由25 nm逐步减小为10 nm时, 四个透明窗的谐振频率都逐渐减小, 发生红移. 同时, 如之前所言, 由于盘和棒之间耦合强度的增大, 导致波峰C、波峰D的透射振幅逐渐增强. 然而对于波峰A和波峰B而言, 尽管它们的形成原理相似, 但当g逐渐变小时, 透射振幅的变化规律却不尽相同. 波峰A的透射振幅随着g的减小而增大, 波峰B的透射振幅和图4相似, 在g逐渐减小时, 其透射振幅先减小后增大, 当g = 10和25 nm时最大, g = 15 nm时最小. 图 12 改变盘与棒之间、棒与棒之间的间隔g时透射率随频率的变化情况 Figure12. Variation of transmission with frequency of different g.
为了分析四频段PIT模型的传感性能, 图13给出了当背景材料折射率由1.0变化到1.4时, 模型透射曲线的变化规律. 从图中可以看出, 当折射率改变时, 四频段PIT模型始终能保持生成四个透明窗口. 同时, 当折射率逐渐增大时, 波峰A、波峰B、波峰C、波峰D的谐振频率逐渐减小, 发生红移, 但透射振幅基本保持不变. 通常情况下, 传感器的传感性能由两个指标来衡量: 一个是优值系数(FOM), 另一个是灵敏度S. 图 13 不同背景材料下的透射窗对比 Figure13. The variation of transmission windows with different background materials.
图14和图15分别分析了波峰A、波峰B、波峰C、波峰D的灵敏度和优值系数. 从图中可以发现, 模型中四个透明窗口谐振频率的改变与背景材料折射率的变化均成近似线性关系. 同时, 通过计算发现, 波峰A到波峰D的灵敏度分别为: 235.86, 267.172, 294.95, 326.2625 THz/RIU. 优值系数分别为: 10.1, 26.4, 7.02, 9.85/RIU. 图 14 peak A和peak B随背景材料折射率的变化规律 Figure14. The variation of peak A and peak B with different background materials.
图 15 peak C和peak D随背景材料折射率的变化规律 Figure15. The variation of peak C and peak D with different background materials.


 图 1 双频段PIT模型结构图 (a)三维空间结构图; (b)二维平面结构图


 图 2 纳米盘阵列、纳米棒阵列、单频段PIT模型、双频段PIT模型的透射曲线

 图 3 双频段PIT模型在(a) dip A, (b) dip B, (c) dip C, (d) peak D, (e)peak E的电场分布
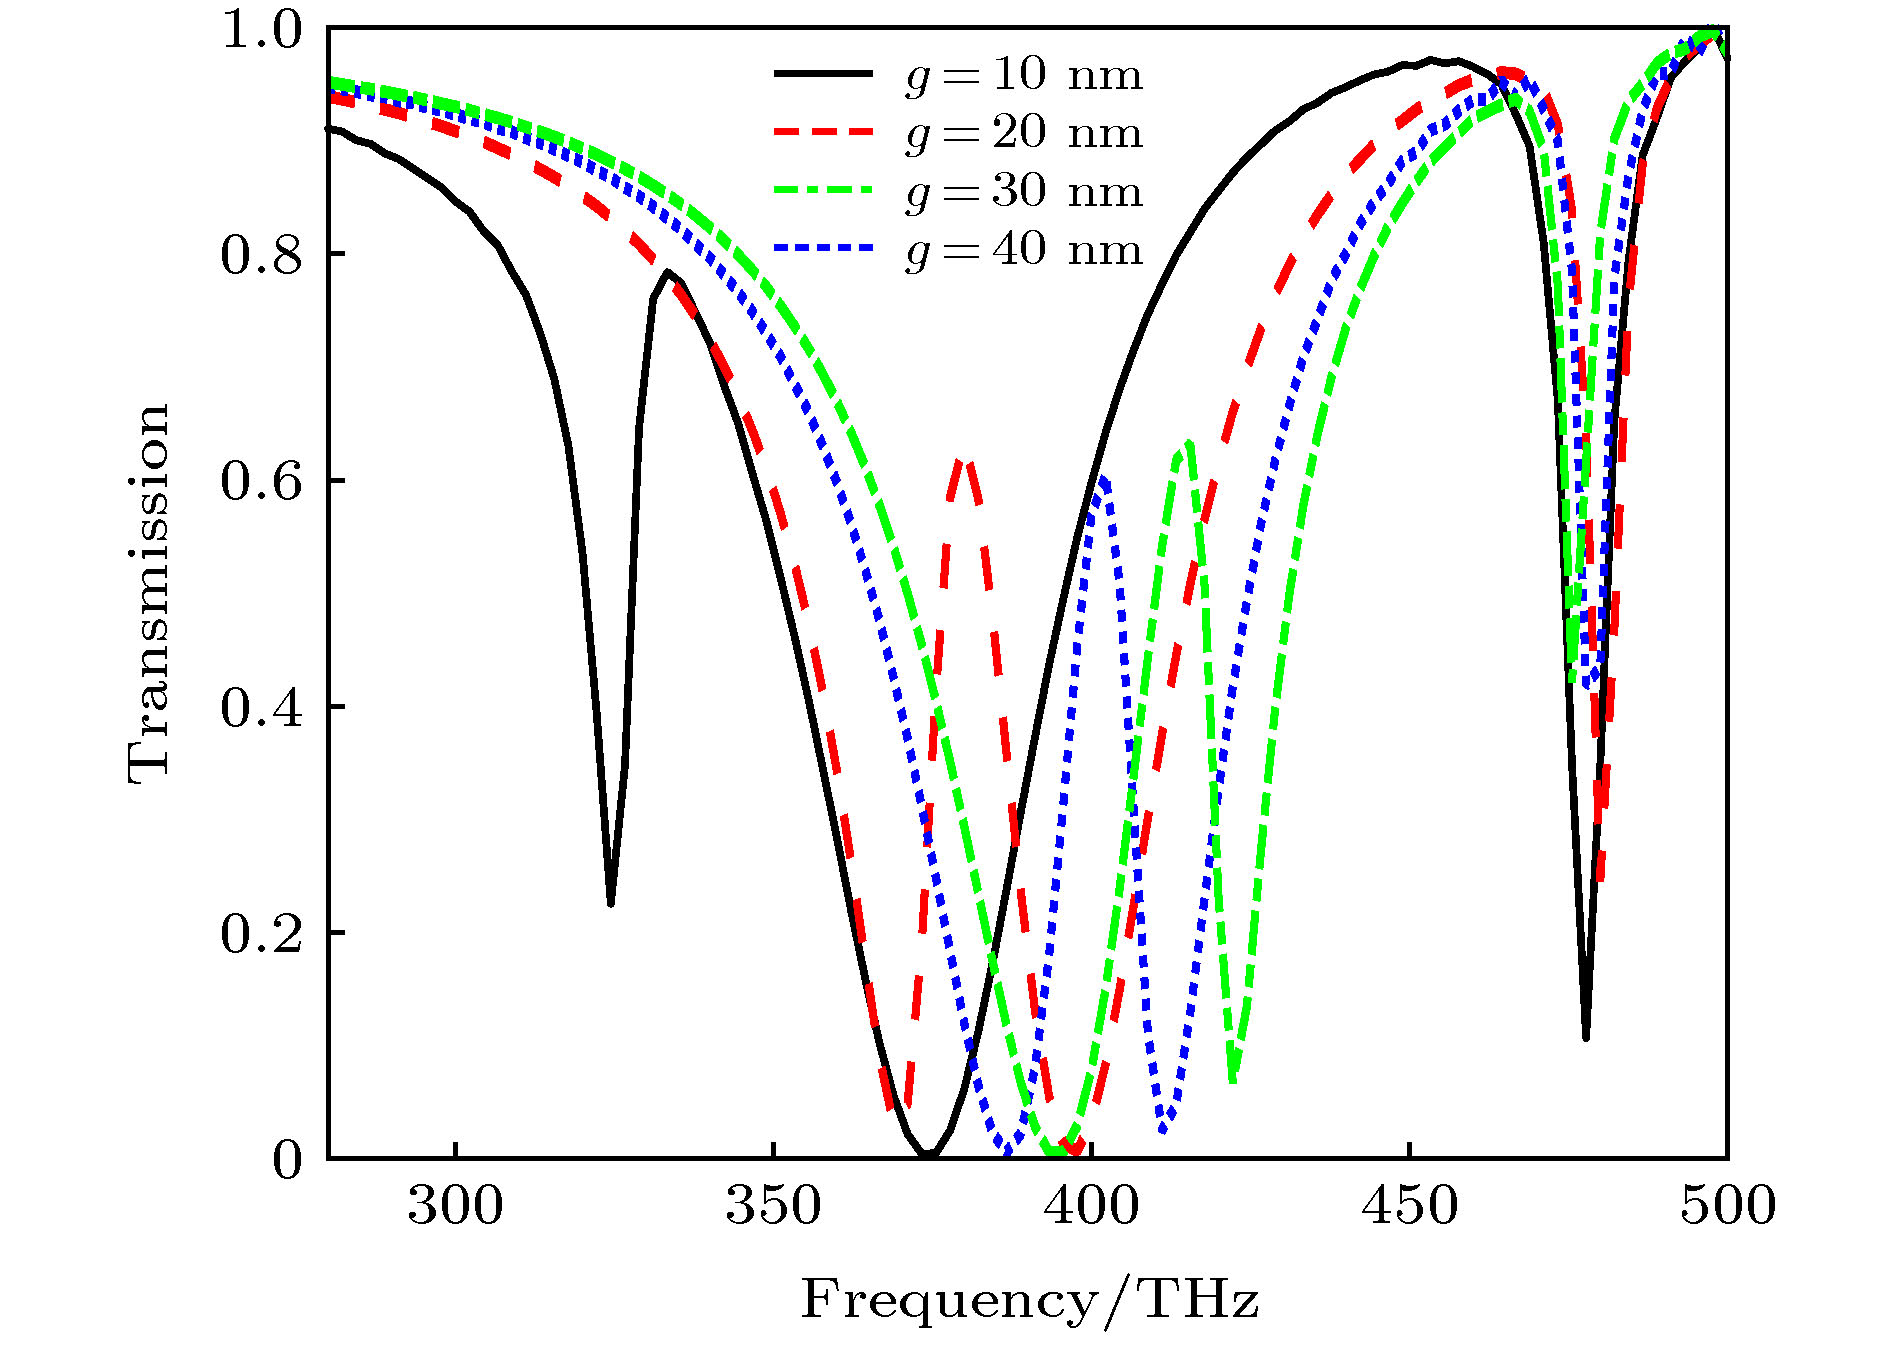 图 4 改变银纳米盘与银纳米棒、银纳米棒与银纳米棒间隔g时透射率随频率的变化情况
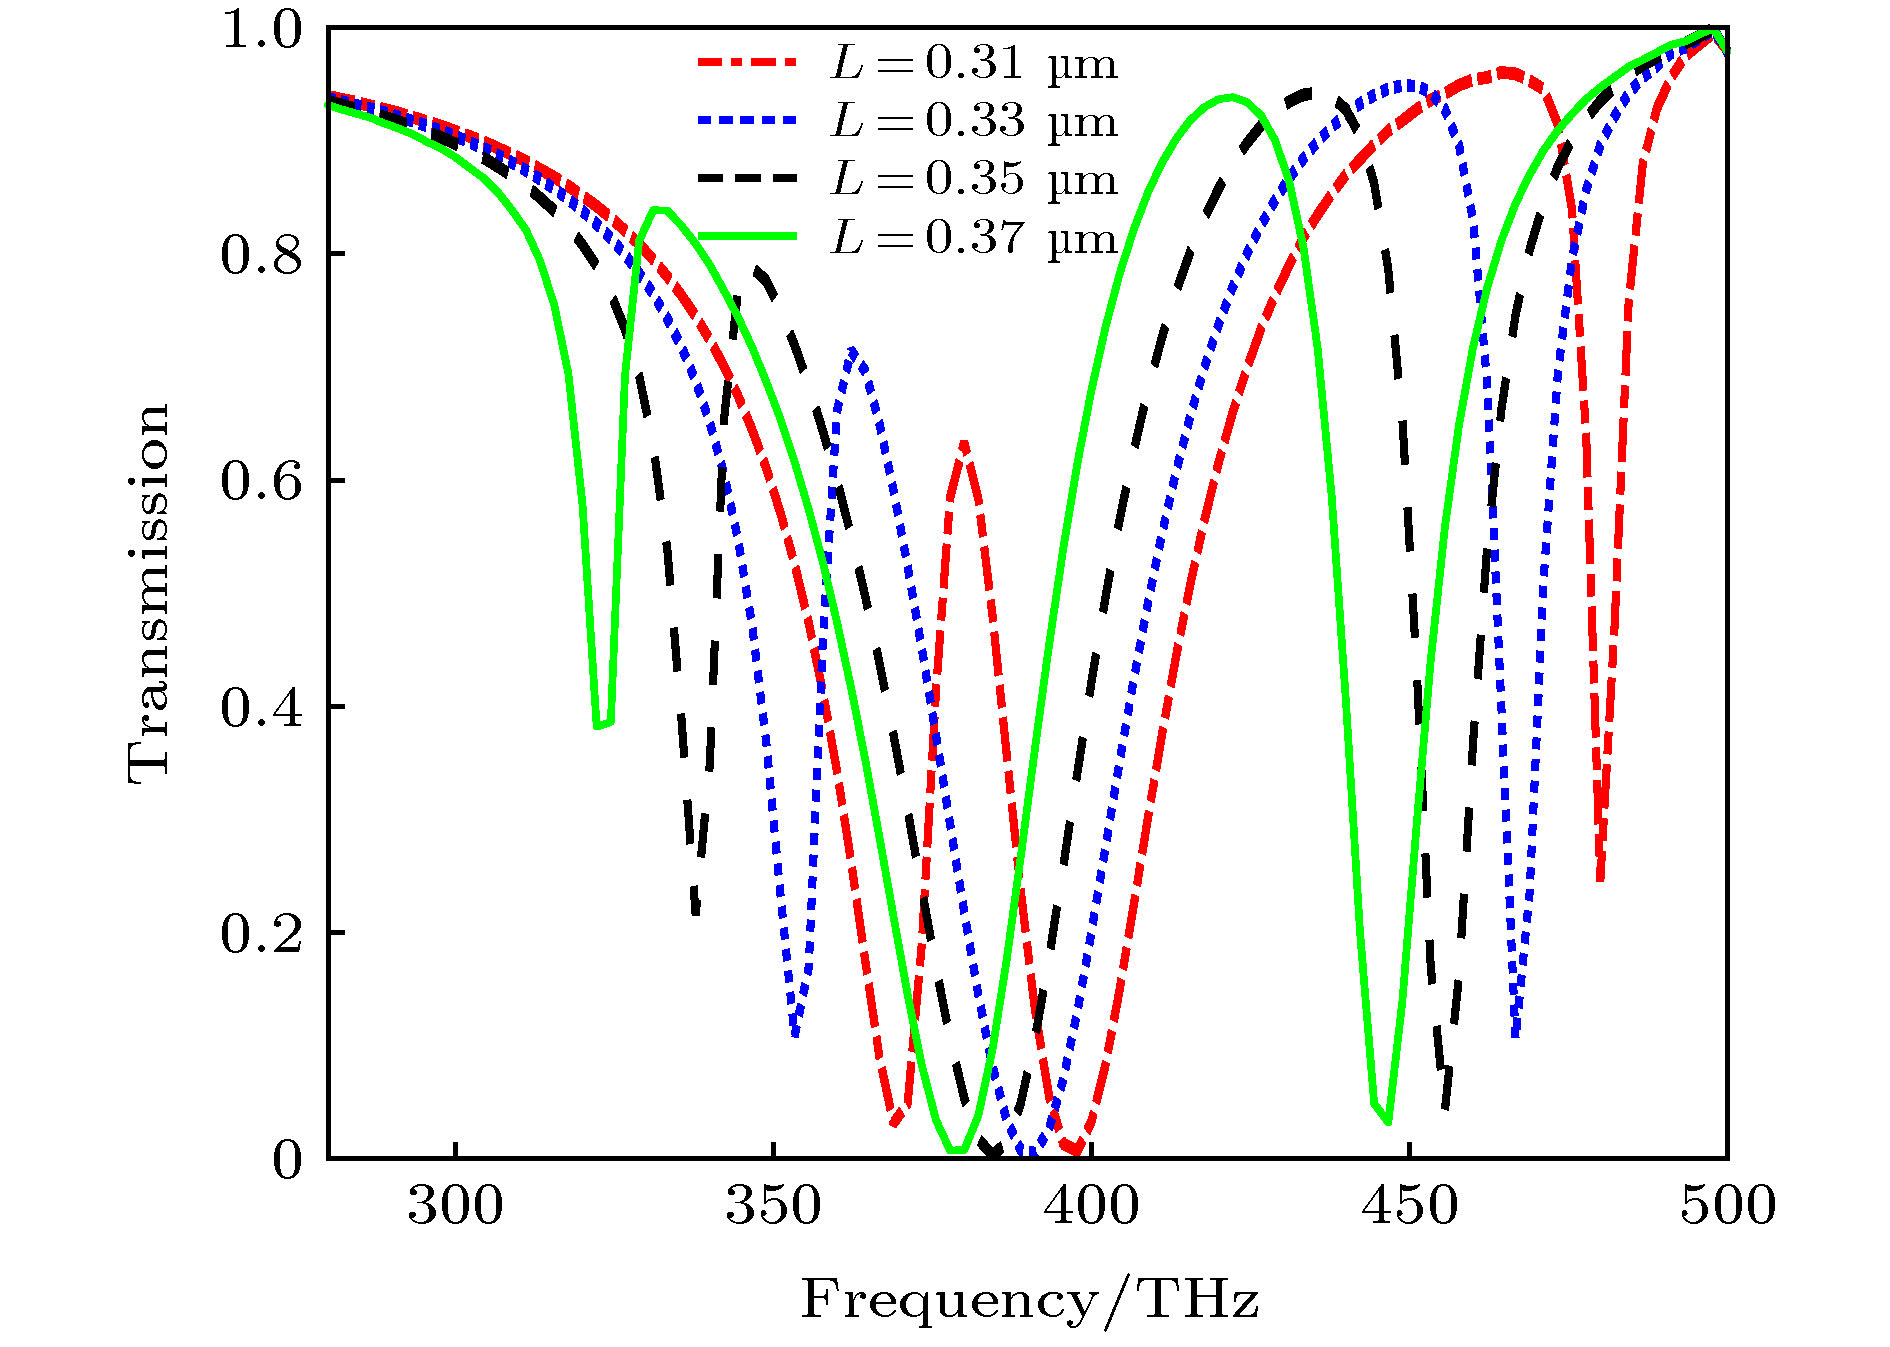 图 5 改变银纳米棒长度L时, 透射率随频率的变化情况


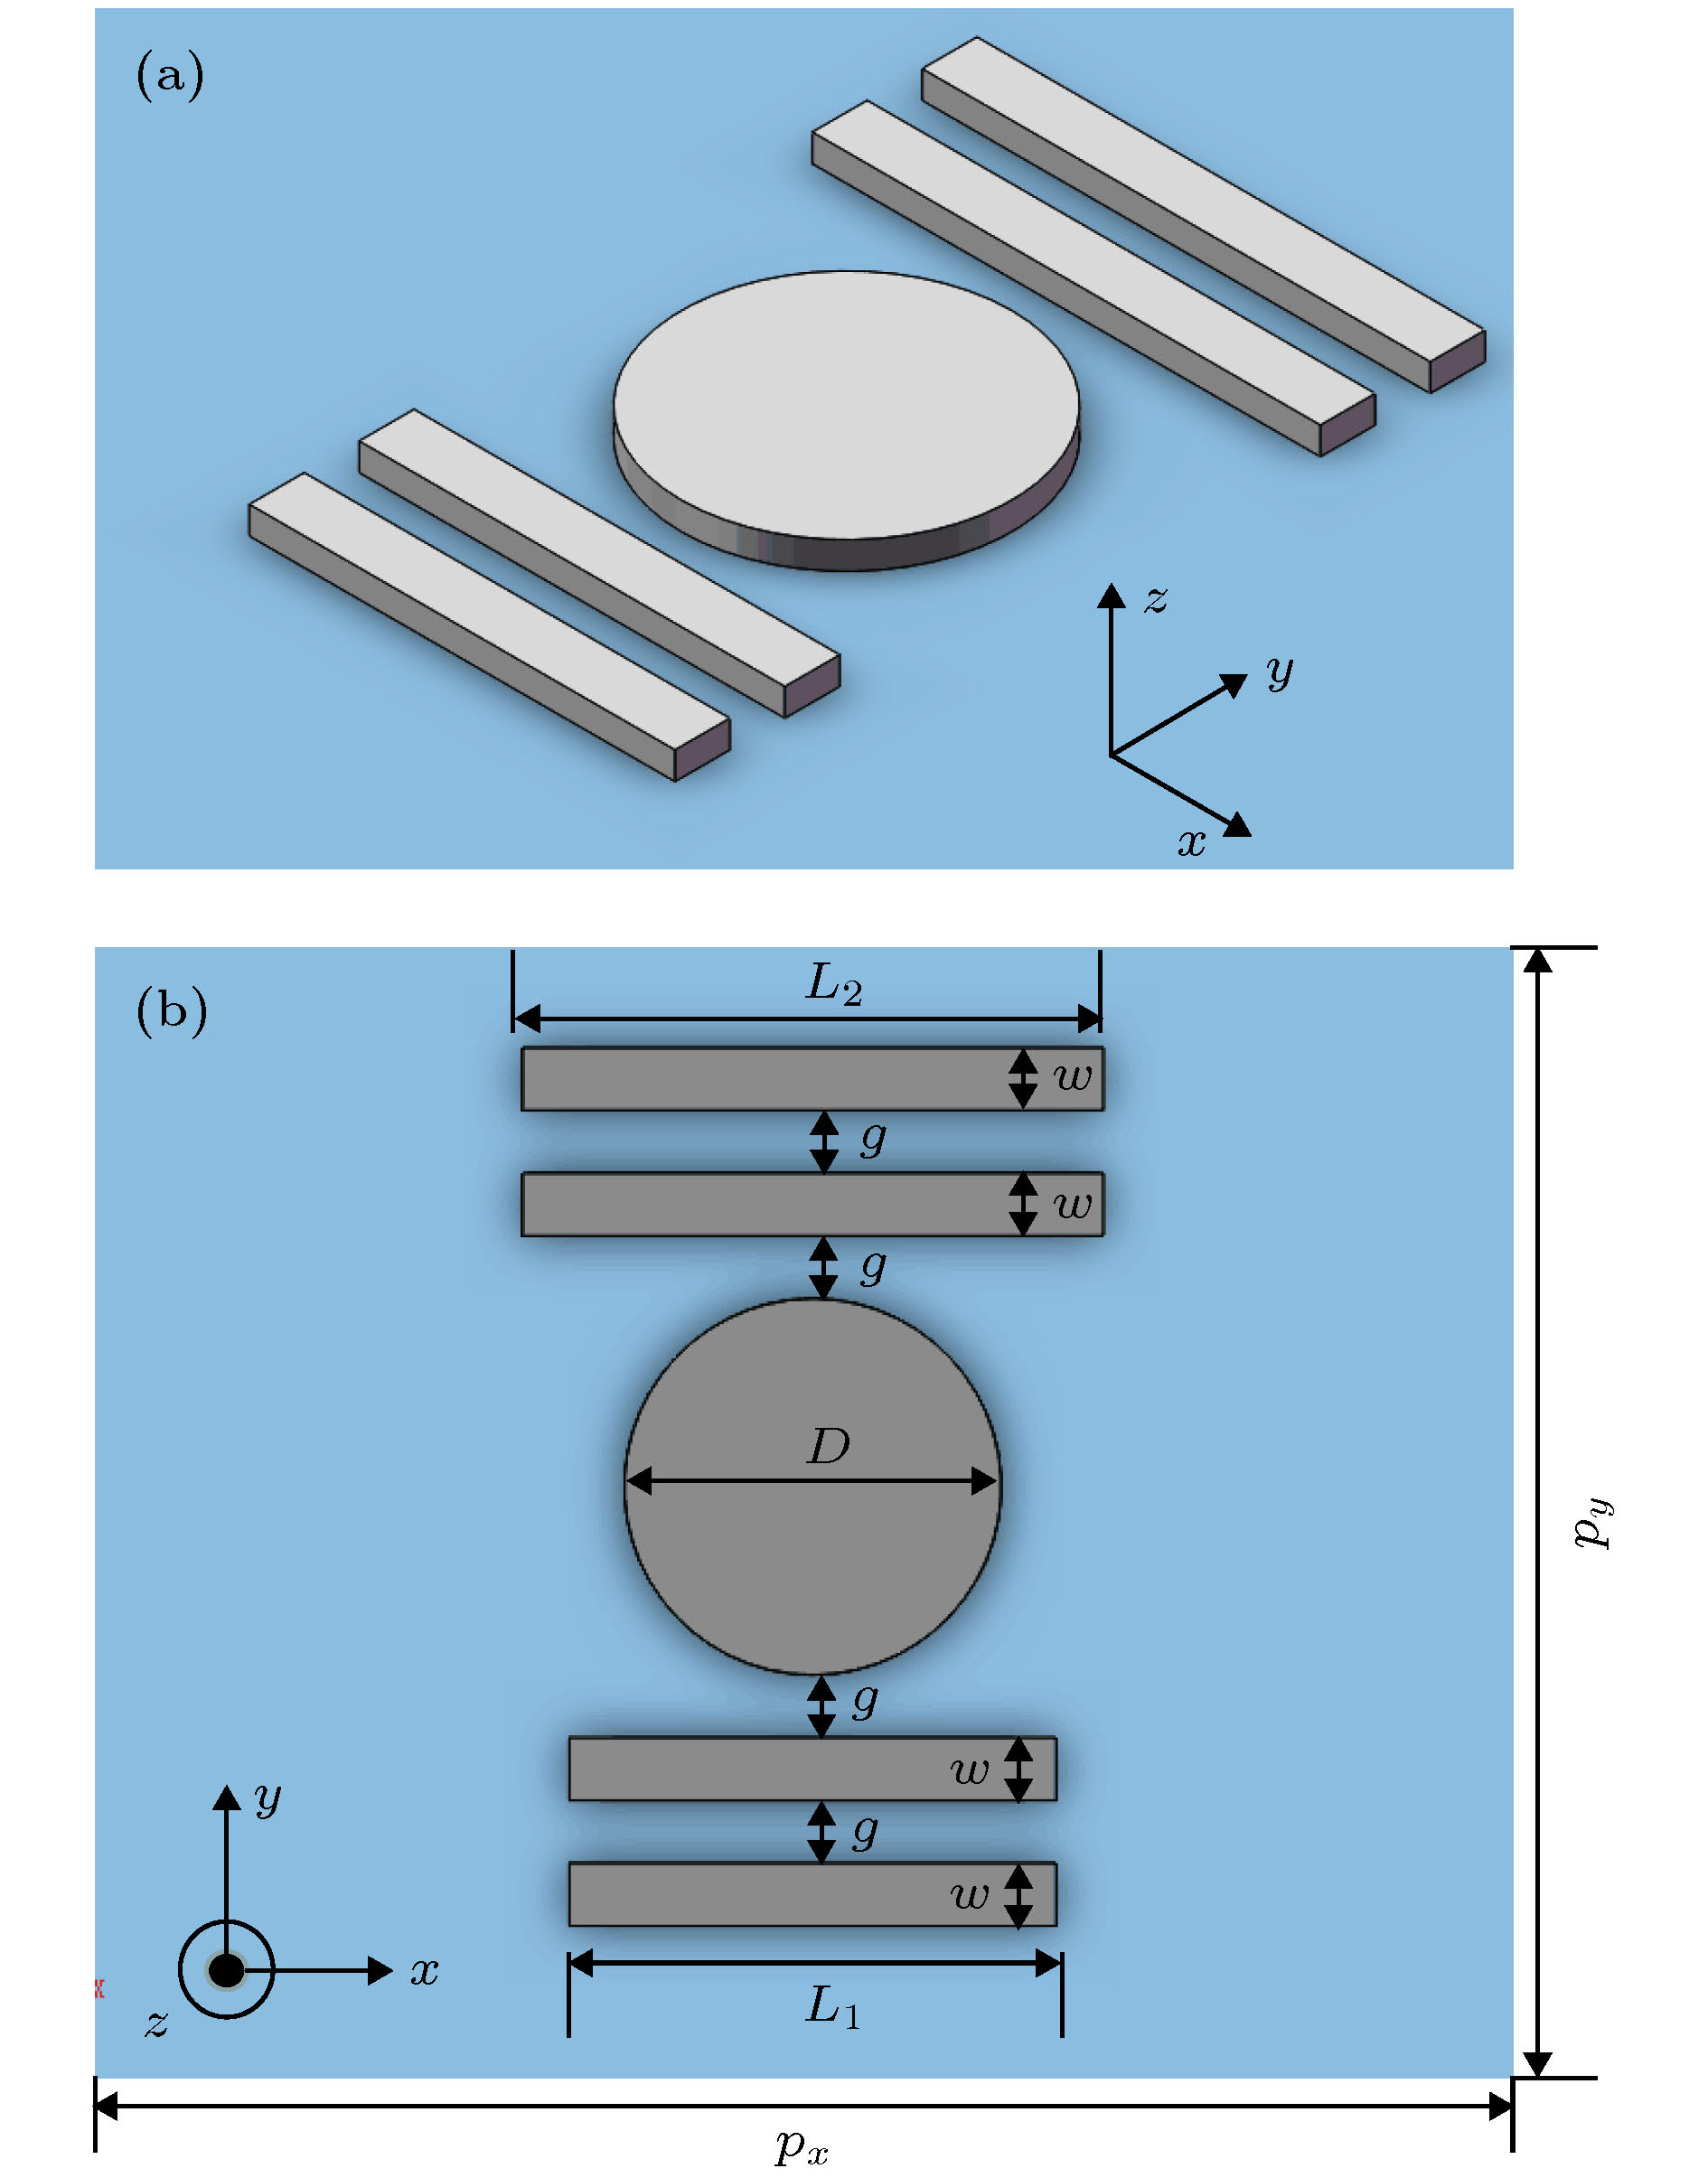 图 6 四频段PIT模型结构图 (a)三维空间结构图; (b)二维平面结构图
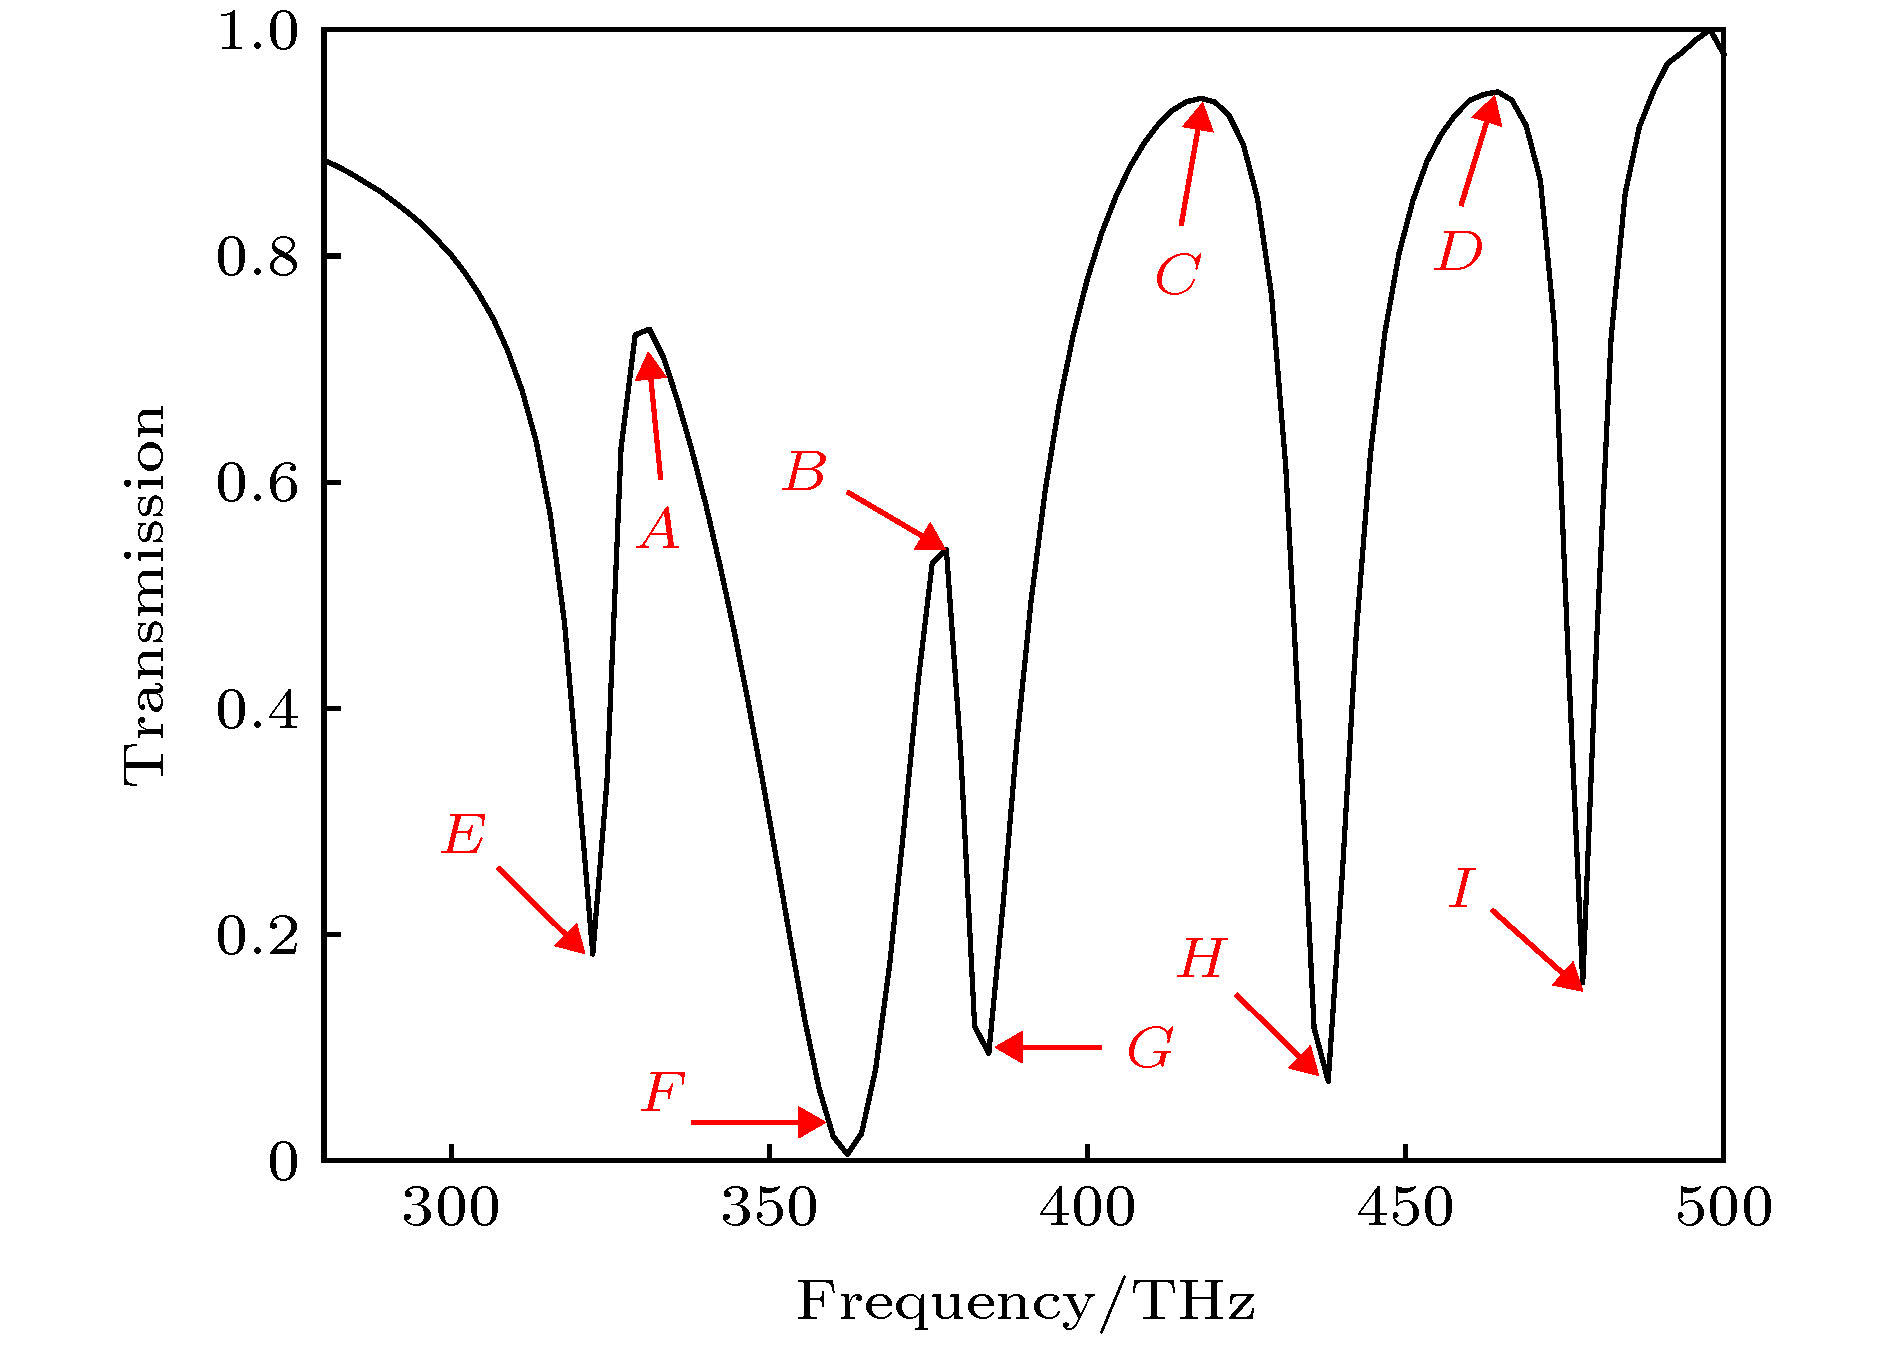 图 7 四频段PIT模型的透射曲线


 图 8 两种双频段PIT模型与四频段PIT模型透射率对比

 图 9 四频段PIT模型在(a) peak A, (b) peak B, (c) peak C, (d) peak D的电场分布


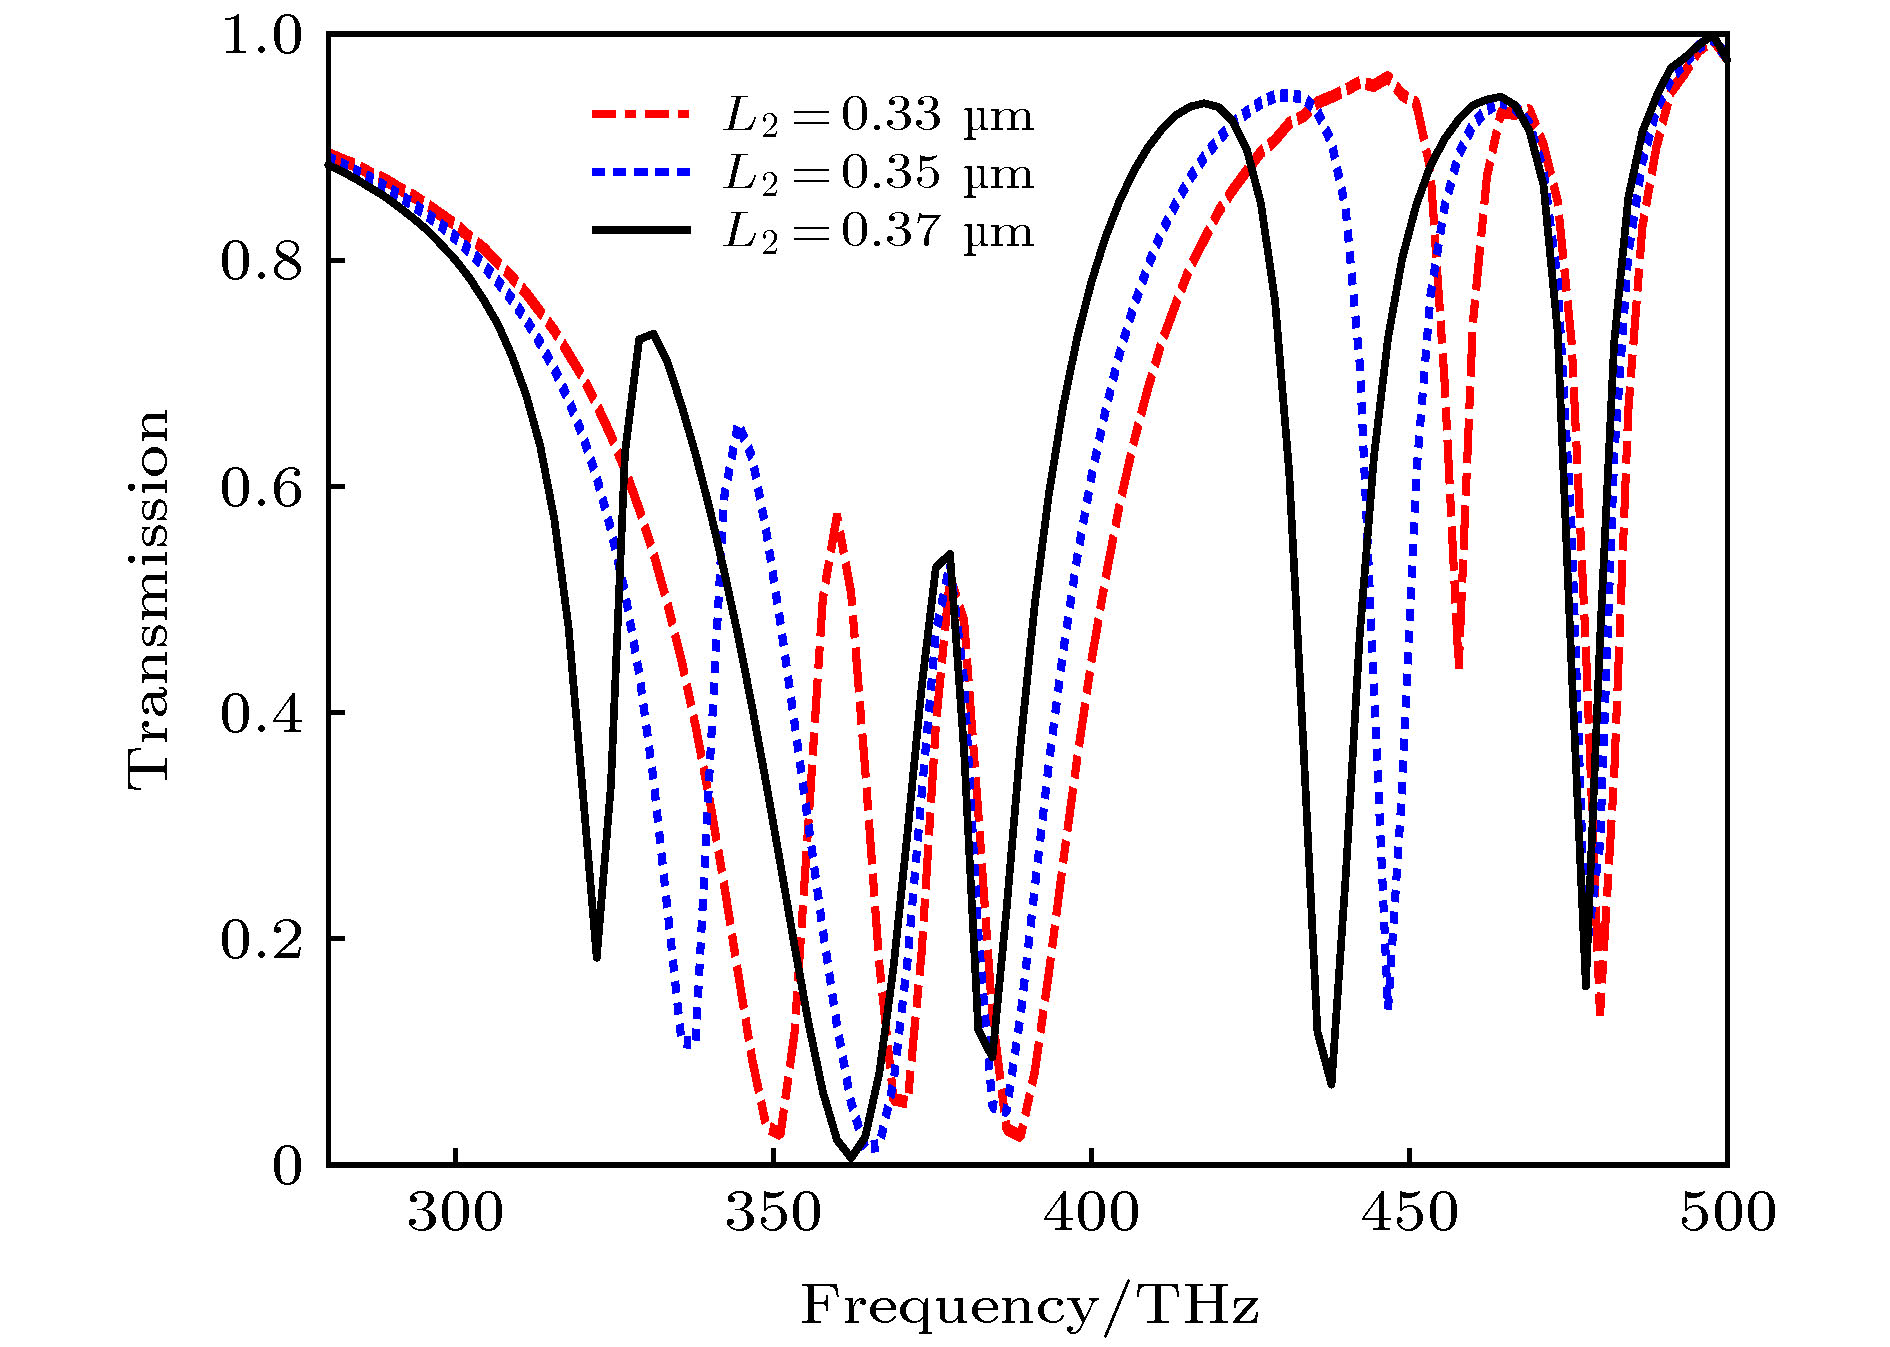 图 10 改变上棒长度L2时, 透射率随频率的变化
 图 11 改变下棒长度L1时, 透射率随频率的变化


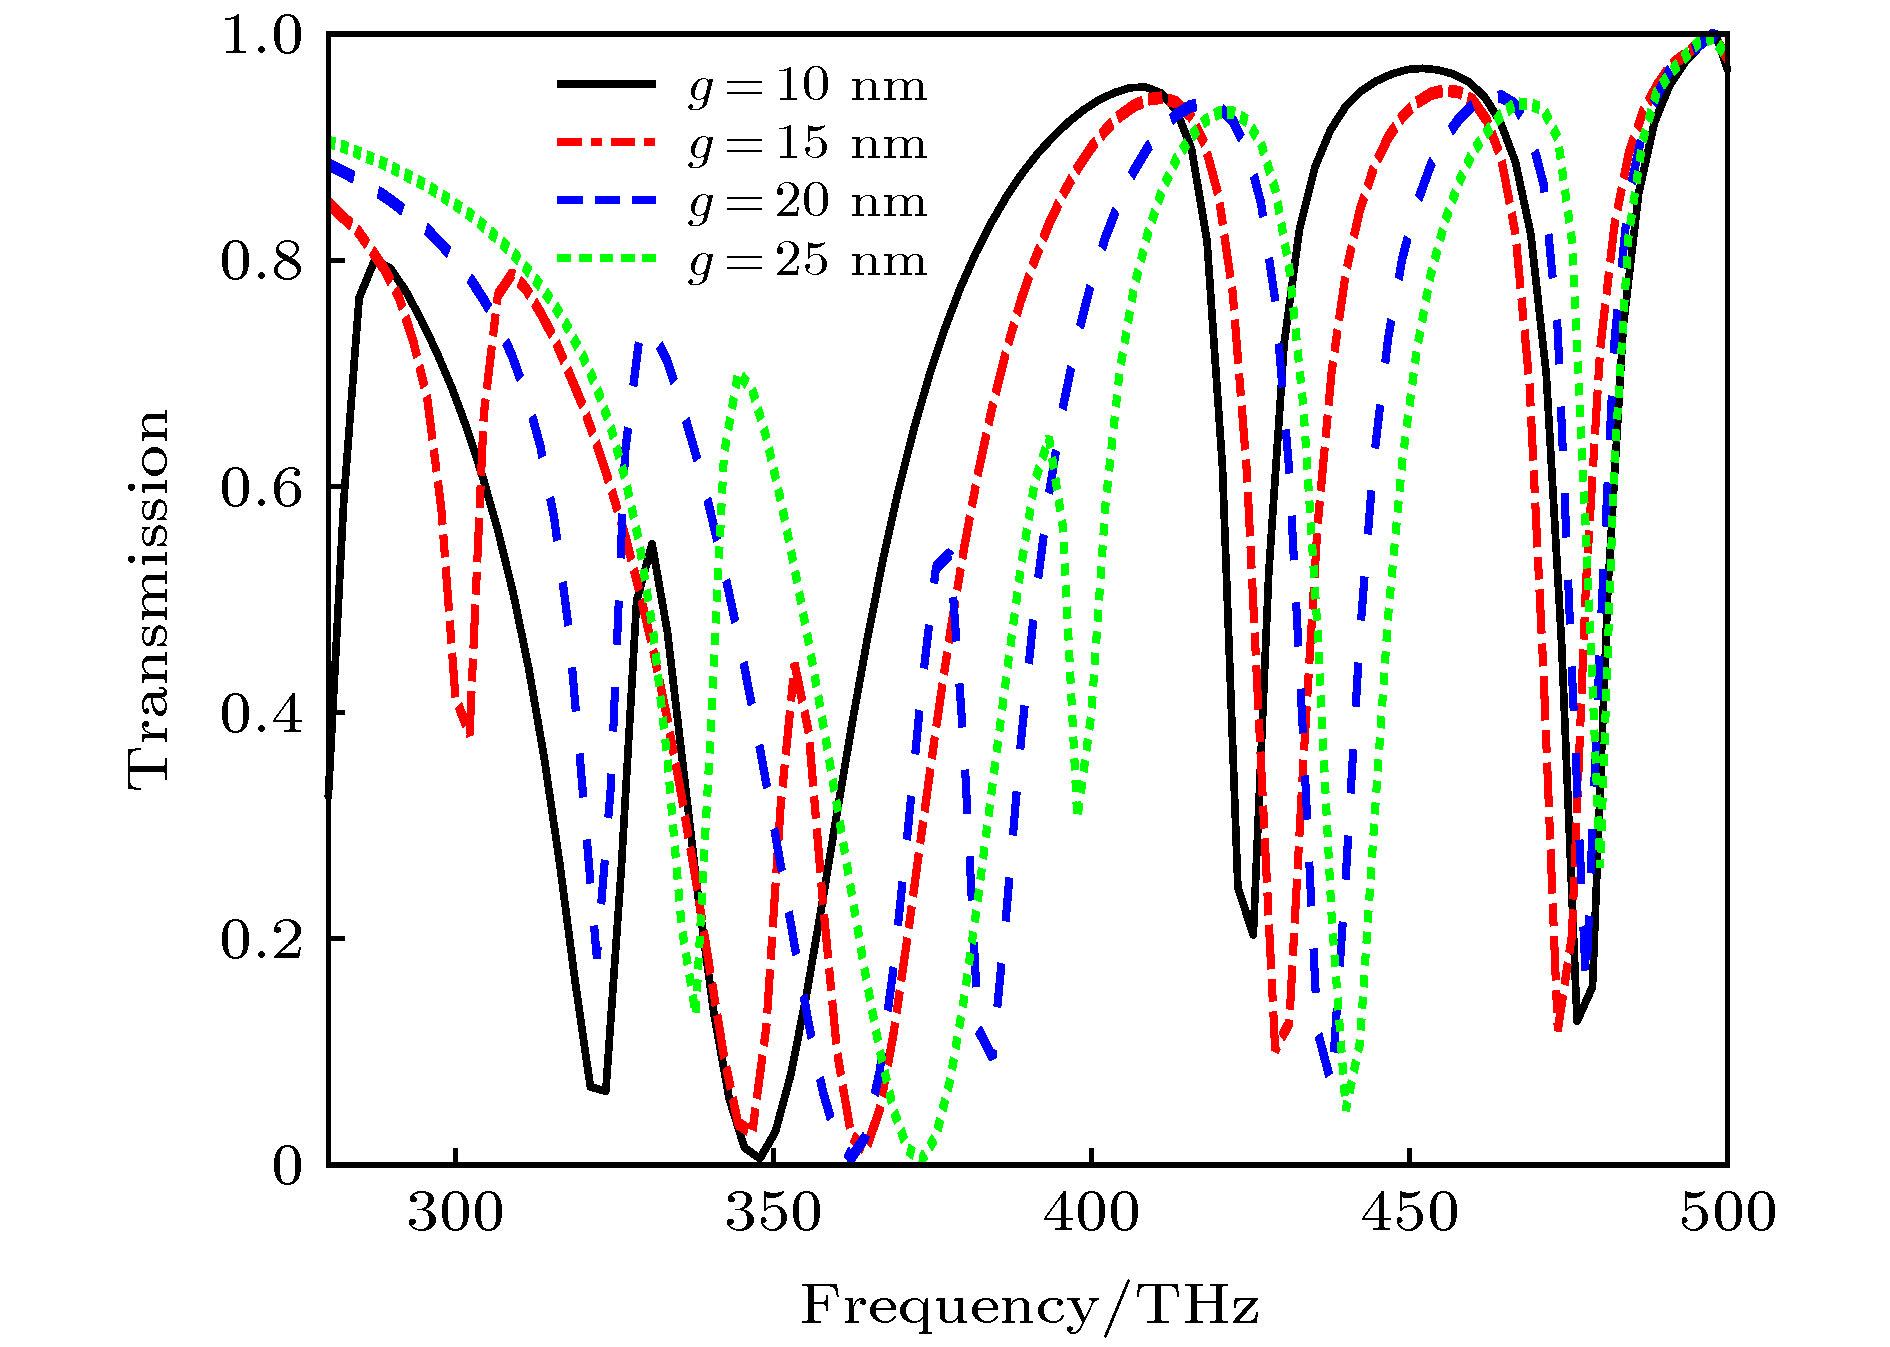 图 12 改变盘与棒之间、棒与棒之间的间隔g时透射率随频率的变化情况
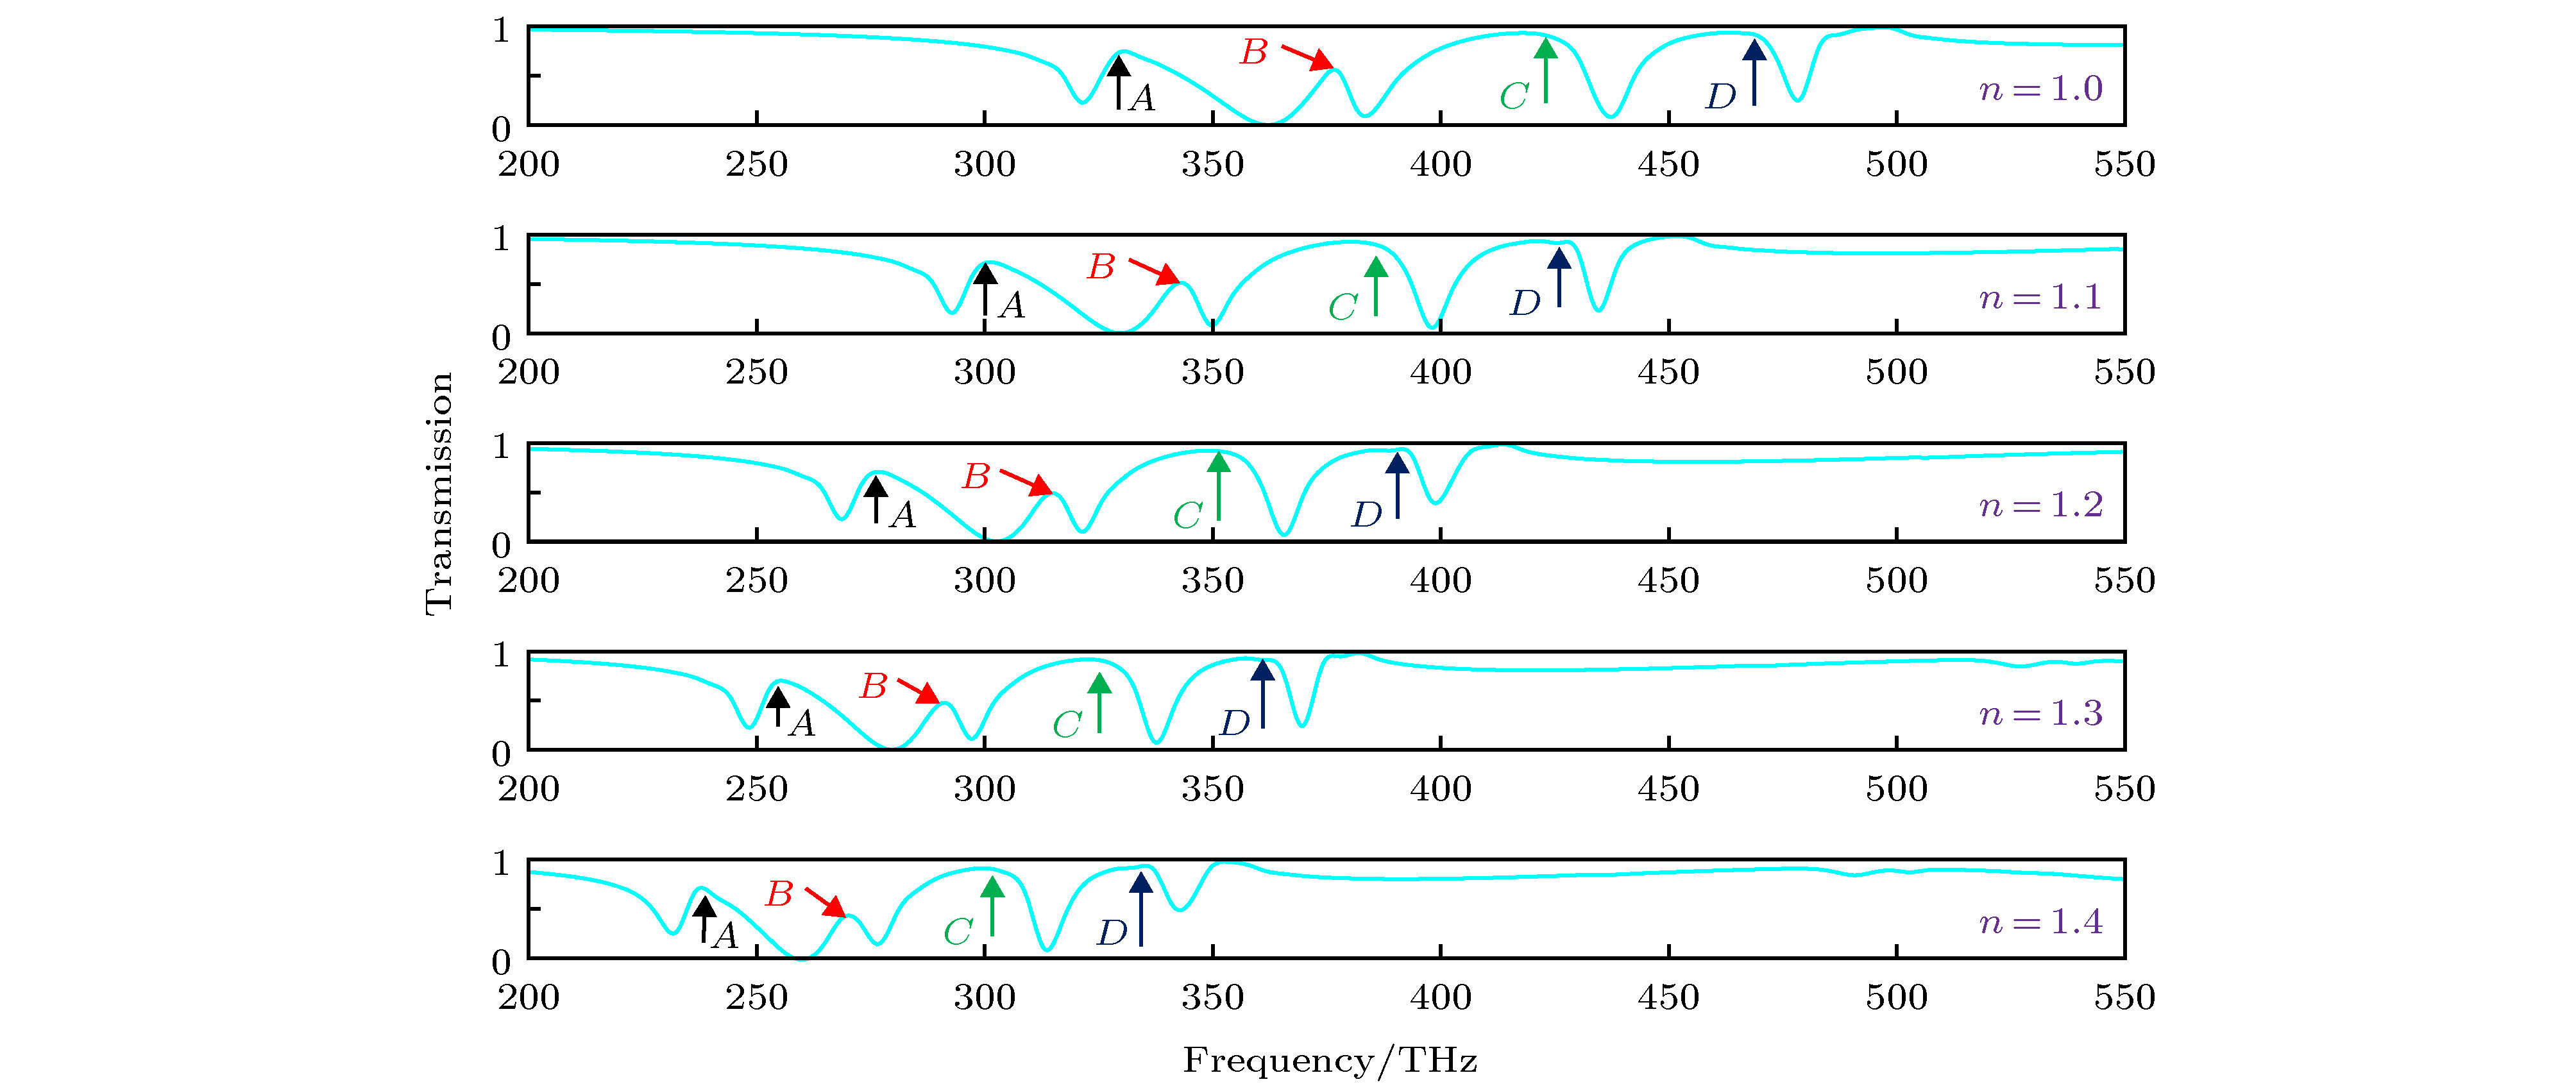 图 13 不同背景材料下的透射窗对比

 图 14 peak A和peak B随背景材料折射率的变化规律
 图 15 peak C和peak D随背景材料折射率的变化规律