Abstract:Graphene, atomically thin two-dimensional (2D) nanomaterial consisting of a single layer of carbon atoms, has received tremendous attention in the past few decades. Graphene may be considered as an excellent nanomaterial for fabricating nanomechanical resonator systems to investigate the quantum behavior of the motion of micromechanical resonators because of its unique properties of low mass density, high frequency, high quality-factor, and intrinsically small size. Additionally, graphene optomechanics based on a bilayer graphene resonator coupled to a microwave on-chip cavity, where light and micromechanical motion interact via the radiation pressure, has been demonstrtated experimentally recently. In this work, we demonstrate theoretically the nonlinear optical effect including optical bistability and four-wave mixing under the regimes woth different parameters and detunings in a graphene resonator-microwave cavity system. When the graphene optomechanics is driven by one strong pump laser beam, we find that the optical bistability can be controlled by tuning the power and the frequency of the pump beam. The four-wave mixing (FWM) phenomenon is also investigated and we find that sharp peaks in the FWM spectrum exactly are located at the resonant frequency of graphene resonator. Therefore, a straight nonlinear optical means for determining the resonant frequency of the graphene resonator is presented. Setting the cavity field resonating with pump field, and then scanning the probe frequency across the cavity frequency, one can easily and exactly obtain the resonant frequency of the resonator from the FWM spectrum. We further theoretically propose a mass sensor based on the graphene optomechanical system. The mass of external nanoparticles deposited onto the graphene resonator can be measured conveniently by tracking the shift of resonant frequency due to mass changing in the FWM spectrum. Compared with optomechanical mass sensors in linear regime, the nonlinear optical mass sensor may be immune to the detection noise. The system may have potential applications in communication networks for frequency conversion and provide a new platform for high sensitive sensing devices. Keywords:graphene optomechanics/ optical bistability/ four-wave mixing/ mass sensor
3.数值结果与讨论在22 mK的温度下, 石墨烯纳米振子耦合到微波腔系统的参数如下[43]: m = 10 fg, meff = 1.89 × 10⁻¹³ g, C = 45 fF, Cg = 0.4 fF, ωc/2π = 7.82 GHz, ωm/2π = 24 MHz, κ/2π = 5.6 MHz, g/2π = 35 Hz, 石墨烯机械振子的机械品质因子Qm = 15 × 103, γm/2π = ωm/Qm = 1.6 kHz. (6)式描述腔内光子数${n_{\rm{c}}}$的立方方程, 将呈现出光学双稳态行为. 图2画出了在三个不同泵浦功率驱动下腔内光子数${n_{\rm{c}}}$作为腔场与泵浦场频率失谐${\varDelta _{\rm{p}}} = {\omega _{\rm{c}}} - {\omega _{\rm{p}}}$的函数. 当泵浦功率比较小时, 如$P < 1.0\;\text{μ}{\rm{W}}$($P = 0.2\;{\rm{ \text{μ} W}}$), 虽然图2中没有给出, 但腔内光子数${n_{\rm{c}}}$的曲线呈现洛伦兹线形. 随着进一步增加泵浦功率P, 当泵浦功率达到临界值时, 双稳态现象产生. 图2给出泵浦功率从$P = 1.0\;{\rm{ \text{μ} W}}$到$P = 4.0\;{\rm{\text{μ} W}}$腔内光子数${n_{\rm{c}}}$的演化过程. 显然腔内光子数曲线由小泵浦功率下的洛伦兹线形转换到较大功率下的不对称曲线. 由(6)式可知腔内光子数${n_{\rm{c}}}$有三个实根, 其中最大和最小的根是稳定的, 而中间的一个根是不稳定的. 腔内光子数${n_{\rm{c}}}$取决于泵浦功率P, 并且较大的腔场-泵浦场失谐${\varDelta _{\rm{p}}}$也有益于双稳态现象的观测. 图 2 在三个不同泵浦功率条件下石墨烯光力腔内光子数作为腔-泵浦失谐${\varDelta _{\rm{p}}}$的函数 Figure2. Mean intracavity photon number of graphene optomechanical cavity as a function of the cavity-pump detuning ${\varDelta _{\rm{p}}}$ with four pump powers.
此外, 本文进一步讨论了光学双稳态行为分别在红边带失谐(${\varDelta _{\rm{p}}} = {\omega _{\rm{m}}}$)和蓝边带失谐(${\varDelta _{\rm{p}}} = - {\omega _{\rm{m}}}$)条件下的演化过程. 图3(a)和图3(b)分别给出在${\varDelta _{\rm{p}}} = {\omega _{\rm{m}}}$和${\varDelta _{\rm{p}}} = - {\omega _{\rm{m}}}$条件下, 腔内光子数${n_{\rm{c}}}$作为泵浦功率P的函数. 显然, 光学双稳态呈现类似磁滞回线的行为. 不同的是, 在两种不同的失谐条件下, 腔内光子数${n_{\rm{c}}}$随着泵浦功率P的演化过程呈现镜像反对称. 图 3 (a)在失谐${\varDelta _{\rm{p}}} = {\omega _{\rm{m}}}$时, 腔内光子数${n_{\rm{c}}}$作为泵浦功率P的函数; (b) 在失谐${\varDelta _{\rm{p}}} = - {\omega _{\rm{m}}}$时, 腔内光子数${n_{\rm{c}}}$作为泵浦功率P的函数 Figure3. (a) The mean intracavity photon number ${n_{\rm{c}}}$ as a function of P for ${\varDelta _{\rm{p}}} = {\omega _{\rm{m}}}$; (b) mean intracavity photon number ${n_{\rm{c}}}$ as a function of P for ${\varDelta _{\rm{p}}} = - {\omega _{\rm{m}}}$.
以上现象的物理本质来自于光相干干涉效应: 当用泵浦光场和探测光场同时驱动该石墨烯光力系统时, 导致辐射压力在拍频$\varOmega $共振相干, 诱导石墨烯振子在其共振频率处振动, 进而诱导出斯托克斯(${\omega _{\rm{S}}} = {\omega _{\rm{p}}} - {\omega _{\rm{m}}}$)和反斯托克斯散射光(${\omega _{{\rm{AS}}}} = {\omega _{\rm{p}}} + {\omega _{\rm{m}}}$). 当微波腔分别处于红边带失谐(${\varDelta _{\rm{p}}} = {\omega _{\rm{m}}}$)和蓝边带失谐(${\varDelta _{\rm{p}}} = - {\omega _{\rm{m}}}$)时, 处于频率为${\omega _{\rm{p}}} - {\omega _{\rm{m}}}$斯托克斯散射光和频率为${\omega _{\rm{p}}} + {\omega _{\rm{m}}}$的反斯托克斯散射光将分别被抑制, 而频率为${\omega _{\rm{p}}} + {\omega _{\rm{m}}}$的反斯托克斯散射光和频率为${\omega _{\rm{p}}} - {\omega _{\rm{m}}}$的斯托克斯散射光将重新建立腔肠, 诱导光学双稳态产生. 另一方面, 四波混频现象是腔光力系统中的另一种非线性行为. 在图4中通过(10)式画出了四波混频强度作为探测场-微波腔场失谐${\varDelta _{\rm{s}}} = {\omega _{\rm{s}}} - {\omega _{\rm{c}}}$的函数. 石墨烯光力系统的参数中石墨烯振子频率为${\omega _{\rm{m}}} = 24\;{\rm{ MHz}}$, 图4中进一步考虑其他的振子频率, 如ωm= 22 MHz, ωm= 26 MHz和ωm = 28 MHz. 从图4(a)发现, 虽然随着石墨烯振子频率的增加, 四波混频强度呈现减弱的趋势, 但四波混频谱线中尖峰的位置正对应于${\varDelta _{\rm{s}}} = \pm {\omega _{\rm{m}}}$, 即尖峰的位置正对应于石墨烯振子的频率, 如图4(b)和图4(c)所示. 该现象的物理本质来自于机械振动模式与两束光场通过微波腔相互作用而产生的量子相干效应. 当探测场与泵浦场之间的失谐$\varOmega = {\omega _{\rm{s}}} - {\omega _{\rm{p}}}$相接近时, 石墨烯振子开始振动并产生斯托克斯散射光(${\omega _{\rm{s}}} = {\omega _{\rm{p}}} - {\omega _{\rm{m}}}$). 该过程中, 电子在${\omega _{\rm{p}}} - {\omega _{\rm{m}}}$频率附近吸收两个光子, 放出一个光子, 诱导四波混频产生. 图 4 (a) 在四个不同石墨烯振子频率时, 四波混频谱FWM作为探测-腔失谐${\varDelta _{\rm{s}}}$的函数; (b) 和 (c)分别是左边和右边尖峰的放大 Figure4. (a) The four-wave mixing (FWM) spectrum as a function of probe-cavity detuning ${\varDelta _{\rm{s}}}$ under four different graphene resonator frequencies; (b) and (c) are the amplifications of the left and right peaks.
图4同时也指明一种测量石墨烯振子频率的非线性光学方法. 石墨烯振子频率的确定包括两步骤: 第一步, 使泵浦场频率与微波腔场频率相等, 即${\varDelta _{\rm{p}}} = 0$; 第二步, 探测场扫描石墨烯光力系统, 四波混频谱中尖峰的位置便对应石墨烯振子的振动频率. 这样通过探测四波混频谱便可以较容易而且直接地测得石墨烯振子的振动频率. 石墨烯振子的频率确定后, 接下来给出一种测量纳米颗粒质量的非线性光学方法. 质量传感的原理在于监测由吸附在石墨烯振子上的微小纳米颗粒所引起的微小频移${\rm{\delta }}f$, 然后通过(11)式便可确定纳米颗粒的质量. 本文以测量纳米颗粒(如金属纳米颗粒、生物分子等)的质量为例, 纳米颗粒质量的数量级为飞克($1\;{\rm{ fg}} = {10^{ - 15}}\;{\rm{ g}}$). 把纳米颗粒沉积到石墨烯振子的表面(如图1所示), 然后通过观测四波混频谱中的频移, 这里假定纳米颗粒均匀地分布在石墨烯振子的表面, 并且纳米颗粒的质量不影响石墨烯振子的弹性系数. 图5给出了石墨烯振子表面没有吸附(黑色曲线)和吸附(彩色曲线)纳米颗粒时四波混频谱作为探测失谐${\varDelta _{\rm{s}}}$的函数. 当石墨烯振子表面没有沉积纳米颗粒时(黑色曲线), 四波混频谱线中尖峰的位置正对应于石墨烯振子的频率. 当石墨烯振子表面吸附纳米颗粒后, 随着沉积纳米颗粒质量的增加, 频率呈现显著的移动, 如图5中彩色曲线所示. 通过测量频率的移动, 便可确定纳米颗粒的质量. 图5中的插图显示了频移与沉积到石墨烯振子表面上纳米颗粒质量之间的线性关系, 斜率表示石墨烯振子的质量灵敏度. 图 5 当把纳米颗粒沉积到石墨烯振子表面上时, 四波混频谱的频移. 插图是纳米颗粒的质量与频移之间的线性关系 Figure5. The four-wave mixing (FWM) spectrum after landing the nanoparticles on the surface of graphene resonator and the color curves shows the mechanical frequency-shifts. The inset shows the linear relationship between the frequency-shifts and the mass of the nanoparticles.


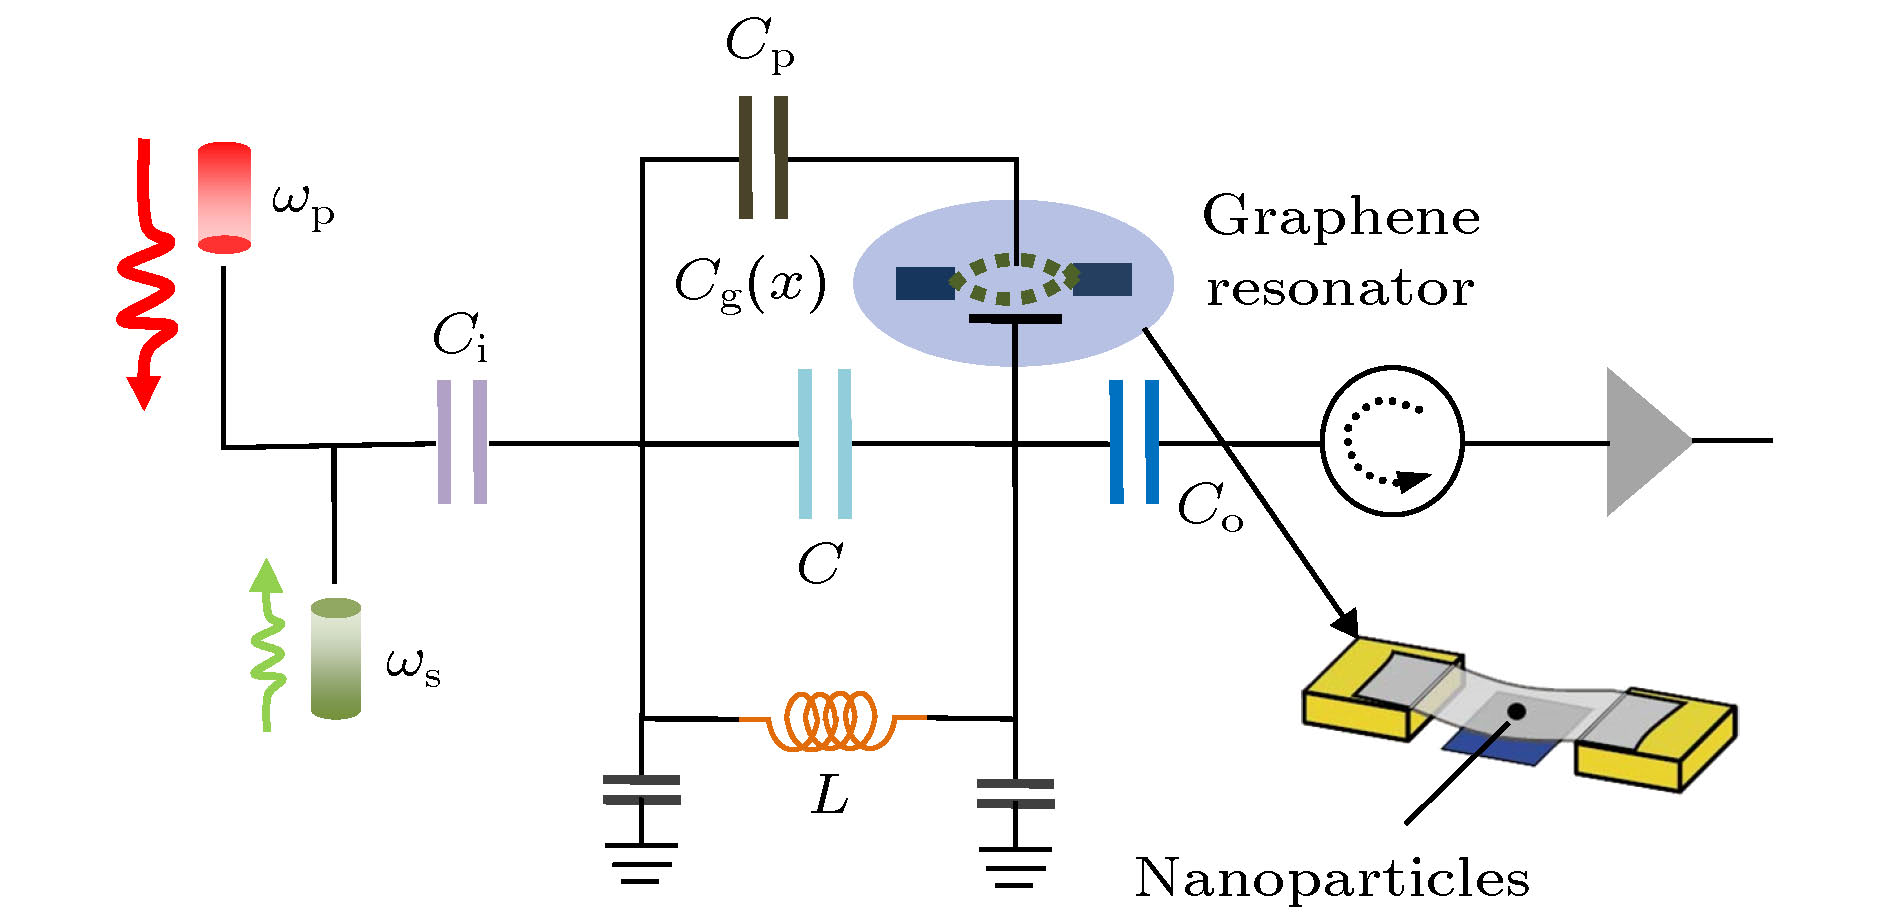 图 1 石墨烯光力系统与非线性质量传感示意图, 其中该系统由一束频率为


 图 2 在三个不同泵浦功率条件下石墨烯光力腔内光子数作为腔-泵浦失谐


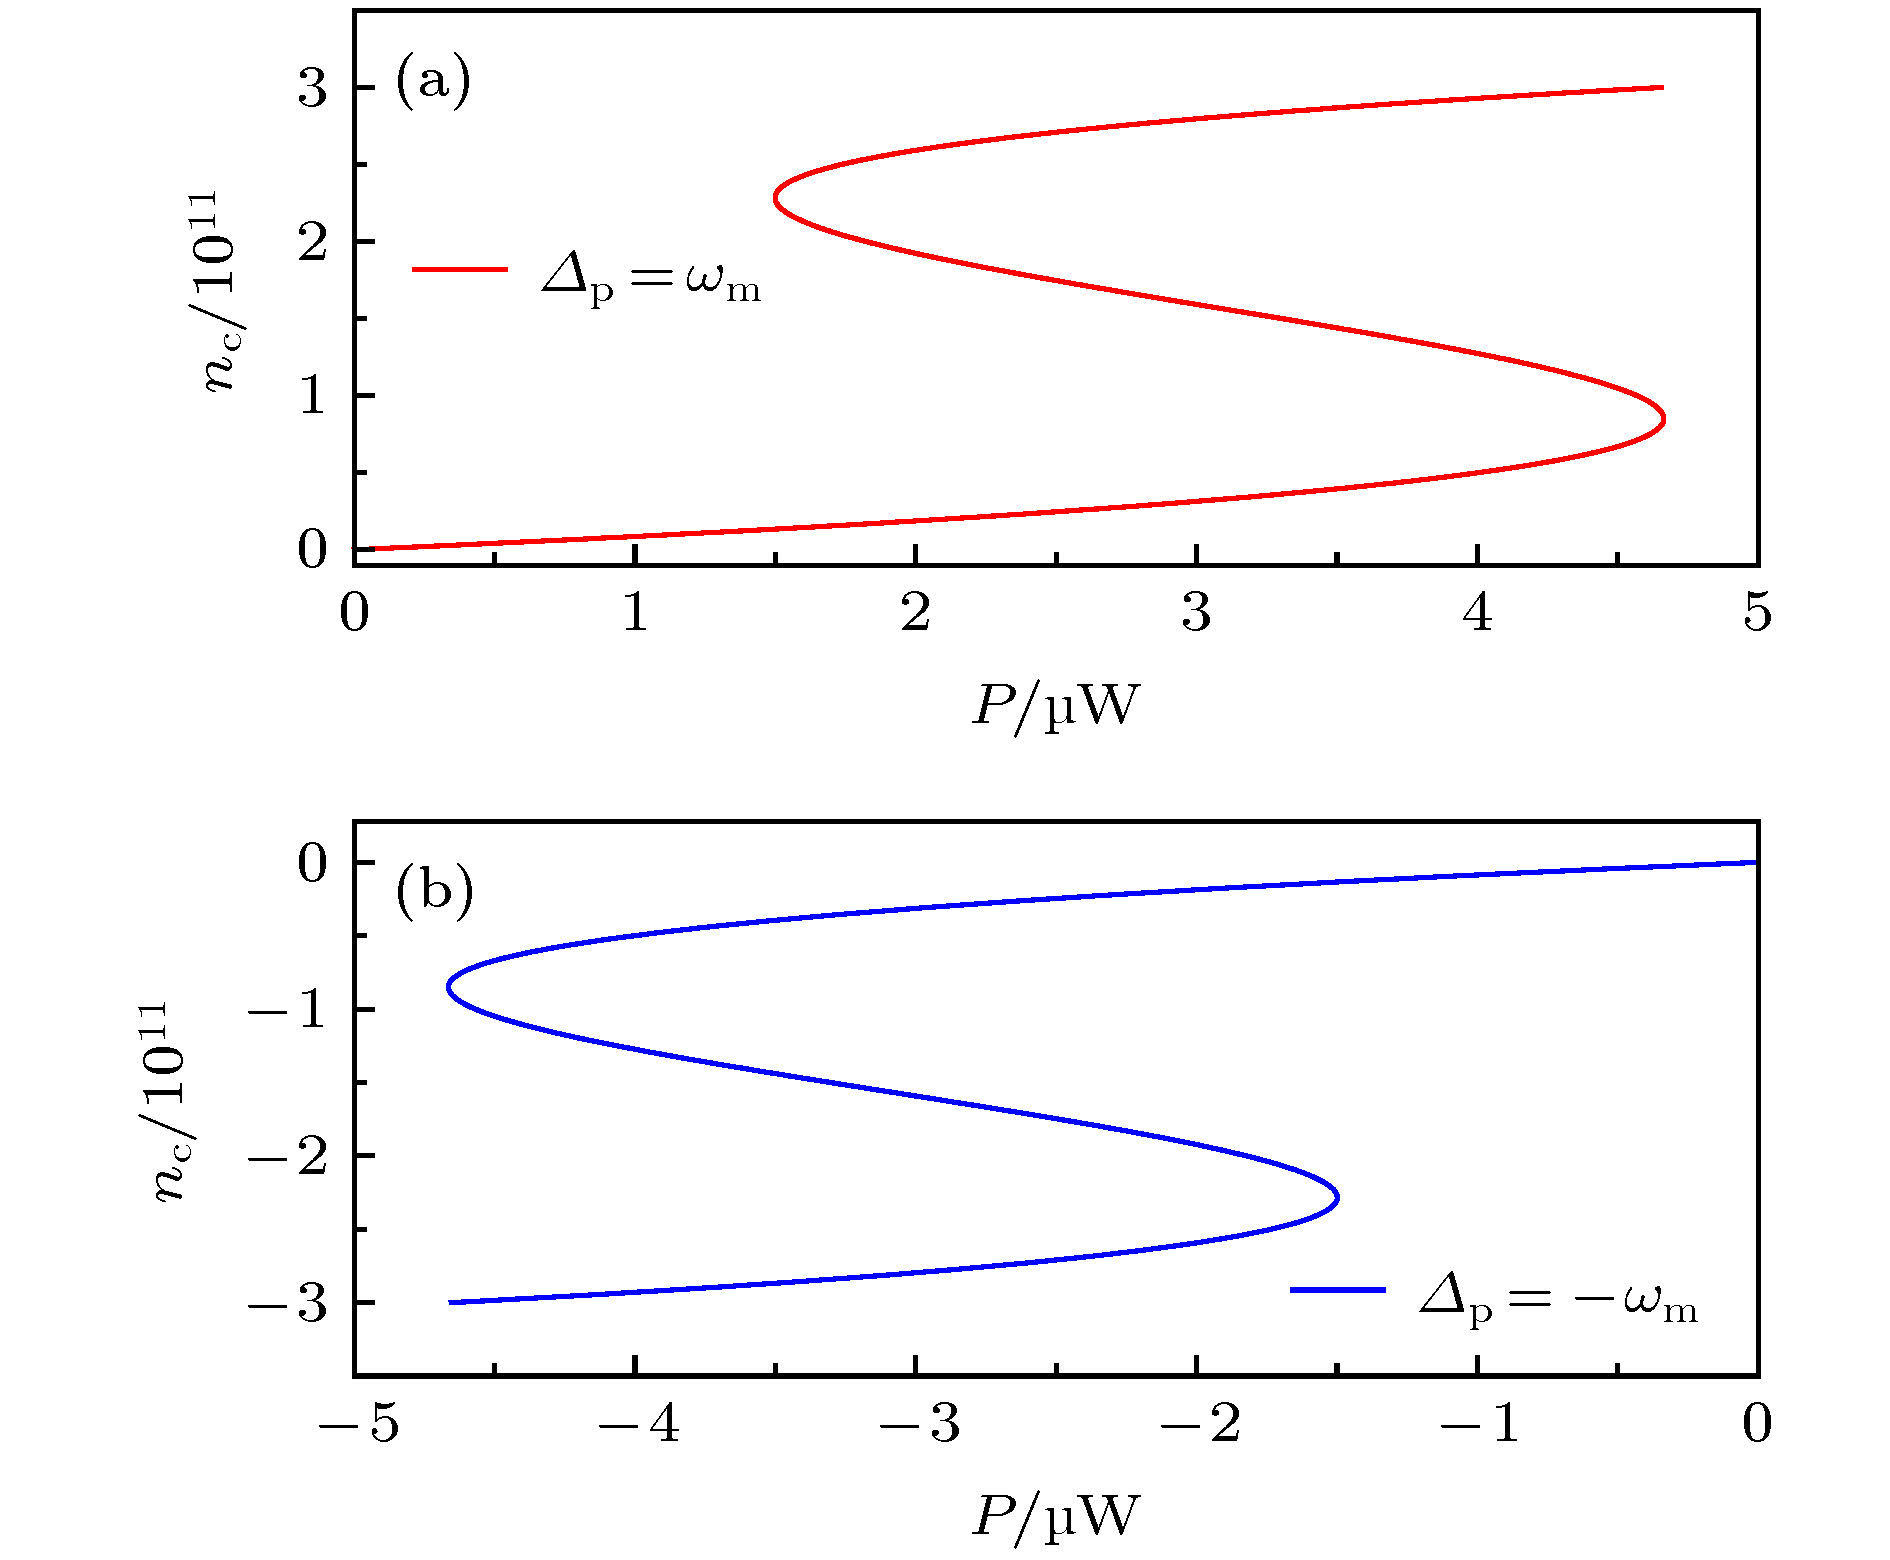 图 3 (a)在失谐


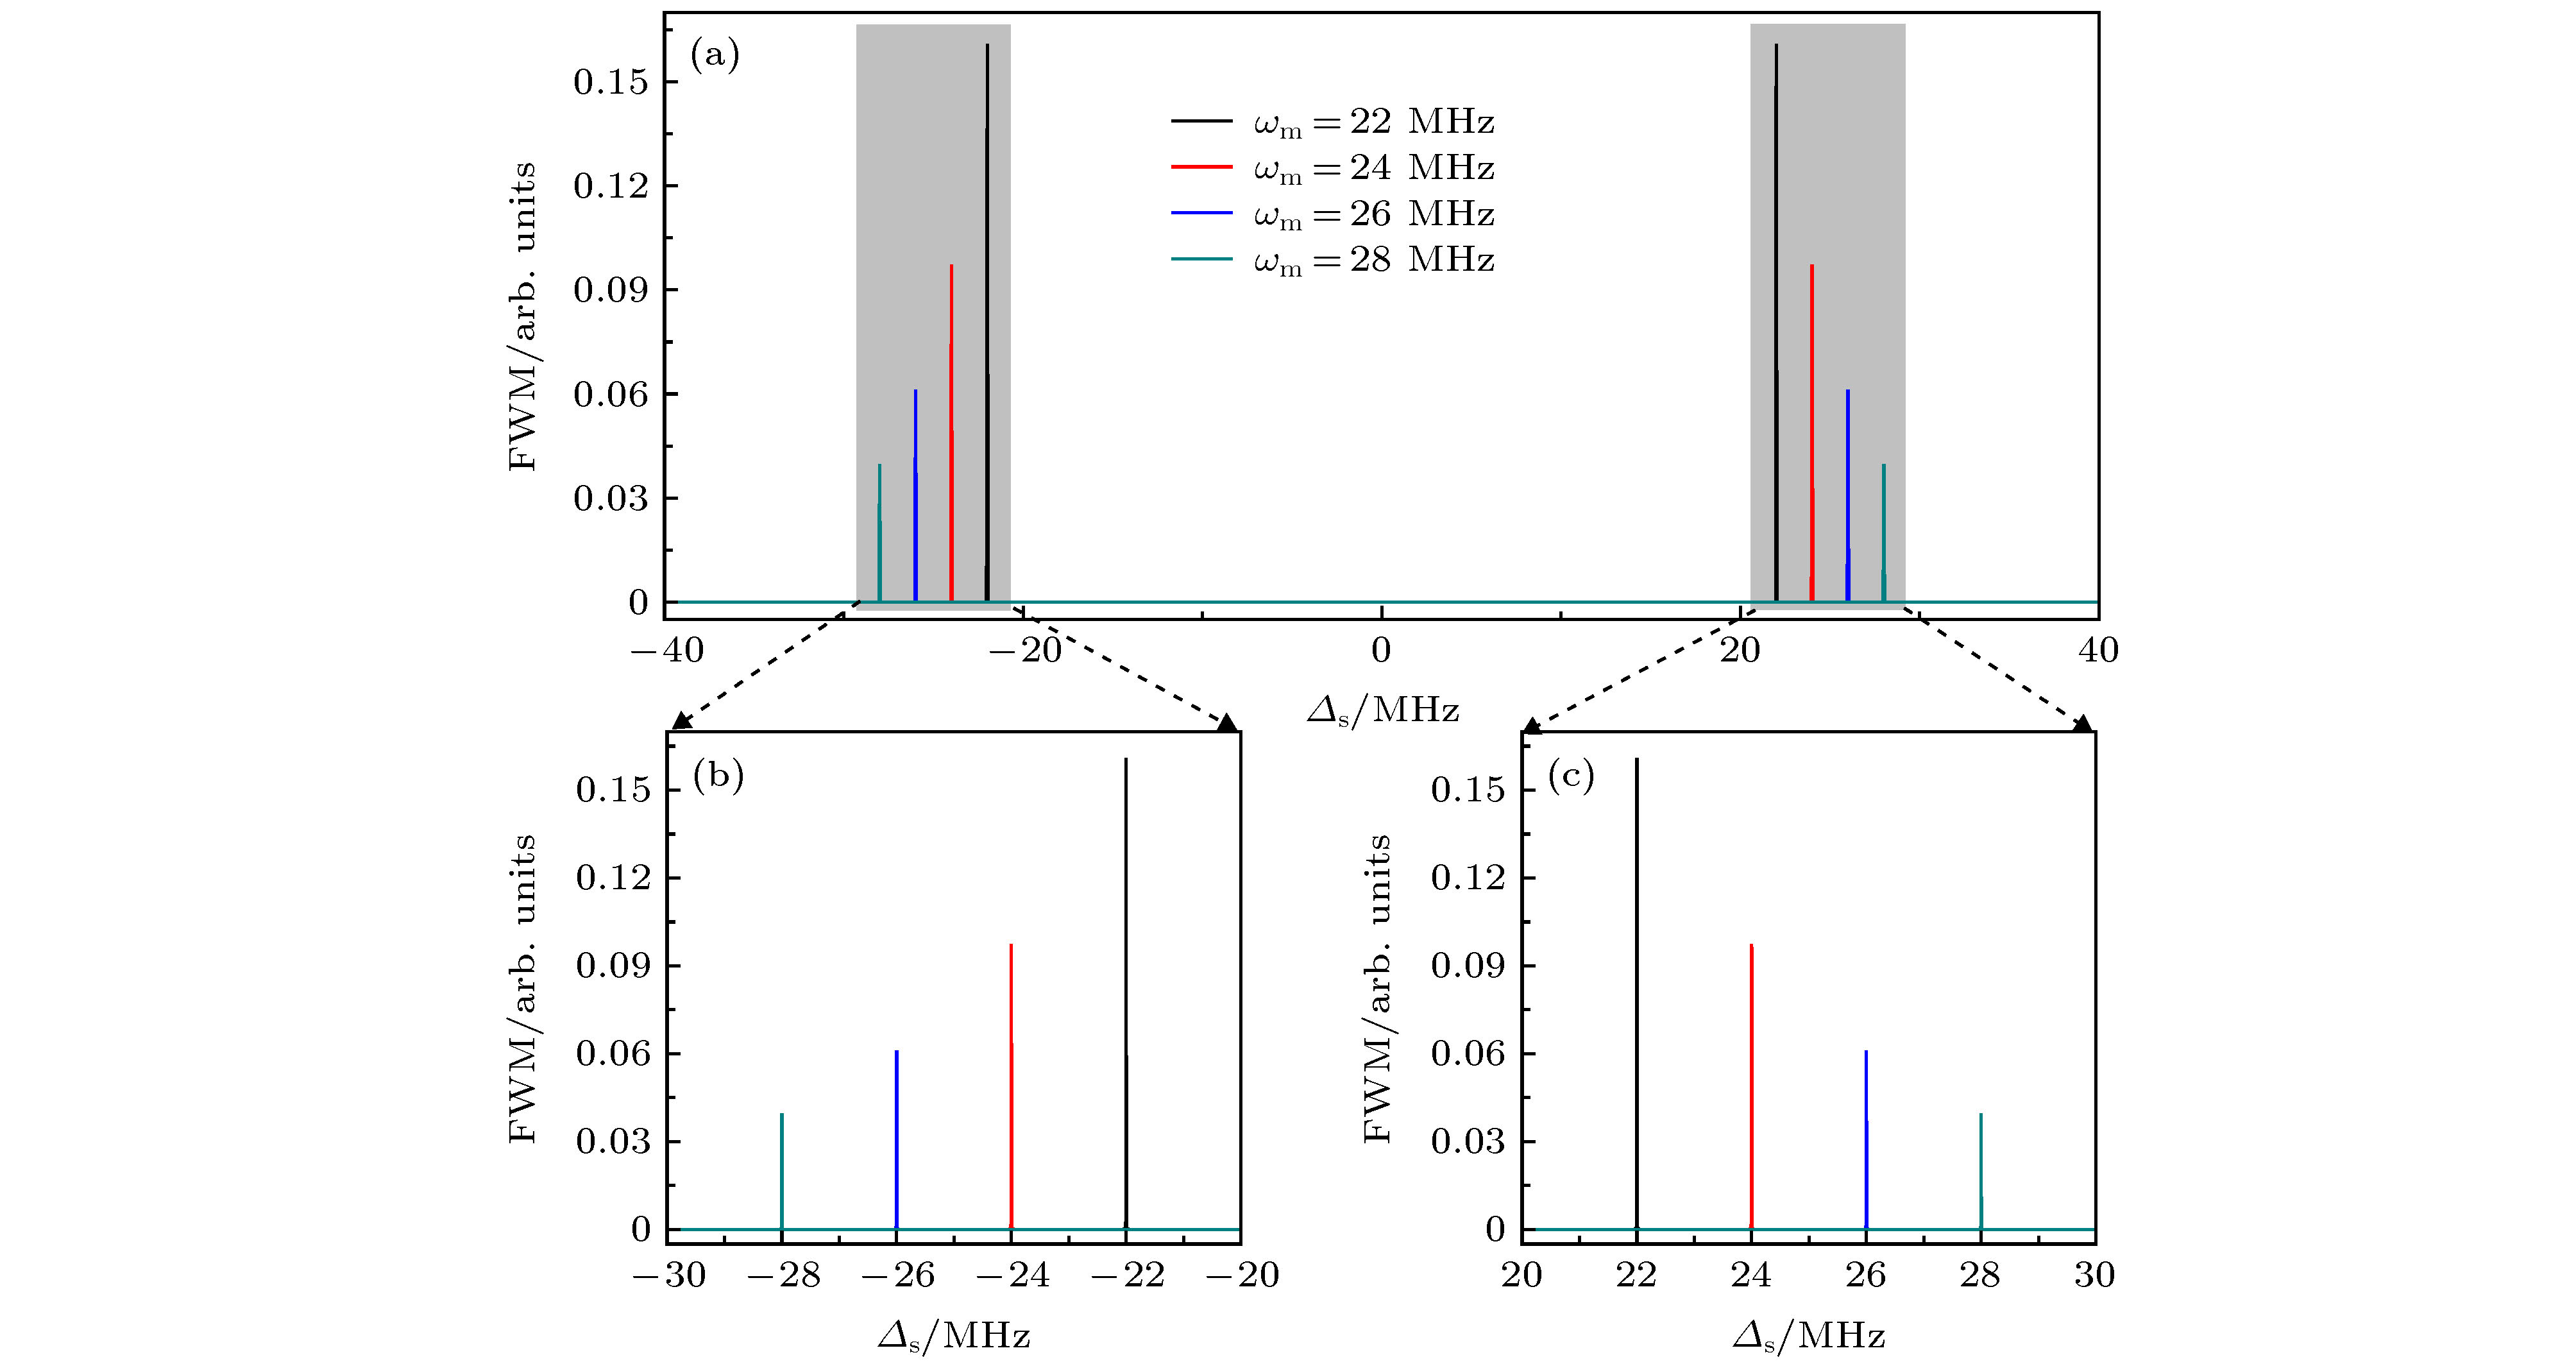 图 4 (a) 在四个不同石墨烯振子频率时, 四波混频谱FWM作为探测-腔失谐


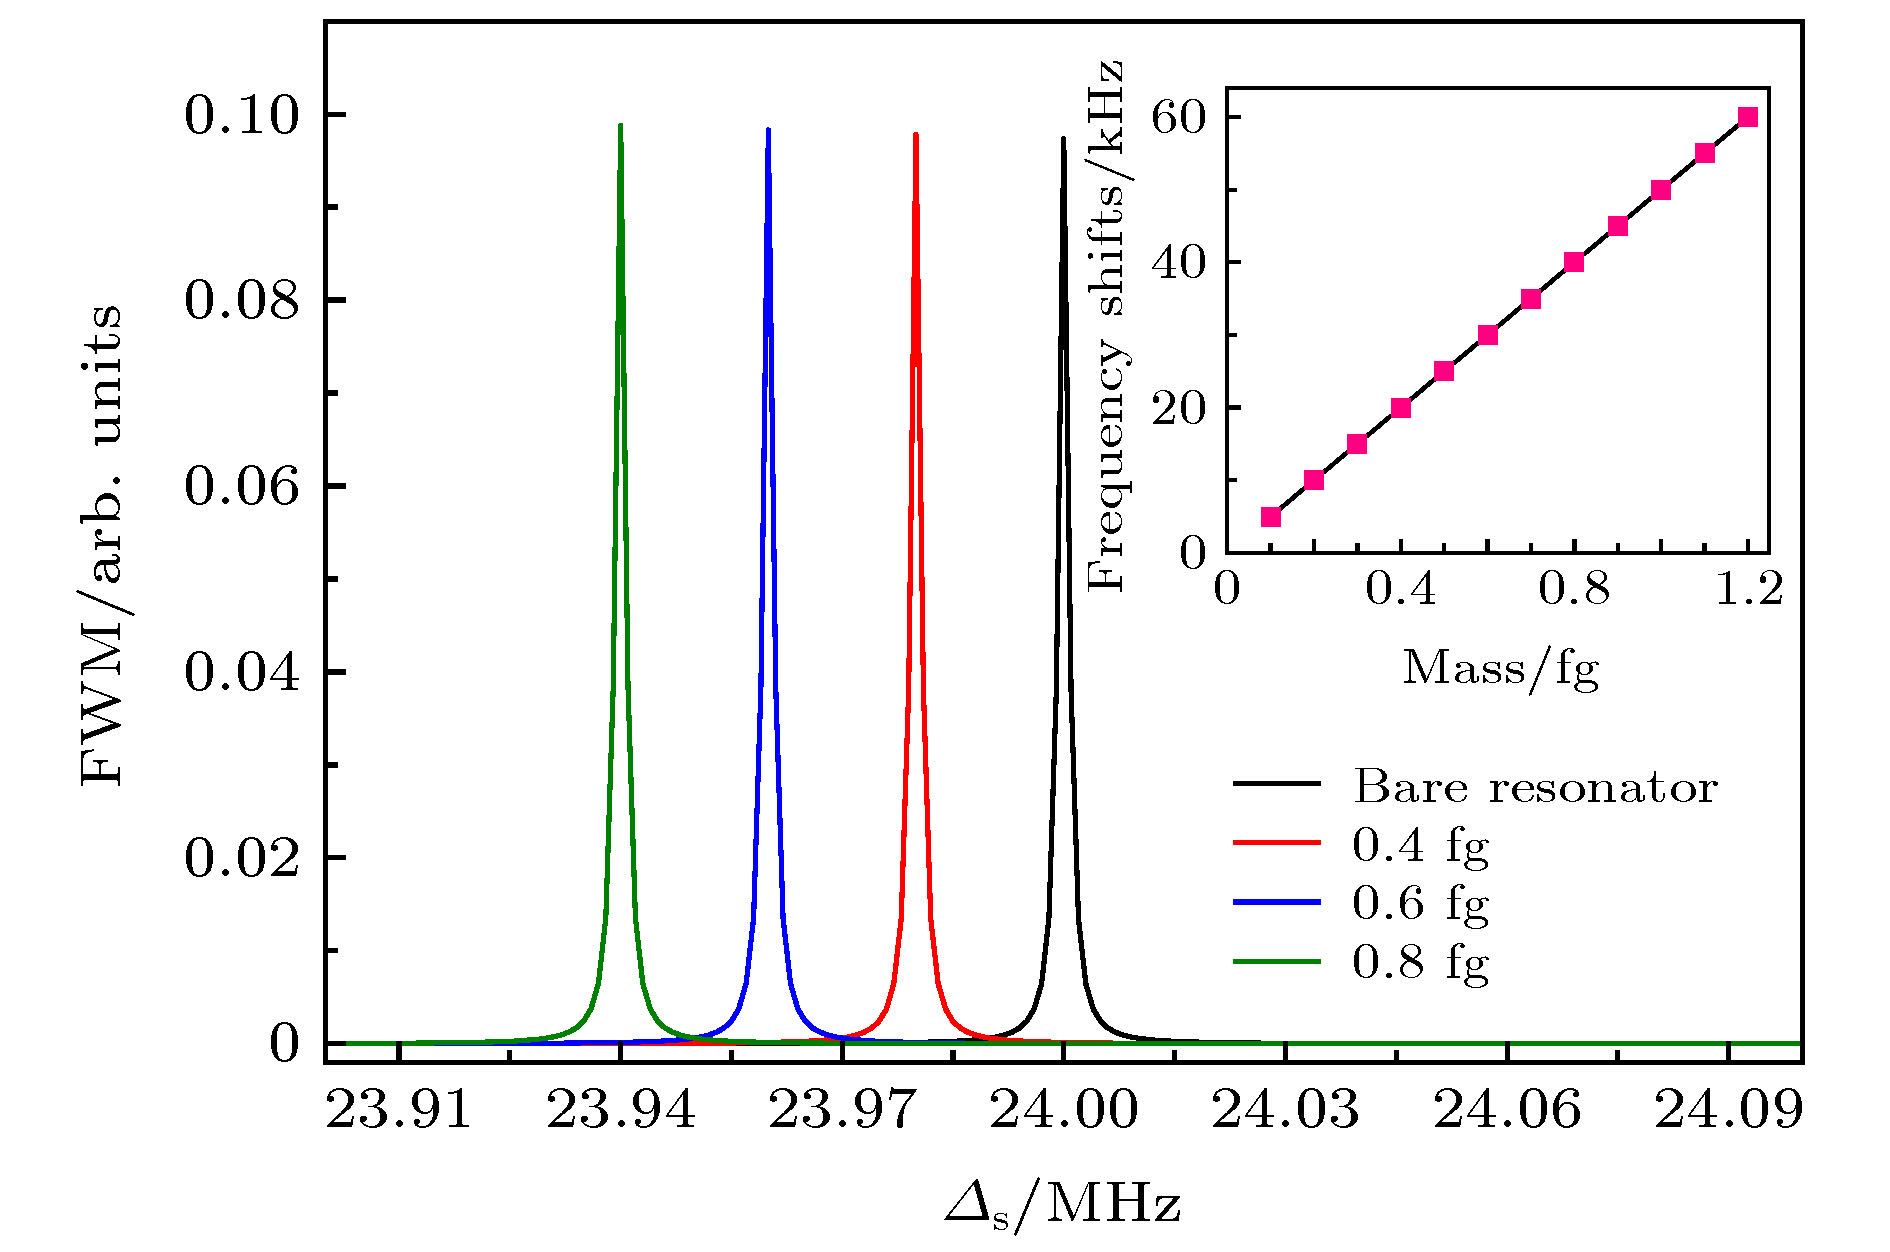 图 5 当把纳米颗粒沉积到石墨烯振子表面上时, 四波混频谱的频移. 插图是纳米颗粒的质量与频移之间的线性关系


