全文HTML
--> --> -->文献[11]对Mons Rümker高原的累积光照条件进行研究, 发现3年时间拥有30%至53%的光照率, 且地基观测系统的通信条件较好. 优良的光照条件可以快速地提升月表温度, 但由于月表风化层具有良好的绝热特性, 使得光照对风化层内部温度的贡献有限[12-15]. 尽管文献[12—15]对风化层温度分布进行了估算, 但太阳光照方向主要依据理论公式求得, 与现实情况存在一定的偏差. 另外, 他们在估算光照引起的温度分布时, 并没有考虑地形对太阳光的遮挡, 而地形遮挡效应对实际探测活动至关重要. 为此, 本文利用美国NASA (National Aeronautics and Space Administration)开发的SPICE(Spacecraft, Planet, Instrument, Camera-matrix, Events)系统, 精确确定不同时刻的太阳光照方向. 结合文献[16,17]提供的高分辨率月球数字地形模型DTM (digital terrain model), 估算顾及地形遮挡的实时太阳光照. 同时, 考虑月球内部热流, 对Mons Rümker高原风化层的温度分布进行计算, 以期为“嫦娥5号”钻井采样活动, 以及后继探月活动的开展提供一定程度的参考.
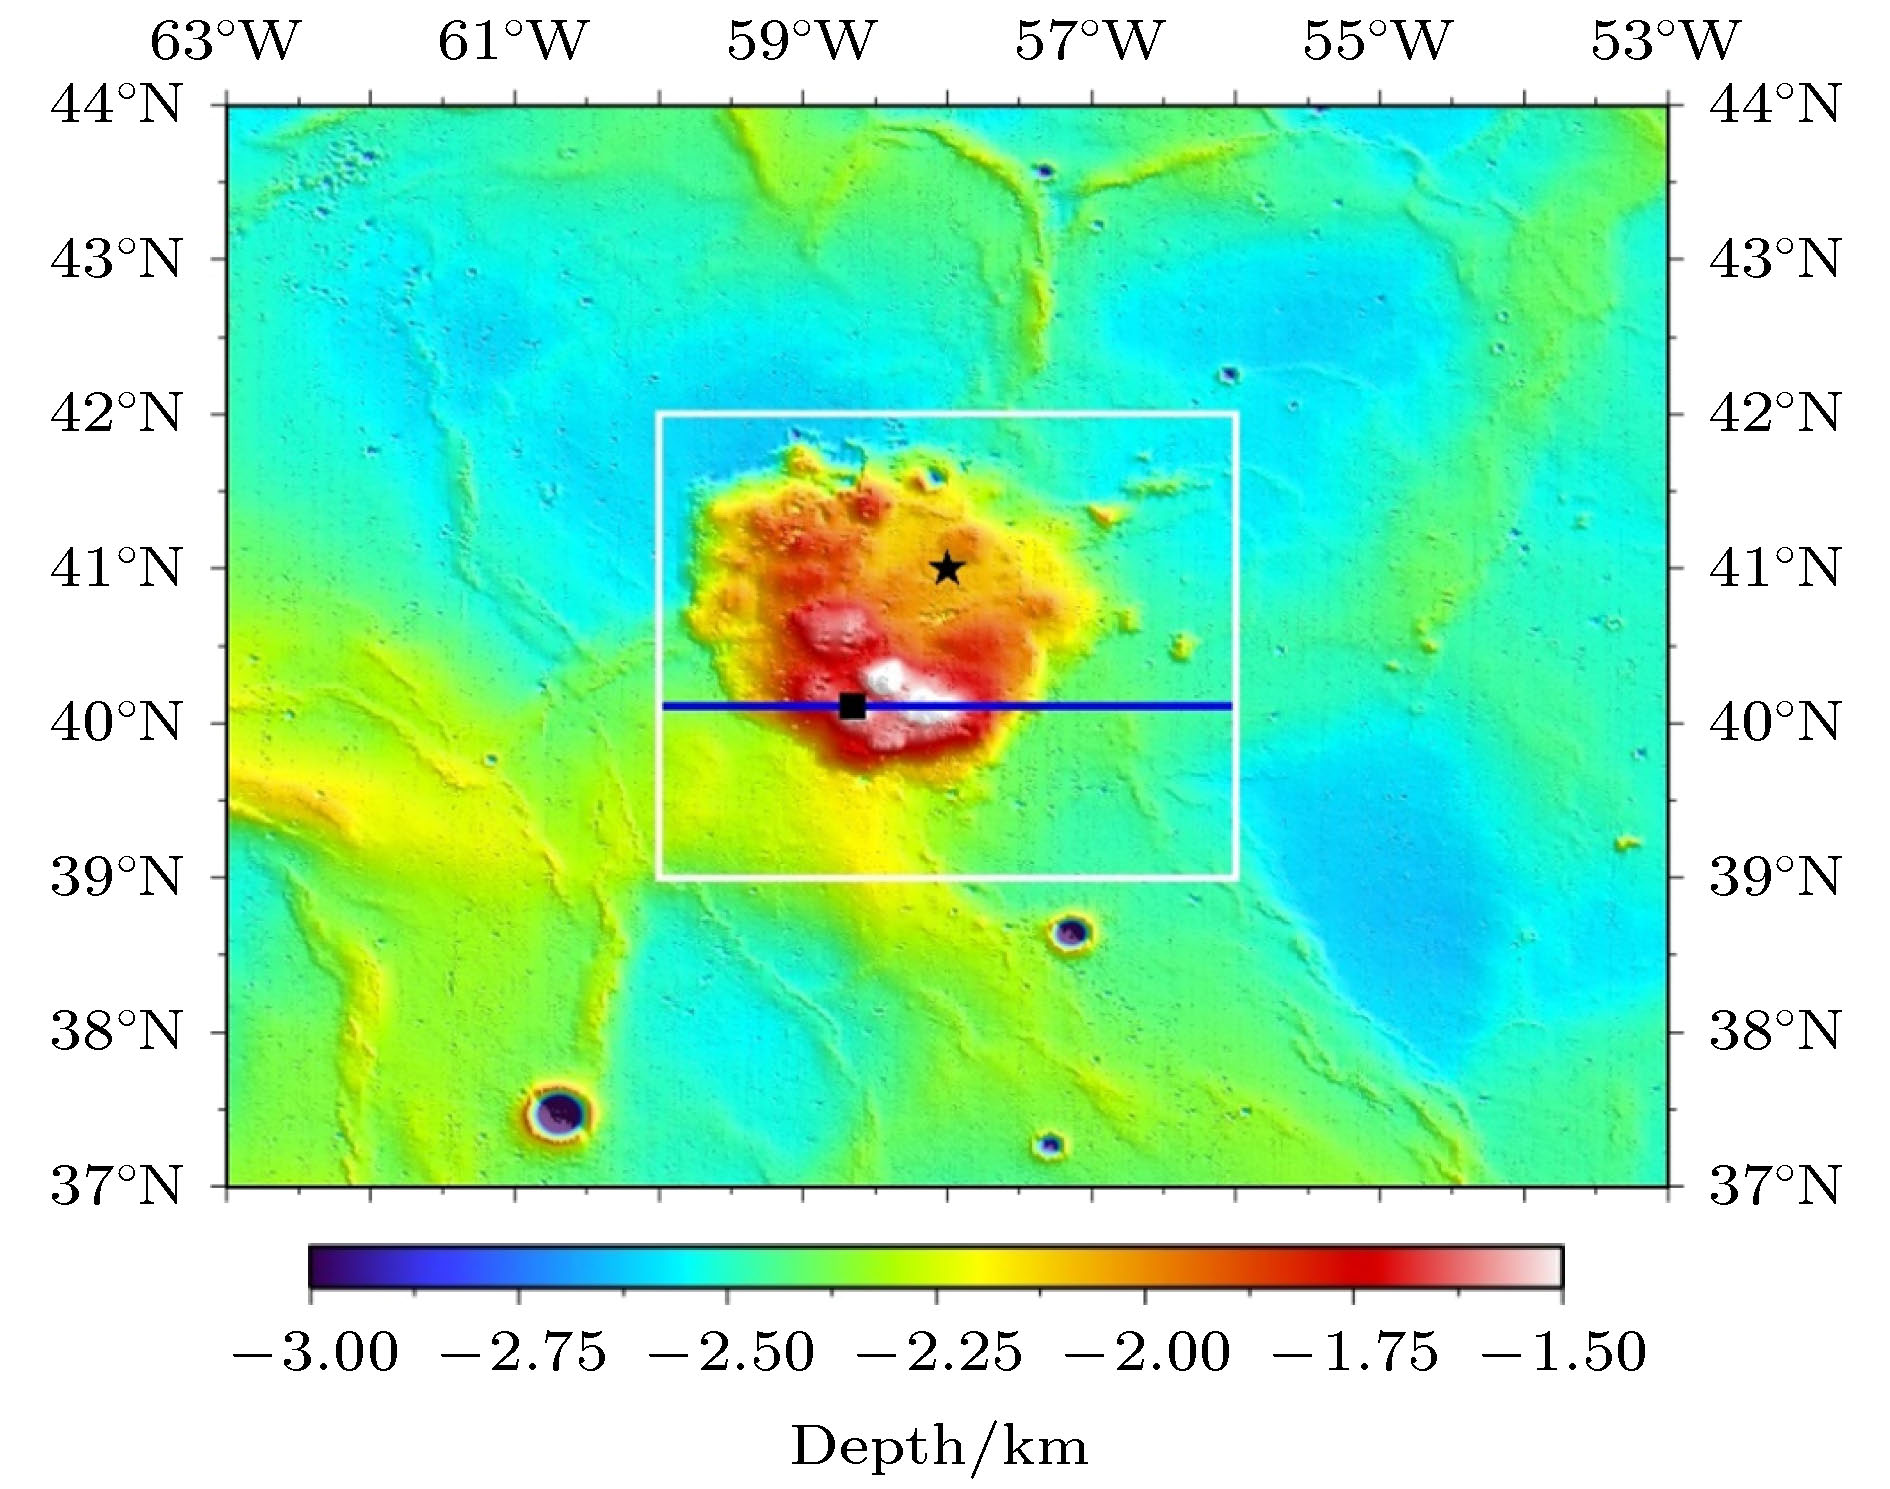 图 1 Mons Rümker区域地形图, 如白色方框所示, 其中黑色方块表示文献[10]建议的“嫦娥5号”登陆点(303.34oE, 40.11oN)
Figure1. Topography around Mons Rümker region, which is figured out with a white box. The black box indicates the candidate landing site of CE-5 proposed by reference [10], and this site is centered at (303.34oE, 40.11oN)
如图2所示, 为了判断目标点A是否有太阳光照射, 以及判断A点是否被邻区地形点B遮挡, 可以通过点A的太阳高度角, 以及比较BC和DC的大小来判断. 过点A作等效球面(圆弧型虚线所示), 与OB相交于点C, 点A和点B间的中心角为θ. 假定点A的太阳高度角为α, 它表示太阳入射光线与目标点水平地面间的夹角. 若α ≤ 0, 文献[11]的研究表明, 对于高海拔区域, 太阳光有可能照射至目标点A. 如图1所示, 本文研究区域Mons Rümker高原, 其最大高程不超过–1.5 km, 不属于高海拔区域, 因此, 本文不考虑文献[11]的高海拔特殊情况, 认为α ≤ 0时, 太阳光不能照射至目标点A. 当α > 0时, 若DC < BC, 则目标点A被邻区地形点B遮挡, 太阳光无法到达点A; 当DC≥BC时, 则不受点B的地形遮挡. 考虑月球表面地形高低的最大落差, 文献[11]表明最大中心角θ = 8o, 通过不断地减小中心角, 可以依次判断距离目标点A远近不同的地形遮挡效应. BC的大小可以根据数字地形模型求得, 依据文献[11], 可得
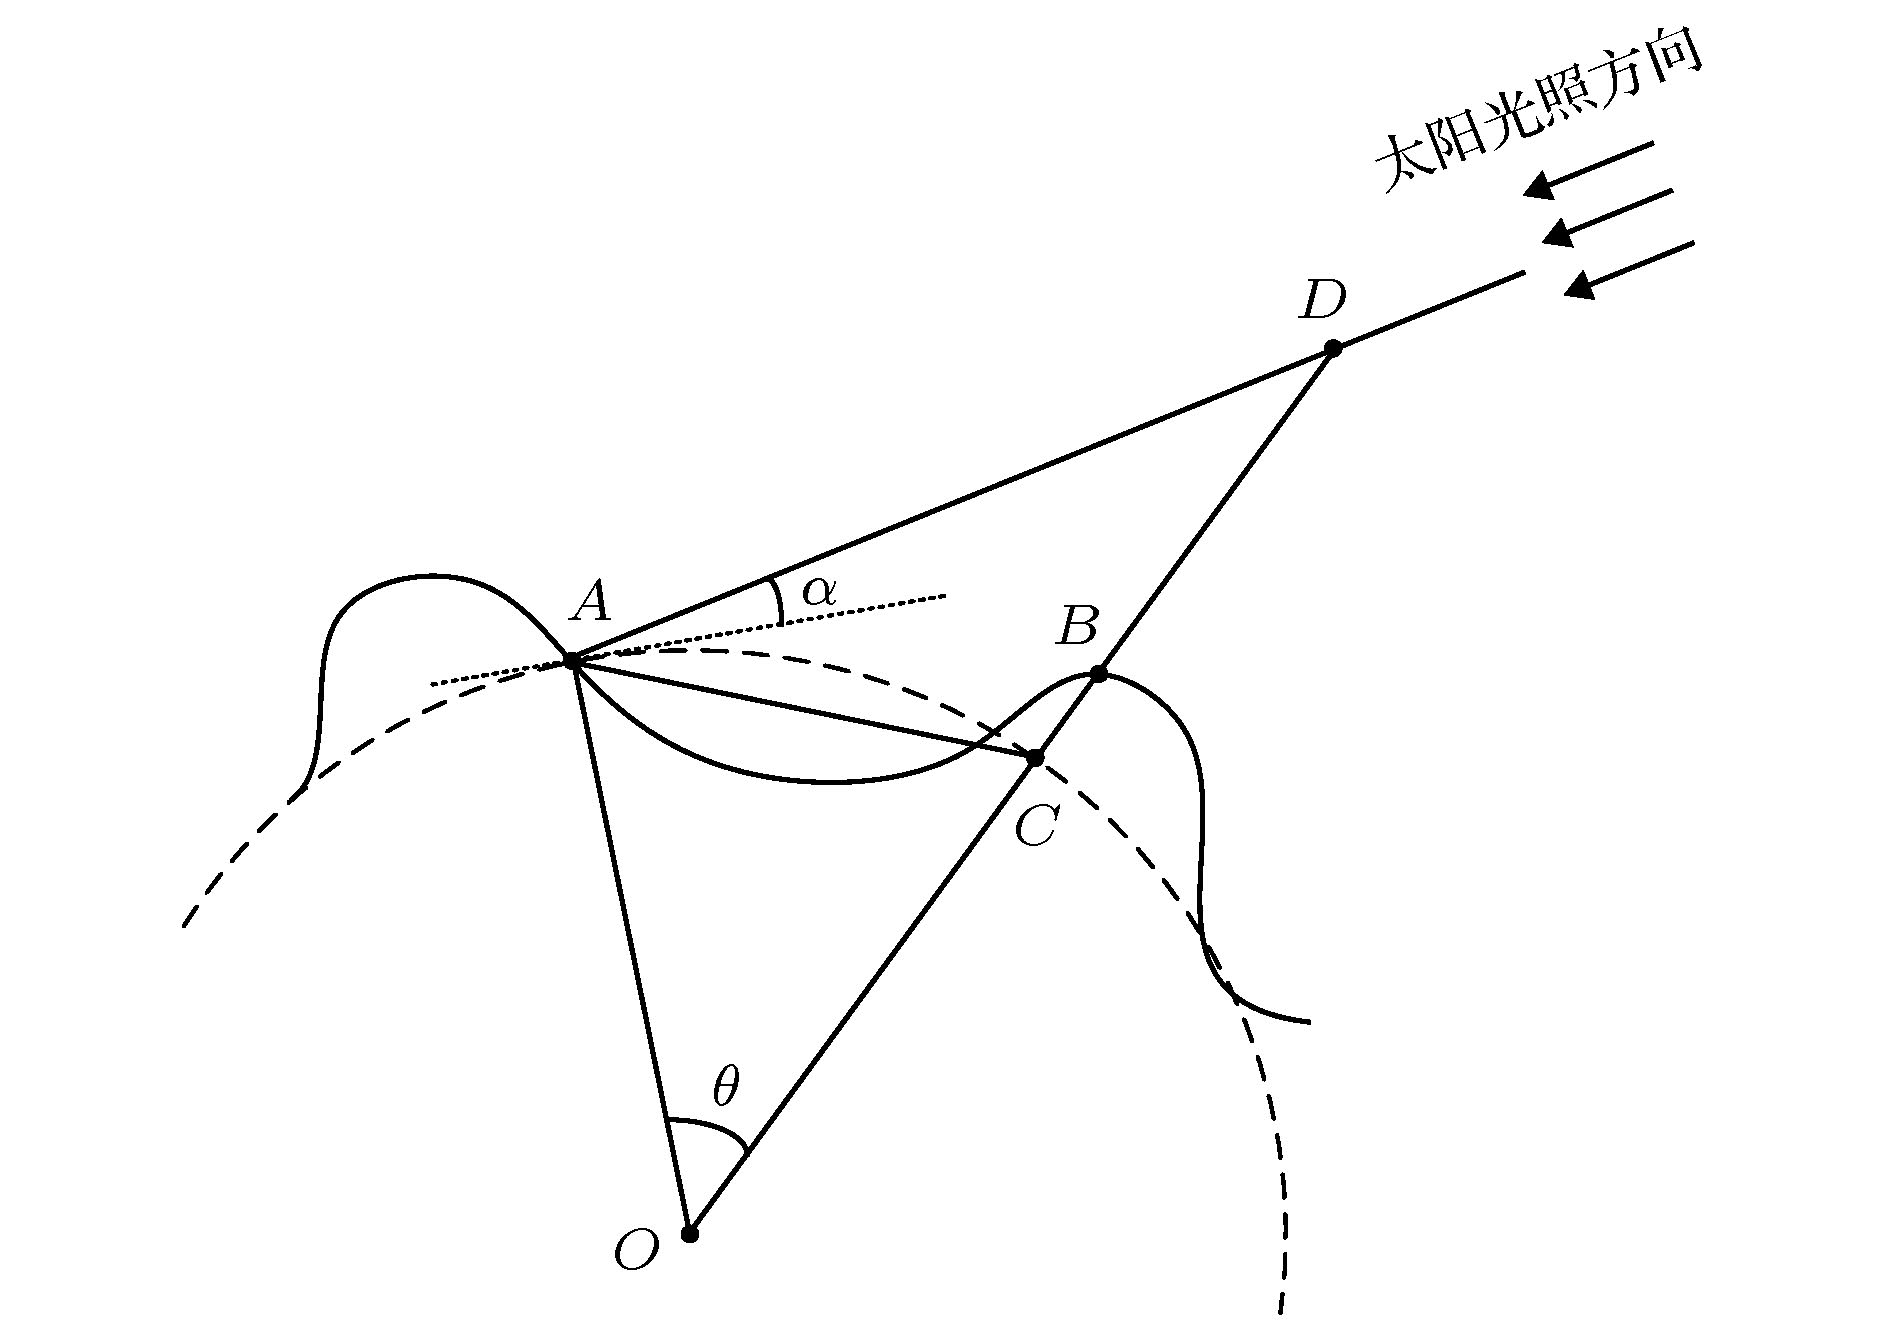 图 2 太阳光照条件示意图
Figure2. Schematic of illumination condition
| 序号 | 参数 | 取值 |
| 1 | 密度ρs和ρd [14] | ρs = 1100 kg·m–3, ρd = 1800 kg·m–3 |
| 2 | 热传导系数ks和kd [14] | ks = 7.4 × 10⁻⁴ W·m–1·K–1, kd = 3.4 × 10⁻³ W·m–1·K–1 |
| 3 | 比热容拟合系数[14] c0, c1, c2, c3, c4 | c0 = –3.6125 J·kg–1·K–1, c1 = 2.7431 J·kg–1·K–2, c2 = 2.3616 × 10⁻³ J·kg–1·K–3, c3 = –1.234 × 10⁻⁵ J·kg–1·K–4, c4 = 8.9093 × 10⁻⁹ J·kg–1·K–5 |
| 4 | 参数H和x [13,14] | H = 0.06 m, x = 2.7 |
表1相关参数取值
Table1.Values of parameters used in study
为了求解(2)式, 需要指定两个边界条件, 一个在月表, 另一个在风化层底部. 月表边界取决于太阳光照及月表红外辐射, 风化层底部取决于月球内部热流分布. 对于深度为zb的底部边界z = zb, 有如下关系[14]:
对于月表边界温度Ts, 假定太阳光照加热率为Qs, 考虑红外辐射后的月表温度梯度有[13-15]:


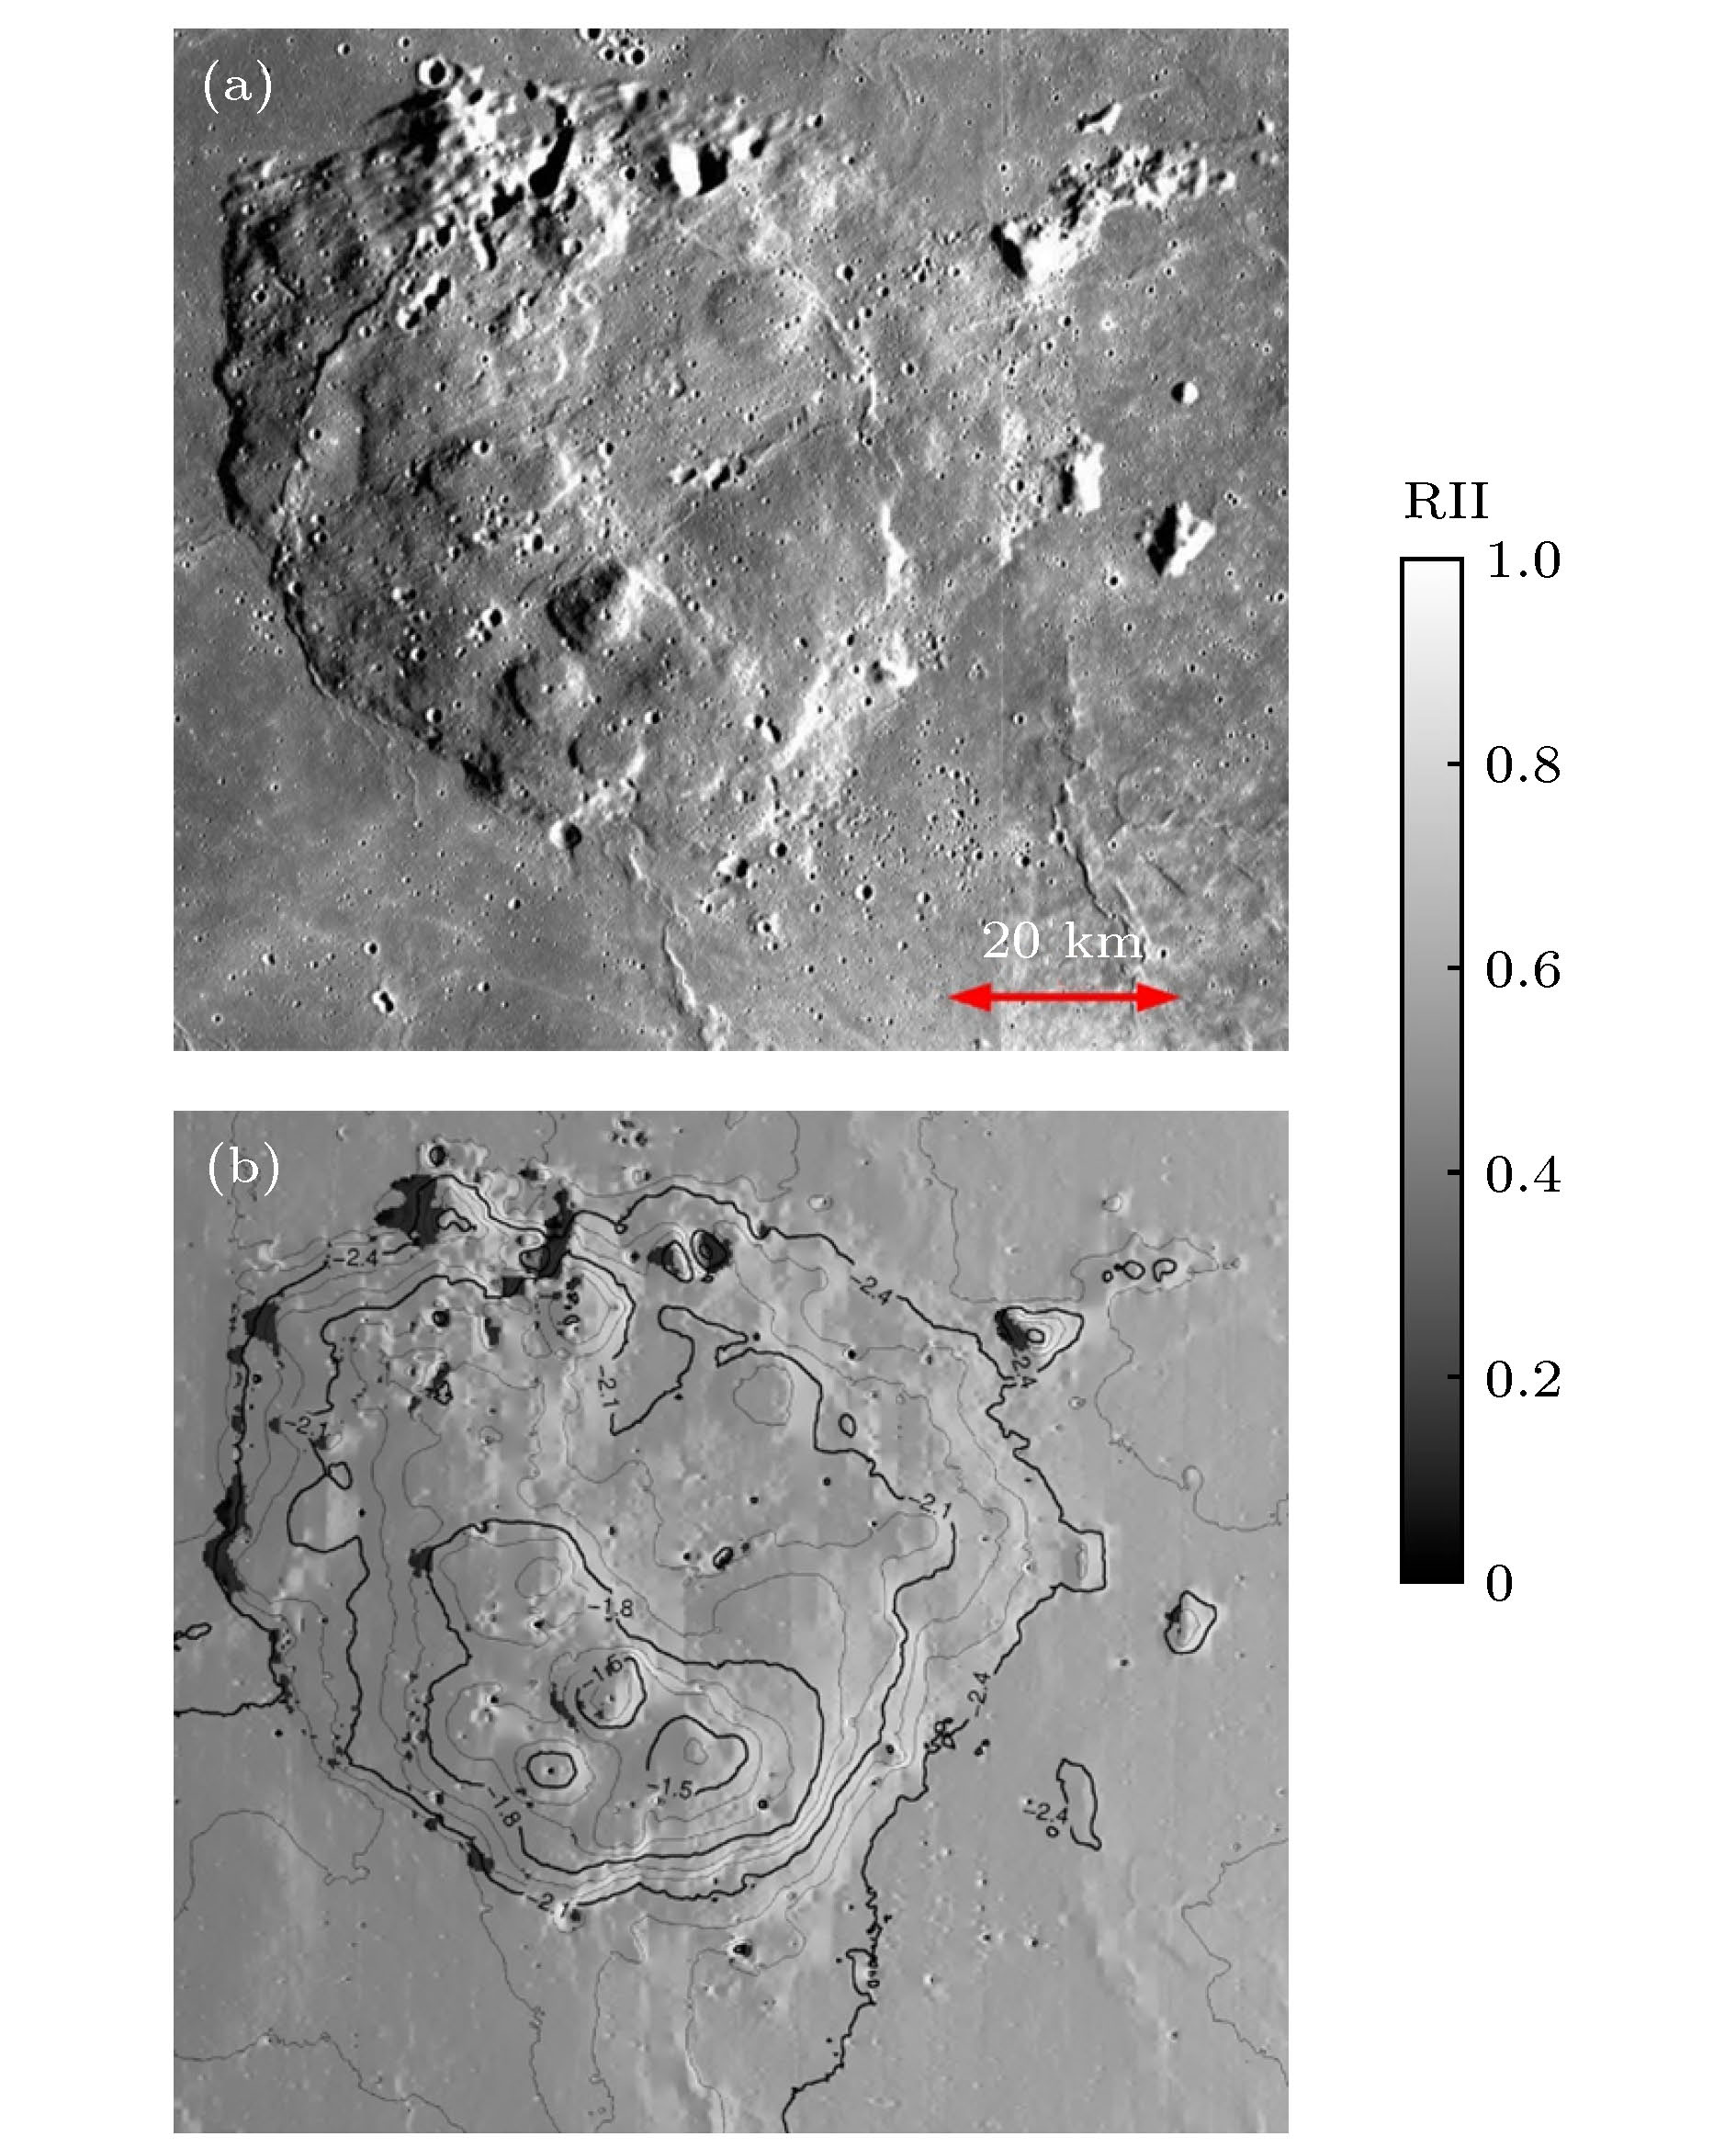 图 3 Mons Rümker区域早晨光照图, 对应月球地方时tm = 06:30:30 (a)日本SELENE卫星提供的早晨光照图; (b)本文计算的与图3(a)相同时刻的实时光照图
Figure3. Morning map of illumination over Mons Rümker at the lunar local time tm = 06:30:30: (a) Japan’s SELENE morning map of illumination; (b) our estimated relative intensity of illumination at the same time of Fig. 3(a)
利用本文计算的实时光照强度, 根据(2)— (7)式, 可以求出Mons Rümker高原风化层的实时温度分布. 为了计算风化层不同深度处的温度, 利用文献[14]提供的标准化有限差分方法对(2)式进行数值计算. 图4给出了Mons Rümker高原不同时刻的表面温度, 其中图4(a)对应协调世界时UTC(universal time coordinated): 2020年10月28日11点30分00秒, 简写为UTC 2020-10-28T 11:30:00, 后文所有时间依此格式表述. 此时, 由于没有太阳光照, 大部分区域的温度在80 K左右. 至图4(b)时(UTC 2020-10-29T 06:45:00), 随着太阳光的到来, 东边温度逐渐升高, 特别是坡向正对太阳光的区域, 温度一度接近200 K, 西边由于背光, 温度维持在120 K左右. 随着太阳高度角的增大, 类似情况也出现在图4(c)中, 大部分区域的温度升至200 K左右, 高温区域一度接近280 K, 该图对应的时刻为UTC 2020-10-30T 06:45:00. 到达正午时分(如图4(d)所示, 对应时刻为UTC 2020-11-02T 04:45:00), 大部区域的温度升至360 K左右, 少部分区域接近或超过400 K. 至图4(e)时, 由于太阳高度角的下降, 光照减少, 表面温度也逐渐下降. 此时, Mons Rümker高原处于月球地方时的下午时分, 太阳光照至西向东, 西边迎光方向光照强, 东边背光方向光照弱, 对应时刻为UTC 2020-11-12T 02:45:00. 如图4(f)所示(对应时刻为UTC 2020-11-12T 17:00:00), 随着太阳高度角的进一步降低, 大部分区域的温度降至120 K左右, 西边迎光方向部分区域的温度维持在200 K左右. 尽管温度下降, 部分背光区域的温度一度高于200 K, 这些区域恰好对应图4(b)—(d)中的高温区域. 在表面光照强时, 这些高温区域的热量不断地向风化层底部传递, 至图4(f)时, 尽管表面光照减弱, 已传递至风化层内部的热量反向传递至风化层表面, 使得表面温度升高. 由于这些区域内部温度高于其他区域, 至图4(f)时, 尽管光照减弱, 得到内部热量的补充, 表面温度仍然高于其他区域.
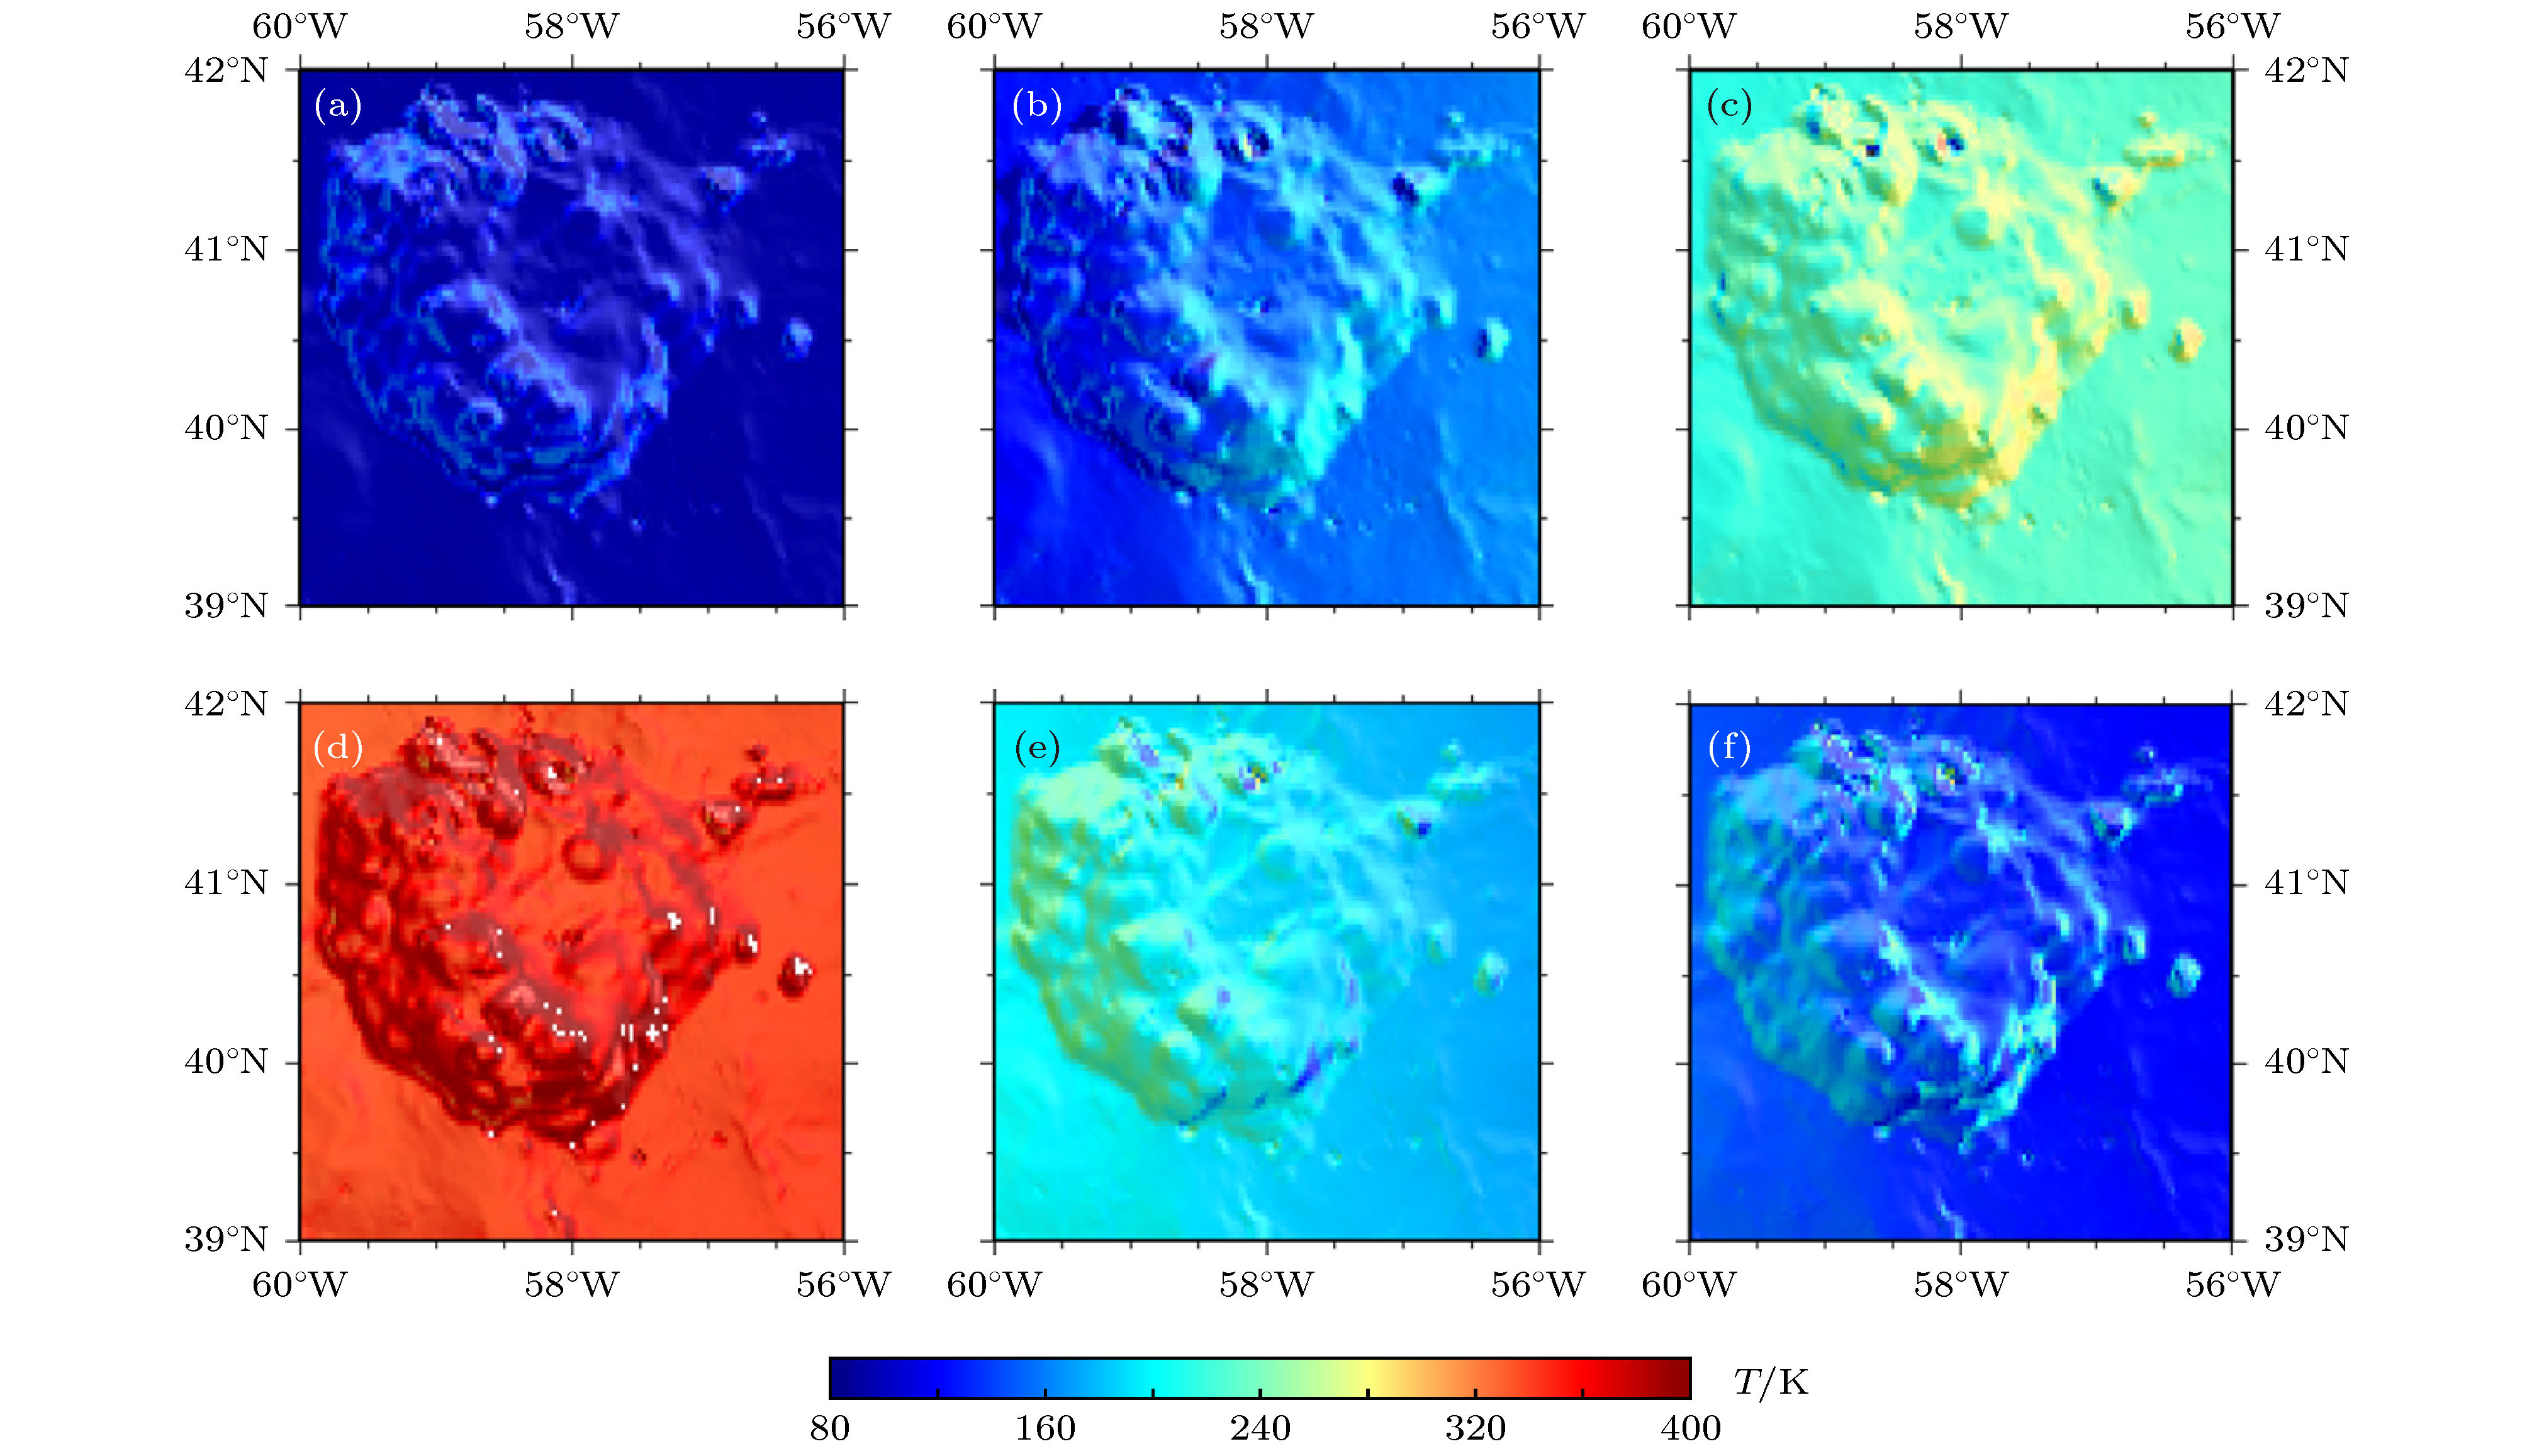 图 4 Mons Rümker区域表面温度分布图 (a)对应时刻为UTC 2020-10-28T 11:30:00; (b)对应时刻为UTC 2020-10-29T 06:45:00; (c)对应时刻为UTC 2020-10-30T 06:45:00; (d)对应时刻为UTC 2020-11-02T 04:45:00; (e)对应时刻为UTC 2020-11-12T 02:45:00; (f)对应时刻为UTC 2020-11-12T 17:00:00
Figure4. Surface temperature distribution with time over Mons Rümker plateau: (a) Time at UTC 2020-10-28T 11:30:00; (b) time at UTC 2020-10-29T 06:45:00; (c) time at UTC 2020-10-30T 06:45:00; (d) time at UTC 2020-11-02T 04:45:00; (e) time at UTC 2020-11-12T 02:45:00; (f) time at UTC 2020-11-12T 17:00:00
这种结论也可以由图5得到佐证. 图5表示Mons Rümker高原风化层5 cm深度的温度分布, 对应时刻与图4各分图一致. 由图5(a)—5(c)可知, 随着太阳光照增加, 尽管表面温度在升高(如图4(a)—4(c)所示), 但风化层5 cm深度处的温度始终维持在200 K左右, 至正午时分图5(d)时, 底部温度才有所升高. 这说明月球风化层的导热能力较弱, 具有一定的绝热性能, 该结果与文献[14,15]的一致. 随着下午时分太阳光照的减弱, 尽管表面温度下降至120 K左右(如图4(e)和图4(f)所示), 但5 cm深度的温度始终维持在260 K左右, 部分区域甚至达到300 K. 此时, 随着表面温度下降, 内部温度高于月表温度, 热量由内向外传递, 使得图4(f)部分背光区域的温度高于邻近区域.
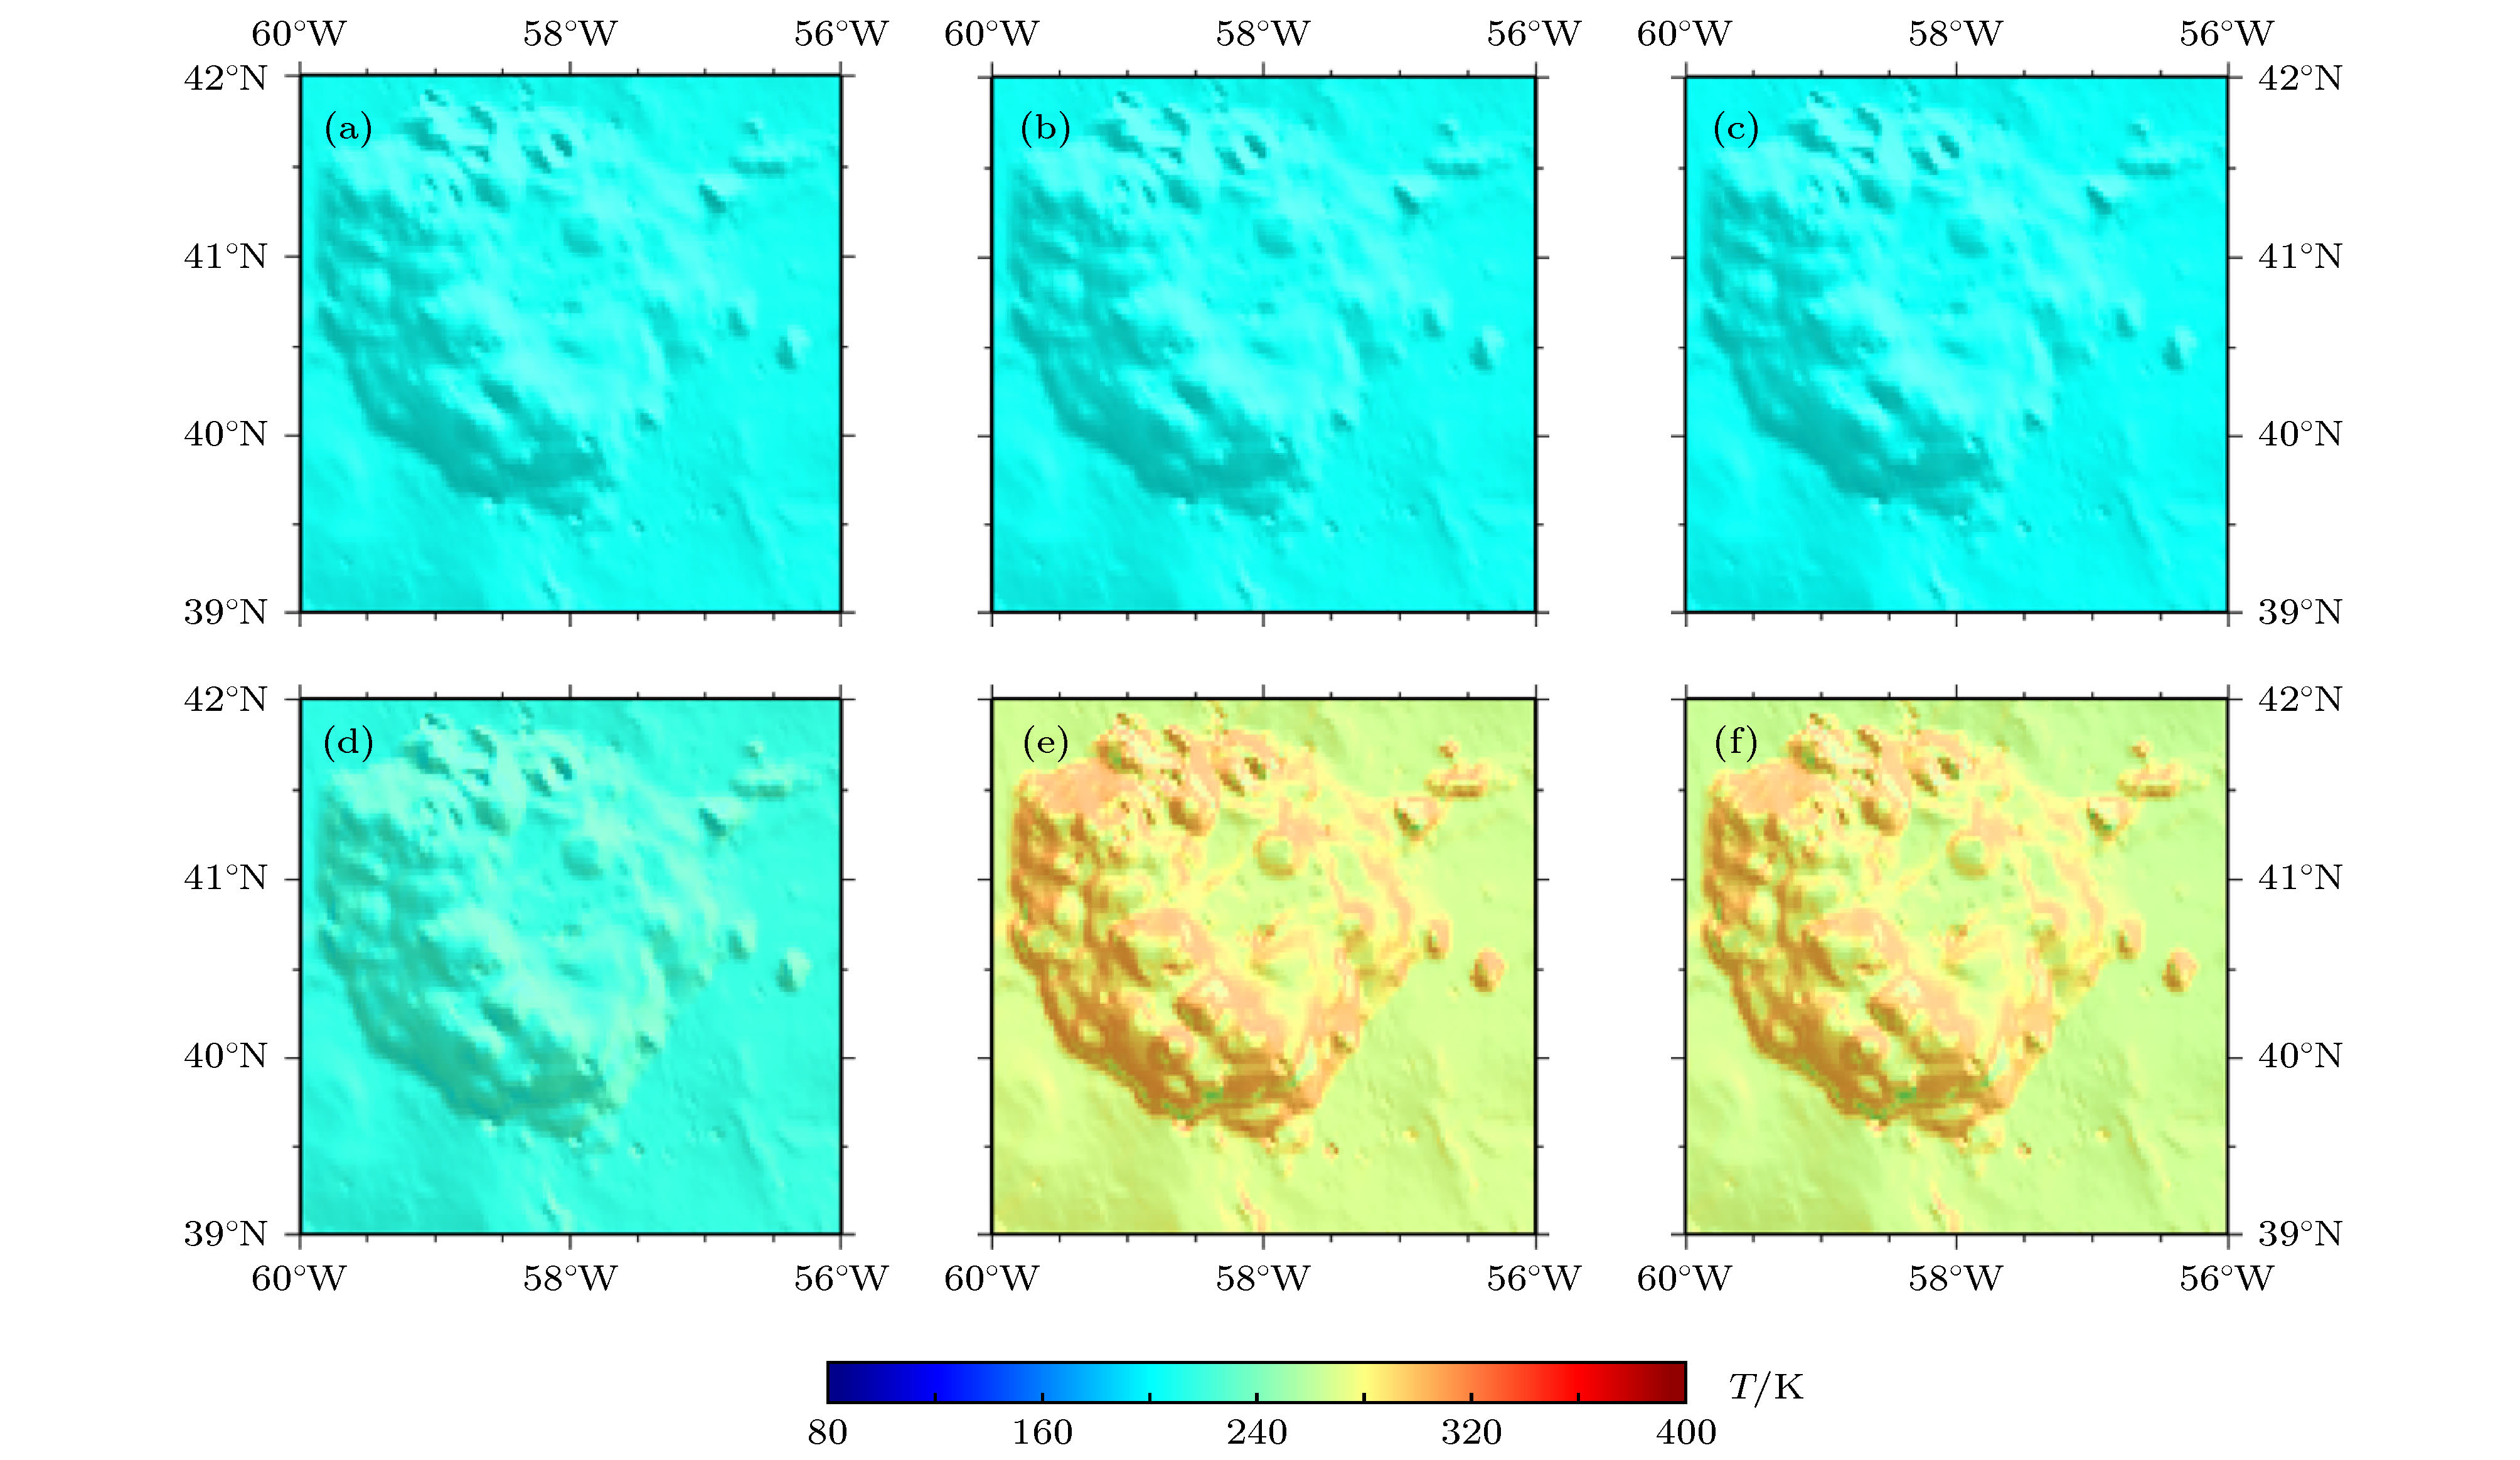 图 5 Mons Rümker区域底部5 cm深度的温度分布图 (a)对应时刻为UTC 2020-10-28T 11:30:00; (b)对应时刻为UTC 2020-10-29T 06:45:00; (c)对应时刻为UTC 2020-10-30T 06:45:00; (d)对应时刻为UTC 2020-11-02T 04:45:00; (e)对应时刻为UTC 2020-11-12T 02:45:00; (f)对应时刻为UTC 2020-11-12T 17:00:00
Figure5. Subsurface temperature distribution at the depth of 5 cm over Mons Rümker plateau: (a) Time at UTC 2020-10-28T 11:30:00; (b) time at UTC 2020-10-29T 06:45:00; (c) time at UTC 2020-10-30T 06:45:00; (d) time at UTC 2020-11-02T 04:45:00; (e) time at UTC 2020-11-12T 02:45:00; (f) time at UTC 2020-11-12T 17:00:00
为了进一步探究风化层的温度变化, 图6给出了温度随深度变化的剖面图, 剖面方向沿图1蓝色直线的方向, 横轴表示经度, 纵轴表示深度, 对应时刻与图4和图5一致. 由图6(a)—(c)可知, 随着太阳光照的增加, 风化层5 cm深度以内的温度不断地增加, 5 cm以下的温度变化较弱, 这与图5(a)—(c)的结果一致. 至正午时刻图6(d)时, 表面温度升至最大值, 热量向风化层内部传递, 内部温度不断升高. 图6(d)中黑色曲线表示沿剖面方向的表面地形轮廓, 其幅度表示地形的相对变化, 其大小与图6纵轴刻度范围无关, 该图表明温度的变化与地形有关. 至图6(e)和图6(f)时, 内部储存的热量向表面传递, 使得表面对应区域的温度高于邻近区域.
 图 6 剖面温度沿图1所示经度方向的分布 (a)对应时刻为UTC 2020-10-28T 11:30:00; (b)对应时刻为UTC 2020-10-29T 06:45:00; (c)对应时刻为UTC 2020-10-30T 06:45:00; (d)对应时刻为UTC 2020-11-02T 04:45:00; (e)对应时刻为UTC 2020-11-12T 02:45:00; (f)对应时刻为UTC 2020-11-12T 17:00:00. 图6(d)所示黑色曲线表示图1蓝线方向的表面地形轮廓
Figure6. Temperature variation along the longitude direction shown in Fig.1: (a) Time at UTC 2020-10-28T 11:30:00; (b) time at UTC 2020-10-29T 06:45:00; (c) time at UTC 2020-10-30T 06:45:00; (d) time at UTC 2020-11-02T 04:45:00; (e) time at UTC 2020-11-12T 02:45:00; (f) time at UTC 2020-11-12T 17:00:00. The black carves in Fig. 6(d) represents the surface topography along the same blue line direction displayed in Fig. 1
为了进一步研究0.2 m深度以下的温度变化, 图7给出了两个参考点不同深度处温度随时间的变化关系. 其中, 图7(a)表示“嫦娥5号”候选登陆点(图1所示黑色方块)的温度变化, 图7(b)表示另一参考点(图1所示黑色五角星)的温度变化. 由图7可知, 两个参考点的温度在0.27 m深度的温度最小值在239 K左右. 温度变化幅度随着深度的降低逐渐减小, 到达0.57 m深度时, 温度几乎不再变化, 保持在241.5 K左右. 结合图4—图7, 保守估计风化层的常温层深度在0.6 m. 参考文献[4], “嫦娥5号”的钻井深度接近2 m, 在进行钻井作业及仿真分析时, 有必要考虑风化层内外温度的差异; 另外, 考虑到常温层深度在0.6 m左右, “嫦娥5号”的钻井深度达2 m, 能探测到常温层的热流. 结合“嫦娥5号”的钻井经验, 后期探月工程可考虑搭载探测月球内部热流值的载荷, 以促进月球内部结构及热演化研究的发展.
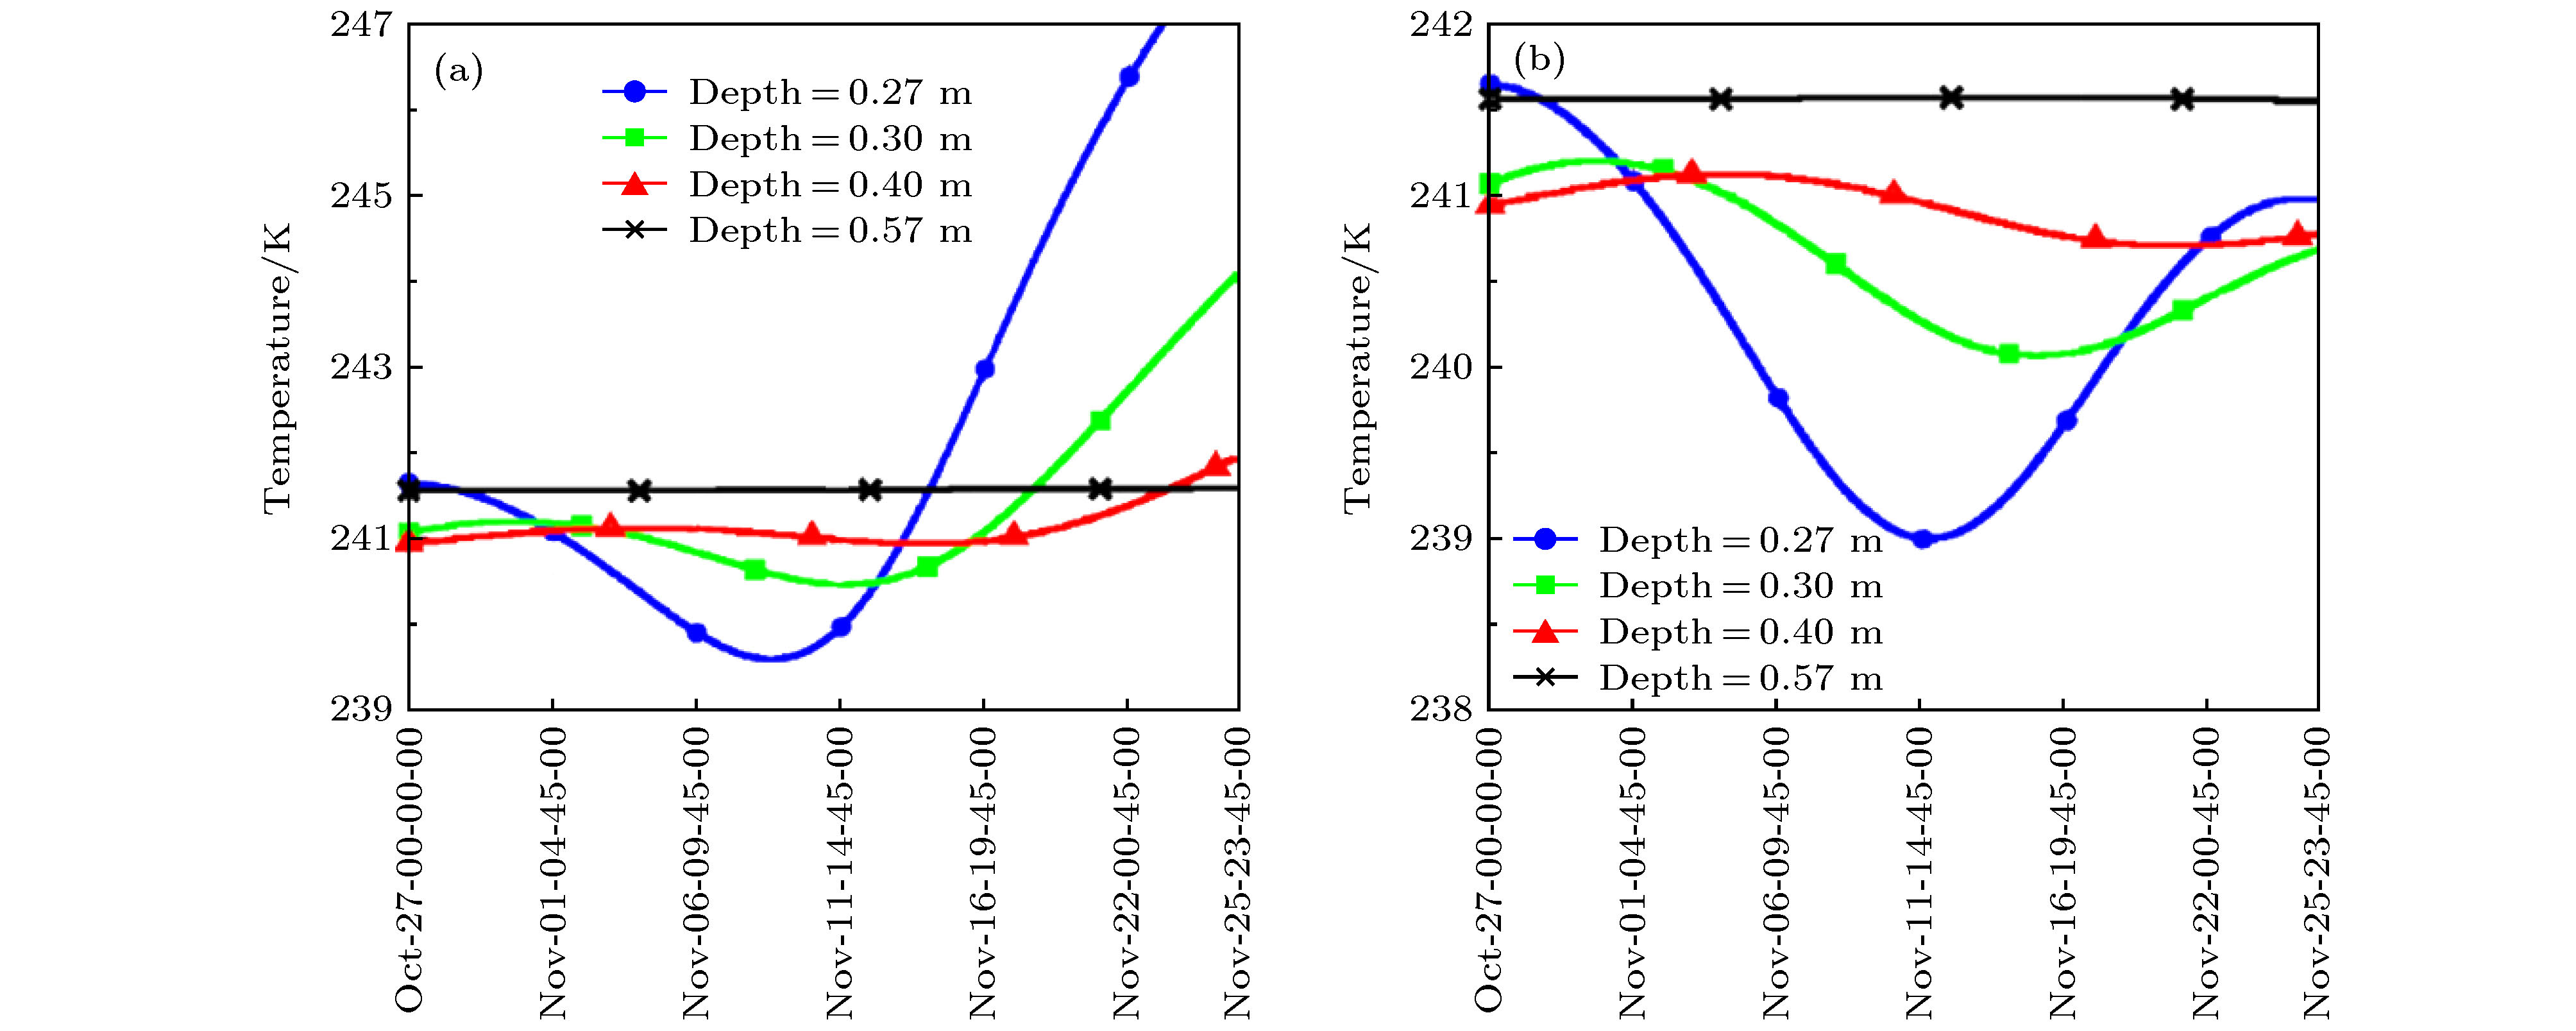 图 7 底部温度随时间的变化 (a)“嫦娥5号”候选登陆点的底部分温度变化; (b)图1中黑色五角星所示参考点的底部温度变化
Figure7. Subsurface temperature variations: (a) Variations for the point of CE-5 candidate landing site; (b) variations for the black star in Fig. 1
| 深度/m | tm = 06:30:30 | tm = 12:30:30 | tm = 18:30:30 | |||||||||||
| H = 0.02 m | H = 0.09 m | Q = 0.012 W·m–2 | Q = 0.021 W·m–2 | H = 0.02 m | H = 0.09 m | Q = 0.012 W·m–2 | Q = 0.021 W·m–2 | H = 0.02 m | H = 0.09 m | Q = 0.012 W·m–2 | Q = 0.021 W·m–2 | |||
| 0 | 170.0 | 169.6 | 169.7 | 169.7 | 348.1 | 351.7 | 350.9 | 350.9 | 122.3 | 110.7 | 112.9 | 112.9 | ||
| 0.0136 | 158.5 | 149.4 | 152.3 | 152.3 | 322.5 | 325.7 | 324.4 | 324.4 | 213.6 | 205.6 | 207.1 | 207.1 | ||
| 0.0526 | 192.4 | 194.5 | 194.4 | 194.4 | 270.6 | 261.1 | 263.2 | 263.2 | 260.9 | 260.7 | 260.1 | 260.1 | ||
| 0.1000 | 221.3 | 223.8 | 223.2 | 223.2 | 237.9 | 231.9 | 233.6 | 233.6 | 260.3 | 253.9 | 255.3 | 255.3 | ||
| 0.1822 | 239.3 | 239.6 | 239.5 | 239.5 | 234.0 | 235.1 | 234.7 | 234.7 | 243.0 | 239.5 | 240.4 | 240.4 | ||
| 0.3240 | 241.2 | 241.2 | 241.2 | 241.2 | 240.8 | 240.9 | 240.8 | 240.8 | 240.0 | 240.2 | 240.1 | 240.1 | ||
| 0.4721 | 241.2 | 241.2 | 241.2 | 241.2 | 241.3 | 241.3 | 241.3 | 241.3 | 241.2 | 241.3 | 241.3 | 241.3 | ||
| 0.8250 | 242.4 | 242.4 | 242.4 | 242.4 | 242.4 | 242.4 | 242.4 | 242.4 | 242.4 | 242.4 | 242.4 | 242.4 | ||
| 1.0000 | 242.9 | 242.9 | 242.7 | 243.1 | 242.9 | 242.9 | 242.7 | 243.1 | 242.9 | 242.9 | 242.7 | 243.1 | ||
表2参考点(图1中黑色五角星)温度(单位为K)在不同时刻随深度的变化
Table2.Temperature (in K) variations with depth for the point of black star in Fig. 1 at various lunar local time
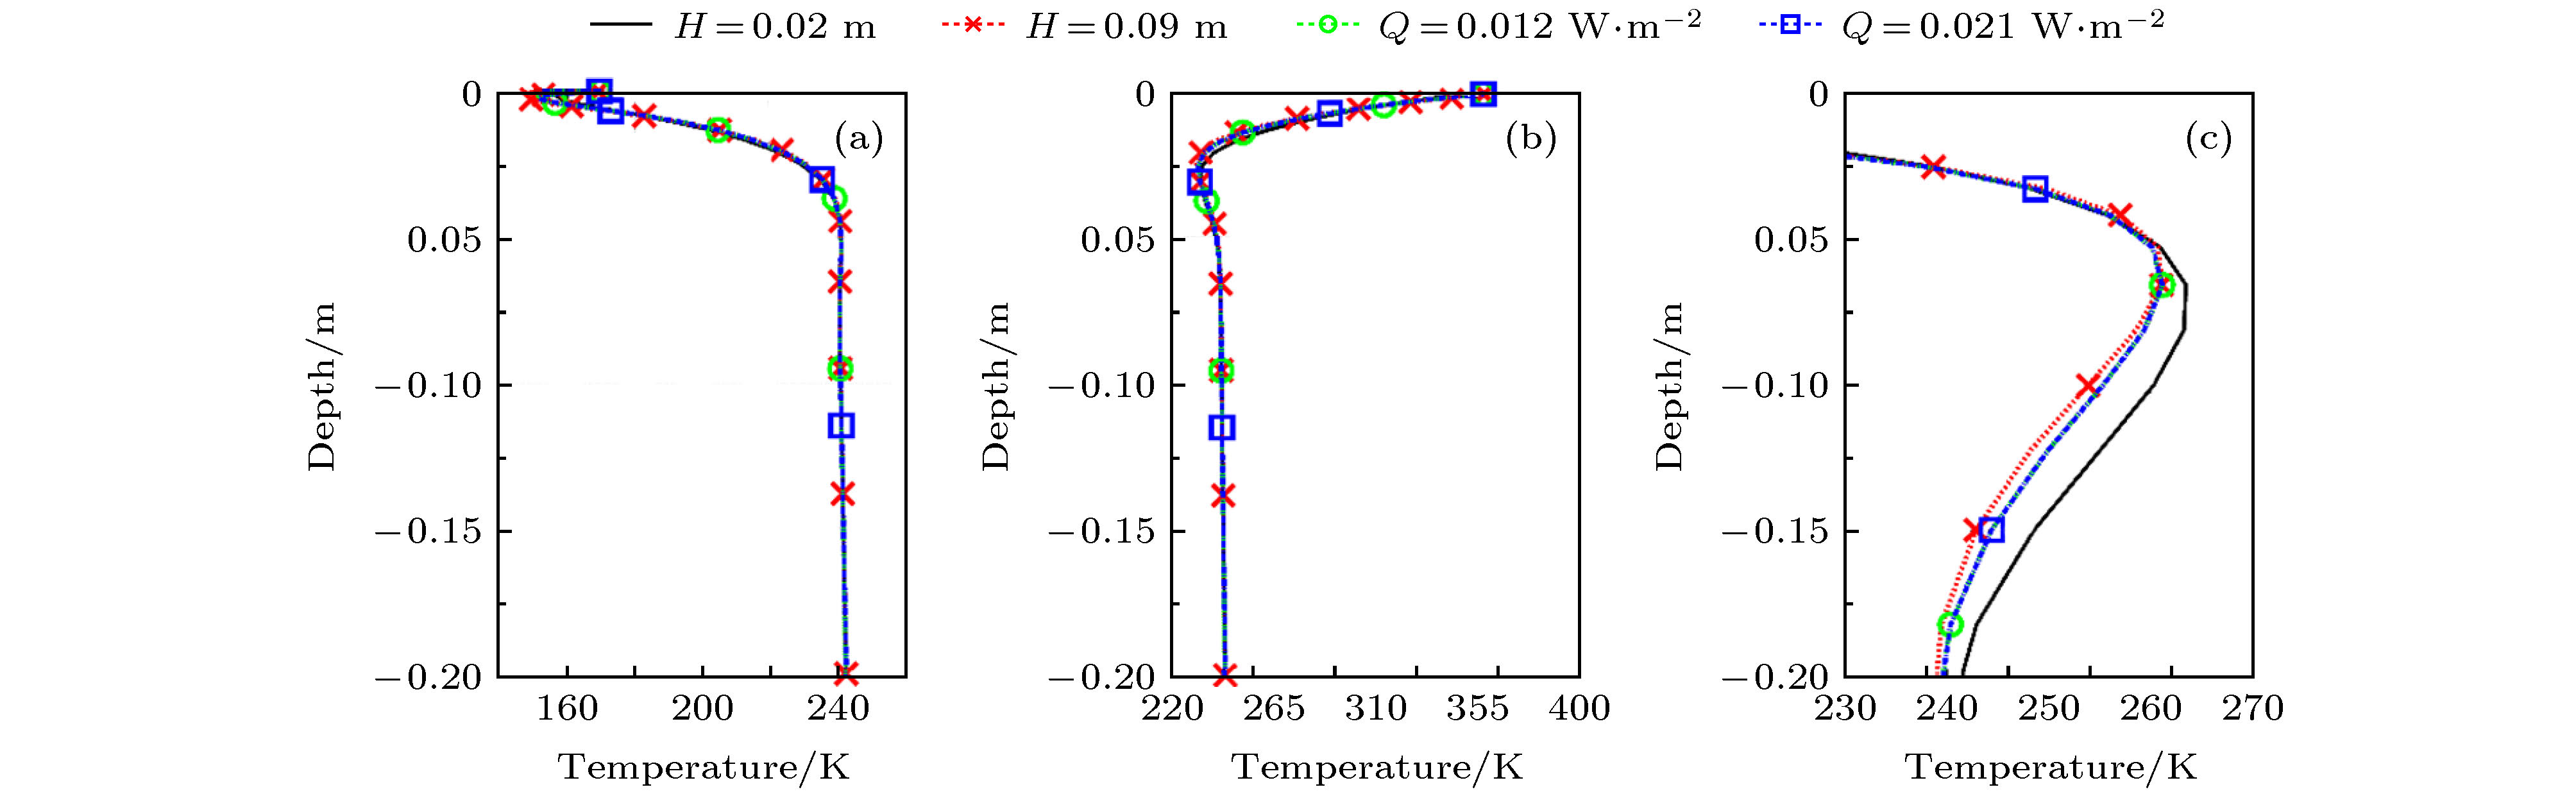 图 8 参考点(图1中黑色五角星)温度随深度的变化 (a)对应月球地方时tm = 06:30:30; (b)对应月球地方时tm = 12:30:30; (c)对应月球地方时tm = 18:30:30
Figure8. Subsurface temperature variations with depth for the point of black star in Fig. 1: (a) Temperature variations at the lunar local time tm = 06:30:30; (b) temperature variations at the lunar local time tm = 12:30:30; (c) temperature variations at the lunar local time tm = 18:30:30
