1.College of Electronics and Information Engineering, Tongji University, Shanghai 201804, China 2.Faculty of Health, University of Witten/Herdecke, Witten D-58448, Germany
Fund Project:Project supported by the National Natural Science Foundation of China (Grant No. 60771030), the National High Technology Research and Development Program of China (Grant No. 2008AA02Z308), the Shanghai Foundation for Development of Science and Technology, China (Grant No. 08JC1421800), the Open Project of State Key Laboratory of Function Materials for Information, Shanghai Institute of Microsystem and Information Technology, Chinese Academy of Sciences, China (Grant No. SKL2013010), and the Open Project of Key Laboratory of Medical Image Computing and Computer Assisted Intervention of Shanghai, Shanghai Medical College of Fudan University, China (Grant No. 13DZ2272200-2)
Received Date:02 January 2019
Accepted Date:25 April 2019
Available Online:01 July 2019
Published Online:05 July 2019
Abstract: The current source reconstruction and magnetic imaging is a new technique to non-invasively obtain spatial information regarding cardiac electrical activity using magnetocardiogram (MCG) signals measured by the superconducting quantum interference device (SQUID) on the human thorax surface. Using MCG signals to reconstruct distributed current sources needs to solve the inverse problem of magnetic field. The beamforming is a type of spatial filter method that has been used for distributed source reconstruction and source imaging in electroencephalogram (EEG) and magnetoencephalogram (MEG). In this paper, the dipole moment of distributed current source is estimated with corresponding each spatial filter based on the cardiac source field model. The purpose is to enhance the intensity contrast of the dipole moment of distributed current sources in distributed source spatial spectrum estimation with beamforming, so that the reconstructed-pseudo sources beyond the heart can be removed for imaging cardiac electric activity well. A new beamforming method of improving intensity contrast (IIC) of distributed source spatial spectrum estimation is developed for imaging cardiac electric activity in P-wave, due to cardiac magnetic signals in P-wave lower than that of the peak value of R-wave, which has a relatively low signal-to-noise ratio (SNR). For enhancing the accuracy of current source reconstruction in P-wave, the IIC divided into two steps: firstly, to introduce the lead-field matrix, which represents the measurement sensor-array sensitivity to magnetic field current sources, into a weight matrix of the spatial filter for making the output estimation of the filter more sensitive to the current sourcedistribution, so as to improve the intensity contrast of the reconstructed distributed sources.Secondly, by setting a threshold of source intensity from experience, to extract the reconstructed source with locally-maximal dipole strength at each time for eliminating the relatively weak pseudo sources in other locations, so as to enhance the accuracy of current source reconstruction during P-wave. In this paper, the IIC and three other methods, including minimum variance beamforming (MVB), suppressing spatial filter output noise-power gain (SONG) and trust region reflective (TRR), are compared by using the theoretical analysis and simulation experiments of MCG current source reconstruction during P-wave. The results show that the IIC has higher intensity contrast of the single source spatial spectrum estimation, and possesses better accuracy of the current source reconstruction. The 61-channel MCG signals of two healthy subjects and their imaging of cardiac electrical activity during P-wave also are analyzed. The result shows that the IIC is better than the other three methods. It is indicated that two healthy subjects have stronger electrical activity in the atrium than that in the ventricle at Ppeak time, also that the electrical activity has the direction feature when the right-atrium is depolarized during P-wave. In summary, the IIC is useful for imaging the cardiac electrical activity. However, it is needed to carry out a further research on patients with local myocardial ischemia and left or right coronary artery stenosis, and to establish the evaluation index for imaging of cardiac electrical activity in such patients. Keywords:cardiac electrical activity/ magnetic imaging/ inverse problem/ spatial filter/ current source reconstruction
假设SQUID系统在人体胸腔表面测量到的心脏磁场由n个呈网格分布的电流源产生. 测量面上第k通道的心磁测量信号用标量${b_k}\left( t \right)$表示, 则t时刻c通道阵列信号的列向量可用 ${{b}}\left( t \right) = $$ {\left[ {{b_1}\left( t \right),{b_2}\left( t \right),...,{b_c}\left( t \right)} \right]^{\rm{T}}} $表示. 磁场与分布源的关系模型可用如下线性方程表示[13,16]:
${{b}}\left( t \right) = \sum\limits_{j = 1}^n {\left[ {{{{L}}_j}\left( t \right){{q}}\left( {t,{{{r}}_j}} \right)} \right]} + {{v}}\left( t \right),$
假设包含心脏的人体躯干是沿坐标系Z轴水平分层的导体(horizontally layered conductor, HLC), 心脏–躯干模型如图2(a)所示. 层间电导率之差与该处静电势的乘积被称作二次电流密度, 其方向与沿Z方向测量的心脏磁场平行[17]. 根据毕奥萨法尔定律, 导体中二次电流密度产生的磁场可以忽略[10]. 对图2(a)中包含心脏在内的导体 图 2 (a) 水平分层导体. 其中黑色直线表示分层躯干的边界, 黄色椭圆体表示心脏; (b), (c) 测量通道1和61的磁场导联$l_{j,k}^\zeta , \left( {\zeta = X, Y, Z} \right)$曲线. 其中红、绿和蓝色分别表示X, Y和Z方向导联的曲线 Figure2. (a) The horizontally layered conductor (HLC), where the black line indicates the boundary of HLC, and the yellow spheroid the heart; (b),(c) The X, Y and Z lead-field based plots of channels 1 and 61 are expressed in red, green and blue, respectively
$\begin{split}{G^0} = & \left\{\left( {x, y, z} \right)\left| x \in \left[ { - {\rm{10}}{\rm{.5,15}}{\rm{.5}}} \right]{\rm{ cm, }}\right.\right.\\ & y \in \left[ { - {\rm{15}}{\rm{.5,10}}{\rm{.5}}} \right]{\rm{ cm}}, z \in \left[ {{\rm{2}}{\rm{.5,20}}{\rm{.5}}} \right]{\rm cm}\}\end{split}$
假设参考路径1是一条起止点坐标为Ps = (7, 5, 6)cm和Pe = (–3, –5, 16)cm的空间直线. 如图3(a)—图3(e) 中黑色圆圈所示, 该路径上相邻分布源的间距为$\sqrt 3 \;{\rm{ cm}}$. 单电流源通过参考路径上相邻位置的时间$\Delta t = 0.01\;{\rm{ s}}$, 速度${\rm{MV}} = 0.01\sqrt 3 /$$0.01 = \sqrt 3 \approx 1.73\;{\rm{ m/s}}$. 图3(b)—图3(e) 给出了SNR = 20 dB时, 用上述4种方法得到的重建电流源和电活动成像结果. 图中可见, 用IIC每个时刻重建的电流源沿着参考路径1上的黑圈移动. 黑圈中的绿色由浅到深表示时间变化. 在该参考路径以外, IIC出现的伪源最少, SONG与TRR的结果次之. 图 3 (a) 黑色圆圈○和箭头表示沿直线方向的参考路径1; (b)?(e) 是SNR = 20 dB时, IIC, SONG, MVB和TRR方法的源重建结果. 黑圈中的浅绿色到深绿色表示重建电流源位置随时间的变化 Figure3. (a) The black circles ○ and arrow indicate the reference path 1 along the straight line; (b)?(e) The results of the current source reconstruction using IIC, SONG, MVB and TRR methods when SNR is 20 dB. The green points at different color levels denote the reconstructed source locations at different times
表1参考路径1对应的单源估计误差 Table1.The error of single source estimation correspond to the reference path 1
23.3.仿真结果2 -->
3.3.仿真结果2
假设参考路径2包括两条起止点坐标分别为[Ps1,Pe1] = [(7, 5, 6), (7, –5, 6)]cm和[Ps2,Pe2] = [(–3, 5, 16), (–3, –5, 16)]cm的空间直线. 如图4(a)—图4(e)中黑圈所示, 这两条路径上相邻分布源的间距均为1 cm. 仿真中, 令两个电流源分别通过各自参考路径上相邻位置的时间$\Delta t = 0.01\;{\rm{ s}}$, 速度${\rm{MV}} = {{0.01} / {0.01}} = 1\;{\rm{ m/s}}$. 其中一个电流源比另一个电流源提前0.005 s开始移动. 图4给出了SNR = 20 dB时, 4种方法的仿真结果和电活动成像. 图中可见, 用IIC每个时刻重建的电流源沿参考路径2中的黑圈移动. 黑圈中的绿色由浅到深表示时间变化. 在该参考路径以外, IIC出现的伪源最少, 明显优于其他3种方法. 图 4 (a) 黑色圆圈○和箭头表示沿直线方向的参考路径2; (b)?(e) SNR = 20 dB时, IIC,SONG,MVB和TRR方法的源重建结果. 黑圈中的浅绿色到深绿色表示重建电流源位置随时间的变化 Figure4. (a) The black circles ○ and arrow indicate the reference path 2 along the straight line; (b)?(e) The results of the current source reconstruction using IIC, SONG, MVB and TRR methods when SNR is 20 dB. The green points at different color levels denote the reconstructed source locations at different times
表2参考路径2对应的双电流源估计误差 Table2.The error of two sources estimation correspond to the reference path 2
4.心脏电活动的磁成像本文利用P波间期采集的磁场信号, 分析了健康人A和B的心脏电活动及其成像结果. 这些数据是在磁屏蔽室内用Magnes 1300C 61通道生物磁强计系统沿Z方向测量的. 信号采样频率1 kHz[2]. 假设P波间期心磁测量信号及其噪声的平均功率为${P_{{s}}}$和${P_{{v}}}$, 则信噪比${\rm{SNR}}=10\lg \left[ {{P_{{s}}}/{P_{{v}}}} \right]$. 计算可得健康人A和B测量信号的P波间期信噪比${\rm{SNR}} \in [20,30]\;{\rm{ dB}}$. 图5中给出了健康人A和B的P波峰值(Ppeak)时刻心磁信号的源空间谱估计强度等高线图. 经归一化处理后的等高线值用色标表示. 图中比较了用IIC, SONG和MVB三种空间滤波方法重建电流源的结果. 为了显示人体心脏及其房室的相对位置, 图中给出了一个健康人的心脏核磁共振影像(magnetic resonance imaging, MRI)冠状位(coronal)和水平位(transverse)视图, 将其作为图5中的XY与XZ面视图, 并分别与A和B的测量坐标系配准. 图5(c)和图5(d)中A和B的心房内, 用绿色三角形表示了冠状位与水平位面的交点$({\rm{0, }} - {\rm{9, 10}})$和$({\rm{0, }} - {\rm{6, 10}}){\rm{ cm}}$. 图 5 (a), (b) 健康人A与B的单周期61通道心脏磁场信号及其Ppeak时刻; (c), (d) 用IIC,SONG与MVB方法得到的2个健康人Ppeak时刻源空间谱强度的XY与XZ面等高线图 Figure5. (a),(b) The 61-channel MCG signals and Ppeak time of single-cycle from healthy subjects A and B; (c),(d) The XY and XZ based spatial spectrum intensity contours from subjects A and B at Ppeak using IIC, SONG or MVB
图5(c)和图5(d)中给出了Ppeak时刻重建电流源的结果. IIC图中,黄红色标和紧密环绕的等高线表示较强电流源均集中在A和B的心房. 健康人心房内的电活动较心室内强. 这与Ppeak时刻健康人的心房正在除极, 而心室尚未开始除极有关[33,34]. 然而, SONG的等高线扩散到了心脏以外, 不像IIC那样集中, 说明SONG的空间谱强度估计的对比度相对较低, 影响了重建电流源的精度. MVB的等高线图显示, 心脏内外有很多无规律和强弱不同的伪源. 重建电流源误差相对较大是MVB电活动成像结果不理想的主要原因. 图6(c)和图6(d)是健康人A和B的P波前半段(Ponset—Ppeak, Ponset是P波起点) 电活动成像结果. 图中用圆点表示重建源的位置, 其中颜色由浅红到深红表示重建源位置随时间的变化. 图6(c)和图6(d)中IIC的结果显示, P波前期健康人右心房除极时电活动从右心房的右上方向左移动. 这与右心房的右上方靠近窦房结, 右心房的左侧靠近右心室有关[33]. 由于P波后半段(Ppeak—Pend, Pend是P波终点)的磁信号比较复杂, 心房内电活动成像的特征不明显, 故文中没有图示. 图6(c)和图6(d)中, SONG与IIC的电活动成像结果类似, A和B的心房外各有少量重建的伪源. 图6(c)中IIC和SONG显示, 虽然心脏P波前期磁信号呈单调上升, 但是Ponset—Ppeak间期电活动的方向有变化. 从起始时刻Ponset到结束时刻Ppeak, 重建源移动方向如图中绿色箭头所示. MVB的成像结果比较模糊, 所以A和B的心房内电活动特征不明显. TRR是一种重建等效单源的方法, 所以图6(c)和图6(d)中显示, 等效单电流源是从右上向左下移动的[32]. 实验研究结果显示, IIC图6中P波间期健康人A和B心脏内分别有14个和26个极大电流源. 相比其他方法超出心脏范围的伪源较少. IIC和SONG的成像结果显示了健康人右心房中电活动的方向. 图 6 (a), (b) 健康人A与B的单周期61通道心脏磁场信号及其Ponset-Ppeak段; (c), (d) 用IIC, SONG, MVB和TRR得到的2个健康人的Ponset-Ppeak段的心脏电流源重建结果. 圆点中的浅红色到深红色表示重建电流源随时间的位置变化. 绿色箭头表示电活动的方向 Figure6. (a),(b) 61-channel MCG signal and Ponset-Ppeak segment of single-cycle from healthy subjects A and B; (c), (d) The cardiac current sources reconstruction of subjects A and B in Ponset-Ppeak segment using IIC, SONG, MVB or TRR. The reconstructed current sources change the color from white to red with time. The green arrow shows the direction of electrical activity


 图 1 分布源位置及指定的26个邻域位置, 分别用红色和蓝色表示
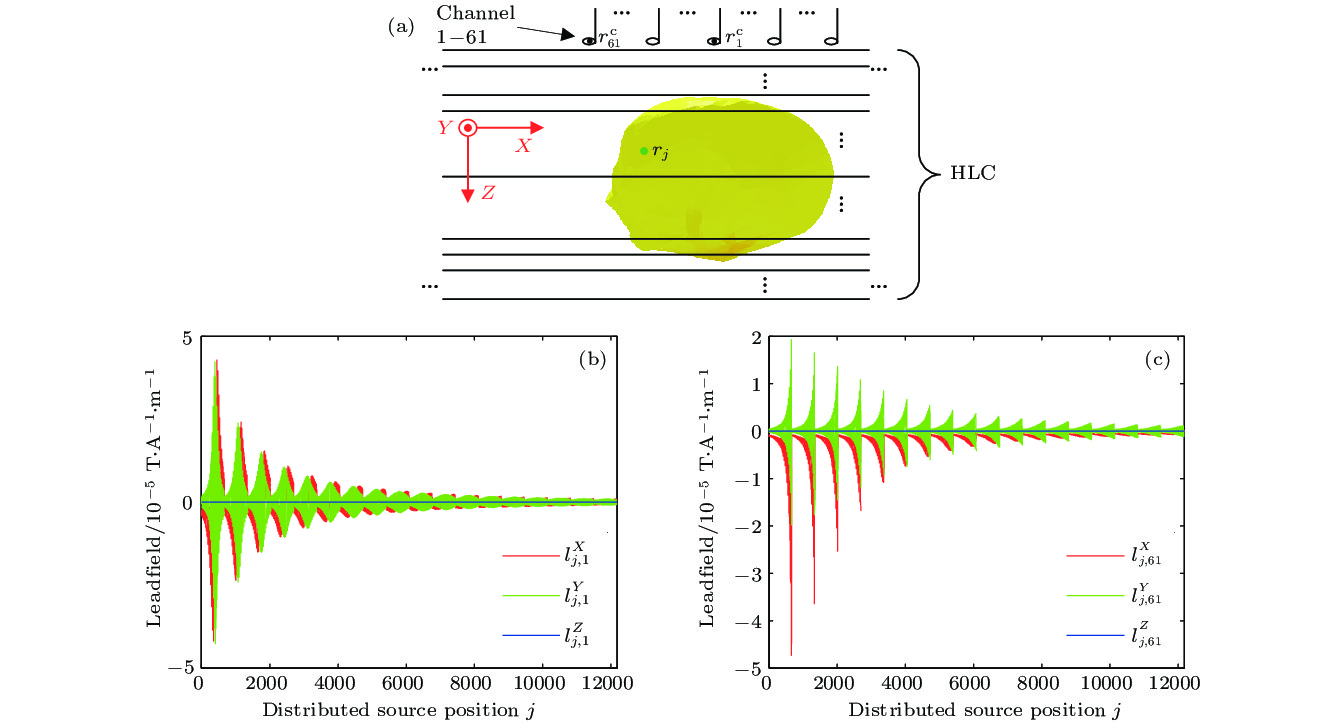 图 2 (a) 水平分层导体. 其中黑色直线表示分层躯干的边界, 黄色椭圆体表示心脏; (b), (c) 测量通道1和61的磁场导联


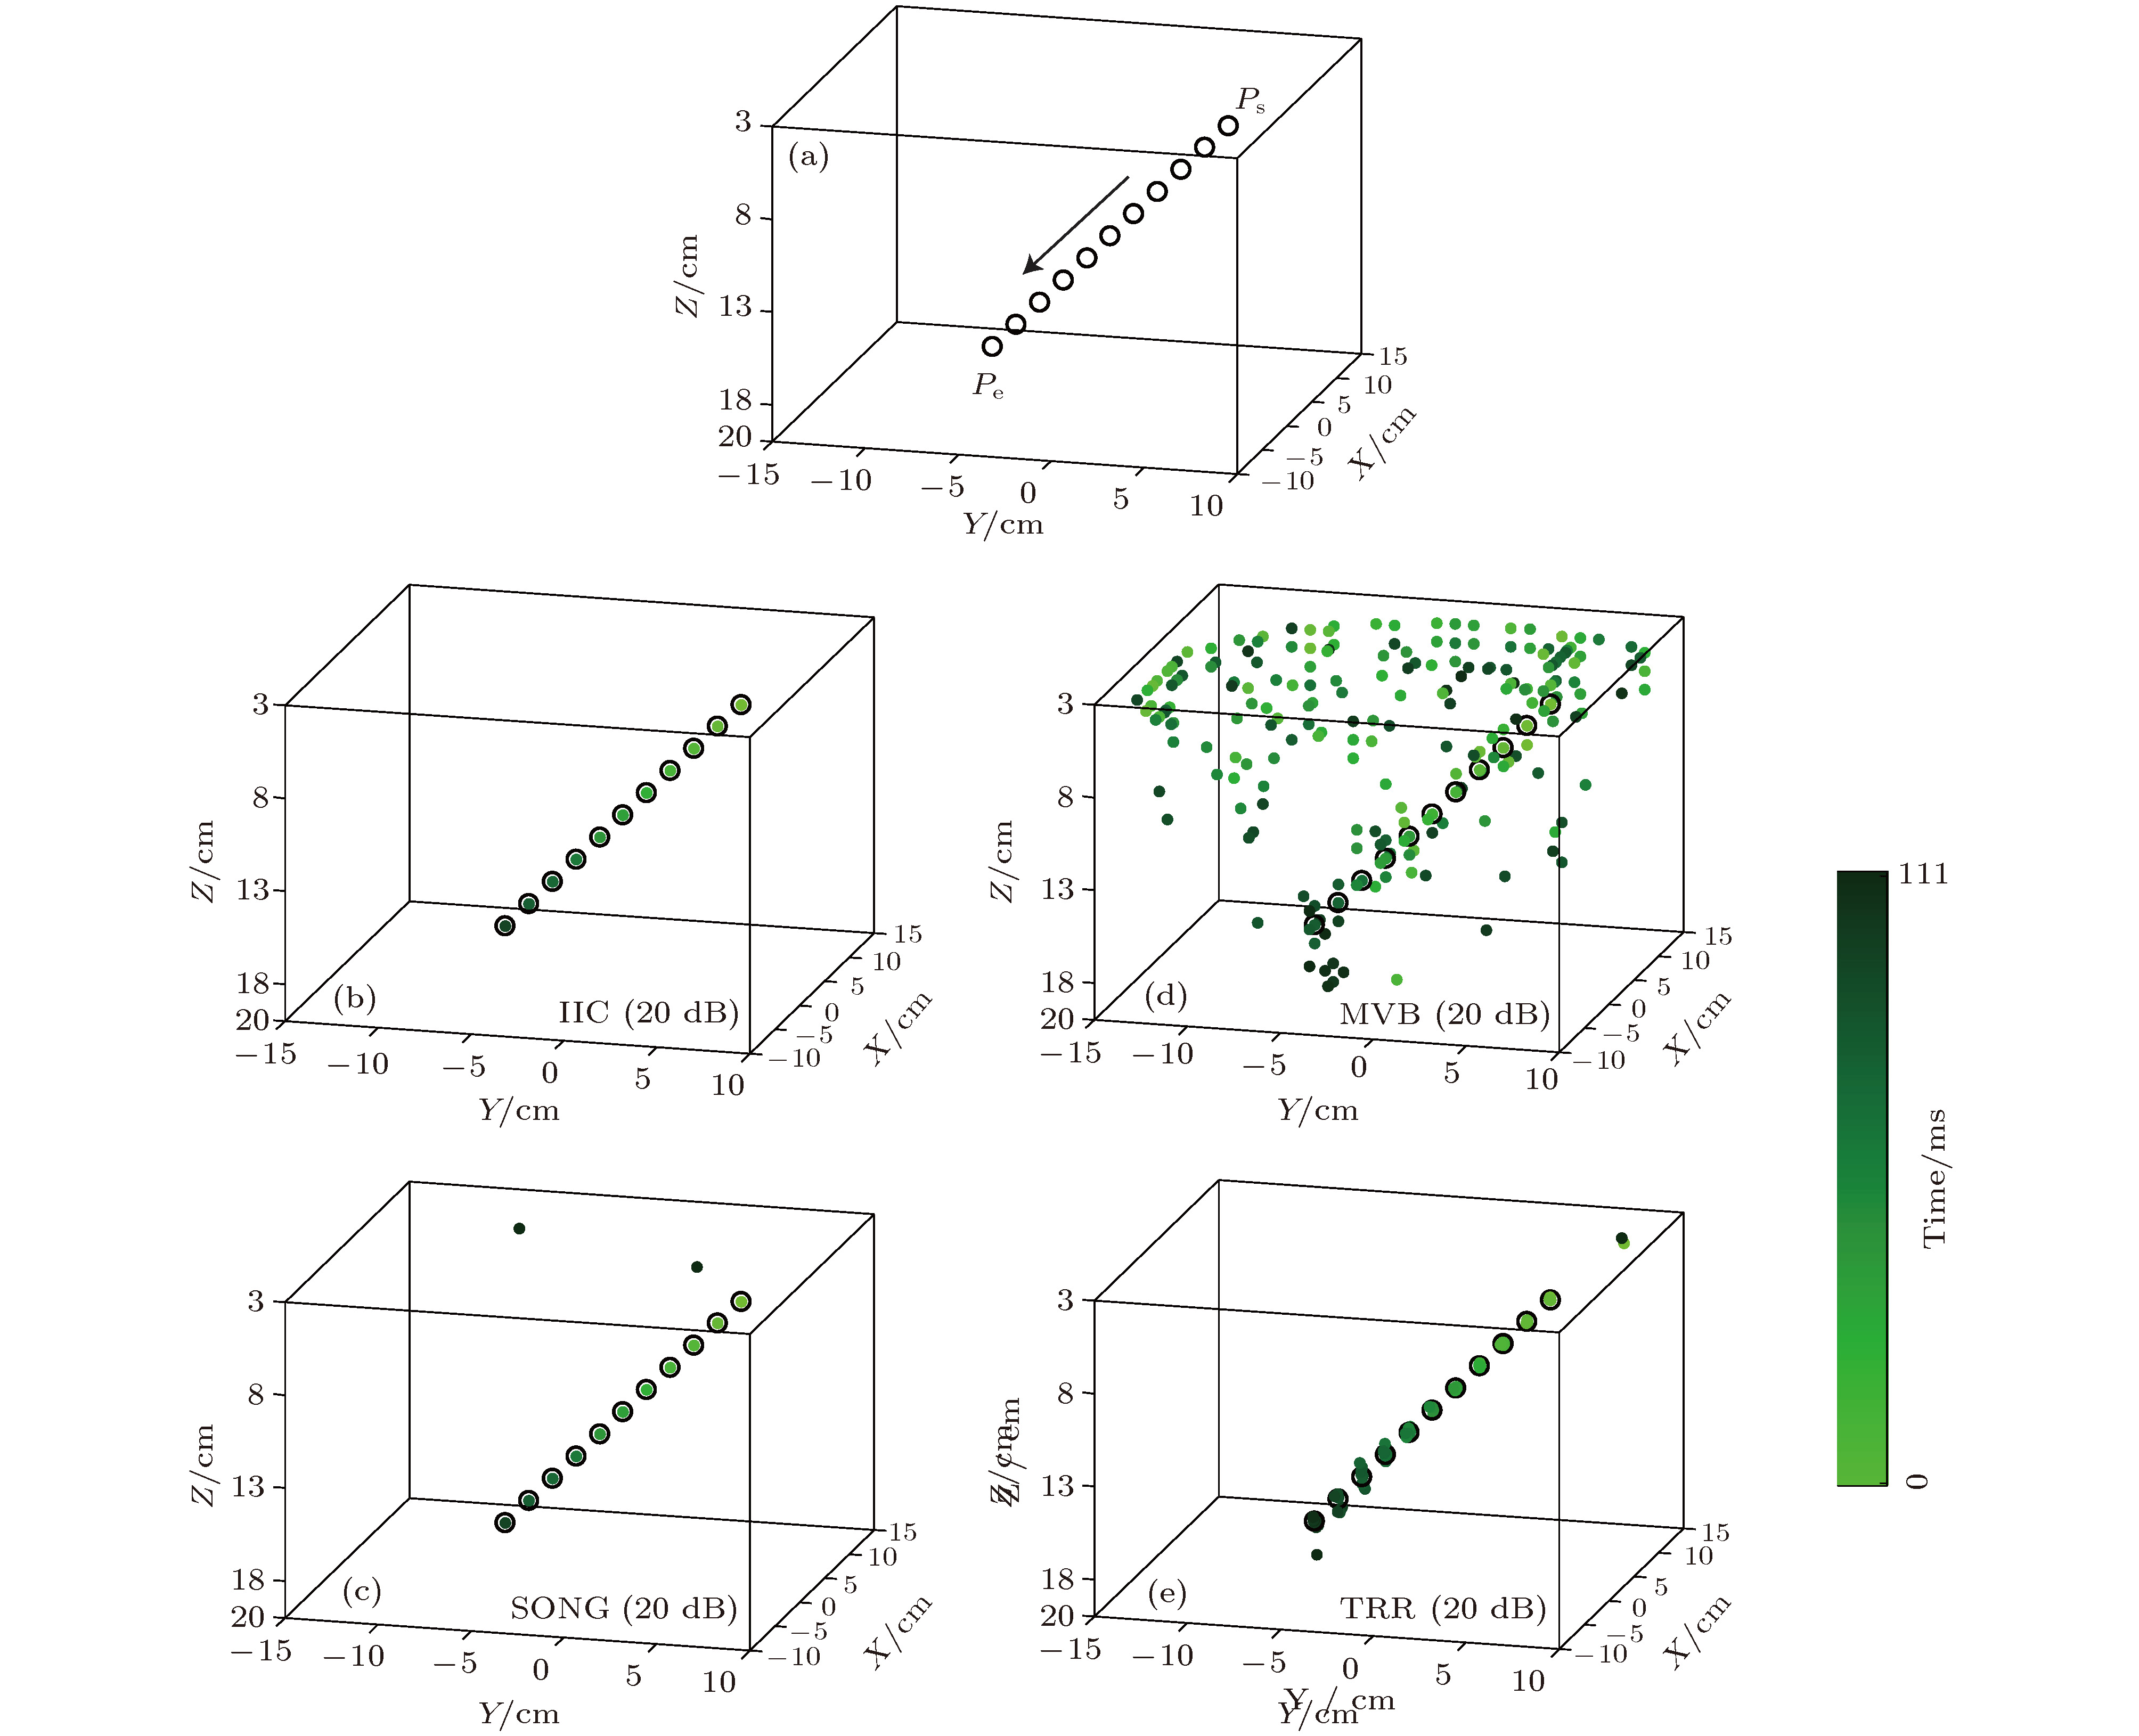 图 3 (a) 黑色圆圈○和箭头表示沿直线方向的参考路径1; (b)?(e) 是SNR = 20 dB时, IIC, SONG, MVB和TRR方法的源重建结果. 黑圈中的浅绿色到深绿色表示重建电流源位置随时间的变化


 图 4 (a) 黑色圆圈○和箭头表示沿直线方向的参考路径2; (b)?(e) SNR = 20 dB时, IIC,SONG,MVB和TRR方法的源重建结果. 黑圈中的浅绿色到深绿色表示重建电流源位置随时间的变化


 图 5 (a), (b) 健康人A与B的单周期61通道心脏磁场信号及其Ppeak时刻; (c), (d) 用IIC,SONG与MVB方法得到的2个健康人Ppeak时刻源空间谱强度的XY与XZ面等高线图
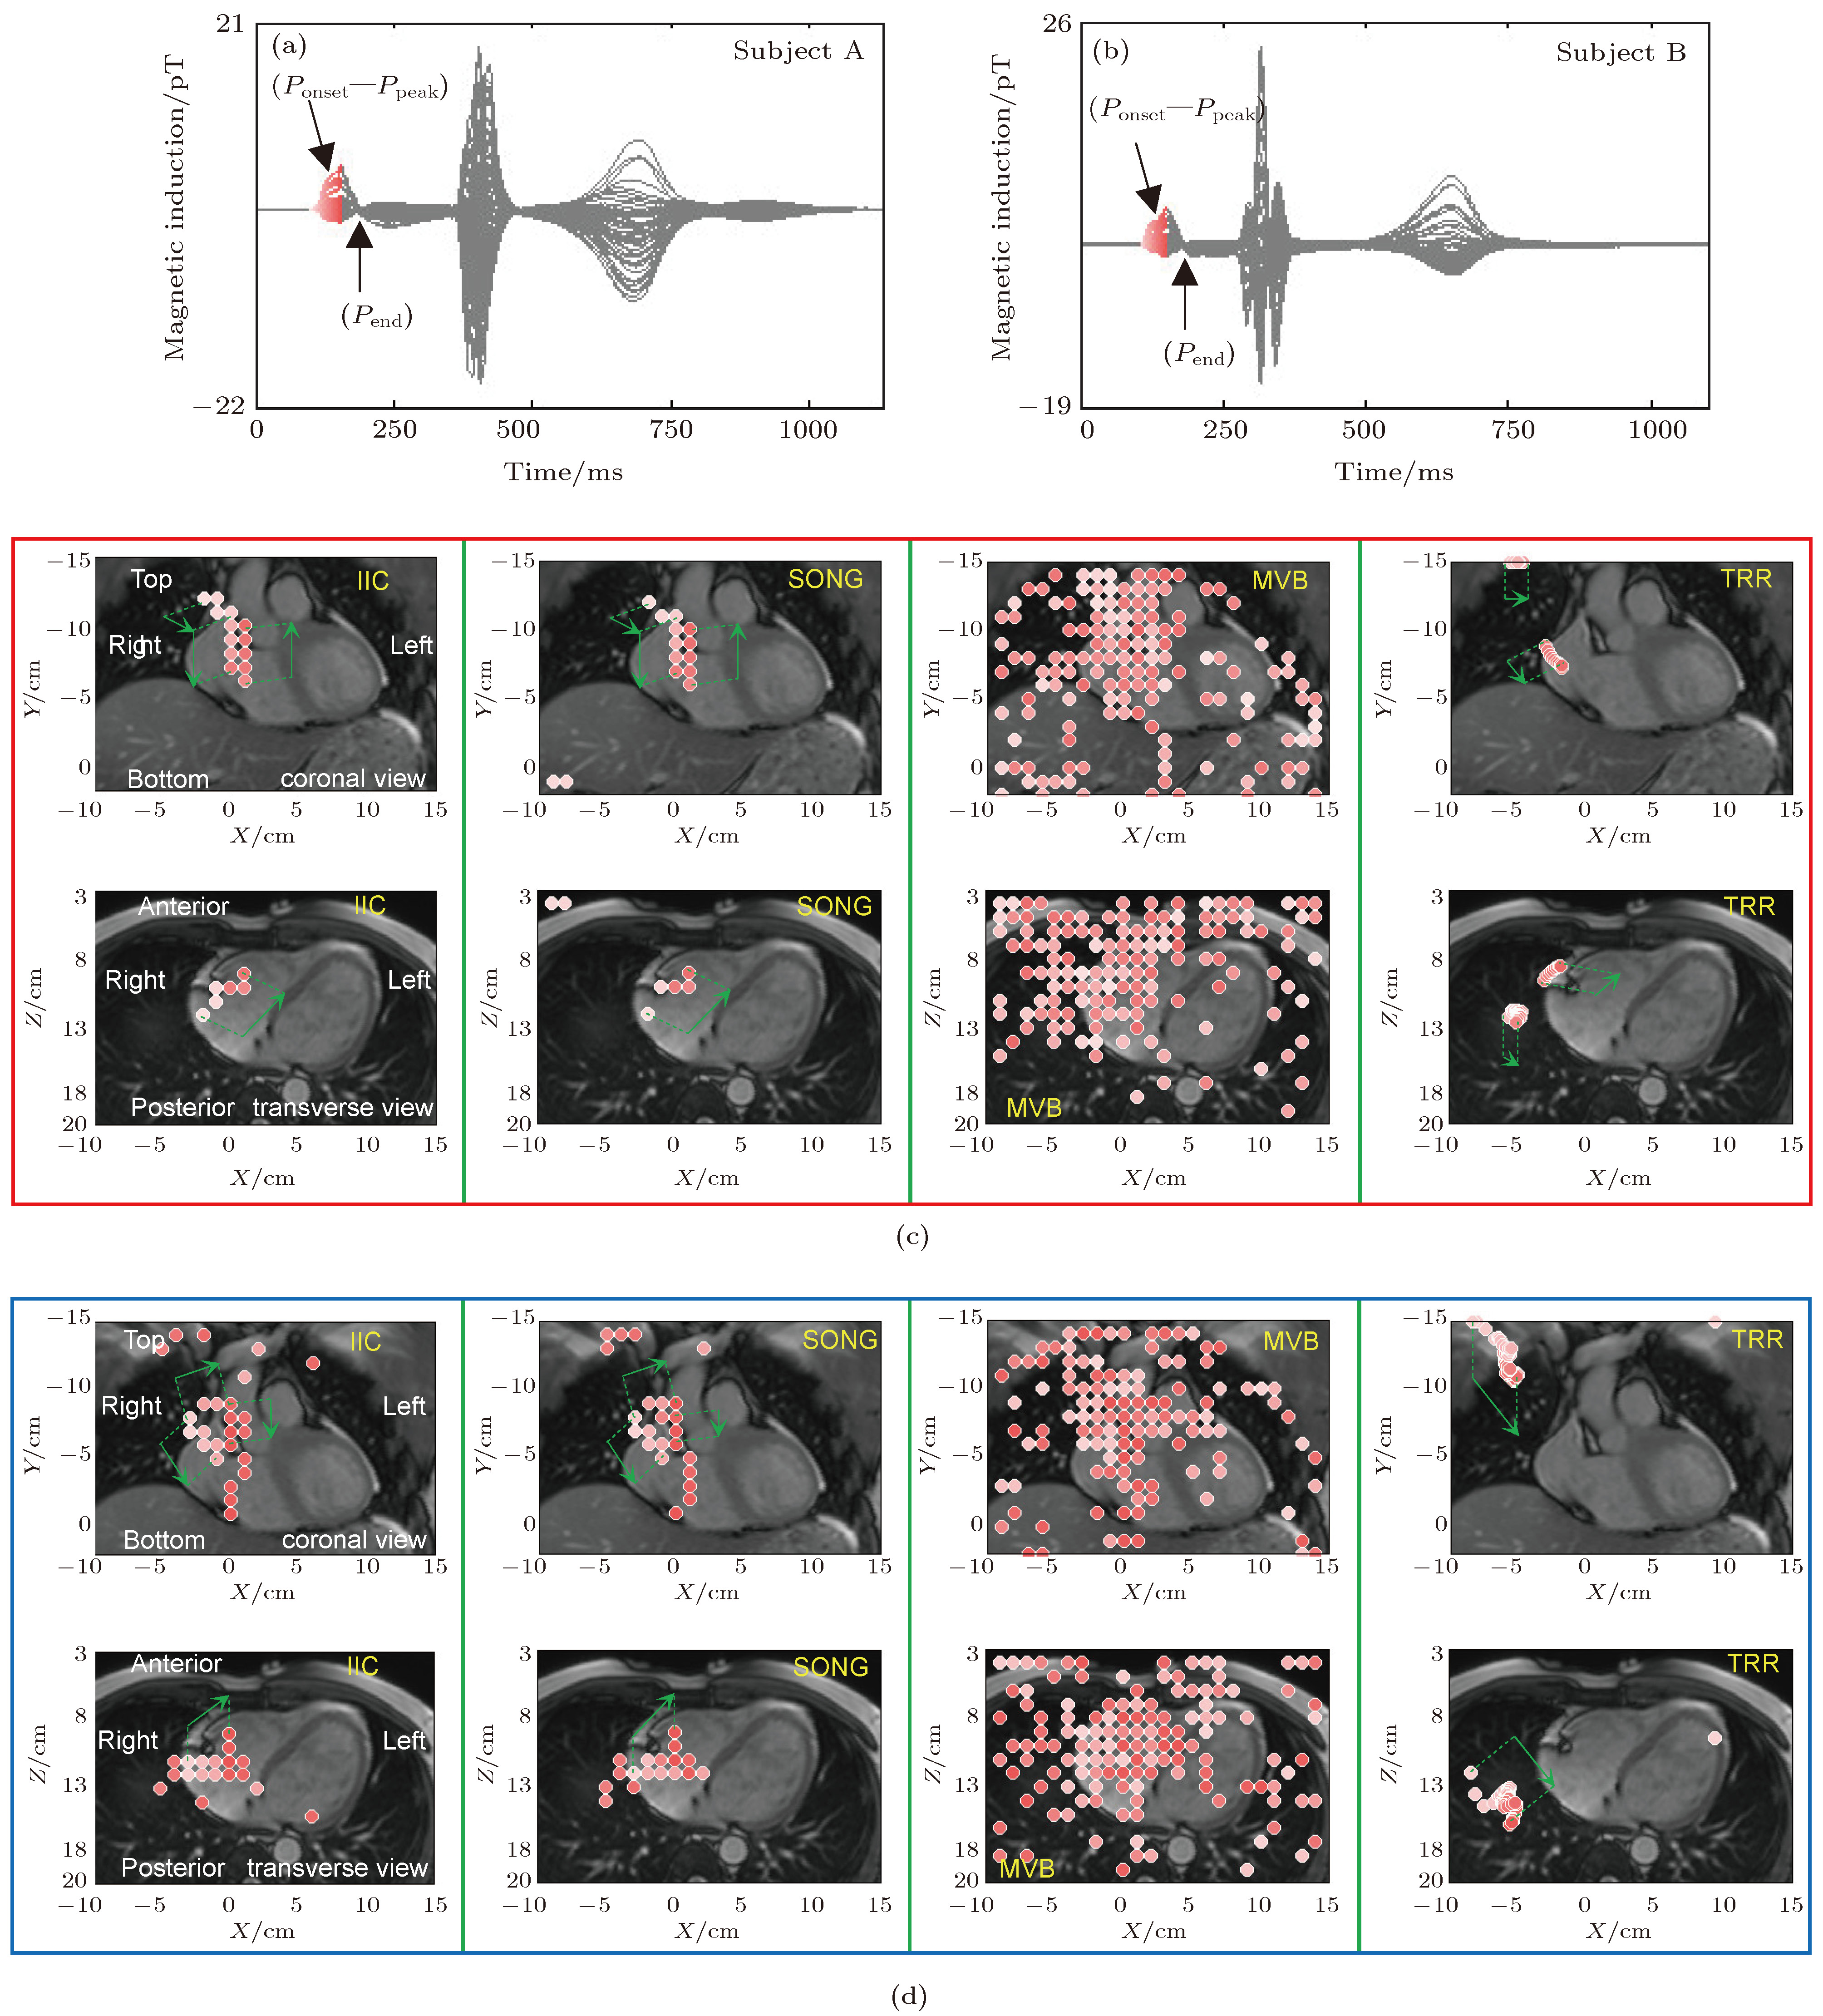 图 6 (a), (b) 健康人A与B的单周期61通道心脏磁场信号及其Ponset-Ppeak段; (c), (d) 用IIC, SONG, MVB和TRR得到的2个健康人的Ponset-Ppeak段的心脏电流源重建结果. 圆点中的浅红色到深红色表示重建电流源随时间的位置变化. 绿色箭头表示电活动的方向


