1.Key Laboratory of All Optical Network and Advanced Telecommunication Network, Ministry of Education, Institute of Lightwave Technology, Beijing Jiaotong University, Beijing 100044, China 2.College of Physics and Electrical Engineering, Anyang Normal University, Anyang 455000, China 3.Beijing Institute of Astronautical System Engineering, Beijing 100076, China
Fund Project:Project supported by the National Natural Science Foundation of China (Grant Nos. 61775015, 61475015, 61605003) and the Fundamental Research Funds for the Central Universities, China (Grant No. 2018JBZ109).
Received Date:21 January 2019
Accepted Date:17 April 2019
Available Online:01 June 2019
Published Online:05 June 2019
Abstract:Supercontinuum generated in normal dispersion region of highly nonlinear fiber (HNLF) is widely used in signal processing and communication benefiting from its good flatness and high coherence. Because of the normal dispersion, optical wave breaking (OWB) occurs when non-frequency shift components and frequency shift components caused by self-phase modulation (SPM) overlap in time domain, and ends when non-frequency shift components disappear. The evolution of non-frequency shift components at the front and rear edge of optical pulse play an essential role in the supercontinuum generation process. In this paper, the evolution of non-frequency shift components in normal dispersion region is numerically calculated and analyzed based on generalized nonlinear Schr?dinger equation. The results demonstrate that non-frequency shift components shrink gradually as the pulse propagates in the normal dispersion region. Cross-phase modulation (XPM) and stimulated Raman scattering (SRS) play a major role in this process, while the third-order dispersion imposes little effect on it. Because of XPM, non-frequency shift components at the front and rear edge shrink gradually, and keep red shifting and blue-shifting respectively. The influence of XPM on the non-frequency shift components at both edges is symmetrical. However, the influence of SRS on the evolution of non-frequency-shift components at both edges is asymmetric. At the front edge, SRS transfers the energy from non-frequency shift component to frequency shift component, which is opposite to that at the rear edge. At the front edge, SRS accelerates the shrinking process of the non-frequency shift component, while it slows down the shrinking process at the rear edge. And this asymmetric effect is more obvious when the peak power of the pulse is higher and SRS is more efficient. The evolution of the non-frequency shift components of chirped pulses propagating in the normal dispersion region is studied. Comparing with the unchirped pulse, the non-frequency shift components at the front and rear edge of the chirped pulse have different wavelengths. For the negative chirped pulse, the wavelength spacing between the overlapped frequency-shift components and non-frequency shift components is larger, which is easier to satisfy the SRS gain range. Therefore, the evolution of non-frequency-shift components at the front and rear edge of the negative chirped pulse are more asymmetric due to the higher SRS efficiency. For positive chirped pulses, the wavelength spacing between the overlapped components is difficult to satisfy the SRS gain range. The evolution of non-frequency-shift components in the positive chirped pulses is more symmetrical due to the lower SRS efficiency. Keywords:supercontinuum/ nonlinear fiber optics/ stimulated Raman scattering/ cross-phase modulation
3.仿真分析首先对不同峰值功率脉冲在HNLF正常色散区传输过程进行数值计算, 绘制时谱图, 分析和归纳脉冲尾部非频移分量变化趋势. 计算采用的光纤参数为$\gamma = 11\;{\rm{ k}}{{\rm{m}}^{{\rm{ - 1}}}} \cdot {{\rm{W}}^{ - 1}}$, ${\beta _2} = 0.34{{\;{\rm{p}}{{\rm{s}}^{\rm{2}}}} / {{\rm{km}}}}$, ${\beta _3} =$$ 0.0022\;{{{\rm{p}}{{\rm{s}}^{\rm{3}}}} / {{\rm{km}}}}$, 脉冲宽度和中心波长为1.5 ps和1555 nm, 脉冲峰值功率分别为10, 30, 50 W. 本文所采用的光脉冲波形皆为双曲正割. 图1为忽略噪声情况, 在光纤200, 400和600 m处输入脉冲不同峰值功率条件下的时谱图. 图 1 忽略噪声时输入脉冲不同峰值功率条件下, 光脉冲在HNLF 200, 400和600 m处的时谱图 Figure1. Spectrograms at 200, 400 and 600 m of HNLF with different input peak powers when the noise is ignored.
通过图1可将脉冲尾部非频移分量变化趋势做如下总结: 1)随传输距离增加脉冲尾部能量由靠近脉冲中心位置向两侧减弱, 与光谱中红移和蓝移分量相对脉冲尾部非频移分量运动关系一致; 2)前沿和后沿尾部在能量减弱的同时其波长分别发生红移和蓝移; 3)在相同传输距离, 脉冲峰值功率更高的情况下前后沿尾部能量残余更少, 频移更大; 4)在峰值功率较高时, 脉冲前沿相比于后沿非频移部分波长移动更明显, 残余能量更少, 这一趋势在传输距离较长时更加明显, 而在脉冲峰值功率较低时, 前后沿尾部非频移部分变化趋势没有明显差别. 图2中的第一行和第二行分别输入脉冲无噪声和有噪声情况下在光纤不同位置的时谱图. 计算采用的光纤参数与上文相同, 脉冲宽度和峰值功率分别为1.5 ps 和 30 W. 观察图2可以发现, 在考虑噪声的情况下, 虽然处于长波长处的噪声被拉曼散射放大, 时谱图中出现了大面积亮斑, 但其前后沿非频移分量(红色圆圈标注位置)的演化情况与无噪声情况具有很好的一致性, 都表现为随传输距离增加逐渐减弱, 并且后沿非频移分量变化趋势较为缓慢. 由此可见噪声并不是非频移分量演化的决定因素, 并且影响较小. 本文的主要目的是对脉冲在正常色散区传输时前后沿非频移分量的演化过程进行定性分析, 因此在之后的数值计算中忽略了噪声的影响, 得到的时谱图更加清晰, 方便理解和分析. 图 2 脉冲峰值功率和脉宽为30 W 和1.5 ps 时, 无噪声(第一行)和有噪声(第二行)情况下在光纤200, 400和600 m处的时谱图 Figure2. Spectrograms at 200, 400 m and 600 m of HNLF without noise (row 1) and with noise (row 2), when the peak power and pulse width are 30 W and 1.5 ps.
23.1.拉曼散射和三阶色散对脉冲尾部非频移分量影响 -->
3.1.拉曼散射和三阶色散对脉冲尾部非频移分量影响
图1中脉冲前后沿尾部非频移分量出展现了不对称演化, 当峰值功率较高时更为明显. 拉曼散射会将短波长能量向增益范围内的长波长分量转移, 三阶色散也会导致超连续谱展宽不对称, 通过调整光纤参数来分析以上两点对脉冲尾部非频移分量在HNLF正常色散区演化过程中的影响和作用. 图3为脉冲宽度和峰值功率为1.5 ps 和50 W, 光纤参数$\gamma = 11\;{\rm{ k}}{{\rm{m}}^{ - 1}} \cdot {{\rm{W}}^{ - 1}}$, ${\beta _2} = 0.34{{\;{\rm{p}}{{\rm{s}}^{\rm{2}}}} / {{\rm{km}}}}$时, 分别考虑三阶色散和拉曼散射条件下光纤600 m处的时谱图. 图 3 脉冲峰值功率50 W时不同光纤参数下光脉冲在HNLF 600 m处的时谱图 Figure3. Spectrograms with different third-order dispersion coefficients and with/without SRS at 600 m of HNLF when peak power is 50 W.
与无啁啾脉冲不同, 啁啾脉冲在HNLF正常色散区光谱展宽过程中前后沿非频移分量具有不同波长. 基于对脉冲尾部非频移分量演化的分析, 对啁啾脉冲非频移分量演化以及其对脉冲和光谱的影响进行分析讨论. 图5为啁啾参数C分别为3, 0和–3的脉冲在HNLF中不同位置的时谱图, 图6为对应的脉冲波形和光谱图. 仿真中采用的脉冲宽度和峰值功率为1.5 ps和50 W, 光纤参数为$\gamma = 11$ km–1·W–1, ${\beta _2} = 0.34$ ps2/km, ${\beta _3} =$0.0022 ps3/km. 图 5 不同初始啁啾脉冲在HNLF中0, 100, 400和600 m处的时谱图 Figure5. Spectrograms at the length of 0 m, 100 m, 400 m, 600 m of HNLF with different C.
图 6 不同初始啁啾脉冲在HNLF中100, 600 m处的波形和光谱 Figure6. Waveforms and spectra with different C, at l00 and 600 m of HNLF.


 图 1 忽略噪声时输入脉冲不同峰值功率条件下, 光脉冲在HNLF 200, 400和600 m处的时谱图
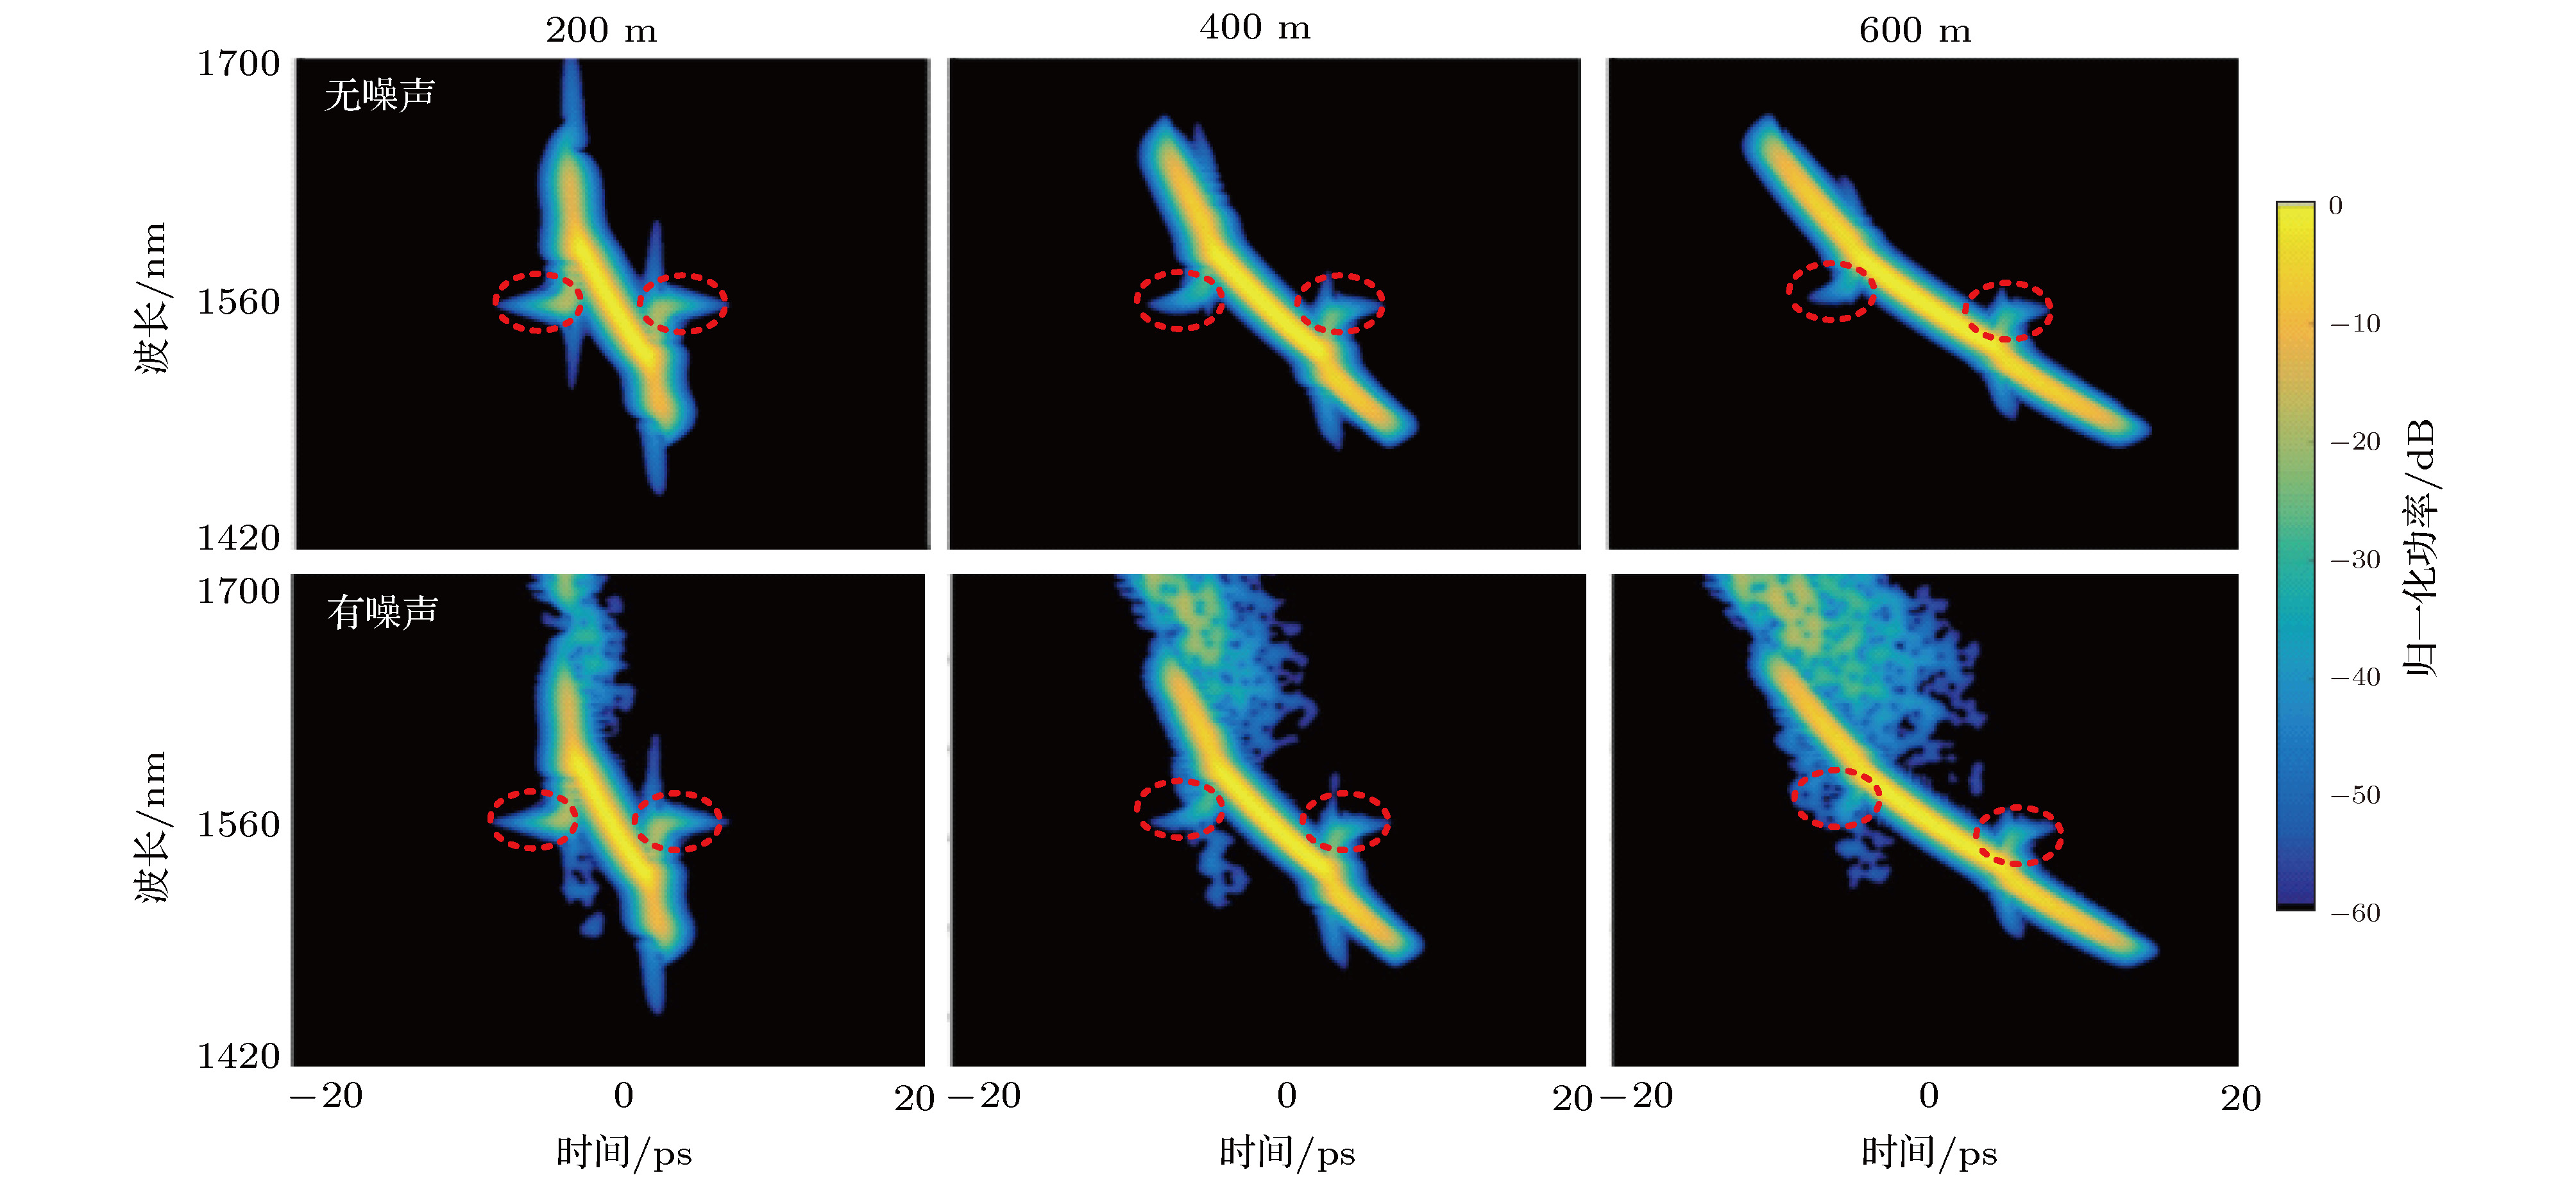 图 2 脉冲峰值功率和脉宽为30 W 和1.5 ps 时, 无噪声(第一行)和有噪声(第二行)情况下在光纤200, 400和600 m处的时谱图

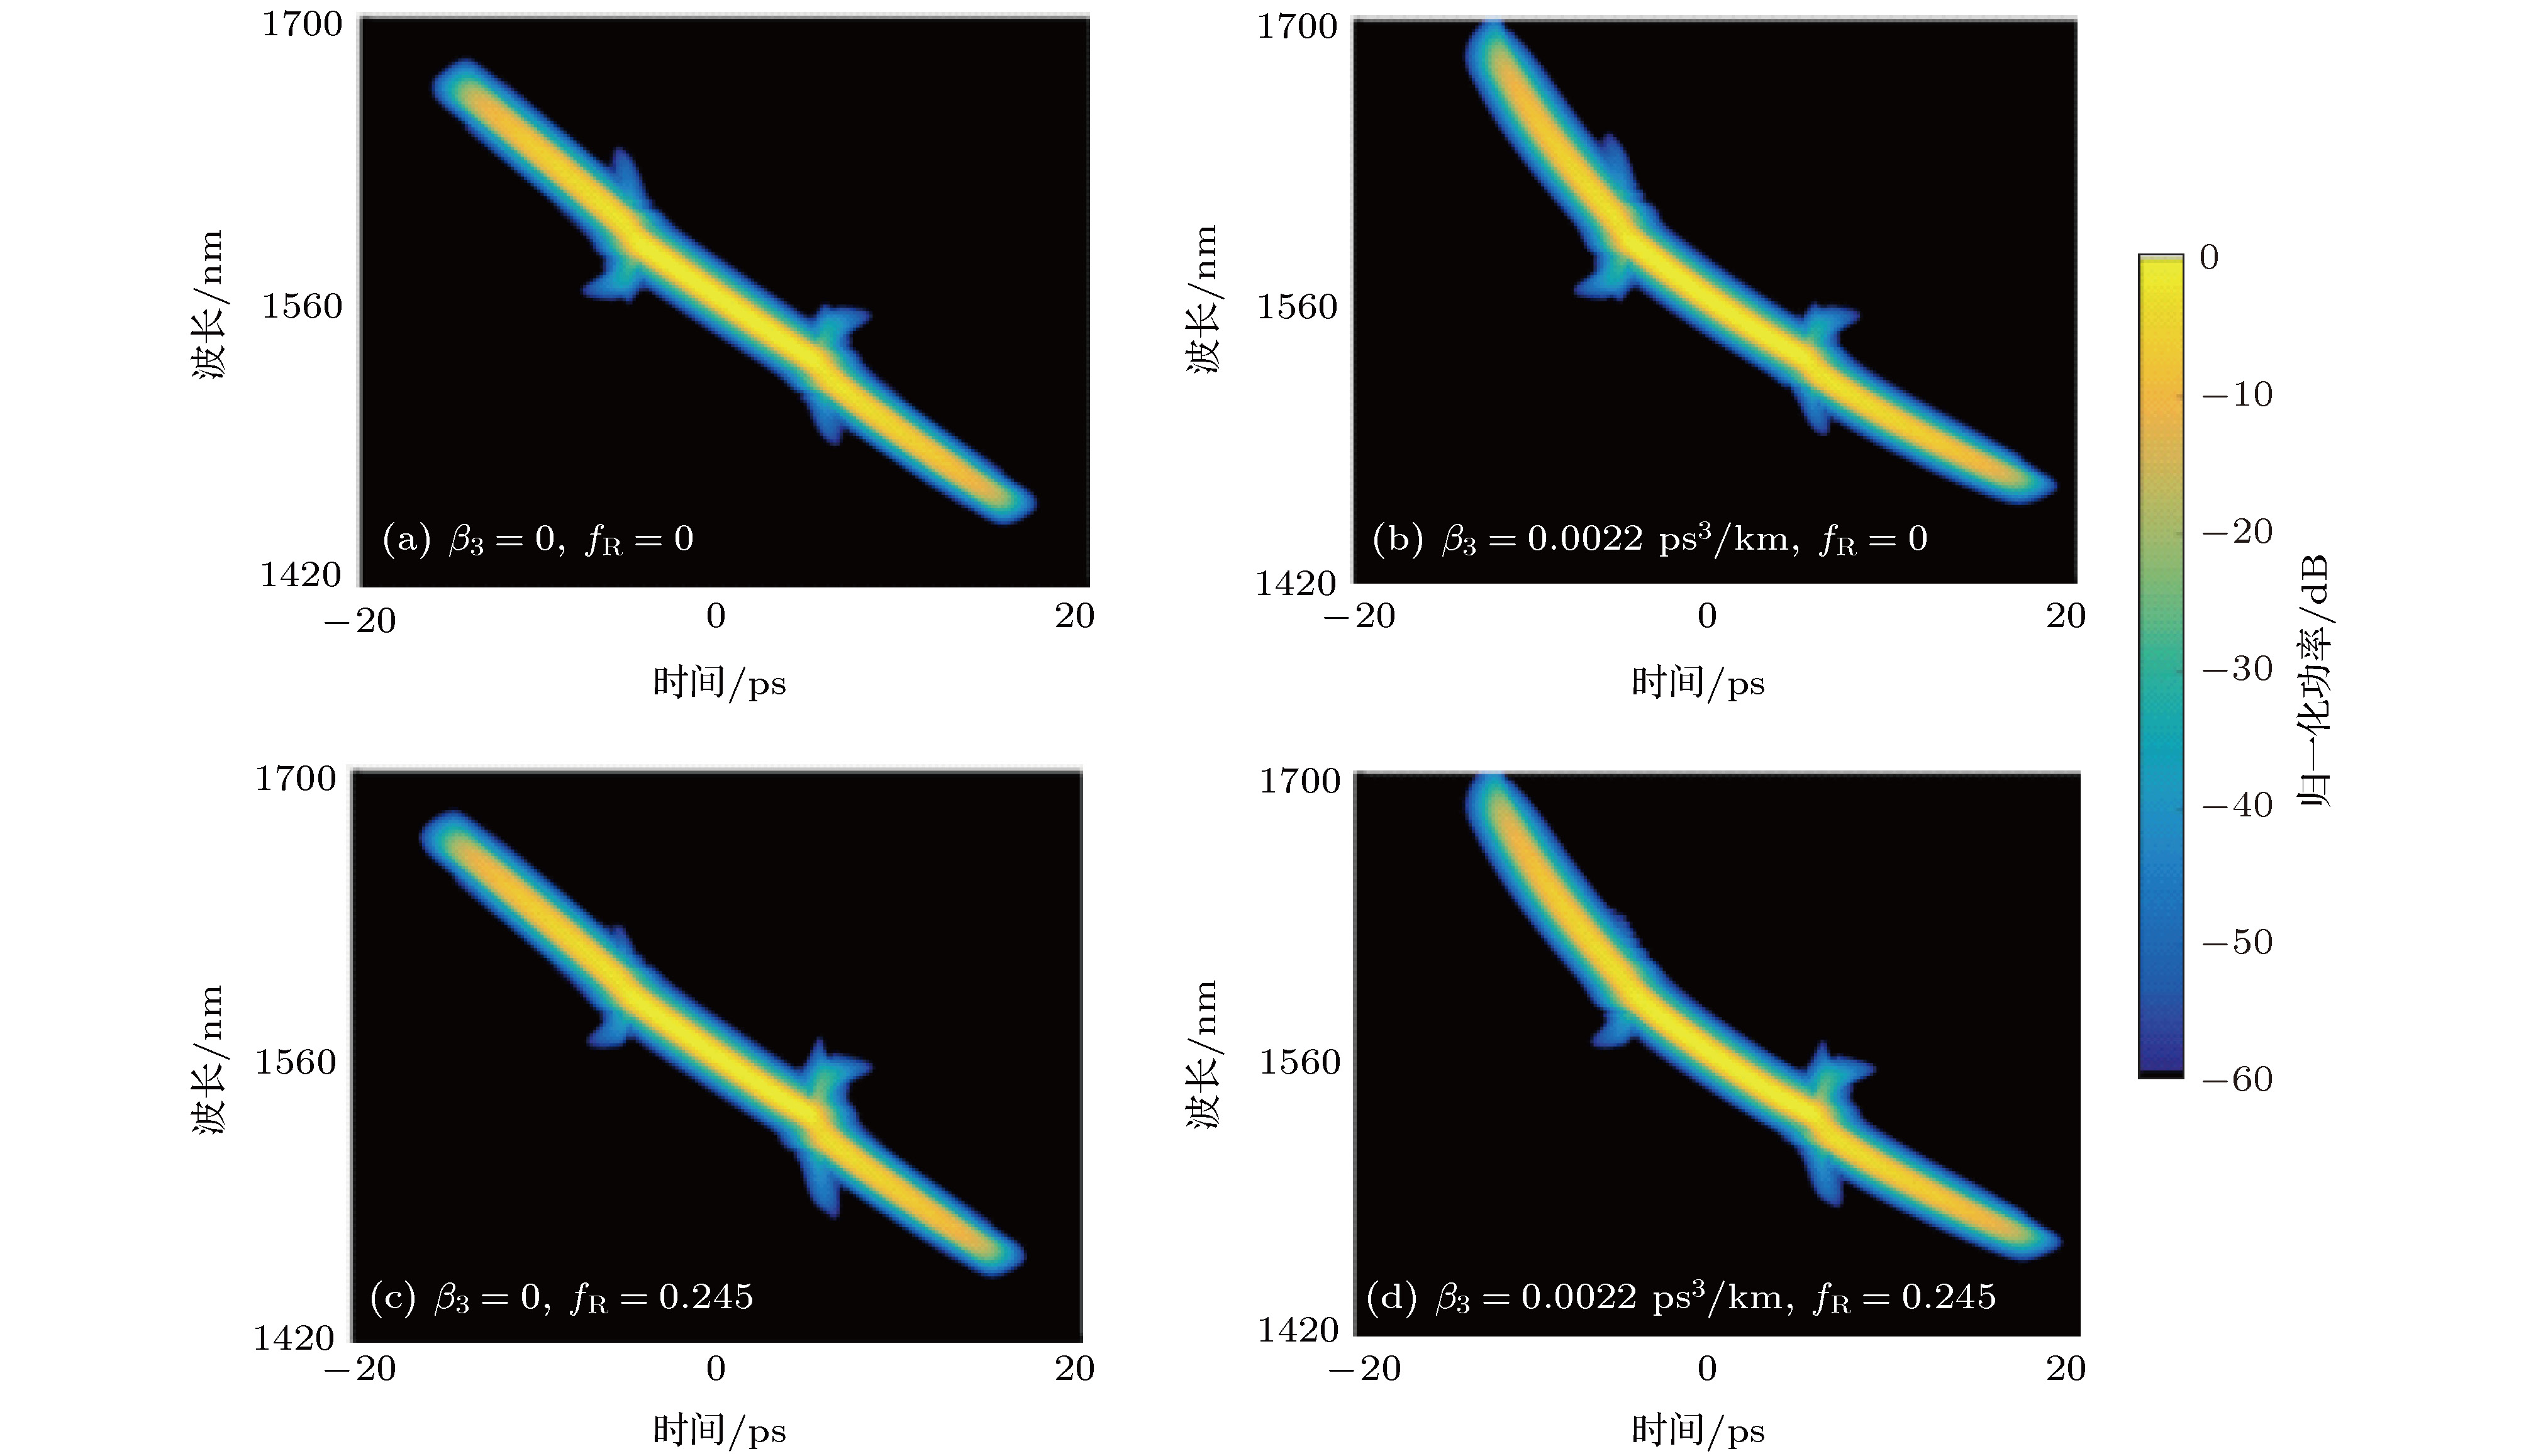 图 3 脉冲峰值功率50 W时不同光纤参数下光脉冲在HNLF 600 m处的时谱图


 图 4 脉冲和连续光一同进入HNFL时不同位置的时谱图


 图 5 不同初始啁啾脉冲在HNLF中0, 100, 400和600 m处的时谱图
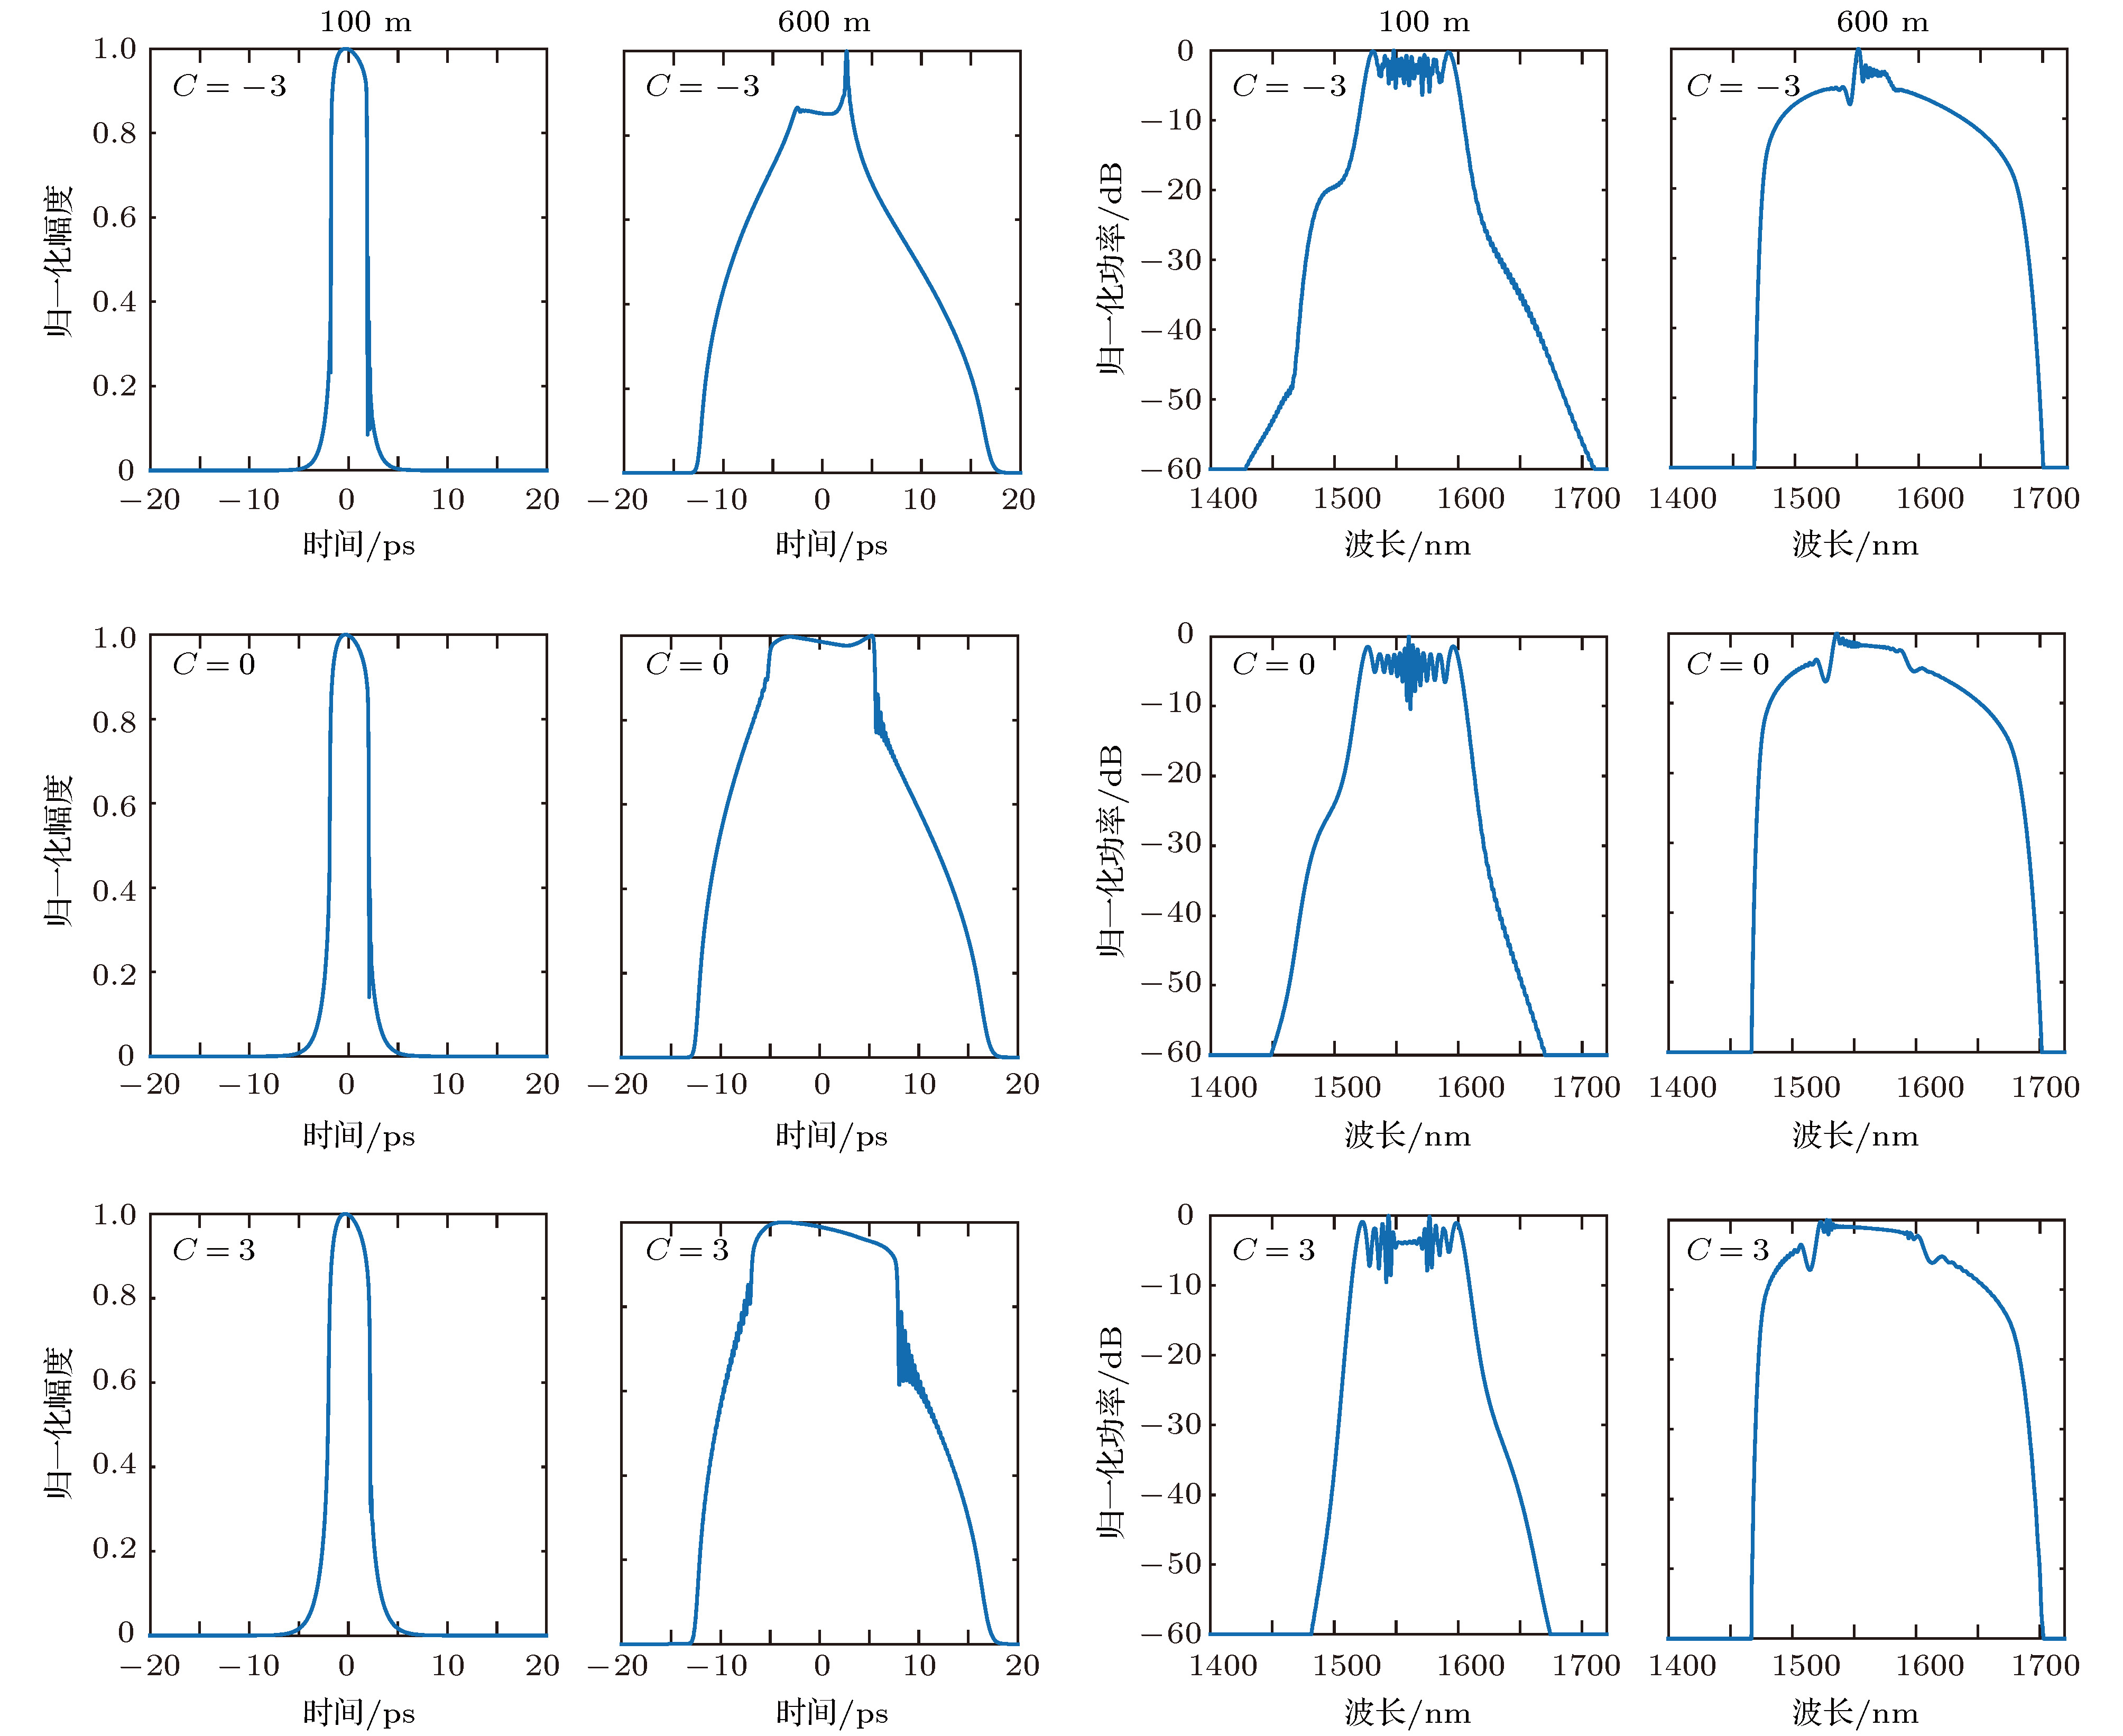 图 6 不同初始啁啾脉冲在HNLF中100, 600 m处的波形和光谱