 ,1, 王焱熙2, 赵莉2, 赵璐1
Spatio-temporal evolution and influencing factors of total factor productivity in China's manufacturing industry
WANG Zeyu,1, WANG Yanxi2, ZHAO Li2, ZHAO Lu1收稿日期:2020-05-14修回日期:2021-09-24
| 基金资助: |
Received:2020-05-14Revised:2021-09-24
| Fund supported: |
作者简介 About authors
王泽宇(1981-), 女, 辽宁铁岭人, 博士, 教授, 研究方向为海洋经济地理。E-mail:

摘要
关键词:
Abstract
Keywords:
PDF (4107KB)元数据多维度评价相关文章导出EndNote|Ris|Bibtex收藏本文
本文引用格式
王泽宇, 王焱熙, 赵莉, 赵璐. 中国制造业全要素生产率时空演变及影响因素. 地理学报, 2021, 76(12): 3061-3075 doi:10.11821/dlxb202112013
WANG Zeyu, WANG Yanxi, ZHAO Li, ZHAO Lu.
1 引言
制造业是国民经济的主体,是立国之本、兴国之器、强国之基。自2010年起,中国制造业产值及其增长速度已处于国际领先地位,连续11年成为世界上最大的制造业国家。然而,中国制造业在技术创新、生产效率等方面与国际领先水平仍存在差距。随着中国劳动力成本和土地价格不断攀升,制造业传统粗放型发展模式弊端逐渐显露,亟需塑造新的比较优势[1]。《中共中央关于制定国民经济和社会发展第十四个五年规划和2035年远景目标的建议》强调“坚持把发展经济着力点放在实体经济上,加快推进制造强国、质量强国建设”,为“十四五”乃至更长一段时期中国制造业的高质量发展确立了目标。在此背景下,提高全要素生产率,从外延式增长向内涵式增长转变成为新时期中国制造业高质量发展的重要战略选择[2]。因此,明确制造业全要素生产率的时空格局及影响因素对促进区域制造业高质量协同发展,加快建设制造强国、质量强国具有重要意义。20世纪90年代以来,测度制造业全要素生产率、解释中国经济增长的奇迹成为国内外****研究的重点内容[3]。国外****中最具代表性的是Young和Brandt。以Young为代表的****对中国制造业全要素生产率的增长持悲观态度[4],认为依赖外部投入增加形成的粗放式增长不可持续,难以称为“东南亚奇迹”[5]。以Brandt为代表的****认为在关税自由化与企业进入和退出的作用下,中国制造业全要素生产率实现了可观的增长[6,7]。国内制造业全要素生产率的早期研究主要从经济增长角度,以资本、劳动力要素为主要投入,分析全国或特定区域制造业全要素生产率的发展状况及时序变迁特征[8,9]。随着制造业企业统计数据可获得性的增强,研究逐渐由宏观走向微观[10],在经济增长理论[11]、新贸易理论[12]、产业组织理论[13]等框架下,从方向、程度和机制等出发探究制造业全要素生产率的作用因素[14]。如李小平等以新贸易理论为指导,探讨贸易模式和贸易结构对中国制造业全要素生产率的影响[12];李玉红等基于产业组织理论,从企业动态演化角度解释技术进步对转轨时期中国制造业全要素生产率变动的作用[13]。随着企业层面数据样本统计误差、统计口径变更、关键指标缺失和异常值多等问题的显露,大多数基于企业层面数据的制造业全要素生产率研究囿于2008年前[15],时效性渐失。虽然李苏苏等通过混合插补法等方法将企业层面数据扩展到2013年,但时效性和适用性有所局限[16,17,18]。
纵观对制造业全要素生产率的研究,虽然取得了一系列丰硕成果,但仍存在一些亟待深入思考的问题:① 创新是制造业要素投入的重要组成部分,仅从资本、劳动力两个方面构建制造业全要素生产率度量模型,难以科学评估制造业全要素生产率的实际水平。同时,高质量发展背景下的制造业全要素生产率测度,应将污染类指标作为非期望产出纳入指标体系;② 从学科角度看,现有研究多从经济学、管理学视角探究制造业全要素生产率的增长方式与区域差异,地理学领域的相关研究主要集中在制造业产业关联与产业结构[19]、演变格局及机制[20]、产业集聚与创新网络[21]、经济环境效益与可持续发展[22]等方面,忽视了地理学视角下制造业全要素生产率“格局—过程—机理”的研究;③ 在影响因素方面,现有研究多为探讨单一或少数因子对制造业全要素生产率的作用机制,但各因子对制造业全要素生产率的影响并不是均质的,其作用强度与作用空间存在显著差异,亟需引入地理加权回归模型考察制造业全要素生产率影响因素的空间异质性。
基于此,本文以中国30个省市(因限于数据的可获得性,暂未包括西藏、港澳台地区)为样本,将创新投入、非期望产出纳入超效率(Slacks-Based Measure)SBM模型,采用标准差椭圆、空间自相关分析法探究2002—2016年中国制造业全要素生产率的时空演变特征,并运用地理加权回归模型探究其主要影响因素,以期为区域制造业高质量协同发展提供参考依据。
2 理论基础、研究方法与数据来源
2.1 理论基础
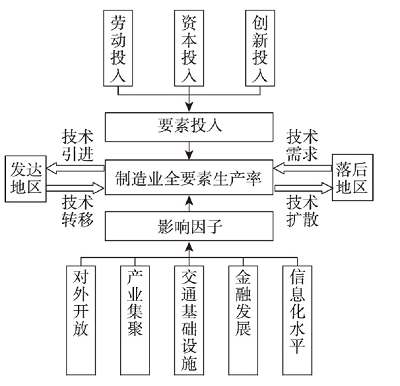
高质量发展是体现新发展理念的发展,是创新成为第一动力、协调成为内生特点、绿色成为普遍形态、开放成为必由之路、共享成为根本目的的发展,更加注重生产效率的改善和经济社会环境效益的提高[23]。内生增长理论认为创新投入带来的技术和知识增量是技术更新的主要动力,会促进全要素生产率的提高[24]。然而,传统的制造业全要素生产率指标体系仅考虑劳动、资本要素的投入约束,没有考虑到资源环境约束和创新投入对于制造业发展的作用,不符合高质量发展背景下中国建设制造强国的实践需要。制造业全要素生产率的提高,本质上是制造业发展质量和经济社会环境效益的提高,是诸多影响因素作用的综合结果,主要包括对外开放、产业集聚、交通基础设施、金融发展和信息化水平等方面[25,26]。“极化—涓滴”效应理论认为发达地区与落后地区之间存在极化效应和涓滴效应[27]。制造业相对落后地区通过技术引进、知识溢出效应或“学习效应”从制造业发达地区获取先进的技术和管理经验,制造业发达地区不断促使人才、资本等有利因素集聚,进而影响制造业相对落后地区的发展。基于此,制定中国制造业全要素生产率时空演变及影响因素分析思路和理论框架(图1)。
图1
 新窗口打开|下载原图ZIP|生成PPT
图1理论框架
Fig. 1Theoretical framework
2.2 研究方法
2.2.1 超效率SBM模型 相比于传统的数据包络分析模型(Data Envelopment Analysis, DEA),Tone提出的SBM模型不仅消除了松弛变量对测度值的影响,解决了投入产出的松弛性问题,同时考虑了非期望产出对制造业生产过程的影响,使制造业全要素生产率的测度值更加准确[28]。超效率DEA模型是一种对评价为DEA有效或弱有效的决策单元(Decision Making Unit, DMU)进一步评价的方法,其原理是将被评价DMU从参考集中排除从而使求解得出的效率值可能大于1[29]。超效率SBM模型结合了超效率DEA模型和SBM模型的优势,不仅可以更恰当地处理非期望产出,而且可以在有效决策单元中进一步作出比较[30]。制造业全要素生产率测度投入指标包括资本、劳动力和创新,产出指标包括期望产出和非期望产出。借鉴Young的研究方法[31],使用永续盘存法计算各省市制造业固定资产资本存量作为资本投入,固定资产折旧率取9.6%[32];以各省市工业企业年末平均从业人员作为劳动力投入;各省市工业企业科技经费内部支出作为创新投入;各省市工业总产值当年价格(以2002年为基期利用工业品出厂价格指数进行平减得到)作为期望产出;各省市工业废气、废水、废物排放量作为非期望产出。
2.2.2 标准差椭圆 标准差椭圆(Standard Deviation Ellipse, SDE)是由美国社会学家Welty Lefever等提出的用于揭示社会经济、自然环境等要素空间格局特征的空间统计方法[33],可通过定量刻画中国制造业全要素生产率标准差椭圆的面积、重心、长短轴、转角等基本参数,描绘中国制造业全要素生产率在空间层面的分布特征[34]。
2.2.3 空间自相关分析 空间自相关分析可揭示空间变量的分布是否与邻近变量有关,主要分为全局空间自相关与局部空间自相关[35]。首先利用全局自相关的Moran's I指数,检验中国制造业全要素生产率是否具有空间依赖性,再利用局部空间自相关的Moran's I指数分析中国制造业全要素生产率的局部空间集聚情况[36]。
2.2.4 地理加权回归模型 地理加权回归(Geographically Weighted Regression, GWR)模型是一种空间系数的回归分析工具。区别于普通线性回归模型,GWR模型将数据的空间特性纳入模型之中,可根据参数估计值地理位置的变化情况来探索空间关系的非平稳性,进而分析影响因素在不同地理位置的空间变异特征及规律[28]。基于此,本文采用地理加权回归模型来探索各省市制造业全要素生产率的影响因素,并对各影响因素的重要性及空间分布格局进行分析[37]。
2.3 数据来源
由于工业品出厂价格指数的数据缺失,无法对2017年后各省市工业总产值进行平减,且考虑到西藏及港澳台地区制造业数据的可获得性,本文选取2002—2016年中国30个省市(暂未包括西藏、港澳台地区)制造业为研究样本。数据主要来源于2003—2017年的《中国工业统计年鉴》[38]、《中国科技统计年鉴》[39]、《中国城市统计年鉴》[40]、《中国统计年鉴》[41]、《中国环境统计年鉴》[42]。3 中国制造业全要素生产率时空演变特征
3.1 时序演变特征
本文利用MAXDEA软件测算2002—2016年中国制造业全要素生产率(表1)。总体来看,2002—2016年间中国制造业全要素生产率呈波动上升趋势,由2002年的0.58上升至2016年的0.80,并在国家发展战略导向和国内外市场环境改变的作用下呈明显阶段性变化。分阶段来看,2002—2010年,中国加入世界贸易组织和市场化改革的成效逐渐显现,国内外需求市场及中小民营制造业企业的发展壮大促使制造业规模迅速扩大,资源要素获得较优配置,全要素生产率实现较大幅度增长,由2002年的0.58上升至2010年的0.78。2010—2012年,受全球金融危机后效影响,中国制造业产品内需动能不足、出口订单严重下滑,企业产出锐减,全要素生产率呈波动下降趋势。2012—2016年,中国经济发展进入新常态,深入实施创新驱动、绿色发展战略,产业结构调整和发展模式转变加快,制造业自主创新能力进一步提升,全要素生产率呈回弹趋势。Tab. 1
表1
表12002—2016年中国制造业全要素生产率
Tab. 1
| 省份 | 2002 | 2004 | 2006 | 2008 | 2010 | 2012 | 2014 | 2016 |
|---|---|---|---|---|---|---|---|---|
| 安徽 | 0.52 | 0.63 | 0.65 | 0.65 | 1.03 | 0.75 | 1.01 | 1.00 |
| 北京 | 1.00 | 1.08 | 1.15 | 1.05 | 1.08 | 1.11 | 1.10 | 1.30 |
| 福建 | 0.65 | 0.71 | 0.76 | 0.73 | 1.03 | 1.03 | 1.05 | 1.01 |
| 甘肃 | 0.65 | 0.61 | 0.58 | 0.56 | 0.60 | 0.57 | 0.58 | 0.56 |
| 广东 | 0.91 | 1.08 | 1.05 | 1.03 | 1.03 | 1.02 | 1.04 | 1.09 |
| 广西 | 0.31 | 0.54 | 0.57 | 0.55 | 0.60 | 0.59 | 0.65 | 0.69 |
| 贵州 | 0.39 | 0.60 | 0.58 | 0.55 | 0.59 | 0.52 | 0.57 | 0.58 |
| 海南 | 0.44 | 0.54 | 1.02 | 1.07 | 1.09 | 0.52 | 0.79 | 0.90 |
| 河北 | 0.64 | 0.62 | 0.63 | 0.61 | 0.65 | 0.64 | 0.62 | 1.01 |
| 河南 | 0.65 | 0.63 | 0.62 | 0.64 | 0.82 | 0.63 | 0.76 | 0.75 |
| 黑龙江 | 0.63 | 0.81 | 0.57 | 0.52 | 0.51 | 0.48 | 0.50 | 0.68 |
| 湖北 | 0.65 | 0.61 | 0.60 | 0.61 | 0.62 | 0.72 | 0.93 | 0.99 |
| 湖南 | 0.46 | 0.58 | 0.60 | 0.61 | 0.62 | 0.63 | 0.63 | 0.69 |
| 吉林 | 0.67 | 0.66 | 0.62 | 0.65 | 1.03 | 1.01 | 1.00 | 1.02 |
| 江苏 | 0.75 | 1.04 | 1.04 | 1.30 | 1.02 | 1.03 | 0.75 | 0.86 |
| 江西 | 0.42 | 0.60 | 0.60 | 0.61 | 0.64 | 0.63 | 0.66 | 0.73 |
| 辽宁 | 0.50 | 0.62 | 0.60 | 0.60 | 0.62 | 0.60 | 0.61 | 0.93 |
| 内蒙古 | 0.42 | 0.61 | 0.62 | 0.60 | 0.66 | 0.58 | 0.60 | 0.82 |
| 宁夏 | 0.57 | 0.58 | 0.56 | 0.53 | 0.57 | 0.57 | 0.57 | 0.58 |
| 青海 | 0.43 | 0.60 | 0.57 | 0.54 | 0.60 | 0.53 | 0.58 | 0.79 |
| 山东 | 0.63 | 1.00 | 1.03 | 1.01 | 1.01 | 0.71 | 0.96 | 0.11 |
| 山西 | 0.59 | 0.59 | 0.53 | 0.52 | 0.56 | 0.53 | 0.54 | 0.83 |
| 陕西 | 0.62 | 0.58 | 0.58 | 0.56 | 0.58 | 0.56 | 0.60 | 0.70 |
| 上海 | 0.75 | 1.06 | 1.02 | 1.00 | 1.14 | 0.70 | 0.69 | 0.61 |
| 四川 | 0.59 | 0.59 | 0.60 | 0.62 | 0.84 | 0.65 | 1.06 | 1.04 |
| 天津 | 0.81 | 1.04 | 1.02 | 1.03 | 1.03 | 1.17 | 1.25 | 1.22 |
| 新疆 | 0.34 | 0.57 | 0.57 | 0.51 | 0.51 | 0.35 | 0.36 | 0.33 |
| 云南 | 0.43 | 0.61 | 0.63 | 0.59 | 0.65 | 0.56 | 0.56 | 0.54 |
| 浙江 | 0.62 | 0.88 | 1.01 | 0.80 | 1.05 | 0.70 | 0.66 | 0.59 |
| 重庆 | 0.41 | 0.58 | 0.57 | 0.59 | 0.62 | 0.65 | 0.72 | 1.02 |
| 均值 | 0.58 | 0.71 | 0.72 | 0.71 | 0.78 | 0.69 | 0.75 | 0.80 |
新窗口打开|下载CSV
3.2 空间演变特征
依托ArcGIS 10.2软件计算中国制造业全要素生产率的空间分布重心及标准差椭圆相关属性(表2、表3),选取2002年、2007年、2012年、2016年4个特征时点绘制中国制造业全要素生产率的重心移动轨迹和标准差椭圆分布图(图2、图3)。Tab. 2
表2
表22002—2016年中国制造业全要素生产率重心移动方向和距离参数
Tab. 2
| 年份 | 重心坐标 | 移动 方向 | 移动距离(km) | 东西向距离(km) | 南北向距离(km) | 移动速度(km/a) | 东西向速度(km/a) | 南北向速度(km/a) |
|---|---|---|---|---|---|---|---|---|
| 2002 | 34.21°N, 113.22°E | |||||||
| 2007 | 33.38°N, 113.09°E | 西偏南 | 91.54 | 3.09 | 91.49 | 18.31 | 0.62 | 18.30 |
| 2012 | 33.75°N, 113.34°E | 东偏北 | 47.16 | 19.47 | 42.95 | 9.43 | 3.89 | 8.59 |
| 2016 | 33.79°N, 112.86°E | 西偏北 | 44.34 | 44.34 | 0.17 | 8.87 | 8.87 | 0.03 |
新窗口打开|下载CSV
Tab. 3
表3
表32002—2016年中国制造业全要素生产率空间分布的标准差椭圆参数
Tab. 3
| 参数 | 2002 | 2007 | 2012 | 2016 |
|---|---|---|---|---|
| 转角(°) | 27.07 | 20.54 | 25.21 | 23.8 |
| 沿x轴标准差(km) | 925.64 | 966.75 | 899.88 | 877.21 |
| 沿y轴标准差(km) | 1123.37 | 1149.68 | 1130.22 | 1172.59 |
新窗口打开|下载CSV
图2
 新窗口打开|下载原图ZIP|生成PPT
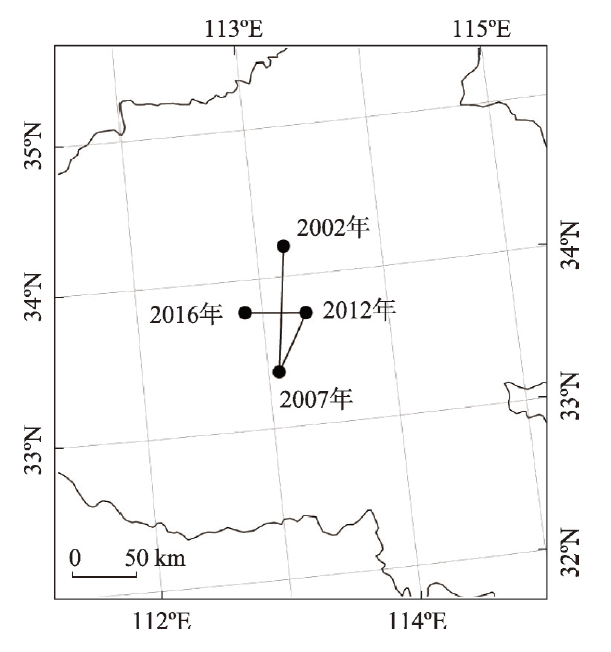
图2中国制造业全要素生产率重心移动轨迹
Fig. 2The moving trajectories of the gravity center of TFP in China's manufacturing industry
图3
 新窗口打开|下载原图ZIP|生成PPT
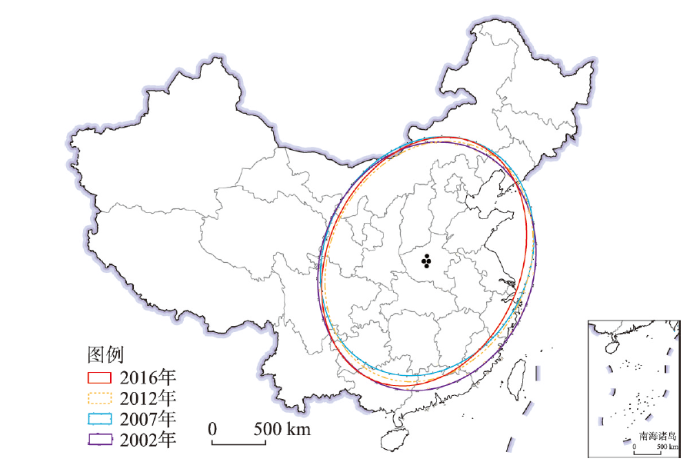
图32002—2016年中国制造业全要素生产率空间分布的标准差椭圆
注:基于自然资源部标准地图服务网站GS(2019)1825号标准地图制作,底图边界无修改。
Fig. 3Standard deviation ellipse of the spatial distribution of the TFP in China's manufacturing industry
3.2.1 重心移动轨迹 2002—2016年间中国制造业全要素生产率重心在33.38°N~34.21°N、112.86°E~113.34°E之间变动,均分布在河南境内,整体呈“西南—东北—西北”的变化格局,重心移动距离和速度呈逐渐缩小的态势(表2、图2)。具体来看,2002—2007年重心的移动距离和速度最大,分别为91.54 km、18.31 km/a,其中重心南移速度与重心整体移动速度几乎相同。此时期,经济发展基础较好的江苏、浙江等华东、华中地区更好地推行国际化战略,通过与国外合作获得了先进的知识技术和管理经验,制造业全要素生产率得到较快提升,而北部地区偏重型的制造业产业体系在结构转型、技术升级等方面面临诸多困难,全要素生产率增速较慢,导致中国制造业全要素生产率的重心快速向南移动。2007—2012年重心的移动距离和速度有所降低,分别缩小至47.16 km、9.43 km/a,主要归结于南北方向上移动速度的减小。随着东北振兴战略的深入实施,国家层面实施的东北地区重要财税和金融政策效应不断释放,税费优惠和投资计划的增加促使辽宁、吉林等省市制造业产业结构调整加快,全要素生产率实现较快增长,导致中国制造业全要素生产率重心向东北移动,而全球金融危机背景下的中国整体制造业全要素生产率增速放缓是重心移动速度逐渐缩小的主要原因。2012—2016年,中国把加强生态环境保护作为“十二五”时期实施西部大开发战略的重要切入点,严格实行污染物总量排放控制,西北地区制造业废水、废气、废物等污染物总量大幅减少,绿色发展能力大幅提高。同时,西北地区承接东部、中部地区制造业转移的技术溢出效果明显,技术创新和转化应用能力得到显著增强,全要素生产率快速提升,致使中国制造业全要素生产率重心向西北移动。
3.2.2 标准差椭圆分析 制造业全要素生产率标准差椭圆主要位于中国中东部地区,空间分布格局由偏东北—偏西南方向向正北—正南方向不断偏移,覆盖范围逐渐缩小,表明中国制造业全要素生产率空间分布趋于集中(表3、图3)。从转角来看,标准差椭圆转角呈“缩小—增大—再缩小”的趋势。2002—2007年转角由2002年的27.07°缩小至2007年的20.54°,表明制造业全要素生产率的空间分布格局由偏东北—偏西南向正北—正南偏转了6.53°;2007—2012年转角增至25.21°,表明制造业全要素生产率空间分布格局向东北—西南偏转了4.67°;2012—2016年转角减小的幅度较小,制造业全要素生产率空间分布格局基本保持稳定。从主轴长度来看,主轴经历了“延伸—缩短—再延伸”的过程,由2002年的1123.37 km延伸至2016年的1172.59 km,表明制造业全要素生产率在主轴方向的空间分布经历了先极化再分散的演变。从辅轴的长度来看,辅轴经历了“延伸—缩短”的过程,表明制造业全要素生产率在辅轴方向上的空间分布经历了先分散再极化的演变。整体来看,中国制造业全要素生产率在偏东北—偏西南方向的空间分布趋于分散,在偏东南—偏西北方向的空间分布趋于极化。
3.3 空间相关性分析
利用Geoda软件计算2002—2016年中国制造业全要素生产率的Moran's I指数(表4)。由表4可知,2002—2016年中国制造业全要素生产率的全局Moran's I指数均大于0,说明中国制造业全要素生产率存在较强的空间正相关关系,某省市的制造业全要素生产率不但会影响其周围省市,也会受周围邻近省市的影响,表现出相似值之间的空间集聚。从变化趋势来看,全局Moran's I指数值呈现“低—高—低”的走势,在2007年达到0.475的峰值,随后呈波动下降趋势,下降至0.082,表明中国制造业全要素生产率在2007年表现出较强的空间集聚特征,而2007年后制造业全要素生产率的省际联系逐渐减弱。Tab. 4
表4
表42002—2016年中国制造业全要素生产率Moran's I指数
Tab. 4
| 年份 | Moran's I | P值 | 年份 | Moran's I | P值 | 年份 | Moran's I | P值 |
|---|---|---|---|---|---|---|---|---|
| 2002 | 0.305 | 0.008 | 2007 | 0.475 | 0.001 | 2012 | 0.278 | 0.016 |
| 2003 | 0.376 | 0.008 | 2008 | 0.434 | 0.002 | 2013 | 0.312 | 0.009 |
| 2004 | 0.376 | 0.005 | 2009 | 0.276 | 0.018 | 2014 | 0.129 | 0.102 |
| 2005 | 0.454 | 0.001 | 2010 | 0.387 | 0.003 | 2015 | 0.225 | 0.008 |
| 2006 | 0.449 | 0.001 | 2011 | 0.215 | 0.042 | 2016 | 0.082 | 0.143 |
新窗口打开|下载CSV
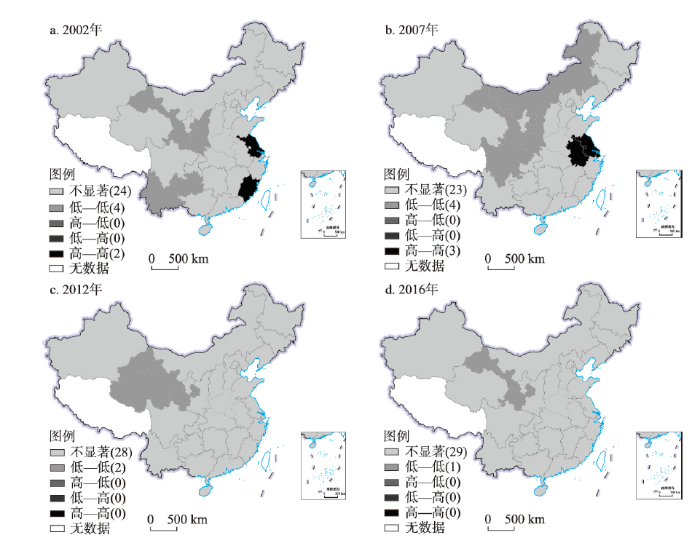
同时,对2002年、2007年、2012年和2016年中国30个省市制造业全要素生产率进行局部空间自相关检验,并绘制局部自相关LISA图(图4)。由图4可知,中国制造业全要素生产率的局域空间集聚特征明显,总体以高—高集聚和低—低集聚类型为主,高—高集聚区主要集中于江苏、上海等华东地区,低—低集聚区主要集中于陕西、甘肃、四川等西北、西南地区,呈先增后缩的空间分布趋势。2002年中国大部分省市制造业全要素生产率局域空间集聚性不显著,仅江苏和福建是高—高集聚区,甘肃、陕西、贵州和云南是低—低集聚区;2007年江苏、上海制造业的先进技术和管理方式通过辐射涓滴效应带动了邻近省市安徽的发展,高—高集聚区呈由沿海向内陆扩展趋势。低—低集聚区的空间集聚特征有所增强,向北扩大到内蒙古等华北地区,这主要是因为在复杂地理条件的制约下,内蒙古等省市制造业创新发展的要素瓶颈约束效应明显,且受河北、北京及沿海省市对人才、技术等要素的极化效应影响,削弱了其制造业发展能力;2012年高—高集聚区消失,低—低集聚区呈向西扩展趋势,但整体范围有所缩减,仅甘肃和青海属于低—低集聚区;2016年低—低集聚区的空间分布范围进一步收缩,仅甘肃为低—低集聚区,表现出较强的空间稳定性特征,这与甘肃相对滞后的制造业发展水平存在密切关系。
图4
 新窗口打开|下载原图ZIP|生成PPT
图42002—2016年中国制造业全要素生产率的LISA集聚图
注:基于自然资源部标准地图服务网站GS(2019)1825号标准地图制作,底图边界无修改。
Fig. 4LISA cluster map of TFP in China's manufacturing industry from 2002 to 2016
4 影响因素分析
4.1 变量选择
为充分考察制造业全要素生产率各影响因素的空间异质性问题,在遵循可得性、可比性、可量化原则的前提下,本文选取对外开放、产业集聚、交通基础设施、金融发展和信息化水平5个因子作为解释变量。① 对外开放。对外开放程度高的地区能有效引进外资,加强区域内外经济联系,为地区制造业发展带来先进生产技术、管理经验等其他资源[43]。本文采用地区外商直接投资额占地区生产总值的比重表征各省市的对外开放程度。② 产业集聚。产业集聚可加强集聚区内制造业企业的良性竞争,促进技术革新。此外,产业集聚的知识溢出效应有利于技术、人才等要素的流通,提升制造业整体的技术水平。参考相关文献[44],采用区位熵表征制造业产业集聚情况。③ 交通基础设施。完善的交通基础设施可增强市场可达性,弱化区域市场分割,有效降低要素流通成本,提高要素资源的配置效率,进而作用于制造业全要素生产率。参考刘钜强关于交通基础设施与制造业区位的研究[26],采用每平方米公路里程数表征各省市的交通基础设施发展水平。④ 金融发展。完善的金融体系可降低企业的融资、投资与风险成本,提高企业管理效率。同时,金融也可为创新技术的研发、产业化提供重要支撑[45]。本文选取金融业增加值占地区生产总值的比重表征各省市的金融发展水平。⑤ 信息化水平。信息技术使信息传递方式变得扁平,有利于缩短信息传递时间,降低信息、技术交流成本,加快企业组织决策速度,加强市场变化应对能力,进而作用于制造业全要素生产率[46]。借鉴陆大道的相关研究[47],选用电信业务收入占地区生产总值的比重表征该地区的信息化发展水平。4.2 GWR模型评估
4.2.1 共线性检验 进行线性回归前,需要对各变量进行共线性检验,避免发生多重共线问题。通过检验,发现各影响因素的VIF值均小于10(表5),不存在多重共线性的问题,达到回归分析基本要求。Tab. 5
表5
表5影响因子VIF值
Tab. 5
| 变量 | 对外开放 | 产业集聚 | 交通基础设施 | 金融发展 | 信息化水平 |
|---|---|---|---|---|---|
| VIF值 | 1.206 | 1.060 | 1.783 | 1.401 | 1.212 |
新窗口打开|下载CSV
4.2.2 拟合优度检验 由表6可知,2002年、2016年GWR模型的校正模型拟合优度(调整R2)分别为0.38和0.20,均高于2002年、2016年OLS模型的模型拟合优度的0.35和0.08,说明GWR模型的拟合效果显著优于OLS模型。
Tab. 6
表6
表6OLS模型与GWR模型拟合优度结果
Tab. 6
| 模型 | 2002年 | 2016年 | |||
|---|---|---|---|---|---|
| 参数 | R2 | 调整R2 | R2 | 调整R2 | |
| OLS | 0.46 | 0.35 | 0.24 | 0.08 | |
| GWR | 0.52 | 0.38 | 0.36 | 0.20 | |
新窗口打开|下载CSV
4.3 结果分析
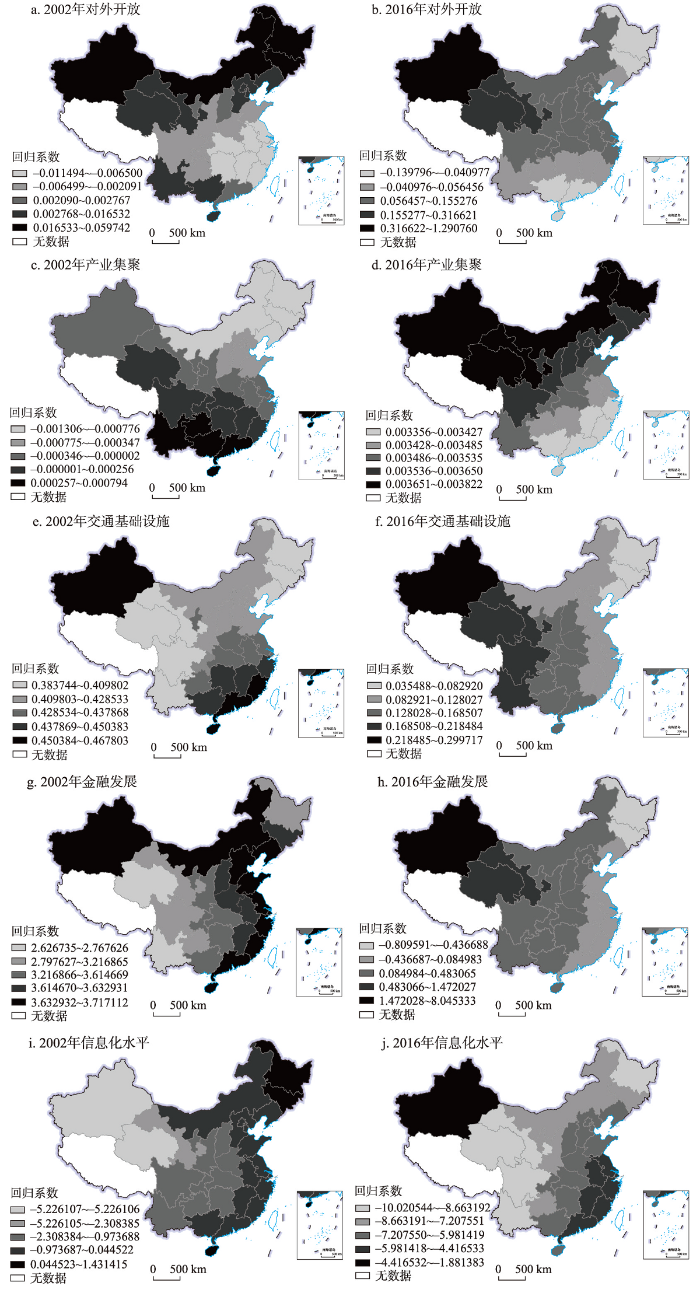
将GWR模型的计算结果借助GIS平台进行可视化表达,从而更直观地对制造业全要素生产率的影响因素进行空间异质性分析(图5)。由图5可知,各影响因素对制造业全要素生产率的作用具有明显的空间异质性特征,金融发展是制造业全要素生产率增长的主要因素,对外开放、产业集聚与交通基础设施也发挥了重要支撑作用,信息化水平阻碍了制造业全要素生产率的提高。图5
 新窗口打开|下载原图ZIP|生成PPT
图52002年和2016年中国制造业全要素生产率影响因素回归系数空间分布
注:基于自然资源部标准地图服务网站GS(2019)1825号标准地图制作,底图边界无修改。
Fig. 5Spatial distribution of regression coefficients of influencing factors of the TFP in China's manufacturing industry in 2002 and 2016
(1)对外开放对制造业全要素生产率的影响。2002年对外开放回归系数自西北向东南依次递减(图5a),2016年其空间格局无明显变化(图5b),回归系数高值区主要集中在新疆、青海等西北地区,表明对外开放对中国西北地区制造业全要素生产率的影响程度明显大于其他地区。这主要是因为,受资源要素约束和经济发展限制,青海等西北地区制造业全要素生产率较低,提升空间较大,外商直接投资带来的先进技术、管理经验和高技术含量中间产品对其制造业全要素生产率提高的促进作用相较于其他地区更为显著。值得注意的是,2016年回归系数低值区主要集中在黑龙江、吉林等中国东北地区,这主要是因为黑龙江、吉林等省市以从事加工、组装等价值链低端环节的劳动密集型制造业为主,从长期来看外商直接投资并未产生良好的投资效应,反而因跨国企业对核心技术的保护与封锁产生了明显的负面竞争效应,加剧了东北地区制造业内部同行业的竞争,导致了低端产能过剩和要素配置效率缺失,阻碍了制造业全要素生产率的提高。
(2)产业集聚对制造业全要素生产率的影响。2002年产业集聚的回归系数由东北向西南梯次增大(图5c),表明产业集聚对中国制造业全要素生产率的影响程度由东北向西南逐渐增强;2016年产业集聚对中国制造业全要素生产率的影响程度逐渐增强,其空间分布格局发生较大变化,呈由南向北递增的趋势(图5d)。从正值区数量来看,产业集聚回归系数正值区数量有所增加,表明产业集聚水平的提升有利于中国制造业全要素生产率的改善。2002年东北地区相邻省市制造业产业结构雷同程度高,以消耗煤炭资源的重型化冶炼工业为主,污染物排放量较多,产业集聚规模扩大加剧了环境污染,具体表现为产业集聚回归系数在东北地区为负。2016年内蒙古等北部地区加速承接东部沿海地区产业转移,不同类型的产业集聚加强了制造业企业间的联系,推动信息服务和劳动力市场信息共享,进而促进了制造业全要素生产率的提高。浙江等东部沿海省市凭借优越的区位优势和政策环境,吸引了大量制造业企业集聚,导致其产业集聚规模在研究末期逐渐接近市场容量限制和环境承载能力,增加了本土化市场竞争和地租等生产成本,对制造业全要素生产率的正向促进作用相对较弱。
(3)交通基础设施对制造业全要素生产率的影响。2002—2016年交通基础设施对制造业全要素生产率的正向促进作用逐渐减弱,空间分布格局由南高北低逐渐向西高东低演变。2002年交通基础设施回归系数总体表现为由东南向西北梯次递减的趋势(图5e),与中国制造业全要素生产率东南高西北低的空间分布格局基本吻合,表明交通基础设施的发展差异是导致制造业全要素生产率区域差异的原因之一。产业发展依托于交通基础设施[48],完善的交通基础设施可降低企业运输成本、交易成本、库存成本,进而提高制造业全要素生产率。新疆得益于国家对交通基础设施建设的直接投资,顺利完成多条国道新建和改建任务,交通基础设施规模和路网等级提升,吸引更多要素集聚,促进了制造业全要素生产率的提高,成为交通基础设施回归系数高值区。2016年回归系数空间分布格局发生较大变化,呈由西向东递减趋势,高值区主要分布在青海等中国西部地区(图5f)。这主要是因为中国西部地区制造业以中低技术的矿产资源深加工行业为主,呈明显的原料型特征,依赖交通基础设施提供的原材料运输服务,对交通基础设施完善带来的成本效应更为敏感,具体表现为交通基础设施对其制造业全要素生产率的正向促进作用相对较强。
(4)金融发展对制造业全要素生产率的影响。2002年金融发展回归系数高值区主要分布在东南沿海省市,总体表现为东南沿海地区大于内陆地区(图5g)。江苏等东部沿海省市金融发展的本底条件良好,金融发展水平远高于全国平均水平,优越的融资环境和营商环境缓解了制造业企业投融资约束,促进了企业的投入式创新行为,进而对制造业全要素生产率产生了更多积极影响;2016年这种趋势有所变化,总体表现为由西北向东南梯次递减的趋势(图5h),表明金融发展对中国西北地区的制造业全要素生产率的影响程度大于其他地区。从正值区数量来看,2002—2016年间回归系数正值区数量有所减少,负值区主要分布在黑龙江、吉林等东北地区省市。这主要是因为黑龙江、吉林等省市金融业与制造业企业并未形成长期稳定的均衡发展关系,金融机构信用贷款倾向于流向更受国家政策青睐但全要素生产率偏低的国有制造业企业,而全要素生产率较高的民营制造业企业无法获得资源优化配置所需的金融资源,造成金融资源错配与浪费,最终导致制造业全要素生产率的损失。因此,东北地区应加快金融供给侧结构性改革,根据效率原则合理配置信贷资金,强化金融业对实体经济的服务作用,促进制造业全要素生产率的提升。
(5)信息化水平对制造业全要素生产率的影响。2002年信息化水平的回归系数自东向西逐渐减小(图5i),表明研究初期信息化水平对东部地区制造业全要素生产率的影响力要大于西部地区;2016年回归系数的空间分布无明显变化,但从正值区数量来看,正值区数量明显减少(图5j),表明信息化水平并没有进一步推动制造业企业发展,反而阻碍了制造业全要素生产率的提高,这也说明单纯提高信息化水平并不是提升制造业全要素生产率的有效手段。信息化对制造业发展而言既是机遇也是挑战,在为制造业企业拓宽信息获取渠道和降低信息获取门槛的同时,也会因信息透明化导致资源挤占和创新收益被无创新贡献群体攫取,对制造业原始创新企业的创新行为产生负向激励,进而阻碍全要素生产率的提高。因此,推动信息化与制造业的深度融合,实现信息化与制造业发展的良性互动,消除信息化对制造业转型升级的负面影响,是新时期中国提高制造业全要素生产率、实现制造业高质量发展的关键。
5 结论与讨论
5.1 结论
本文运用超效率SBM、标准差椭圆、空间自相关等方法,定量评估了2002—2016年中国制造业全要素生产率及其时空演变特征,并使用GWR模型定量分析了制造业全要素生产率的影响因素,结论如下:(1)时序演化特征分析发现,2002—2016年中国制造业全要素生产率整体呈波动上升趋势,并表现出明显的阶段性变化特征。从宏观层面上看,国家发展战略导向和国内外市场环境的改变是中国制造业全要素生产率阶段性变化的主要原因。
(2)重心移动轨迹和标准差椭圆分析发现,2002—2016年中国制造业全要素生产率的重心在33.38°N~34.21°N、112.86°E~113.34°E之间移动,整体呈“西南—东北—西北”的变化格局,移动距离和速度逐渐缩小;标准差椭圆主要位于中国中东部地区,转角呈“缩小—增大—再缩小”的趋势,由偏东北—偏西南方向向正北—正南方向不断偏移,在偏东北—偏西南方向的空间分布趋于分散,在偏东南—偏西北方向的空间分布趋于极化。
(3)全局空间自相关分析发现,中国制造业全要素生产率存在较强的空间正相关关系,但省际联系逐渐减弱。局部空间自相关分析发现,中国制造业全要素生产率局域空间集聚特征明显,总体以高—高集聚和低—低集聚类型为主,高—高集聚区主要集中于江苏、上海等华东地区,低—低集聚区主要集中于陕西、甘肃、四川等地区。
(4)影响因素分析发现,金融发展是制造业全要素生产率提高的主要因素,对外开放、产业集聚与交通基础设施也发挥了重要支撑作用,由此加快金融供给侧结构性改革、深化对外开放、提高产业聚集水平、完善交通基础设施可有效促进制造业全要素生产率的提高。信息化水平对制造业全要素生产率提高的阻碍作用,反映出信息化与制造业全要素生产率之间作用机制的复杂性特征和实现信息化与制造业深度融合的必要性。
5.2 讨论
本文在地理学“格局—过程—机理”的研究范式下,将创新投入、非期望产出纳入制造业全要素生产率测度模型,构建制造业全要素生产率变化的理论框架,探究中国制造业全要素生产率时空演变特征及影响因素,剖析影响因素的空间异质性,为解决制造业高质量发展问题、实现区域制造业高质量协同发展提供了一个新的研究范式,为地理学视角下制造业全要素生产率时空特征和影响因素的进一步研究奠定了基础。但受数据所限,本文研究时序为2002—2016年,无法揭示更长时间尺度中国制造业全要素生产率发展的规律性特征。因此,长时间序列的市级层面制造业全要素生产率的精细化研究及发展趋势模拟预测将是下一步的研究重点。参考文献 原文顺序
文献年度倒序
文中引用次数倒序
被引期刊影响因子
DOI:10.11821/dlxb202104016 [本文引用: 1]

In order to promote the formation of a regional economic location with complementary advantages and high-quality development, it is necessary to examine the spatial pattern of Chinese industry from the perspective of industrial relatedness. Agglomeration is a common spatial pattern of industry. We construct two indices by combining coagglomeration and input-output linkages to analyze spatial relatedness. The first index is used to measure relatedness of agglomerated industries (hereafter ACX index). The second index is used to measure agglomeration of related industries (hereafter CXI index). Then, we use two-digit data from Chinese industrial enterprises database and measure the proposed indices to answer the following 2 questions: (1) whether the spatial relatedness is different at different spatial scales, and (2) what makes the difference in spatial relatedness. We find that more coagglomerations in a region do not mean that the ACX index is large. The ACX index of Chinese industry presents an inverted U-shaped distribution from 2003 to 2013. Comparing different spatial scales, we find that there is a positive correlation between the ACX index and size of the researched space, however, there is a negative correlation between ACX index and size of the basic unit. Comparing similar spatial scales, we find the ACX index is larger in city clusters and the Yangtze Economic Belt. These differences are mainly due to the existing regional governance system, the industrial composition of the region and external shocks. Different regions and industrial composition will evolve into different industrial spatial patterns. Therefore, it is necessary to create networks of cities and towns based on city clusters and the Yangtze River Economic Belt, so as to enhance industrial division and urban cooperation. In this way, the optimal regional economic location and coordinated regional development would be achieved.
[本文引用: 1]
DOI:10.11821/dlyj020181124 [本文引用: 1]
As the strategic core regions of national economic development, the urban agglomerations in the eastern coastal area of China has played a critical role in the implementation of innovation-driven development strategy and construction of the innovative country. Based on the dataset of innovation input and output spanning the 2001-2015 period, the SFA method and spatial Durbin model are applied to measure and examine the innovation efficiency and its influencing factors and spatial spillover effect in the five major urban agglomerations. Our results suggest that the innovation efficiency of five major urban agglomerations showed a steady increase over the studied period. Among the five urban agglomerations, the innovation efficiency in the Beijing-Tianjin-Hebei region rises slowly while that of Shandong Peninsula has increased relatively fast. The growth rate and average of innovation efficiency in the Yangtze River Delta fell behind the Shandong Peninsula and Beijing-Tianjin-Hebei region. Meanwhile, innovation efficiency in core cities of urban agglomerations is low, although they have high-input in innovation resources. Moreover, there is a significantly positive spatial spillover effect of innovation efficiency between cities in the five urban agglomerations. Economic development, agglomeration economies, FDI, the quality of labor force, the financial support by government, infrastructure, secondary industrial ratio and high-tech industries have direct and indirect effects on innovation efficiency in the urban agglomerations.
[本文引用: 1]
DOI:10.1257/aer.103.6.2169URL [本文引用: 1]
DOI:10.2307/2946695URL [本文引用: 1]
DOI:10.1162/003355300555024URL [本文引用: 1]
DOI:10.1257/aer.20121266URL [本文引用: 1]
DOI:10.1016/j.jdeveco.2011.02.002URL [本文引用: 1]
[本文引用: 1]
[本文引用: 1]
[本文引用: 1]
[本文引用: 1]
[本文引用: 1]
[本文引用: 1]
[本文引用: 1]
[本文引用: 1]
[本文引用: 2]
[本文引用: 2]
[本文引用: 2]
[本文引用: 2]
[本文引用: 1]
[本文引用: 1]
[本文引用: 1]
[本文引用: 1]
[本文引用: 1]
[本文引用: 1]
[本文引用: 1]
[本文引用: 1]
[本文引用: 1]
[本文引用: 1]
DOI:10.11821/dlyj201808007 [本文引用: 1]
The optimization of the industrial structure and its coordination with the spatial structures are the two present core issues that need to be solved urgently in the restructuring of China's manufacturing industry. Based on the above scale enterprise data, this paper employs the up-grade (UPG) index of industrial structure and GIS tools to investigate the spatial-temporal patterns of UPG index of China's manufacturing from 1998 to 2013 at a multi-scale. Then it further explores the influencing factors of UPG index at the prefecture level by comparing the OLS regression and spatial regression model. The research shows that: on the national scale, with the manufacturing output increasing by 10.67 times, the UPG index increased from 5.987 to 6.225, but declined slightly after the 2008 financial crisis. On the regional scale, the UPG index has decreased successively in accordance with the eastern, the northeastern, the western, the central parts of the country. The UPG index of northeastern region has decreased sharply since 2003, while this index in central and western regions has kept the bottom position during the study period and experienced a slight decline. On the provincial scale, the UPG index in the municipalities and eastern coastal provinces are relatively high and growing faster while that in the central and western regions, especially in most frontier provinces, are relatively low and growing slowly, or even declining. On the prefecture scale, the hot-spot of UPG index is in the transition from the traditional industrial city to the eastern coastal city, which has gradually formed a core-periphery mode orientated by the center of the Yangtze River Delta. The increase of labor wage is the main driving force of the promotion of the UPG index at the prefecture level while the effects of innovation and manufacturing scale decrease gradually. The consumption level and development zones play a significant role in improving the UPG index in the later stage. The agglomeration of FDI has generally restrained the improvement of the UPG index, and the role of the three urban agglomerations in coastal regions is not significant in increasing the UPG index.
[本文引用: 1]
[本文引用: 1]
[本文引用: 1]
DOI:10.11821/dlxb201602006 [本文引用: 1]
<p>Industry-university-research institute collaborative innovation process and its spatial structures attract the interest of researchers in many fields. With the rise of emerging economies and their technological upgrading, their spatial structure of innovation network is developing into an important research topic. And China, in particular, provides the opportunity to study the evolution of such network structures. With the help of some sophisticated data analysis software like SPSS, UCINET and ArcGIS, this paper discusses the above-mentioned issues based on graphical analysis and an empirical analysis of co-inventor networks of China's equipment manufacturing industry using patent data issued by the State Intellectual Property Office of P.R.China from 1985 to 2012. We reached three conclusions about the structural evolution of the industry-university-research institute collaborative innovation network of Chinese equipment manufacture industry. Firstly, our systematic examination has identified a rapid growth of patents and significant changes of actor composition from 1985 to 2012, which shows the rise of privately owned enterprises and universities around 2000, with universities standing out as the most significant and strongest actors in the process of building innovation networks, while state-owned enterprises only dominate some specific fields. Secondly, city-level is the major geographical scale of industry-university-research institute collaboration in developed cities; while undeveloped cities tend to cooperate with competent ones at provincial or national level. It is mainly because concentration of universities and firms with strong innovative ability makes it easy to find the perfect local partner, while weaker actors have to look for the best innovation partners across city boundaries. Last but not least, political decisions concerning R&D investment supported by provincial governments have a positive influence on interprovincial innovation activities. Meanwhile, the spatial political bias in China can lead to the hierarchical structure of Chinese innovation networks, which shows the significance of municipalities and provincial capital like Peking, Shanghai and Guangzhou.</p>
[本文引用: 1]
[本文引用: 1]
[本文引用: 1]
[本文引用: 1]
[本文引用: 1]
DOI:10.2307/2951599URL [本文引用: 1]
[本文引用: 1]
[本文引用: 1]
[本文引用: 2]
[本文引用: 2]
DOI:10.1002/bs.3830070206URL [本文引用: 1]
DOI:10.1016/S0377-2217(99)00407-5URL [本文引用: 2]
DOI:10.11821/dlxb202005010 [本文引用: 1]
Water shortage, which can greatly affect both natural systems and social development, has drawn extensive attention from governing authorities around the world, and become an urgent issue to be addressed. How to improve the green efficiency of water resources and alleviate the present situation of water shortage is the content of this study. In the concept of "people-oriented" green development, the evaluation system of green efficiency is constructed, which includes four aspects: nature, social economy, environment, science and technology. This paper, based on the panel data of 31 provincial-level regions of China obtained from 2000 to 2016, aims to calculate the green efficiency of water resources by applying the Super-efficiency SBM model, to analyze its spatial correlation pattern, and to explore the driving mechanism of green efficiency of water resources by making use of the geographical weighted regression (GWR) model. The results show that there was ignificant positive spatial correlation and uneven spatial distribution of the green efficiency of water resources in China. Compared with the OLS model (the regression coefficient obtained by the model just represents the average characteristics of the overall green efficiency of water resources), the GWR model proves that there were spatial differences in the influence of various factors on the green efficiency of water resources. Generally speaking, industrial structure, industrial and agricultural development level, transportation infrastructure construction, environmental protection investment and science and technology conversion rate had a positive effect on the green efficiency of water resources, while the factors, including per capita water resources, population size and pollutant emissions, had a restraining influence. Social factors and environmental factors had a particularly obvious effect on the green efficiency of water resources. In addition, due to the large potential of the technology market turnover, the regions should step up efforts to increase investment of scientific research and focus on the transformation of scientific research results so as to make technology a new growth pole of green efficiency of water resources. In terms of spatial differences, water endowment and population size had significant impact on the green efficiency of water resources in the western region, and industrial structure, water utilization structure and transportation infrastructure posed a positive effect in the eastern region. This study is of great practical significance to solve water shortage and to formulate relevant policies suitable for the development of all regions.
[本文引用: 1]
DOI:10.11821/dlxb202006016 [本文引用: 1]
Climate change caused by CO2 emissions has become an environmental issue globally in recent years, and improving carbon emission performance is an important way to reduce carbon emissions. Although some scholars have discussed the carbon emission performance at the national scale and industry level, literature lacks studies at the city- level due to a limited availability of statistics on energy consumptions. In this study, based on China's city-level remote sensing carbon emissions from 1992 to 2013, we used the super-efficiency SBM model to measure the urban carbon emission performance, and the traditional Markov probability transfer matrix and spatial Markov probability transfer matrix are constructed to explore the spatio-temporal dynamic evolution characteristics of urban carbon emission performance in China for the first time and to predict its long-term evolution trend. The study shows that urban carbon emission performance in China presents a trend of steady increase in the fluctuation, but the overall level is still at a low level, so there is still a great improvement space in urban carbon emission performance, with huge potential for energy conservation and emission reduction. The spatial pattern of national urban carbon emission performance shows the characteristics of "high in the south and low in the north", and there is a significant difference in the level of carbon emission performance between cities. The spatial Markov probabilistic transfer matrix results show that the transfer of carbon emission performance type in Chinese cities is stable, thus it forms the "club convergence" phenomenon, and the geographical background plays an important role in the process of the transfer. From the perspective of long-term trend prediction, the future evolution of urban carbon emission performance in China is relatively optimistic. The carbon emission performance will gradually improve over time, and the distribution of carbon emission performance presents a trend of high concentration. Therefore, in the future, China should continue to strengthen research and development to improve the performance level of urban carbon emissions and achieve the national target of energy conservation and emission reduction. At the same time, neighboring cities with different geographical backgrounds should establish a sound linkage mechanism of economic cooperation to pursue coordinated development between economic growth, energy conservation and emission reduction, so as to realize low-carbon city construction and sustainable development.
[本文引用: 1]
DOI:10.1086/378532URL [本文引用: 1]
[本文引用: 1]
[本文引用: 1]
DOI:10.11821/dlxb202105017 [本文引用: 1]
Exploring the nonlinear effects and driving mechanism of multidimensional urbanization on PM2.5 concentrations is of great significance in the high-quality development of urban agglomerations. This paper uses inverse distance weighted spatial interpolation, spatial autocorrelation and standard deviational ellipse to analyze the spatiotemporal heterogeneity of PM2.5 concentrations in the Yangtze River Delta. It also applies the systematic dynamic panel regression model to explore the nonlinear effects and driving mechanism of multidimensional urbanization on PM2.5 concentrations based on the remote sensing images and statistical data of urban panels in the study area from 2000 to 2017. The main conclusions are as follows: (1) From 2000 to 2017, the pollution level caused by PM2.5 concentrations evolved from low to high. Overall, the PM2.5 concentrations showed a spatial trend of increasing from southeast to northwest. (2) The PM2.5 concentrations exhibited significant spatial agglomeration and correlation characteristics. Meanwhile, the centroid of the PM2.5 concentrations generally shifted from southeast to northwest, and the PM2.5 concentrations tended to be dispersed in the east-west direction, while in contrast they were gradually polarized in the north-south direction. (3) There were significant differences in the impact of different development stages of the urbanization subsystem on the PM2.5 concentrations. The economic urbanization exhibits an inverted N relationship with the PM2.5 concentrations, which indicates that an Environmental Kuznets Curve (EKC) existed between the economic urbanization and PM2.5 concentrations. When the per capita GDP exceeds RMB 63,709 yuan, economic urbanization will have a restraining effect on the PM2.5 concentrations. This illustrates the fact that the improvement of urban development quality and transformation of urban development methods are the key to controlling PM2.5 pollution. However, the relationship among population urbanization, land urbanization and PM2.5 concentrations is only the left part of the inverted U curve, which indicates that population urbanization and land urbanization are still at a certain distance from the inflection point of air quality improvement. Last but not least, the population size, foreign investment and industrial structure all have a significant positive effect on PM2.5 concentrations, while environmental regulations have a significant negative effect on PM2.5 concentrations. It is worth noting that the spatiotemporal heterogeneity of PM2.5 concentrations is formed under the interactive overlay and cycle accumulation of socioeconomic factors, government regulations, and other factors in this region. Among them, socioeconomic factors play a leading role. This paper provides a new research perspective to explore the effects of multidimensional urbanization on PM2.5 concentrations, so that we can achieve coordination between environmental protection and urban sustainable development in the Yangtze River Delta.
[本文引用: 1]
DOI:10.11821/dlxb201907008 [本文引用: 1]
Studies on spatial-temporal characteristics and influencing factors of flash floods are key contents to the assessment and management of flash flood. Based on the historic flash flood data in southwest China from 1960 to 2015, the spatial and temporal distribution of flash flood and its influencing factors were analyzed by using the linear regression model, standard deviation ellipse, spatial autocorrelation, and logistic regression model. The results show that: (1) The annual frequency of flash floods in southwest China shows an exponential growth trend, and the annual variation reveals a stable, slow and rapid increase fluctuation during 1960-1980, 1981-1998 and 1999-2015, respectively; the monthly characteristics are obvious and precipitation is mainly concentrated in June, July and August. (2) The obvious spatial difference of flash flood is observed in the study area, and the high-density areas are mainly concentrated in central Yunnan plateau, Sichuan Basin and their surrounding mountainous areas. The flash flood distribution has a significant spatial positive correlation and spatial agglomeration (Moran's I index is 0.127, Z = 5.784, P = 0.007). (3) The gravity center of historical disasters has a distinct trend of moving to the west during the year. The standard deviation ellipse angle gradually weakens, the long axis gradually lengthens, and the short axis gradually shortens. (4) Rainfall factors have the maximum impact on flash floods, followed by human activity factors, and the minimal is surface environmental factors. Among the rainfall factors, the one-hour rainfall has the strongest impact on flash floods, and its dominant ratio reached 3.654. The results can provide techinical support for research on forming mechanism, monitoring and early warning, and implementation of disaster prevention and mitigation measures of flash floods.
[本文引用: 1]
DOI:10.11821/dlxb202103006 [本文引用: 1]
Exploring the influence mechanism of expansion for urban areas on thermal environment is significant for improving urban ecological environment. In this study, nighttime light (NTL) can be regarded as an evidence of urban development. Based on Landsat remote sensing data, DMSP/OLS nighttime light data and NPP/VIIRS nighttime light data of Xiamen, Zhangzhou and Quanzhou in southern Fujian during 1996-2017, this study applied the overall coupling model and coordination model to discuss the spatio-temporal coupling and coordination relationship between urban development and land surface temperature (LST) distribution. Additionally, the spatial response law was analyzed by standard deviation ellipse, bivariate spatial autocorrelation and landscape index. The results show that during 1996-2017, the spatial distribution patterns of LST and NTL show that urban development is closely related with factors such as geographical location and terrain. In the western inland areas with high elevations, forests are obviously concentrated with relatively low LST, while in the eastern plain areas, more urban areas are distributed with relatively high LST. In the three cities, the overall coupling situation of NTL and LST is constantly strengthening, and the proportion of coordination for NTL and LST is gradually increasing. In the early stage of urban development, the influence of NTL on LST is hysteretic. In the late stage, the influence of NTL on LST is in advance. There is a positive correlation between NTL and LST, and a spatial spillover effect is obvious. The correlation coefficient and bivariate spatial autocorrelation Moran's I value gradually increase, indicating that NTL has an increasing influence on the change of LST. The HH (High-High)-type and LL (Low-Low)-type agglomeration areas continue to expand. Influenced by the trend of integrated development of the three study cities, HH-type agglomeration area is gradually concentrated in regions connecting the cities, such as Xiamen, Jinjiang, Shishi and central urban area of Zhangzhou. The influence of urban development on LST is related to the development condition of itself. Compared with Zhangzhou and Quanzhou, NTL has a more significant influence on the LST in Xiamen. The study results provide a scientific guidance for the optimization of thermal environment in the three cities of southern Fujian.
[本文引用: 1]
DOI:10.11821/dlxb202101016 [本文引用: 1]
The global environment issue resulting from carbon emissions has aroused worldwide concern for governments, the public and scientific communities. A precise measurement of the time-resolved and spatial distribution characteristics of carbon dioxide (CO2) and carbon footprint as well as its long-period evolution mechanism, can help clarify the relationship between environmental carbon load and economic growth, and are critical references to the formulation of scientific carbon emission reduction targets with reasonable and differential emission reduction policies. In this study, the mainland of China is taken as the research object. According to the quantitative correlations between DMSP-OLS nighttime light image data and carbon emission statistics, the carbon emission panel data model was simulated for China's carbon emissions in the period 2000-2013, and then the spatiotemporal evolving trend and spatial distribution characteristics of carbon emissions in the 14-year research period were discussed using Theil-Sen Median trend analysis and Mann-Kendall test method. Based on the framework of exploratory spatial-temporal data analysis (ESTDA), the spatial pattern and spatiotemporal dynamic evolution of carbon footprint from 2001 to 2013 were analyzed from the perspective of spatiotemporal interaction. In the three periods, the decoupling effect between environmental carbon load and economic growth of 336 prefecture-level cities were analyzed using the improved Tapio decoupling model. The results show that the overall carbon emissions in China had been on the rise from 2000 to 2013, in which the stable-slow rise type was dominant. China's carbon footprint and carbon deficit increased year by year, and the central and western regions became the focus of the growth of carbon footprint and carbon deficit from 2001 to 2013. At different administrative city scales, the spatial distribution pattern of carbon footprint and carbon deficit show obvious administrative orientated and spatial zonal differentiation characteristics. The annual average of global Moran's I index of each level unit is 0.491, which indicates that there is a significant spatial auto-correlation feature in the carbon footprint of China's prefecture-level units. The relative length of the LISA time path is greater in the north than in the south, and it tends to increase from the coastal areas to the central and western regions. The curvature of LISA time path decreases from coastal areas to inland areas on the whole. The curvature of northeast and central regions is higher, while that of eastern and western regions is lower. There is a different trend of the decoupling effect of environmental carbon load in China. Meanwhile the expansion-connection and expansion of negative decoupling regions continuously increased and spatially agglomerated, presenting an "E"-shaped distribution pattern from the north to the south. The national average decoupling elastic value is gradually increasing, while the coefficient of variation continues to decline, and the decoupling type has a significant evolution trend. Therefore, the unbalanced trend of economic growth and carbon emissions in China will continue for a certain period.
[本文引用: 1]
[本文引用: 1]
[本文引用: 1]
[本文引用: 1]
[本文引用: 1]
[本文引用: 1]
[本文引用: 1]
[本文引用: 1]
[本文引用: 1]
[本文引用: 1]
[本文引用: 1]
[本文引用: 1]
[本文引用: 1]
DOI:10.13249/j.cnki.sgs.2019.07.009 [本文引用: 1]
Improving urban eco-efficiency is the key to realize the construction of ecologically-civilized city, which also improve harmonious development of regional society, economy and ecology. In this article, we assessed the urban eco-efficiency with Stochastic Frontier Analysis (SFA) in China (not including data of Tibet, Hong Kong, Macao and Taiwan) during 2006-2013, then analyzed the spatio-temporal evolutionary characteristics of urban eco-efficiency by using Kernel density function, dynamic comparative of urban eco-efficiency of different scales in different economic zones also analyzed. Finally, the Tobit regression model was established, we discussed the impact of affecting factors on urban eco-efficiency based on different scales. The main results are as follows: 1) The mean value of urban eco-efficiency in China ranges from 0.807 6 and 0.838 2 during 2006-2013, high value areas present spatial agglomeration trend, the environment input factors such as sulphur dioxide emission, green house gas emission and solid wastes have negative effects; 2) China’s urban efficiency has a fluctuated dynamic change process, the mean eco-efficiency of various scales cities shows increasing tendency, the eco-efficiency of megacities improved fastest among various scales cities, urban eco-efficiency increasing returns to scale shows obvious, urban eco-efficiency becoming universal; 3) The effect of affecting factors on the urban eco-efficiency shows obviously scale difference, the large-scale cities have better economic foundations, industrial structure optimized continuously, an effective resource element allocation mechanism was formed gradually, therefore, there are few significant factors affecting ecological efficiency, however, the eco-efficiency of small-scale cities is more easily affected by various kinds of factors, therefore, it is necessary to take corresponding measures to improve the eco-efficiency of various scales cities.
[本文引用: 1]
DOI:10.13249/j.cnki.sgs.2020.09.010 [本文引用: 1]
Green development efficiency is an indicator that is tied to economic growth and environment and severs as a useful instrument for sustainability analysis. This article estimates green development efficiency of 37 counties in restricted development zone of Jilin during 2011–2015 using slack SBM-DEA model which takes consideration of undesirable output. Then this article goes on to determine whether industrial agglomeration promote or impede the enhancement of green development efficiency in restricted development zone of Jilin by Tobit model. The results show that: 1) The average green development efficiency ranges from 0.5654 to 0.6705 during 2011–2015, which is at the medium level lower, and are following an upward path. Significant spatial differences exist in the green development efficiency in Northeast China. There are 7 counties, such as Lishu, Yitong, Changling, Ganan, Fuyu, Fusong and Antu in the green development state, and most of the other counties and cities are in a state of green development efficiency loss. 2) A U-shaped nonlinear relationship exists between industrial agglomeration level and green development efficiency and the inflection point is 1.257. The results concerning the industrial agglomeration level and its squared value reveal that green development undergoes a process of falling first and then rising as the industrial agglomeration reaches a high level. While green development efficiency tends to fall during the low level of industrial agglomeration, there comes a turning point when green development efficiency begins to increase as the industrial agglomeration level increases. 3) Industrialization and environmental regulation have no significant impact on green development efficiency. Control factors, such as economic development, urbanization, industrial structure, population carrying capacity, have different degrees of impact on green development efficiency, passing the significance test within 10% level. Economic development level and industrial structure are positively related to green development efficiency, while urbanization level and population density are negatively related to green development efficiency. 4) According to the analysis of effects of industrial agglomeration on green development efficiency, some corresponding policy implications are proposed in this article. The restricted development zone in Jilin Province should achieve the goal of improving the efficiency of green development by promoting urbanization, adjusting industrial structure, transforming economic growth mode, and guiding population carrying capacity.
[本文引用: 1]
[本文引用: 1]
[本文引用: 1]
DOI:10.11821/xb201208006 [本文引用: 1]
The paper, using Malmquist index model, estimates China's economy efficiency and TFP (total factor productivity) during 1990-2009 years, and analyzes its affecting factors. The main result shows that China's TFP was fluctuant and fell at an annual rate of 1.35% in the past 20 years. According to the regional division, China can be divided into East, Middle, West, and Northeast regions, among which eastern region's TFP increased with an average of 2.37%, showing a promotion for the significant rise of technological progress efficiency. However, for the rest of China, the total factor productivity shows a decline in varying degrees, and the TFP for Middle, West and Northeast regions decreased by 4.45%, 2.78% and 1.84%, respectively; the TFP decline was due to the decline of technical efficiency, pure technical efficiency and scale efficiency in most years. The paper also finds that economic aggregation, human capital, information, infrastructure, open and institution are positive on total factor productivity, while industry, government intervention and land scale are negative on it. However, infrastructure is not significant in statistics. The key findings of the paper have important policy implications.
[本文引用: 1]
[本文引用: 1]
[本文引用: 1]
DOI:10.11821/dlxb202102014 [本文引用: 1]
Traffic facilities are important resources for the future sustainable development of old industrial areas. It is of great practical significance to evaluate and study the spatiotemporal differentiation laws and mechanisms of traffic dominance. A comprehensive evaluation method based on traffic network density, traffic trunk line influence degree, and location dominance was constructed to measure traffic dominance. Taking Northeast China as the case study, the influencing factors and mechanisms of the overall pattern of traffic dominance were analyzed through network analysis, multivariable linear regression and geographic weighted regression. The results show that: (1) The overall traffic dominance of Northeast China is on the rise, and its spatial distribution pattern takes Harbin-Dalian line as the axis and presents a "core-periphery" structure. (2) The spatial differentiation of the overall traffic dominance of the study area is obvious. Most of the high value areas are concentrated along the high-speed railways, while the low value areas are mainly distributed in the east of Inner Mongolia and the north of Heilongjiang. The spatial difference is increasing gradually. (3) The fast traffic mode contributes a lot to the traffic dominance of Northeast China, and the influence of population carrying capacity on the spatiotemporal differentiation of traffic dominance is gradually strengthened. Expanding the traffic trunk lines and increasing the number of traffic hubs will help to improve the traffic dominance of Northeast China.
[本文引用: 1]
