 ,1,3, 王少剑,2, 方创琳1,3
Spatiotemporal evolution and influencing mechanism of ecosystem service value in the Guangdong-Hong Kong-Macao Greater Bay Area
LIU Zhitao,1,3, WANG Shaojian,2, FANG Chuanglin1,3通讯作者:
收稿日期:2020-07-29修回日期:2021-04-24
| 基金资助: |
Received:2020-07-29Revised:2021-04-24
| Fund supported: |
作者简介 About authors
刘志涛(1997-), 男, 黑龙江黑河人, 博士, 中国地理学会会员(S110015667M), 研究方向为城市地理、城镇化及其生态环境效应。E-mail:

摘要
关键词:
Abstract
Keywords:
PDF (6475KB)元数据多维度评价相关文章导出EndNote|Ris|Bibtex收藏本文
本文引用格式
刘志涛, 王少剑, 方创琳. 粤港澳大湾区生态系统服务价值的时空演化及其影响机制. 地理学报, 2021, 76(11): 2797-2813 doi:10.11821/dlxb202111014
LIU Zhitao, WANG Shaojian, FANG Chuanglin.
1 引言
生态系统服务(Ecosystem Services)来源于直接或间接促进人类福祉的生态系统结构、功能或过程[1,2],是人类从生态系统中获得效益的统称[3]。自1992年联合国环境公署颁布《1972—1992年的世界环境状况报告》,给世界各国敲响环境保护的警钟;到2000年联合国将“确保环境的可持续能力”列为千年发展目标之一,生态保护逐渐成为世界各国的重要发展议题;再到2005年联合国发布千年生态系统评估(The Millennium Ecosystem Assessment)报告,明确生态系统服务评估对于生态保护的重要性——关乎人地共生的生态系统服务研究逐步成为全球学术热点。生态系统服务的空间格局及其演化体现着区域生态系统的外在状况,生态系统服务的影响因素及其作用方式阐释着影响生态系统的内在机理。把握生态系统服务的外在时空演化和内在影响机理,对识别区域生态系统服务问题、维持区域生态平衡、促进区域可持续发展具有重要意义[4,5,6]。生态系统服务价值(Ecosystem Service Value, ESV)是生态系统服务能力的量化估计,其评估途径主要分为币值化和能值化两类[7]。其中,货币形式的生态系统服务价值便于民众理解和决策者使用,可有效辅助空间规划、生态管制和生态修复[8,9,10],应用最为广泛。生态系统服务价值是描绘生态系统服务时空演变的基础,其准确核算至关重要。但已有研究多数仅沿用谢高地等提出的“中国陆地生态系统服务价值当量因子表”[11,12],认为同种用地具有相同的生态系统服务价值当量[6, 13-15],忽视了植被繁茂程度的潜在影响。而植被影响着多种生态过程,在碳汇、水土保持、水源涵养等生态系统服务中发挥重要作用,忽视植被生长情况的生态系统服务价值核算将明显失准。因此本文依托遥感图像识别确定区域植被的实际状况,利用归一化植被指数(NDVI)对生态系统服务价值进行现实修订,进而获得准确度更高且更契合实际情况的生态系统服务价值核算结果。
若刻画区域生态系统服务空间格局是“知其然”,探索区域生态系统服务影响机理则是“知其所以然”,更有助于把握生态系统问题的根源,指导区域生态建设。生态系统服务的影响因素可分为自然因素(生物、气候、土壤、地形)和人文因素(土地利用、社会经济)。在自然因素方面,生物自身性状[16]和生物多样性[17,18]均会影响生态系统服务能力;气候对生态系统服务的影响存在着直接调节水热条件[19,20]和通过影响生物行为带来间接作用[21]双路径;土壤作为生物成长、寄居的本底生态要素,其有机碳积累[22]和水分循环[23]等理化性质对生态系统服务功能有巨大影响;地形通过影响地表温度、光照强度、蓄水能力等生态条件,间接调控土壤保持力、供水能力和作物生产能力等生态系统服务功能[24,25,26,27]。在人文因素方面,土地利用类型、土地利用总体格局和土地开发强度的变化,均会影响生态系统服务水平[28],在国内研究广泛;经济、人口等社会经济因素作为生态系统服务的间接影响因素,通过影响开发、污染等直接影响因素来发挥作用[3]。生态系统服务的影响机理复杂,国内的相关研究还不够深入。多数研究采用相关性分析[29,30,31]、逐步回归[32,33]、Logistic回归[5]等方法简单识别影响因素的作用,虽然有部分研究考虑了影响因素间的交互作用[34]和影响效果的空间分异[35],但均未摆脱“自变量与因变量之间的关系是固定的”的潜在认知假设,忽视了影响因素在生态系统服务水平不同的区域带来影响差异的可能。而分位数回归模型可以在因变量的不同分位点获得对应的回归系数,是活跃在统计学前沿领域的回归方法[36]。本文引入该方法,首次探索在不同生态系统服务价值水平下,生态系统服务影响因素的效果差异,进一步完善了对生态系统服务影响机制的认识。
国内的生态系统服务研究可根据研究对象划分为局部地区、城市群和全国3个尺度。局部地区尺度的价值评估[37,38,39,40,41]研究数量最多,内容多以研究区域生态系统服务价值的时空分布特征为核心,特异性与应用性强,规律性与理论性弱。全国尺度的价值评估研究,主要产生于生态系统服务研究兴起的早期,具有探索生态系统服务价值空间分布规律、提供对全国生态系统服务状况的认知以及支持国家环保事业发展的特点:何浩等发现陆地生态系统服务价值与植被的地带性分布梯度基本一致[42];王兵等指出经济林生态系统与水热条件和生物多样性具有趋同的空间分布特征[43];关于全国林地、草地生态系统服务价值评估,推动了中国可持续经济核算体系的建设与发展[44,45]。城市群尺度的研究在最近几年刚刚起步,研究数量较少[46,47]。总体而言,战略价值更高的全国和城市群尺度的生态系统服务研究不足。作为中国开放程度最高、经济活力最强、城镇化速度最快的区域之一,粤港澳大湾区高强度的经济开发和城市扩张破坏了原有生态环境的要素、结构和功能,为其生态文明建设带来了巨大挑战。同时,作为中国首个国家正式审批建设的大湾区,粤港澳大湾区承担着先行实现生态和经济的高水平协调发展,发挥先锋模范作用的战略责任。在国家高度重视生态文明建设的背景下,加强粤港澳大湾区的生态系统服务研究,对于解决区域发展问题乃至支持国家宏观发展布局均具有重要战略价值。
因此,本文以粤港澳大湾区为研究对象,引入遥感生态指标NDVI以提高生态系统服务价值评估的精度和准确度,进而描绘出更确切的生态系统服务时空演变特征;同时首次采用面板分位数回归模型,探索生态系统服务影响因素在不同生态系统服务价值水平的效应差异,为生态系统服务影响机制研究开辟新视角,研究结果可为粤港澳大湾区的生态保护和可持续发展提供精细的科学指引。
2 研究区概况与研究方法
2.1 研究区概况
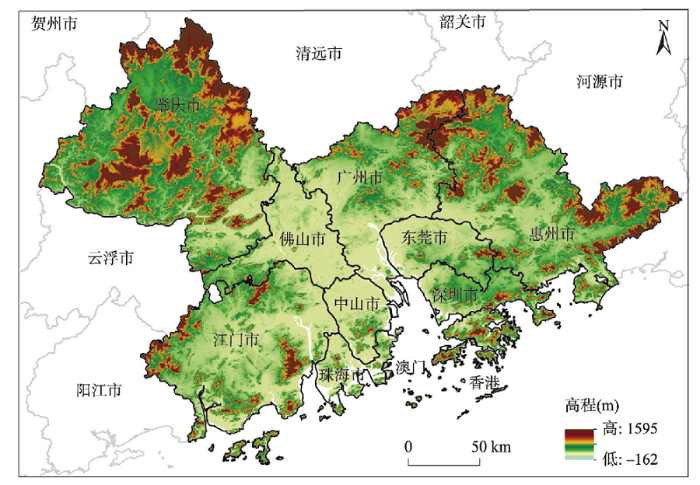
粤港澳大湾区(21°25'N~24°30'N, 111°12'E~115°35'E),与纽约湾区、旧金山湾区、东京湾区并称世界四大湾区,肩负着构建全面开放新格局、推动“一国两制”事业发展、支撑“一带一路”建设的重要战略任务。粤港澳大湾区由广州、深圳、佛山、东莞、惠州、中山、珠海、江门、肇庆9市和香港、澳门两个特别行政区构成(图1),总面积达到5.6万km2。在自然环境方面,粤港澳大湾区内河网密布,水量充沛,以亚热带和热带季风气候为主,水热条件良好;地形西北高,东南低,山地集中在北部,平原地区主要分布于中部和沿海地区。在人文环境方面,截至2019年,粤港澳大湾区人口突破7000万,GDP总量达到11.6万亿元。粤港澳大湾区以5%的全国人口和0.58%的国土面积,创造超过12%的全国GDP,是中国经济活力最强的区域之一。高速的城镇化和经济发展给粤港澳大湾区的生态文明建设带来巨大挑战,如何实现经济和生态的协同发展已成为粤港澳大湾区未来发展的重要议题。图1
 新窗口打开|下载原图ZIP|生成PPT
图1粤港澳大湾区区位图
Fig. 1Location of the Guangdong-Hong Kong-Macao Greater Bay Area (GBA)
2.2 影响因素及数据来源
2.2.1 影响因素选择 综述国内外研究成果发现,生态系统服务的影响因素主要包含地形、气候、土壤、生物、土地利用类型、土地利用格局、土地利用强度和社会经济因素。本文以此为基础,进行影响因素选取。受数据可得性的限制,土壤、生物和土地利用强度因素未纳入本文;地形因素由于仅有2000年数据而无法满足面板数据条件,未纳入本文;气候、社会经济和土地利用格局因素的对应变量被选作面板分位数回归的自变量;土地利用类型是最主要的生态系统服务影响因素之一[48,49],会直接影响生态系统服务价值变化[50]和生态系统服务之间的流动与相互作用[51,52],但其数据形式无法应用于面板分位数回归方法。考虑到土地利用类型因素的重要性,以及土地利用类型易于在人为管控下促进生态系统服务改善的政策性,本文通过弹性系数测度土地利用类型变化对生态系统服务价值的影响,使用全局弹性系数反映土地利用类型对生态系统服务价值影响的时间演变,使用局部弹性系数表征土地利用类型影响生态系统服务价值的空间分异。2.2.2 面板分位数回归的变量选取
(1)自变量选取。在气候方面,水热条件是气候状况的重要表征,气温、降水直接影响着生态系统的服务价值,其影响效果有着明显的空间分异[19,20],气候因素选取年均降水量(PRE)和年均气温(TEM)作为自变量。在社会经济方面,人口密度表示日常生活强度,经济密度表示生产活动强度,生产和生活结合可反映社会经济的整体情况,社会经济因素选取人口密度(POP)和经济密度(GDP)作为自变量,上述变量数据来源于中国科学院资源环境科学数据中心(http://www.resdc.cn)。在土地利用格局方面,不同的土地利用结构会产生不同的生态过程,从而提供不同水平的生态系统服务[53]。平均邻近指数反映土地利用斑块的邻近程度和破碎度,与土地利用结构的破碎度成反比[54],可表征用地结构完整度。土地利用结构因素选取平均邻近指数(MPI)作为自变量,变量数据利用Patch Analyst模块在ArcGIS 10.5中计算获得。为提高空间描绘精度和回归分析准确度,本文将粤港澳大湾区划分为5 km×5 km尺度的格网(2594个)。
(2)因变量选取。本文以生态系统服务价值(ESV)为研究的因变量。土地利用数据和归一化植被指数(NDVI)数据被应用于核算生态系统服务价值,土地利用数据解译于Landsat TM/ETM和Landsat 8遥感影像,NDVI数据提取于SPOT/VEGETATION和MODIS遥感影像,两类数据均为2000年、2005年、2010年、2015年4期,数据来源于中国科学院资源环境科学数据中心(http://www.resdc.cn)。根据研究需求,本文将土地利用数据重分类为森林、草地、农田、建设用地、水域、未利用地6类,结合NDVI数据和粮食价格统计数据在ArcGIS中通过提取、叠置、关联、栅格计算、空间统计等方法获得粤港澳大湾区2000—2015年的生态系统服务价值。
2.3 研究方法
2.3.1 生态系统服务价值核算 谢高地等[11,12]以Costanza等[2]的成果为基础,通过对中国多位生态学领域的专家进行问卷调查,构建了中国生态系统服务价值当量因子表。其中,2007年研究成果的调查问卷数量及问卷回收率更高,更具可信度和科学性,本文将其作为全国基础当量因子表。同时,通过调查2015年的《广东省统计年鉴》《中国农产品价格调查年鉴》和广东华南粮食交易中心统计数据,测算粤港澳大湾区粮食单产市场价格(香港澳门几乎无农业用地,忽略不计),按单位面积农田生态系统服务价值等于平均粮食单产市场经济价值的1/7计算[12],获得适用于粤港澳大湾区的基础当量因子表(表1)。由于在农田、林地和草地等有植被覆盖的用地类型上,植物繁茂程度的差异,会使相同用地类型提供具有明显区别的生态服务水平[55]。因此,本文利用植被归一化指数(NDVI)反映区域内的植物状态,对研究单元格的生态系统服务价值再次修订,最终获得粤港澳大湾区的生态系统服务价值。具体公式为:Tab. 1
表1
表1粤港澳大湾区单位面积生态系统服务价值当量表(元 hm-2 a-1)
Tab. 1
| 生态系统服务类型 | 土地利用类型 | ||||
|---|---|---|---|---|---|
| 森林 | 草地 | 农田 | 水域 | 未利用地 | |
| 供给服务 | 8875 | 2118 | 3727 | 2360 | 161 |
| 调节服务 | 38075 | 15820 | 10323 | 97039 | 1394 |
| 支持服务 | 22872 | 11020 | 6677 | 10296 | 1528 |
| 文化服务 | 5577 | 2333 | 456 | 11905 | 644 |
新窗口打开|下载CSV
式中:Aij表示第i种土地利用类型第j种生态系统服务的生态系统服务价值系数;Bik表示第i种土地利用类型在第
2.3.2 生态系统服务价值的土地利用变化响应弹性 弹性是衡量一个变量对另一个变量变化的响应程度的指标。本文利用这种方法来衡量由土地利用/土地覆盖变化(LUCC)引起的生态系统服务价值(ESV)的百分比变化[56],公式如下:
式中:
2.3.3 面板分位数回归模型 面板数据兼具横截面和时间两个维度,使得面板样本容量大幅增加,可明显提高回归结果的精确度,因此本文基于2000年、2005年、2010年和2015年的4期面板数据,分析粤港澳大湾区生态系统服务价值的影响机理。固定效应模型和随机效应模型是常用的面板回归模型,可以从整体上识别变量之间的关系,在影响因素分析中十分常用。Hausman检验结果显示,固定效应模型更适合于本文,其公式为:
式中:β为回归系数;ykt为因变量;PREkt、TEMkt、MPIkt、POPkt和GDPkt为自变量;μk为个体效应,其值随机但不随时间变化;ekt为扰动项。
面板固定效应模型关注影响因素x对生态系统服务y的条件期望E(y|x)的影响,但这实际上是一种均值回归,在条件分布y|x不是对称分布的情况下,回归结果实际上只是反映了影响因素与生态系统服务之间关系的一部分[36]。但在分位数回归模型中,处于不同分位点的因变量会获得对应的自变量系数估计值,能够考察在不同ESV水平的区域,影响因素与生态系统服务的关系变化。此外,基于全样本数据进行回归的分位数回归模型能够避免分阶段线性回归的截断问题,并且具有受极端值干扰小,能够获得稳健系数估计的优点[57]。因此,本文使用面板分位数回归深入探索生态系统服务的影响因素:
式中:
3 结果分析
3.1 生态系统服务价值的时空演变
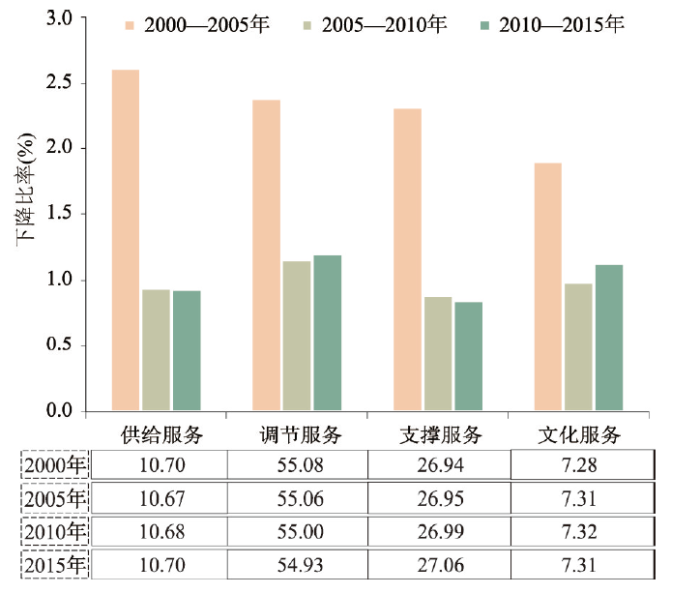
参照表1,结合式(1)~(2)得到粤港澳大湾区生态系统服务价值栅格图像,利用空间统计工具获得粤港澳大湾区生态系统服务价值总量,结果表明:2000—2015年粤港澳大湾区的生态系统服务价值持续下降,由2000年的2959.62亿元下降到2015年的2828.54亿元,共计下降131.08亿元,年均下降8.74亿元。粤港澳大湾区自1978年改革开放以来的快速城镇化,给生态环境带来了巨大的压力[58]。人口城镇化带来的资源消耗和废物排放[59],促使了森林的生物量减少,压迫了湿地等调节系统;空间、经济和社会城镇化诱发的用地变化,显著影响了生态系统的服务能力[60],粤港澳大湾区的生态系统服务价值在城镇化的负面影响中下降。2000—2005年间,生态系统服务价值下降2.36%,占总下降量的52.6%。但自2005年起,广东省实行《集体建设用地使用权流转管理办法》,明确限制了政府征用集体建设用于房地产开发的行为,可有效遏制市场导向的城市扩张;同时,集体建设用地的流转可以促使农村居民向小城镇集中,为旧村复耕提供了条件[61]。2010年,广东省政府与国家环境保护部正式签署了《共同推进和落实〈珠江三角洲地区改革发展规划纲要(2008—2020年)〉合作协议》,全力推动广东产业升级和环保基础设施建设,并采取了在珠三角区域内不再规划新建燃煤燃油电厂、禁止建设陶瓷厂水泥厂等高污染工厂等一系列措施,有效遏制了珠三角地区的生态环境恶化。因此,2005—2010年和2010—2015年间,粤港澳大湾区的生态系统服务价值下降速度减慢且趋于稳定,分别仅下降1.05%和1.08%。4类一级生态系统服务(供给服务、调节服务、支持服务和文化服务)均具有类似的变化趋势(图2),可见粤港澳大湾区近些年的生态保护措施初见成效,人地关系正逐步改善。图2
 新窗口打开|下载原图ZIP|生成PPT
图22000—2015年粤港澳大湾区生态系统子服务价值结构及下降比率(%)
Fig. 2Structure and decline rate of ecosystem sub-service value in the GBA from 2000 to 2015 (%)
在粤港澳大湾区的生态系统服务价值结构方面,4类一级生态系统服务的相对比例并没有明显变化,生态系统服务价值结构较为稳定;其中,调节服务价值占比最高,达到55%左右,可见湾区生态系统主要发挥消解人类污染与保障生态系统稳定的作用。对粤港澳大湾区的各二级生态系统服务(食物生产、原材料生产、气体调节、气候调节、水文调节、废物处理、土壤保持、生物多样性、美学景观)进行核算,结果显示湾区的主导生态系统服务类型为水文调节服务,其2000—2015年的生态系统服务价值分别为552.11亿元、539.43亿元、531.99亿元、524.81亿元,均处于当年首位,且下降量逐年递减。粤港澳大湾区林木茂盛的植被特性以及珠江的自我调节能力已为水文调节服务提供了有力支撑,同时结合“南粤水更清行动计划”等一系列人为治水措施,湾区的水环境有望进一步改善。而粤港澳大湾区的食物生产服务价值最低,年均不足70亿元,这与湾区着重发展制造业与服务业的产业特性密切相关。
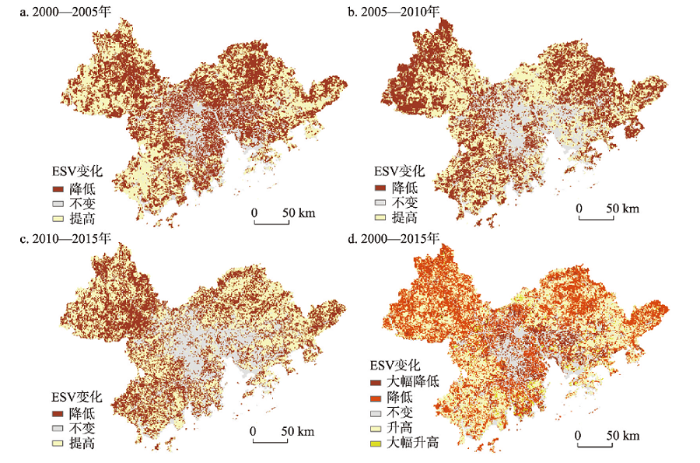
对生态系统服务价值的变化进行空间定位(图3),发现不同时期生态系统服务价值的变化存在明显的空间分异。2000—2005年间,粤港澳大湾区45.77%的空间生态系统服务价值下降,主要分布在粤港澳大湾区中部、珠江入海口两岸、肇庆中部和惠州北部,基本与城市建设用地扩张空间重合。2005—2010年间,粤港澳大湾区生态系统服务价值降低的空间占比缩小为42.07%;下降空间由粤港澳大湾区中部向外围转移,分布在肇庆西北部、江门和惠州大部分地区;而广州、东莞、深圳、珠海和中山等区域的生态系统服务价值则有所提高。城市发展阶段的差异是这种转变的重要原因,2005—2010年粤港澳大湾区中部和珠江入海口两岸的大部分空间已转化为城市建设用地,城市进入建设用地“存量挖掘”阶段,注重对已有建设用地利用效率的提高,对生态用地的占用减少;而粤港澳大湾区外围城市仍处于“增量发展”阶段,城市建设用地新增速率较快。此外,广东省2008年开始实行的“双转移”战略推动了劳动密集型产业向粤港澳大湾区外围三市、粤东西两翼和粤北山区转移,粤港澳大湾区中部和珠江入海口两岸的环境污染压力也在此过程中转向外围。2010—2015年间,粤港澳大湾区生态系统服务价值降低的空间占比进一步缩小为38.25%;下降空间分布零散,仅在肇庆南部小规模集聚。从整体来看,2000—2015年间,除江门、香港、澳门、惠州中部和广州北部以外,粤港澳大湾区的生态系统服务价值均大面积降低;其中,大幅度下降区域(降幅超过100万元)主要集中在粤港澳大湾区中部和珠江入海口东岸,以东莞和深圳的生态系统服务价值下降最为严重。
图3
 新窗口打开|下载原图ZIP|生成PPT
图32000—2015年粤港澳大湾区生态系统服务价值变化的空间分布
Fig. 3Spatial distribution of ESV variation in the GBA from 2000 to 2015
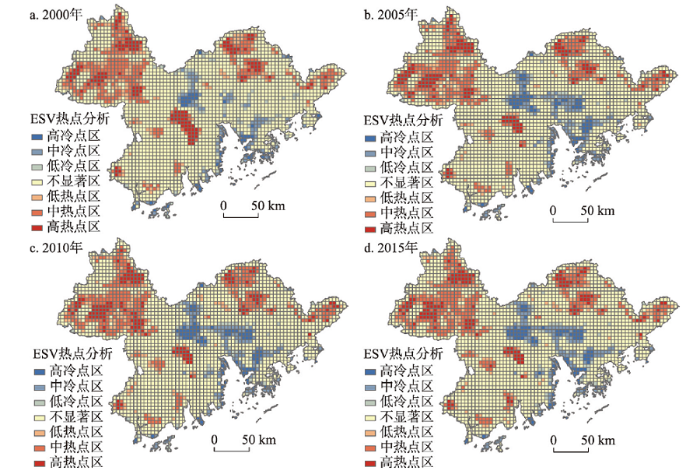
本文进一步通过热点分析,揭示2000—2015年粤港澳大湾区生态系统服务价值的空间集聚特征及其演变规律(图4)。粤港澳大湾区一半地区的ESV空间集聚特征不显著,显著区域以高ESV的空间集聚为主。ESV的高值区集中分布在粤港澳大湾区的东北部和西北部的山地区域,ESV的低值区则集中分布在中部、珠江入海口两岸和滨海区域。2000—2015年间,ESV的高值集聚区没有明显变化,而低值集聚区在2000—2005年发生了明显扩张,扩张区域主要分布在东莞和深圳,在2005—2015年则表现出连片的趋势。总体而言,粤港澳大湾区内部的生态系统服务出现明显的分区差异,中部和沿海区域连片成为城镇化建设的“前沿阵地”,北部山地成为提供生态系统服务支撑的“后勤区域”。
图4
 新窗口打开|下载原图ZIP|生成PPT
图42000—2015年粤港澳大湾区生态系统服务价值空间集聚特征
Fig. 4Spatial agglomeration characteristics of ESV in the GBA from 2000 to 2015
3.2 生态系统服务价值对土地利用变化的响应
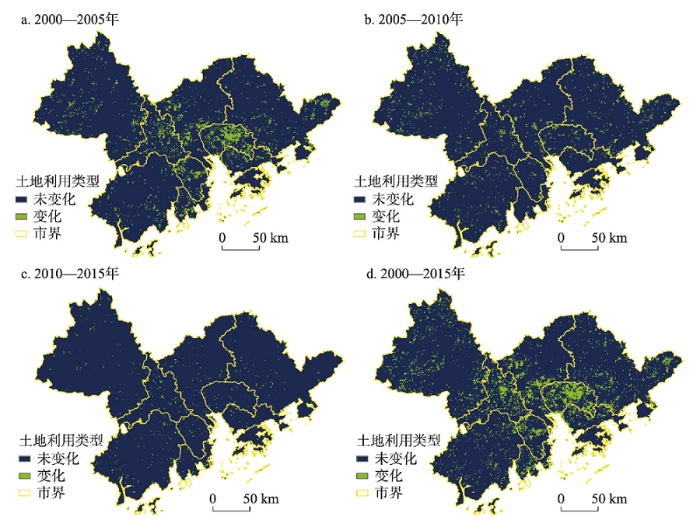
土地利用类型变化对生态系统服务有显著的影响[62,63,64],本文利用空间分析方法,引入弹性指数反映生态系统服务价值对土地利用变化的响应。2000—2015年间,粤港澳大湾区土地利用类型变化面积达到5440.02 km2,主要集中在东莞、广州、佛山、中山、深圳和珠海,其中2000—2005年间土地利用变化的面积最大,达到3585 km2(图5)。图5
 新窗口打开|下载原图ZIP|生成PPT
图52000—2015年粤港澳大湾区土地利用变化
Fig. 5Land use change in the GBA from 2000 to 2015
粤港澳大湾区生态系统服务价值变化相对于2000—2005年和2005—2010年土地利用变化的平均弹性分别为0.38和0.31,但在2010—2015年间跃升至1.08。这表明在2000—2010年间土地利用变化对生态系统服务的干扰能力较弱,而在2010—2015年间这种干扰能力大幅增强。2000—2010年间土地利用类型变化范围大但平均弹性指数反而较低,是由于此时的土地利用变化种类众多,既有林地、耕地向建设用地的转化,也有林地、水域向耕地的转化,单位面积土地利用变化带来的生态系统服务价值降低较少;2010—2015年间土地利用类型变化的面积较小,但主要是生态用地向城镇建设用地的转化,发生转化的区域的生态系统服务能力完全消失,生态系统服务价值变化幅度大,表现为平均弹性指数较高。由此,粤港澳大湾区在未来进行生态文明建设时,加强对城镇建设用地扩张的科学管理将成为重中之重。
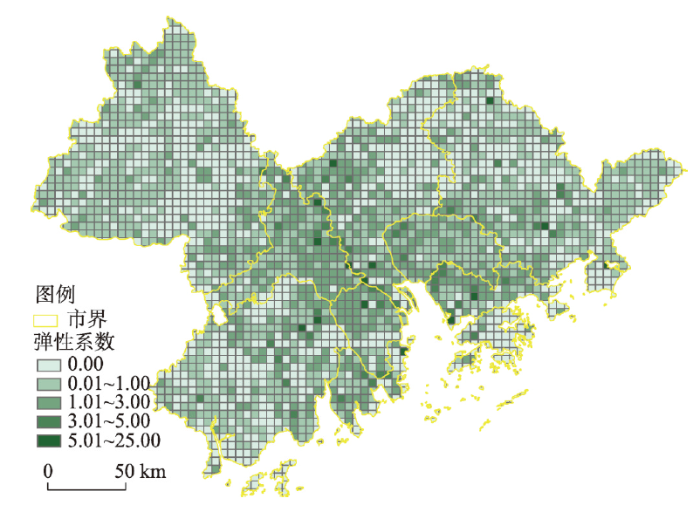
对2000—2015年弹性指数进行精确的空间统计(图6),结果显示,粤港澳大湾区中部的弹性指数较高;高弹性指数网格在城市交界处集聚,这种现象在广州—佛山交界处和深圳—东莞交界处尤为明显,肇庆、惠州、江门与其他相对发达城市的交界处也表现出高弹性指数集聚的特征。自2009年广佛肇、深莞惠、珠中江三大经济圈战略构想提出,粤港澳大湾区的一体化水平不断提高,城市交界处的开发建设和人类活动带来了显著的生态系统服务功能衰退。随着粤港澳大湾区内部联系的不断加强,城市交界处作为城市互动的最直接区域,未来同样面临着生态用地被占用、生态系统服务功能衰退的风险。如何通过土地转置、创新土地开发模式等方法实现粤港澳大湾区生态保护和经济发展的双赢,是未来粤港澳大湾区土地利用管理的重要思考方向。
图6
 新窗口打开|下载原图ZIP|生成PPT
图62000—2015年粤港澳大湾区弹性系数空间分布
Fig. 6Distribution of elastic index in the GBA from 2000 to 2015
3.3 生态系统服务影响因素的分段效应
分析生态系统服务影响因素的分段效应,有助于深入了解影响因素对生态系统服务的作用机理。根据豪斯曼检验结果,本文选择面板固定效应模型来分析生态系统服务的综合影响因素。面板固定效应回归属于线性回归,对因变量有严格的正态分布假设。本文的因变量数据表现出低峰度、左偏态的分布特征,拒绝正态分布假设,因此使用Bloom算法对因变量正态化处理。而分位数回归并不强烈要求必须满足误差项的假设条件,可以对非正态分布的变量进行稳健估计[57],故在分位数回归中仍使用原始数据。此外,异方差的存在会降低面板固定效应回归的效率,本文使用稳健性标准误解决异方差问题[36]。为精确识别影响因素的分段效应,本文分9个分位进行面板分位数回归(表2)。Tab. 2
表2
表22000—2015年粤港澳大湾区生态系统服务价值影响因素的面板回归结果
Tab. 2
| 回归类型 | 变量回归系数及标准误 | |||||
|---|---|---|---|---|---|---|
| PRE | TEM | POP | GDP | MPI | ||
| 固定效应回归 | -1.47E-06 (1.59E-06) | 1.69E-03*** (5.11E-04) | 2.48E-06 (2.58E-06) | -2.92E-06*** (1.11E-06) | 1.49E-02 (1.74E-02) | |
| 0.1分位回归 | -121.24 (98.43) | 84723.41** (33532.16) | -431.80 (472.47) | -145.72** (60.14) | 1897395.00** (859333.60) | |
| 0.2分位回归 | -87.22 (79.58) | 87474.14*** (27111.55) | -252.42 (382.00) | -144.63*** (48.63) | 1612107.00** (694778.80) | |
| 0.3分位回归 | -63.99 (68.81) | 89352.91*** (23441.90) | -129.90 (330.35) | -143.88*** (42.04) | 1417254.00** (600800.40) | |
| 0.4分位回归 | -40.98 (60.89) | 91213.39*** (20740.32) | -8.58 (292.48) | -143.14*** (37.20) | 1224297.00** (531790.40) | |
| 0.5分位回归 | -10.60 (56.55) | 93670.10*** (19251.33) | 151.63 (271.84) | -142.16*** (34.52) | 969503.20** (494041.20) | |
| 0.6分位回归 | 25.10 (61.81) | 96557.23*** (21051.82) | 339.91 (297.04) | -141.00*** (37.75) | 670069.60 (539974.70) | |
| 0.7分位回归 | 56.87 (74.11) | 99126.38*** (25245.84) | 507.45 (355.97) | -139.98*** (45.28) | 403615.10 (647257.80) | |
| 0.8分位回归 | 91.41 (92.21) | 101919.10*** (31414.65) | 689.57 (442.78) | -138.87** (56.34) | 113968.60 (805223.40) | |
| 0.9分位回归 | 134.27 (118.18) | 105384.80*** (40262.84) | 915.57 (567.26) | -137.48* (72.21) | -245464.60 (1031756.00) | |
新窗口打开|下载CSV
面板固定效应回归结果表明,仅年均气温()和经济密度(GDP)对粤港澳大湾区的生态系统服务价值有显著影响。年均气温(TEM)的回归系数为正,表明高温提供的热量条件对于提升生态环境质量、增强生态系统服务能力有明显的贡献。经济密度(GDP)的回归系数为负,表明人类的经济活动对生态环境有着显著的胁迫作用,高强度的经济开发会大幅度降低生态系统服务价值。
面板分位数回归结果则更详细地揭示了各变量的回归系数值及显著性随分位数变动而发生的变化,可以帮助理解面板固定效应回归中部分变量不显著的原因以及显著变量的分段效应。观察年均降水(PRE)、人口密度(POP)和平均邻近指数(MPI)的分位数回归结果发现,3个自变量的回归系数均发生了正负转变,此种作用效果的前后矛盾是其面板固定效应回归结果不显著的重要原因。0.1~0.5分位回归的结果显示,平均邻近指数(MPI)的回归系数在5%的水平上显著为正,即在生态系统服务价值低的区域,用地越完整生态系统服务价值越高。可见在人类活动频繁的城市建成区,保证用地完整连片对于提高生态系统服务价值有积极作用。
年均气温(TEM)的分位数回归结果显示,0.1~0.9分位的回归系数均显著为正且逐渐增大,即生态系统服务价值越高的区域,年均气温对于生态系统服务能力提高的贡献越大。植物作为生态系统的关键要素,参与生态系统的原料生产、气候调节、水文调节、土壤保持等各项服务,其生长状况对于生态系统服务功能起着决定性作用,生态系统服务价值也可以侧面反映植物的繁茂程度。生态系统服务价值高的区域植物更加繁茂,对高气温提供的热量利用更加充分,因此气温对生态系统服务能力提升的正向作用在ESV的高值区更加显著。上述结果表明,如气温等自然条件对生态系统服务的影响具有“自然马太效应”,生态系统服务价值高的区域利用水热条件的能力强,进一步提升生态系统服务能力,而生态系统服务价值低的区域利用水热条件的能力弱,生态系统服务能力提升的速度慢,二者的差距会进一步拉大。
观察经济密度(GDP)的分位数回归系数变化发现,0.1~0.9分位的回归系数均显著为负且逐渐增大,负向作用逐渐减小,即生态系统服务价值越高的区域,经济活动对于生态系统服务的压迫越小。本文认为之所以呈现出这种规律,是因为ESV的高值区往往是未被开发的原始生态环境,发生在其内部的经济活动少、强度低,经济活动的负面影响较弱;而ESV的低值区往往是开发强度较大、经济水平较高的区域,经济活动对生态系统服务的负面影响显著。由此可知,远离人类社会的原始生态环境虽有最强的生态系统服务能力,最值得保护的价值,但其经济开发条件差的现状同样为其增加了先天的保护,而临近人类社会的城郊生态系统已经具有一定的经济开发基础,最容易遭受经济活动的胁迫。粤港澳大湾区未来在进行生态管控时,应着重保护已被部分开发的生态环境免遭进一步的破坏。
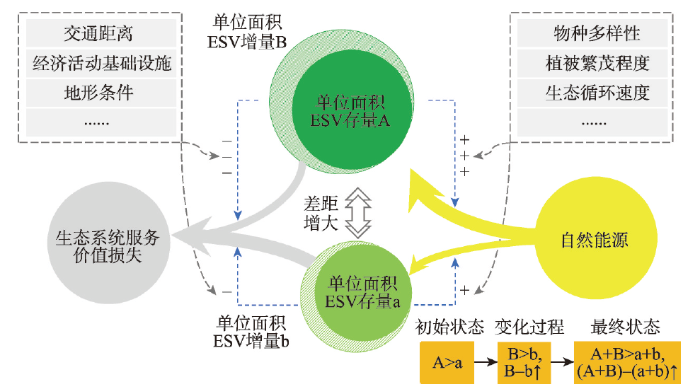
生态系统服务影响因素的分段效应让我们对生态系统服务价值演化的影响机制产生如图7所示的新认识:自我强化——ESV的高值区具有更茂盛的植被、更丰富的物种和更高效的生态循环,对自然能源的利用能力强,其ESV的自然积累速度相较于ESV低值区更快;自我保护——ESV高值区在空间上往往位于远离城市的地区,会受到地形、交通距离和开发基础条件的保护而难以被破坏,而ESV低值区所处的环境往往更临近人类活动区,面对着更大的人为开发压力。综合而言,ESV高值区在自我强化能力和自我保护能力方面均明显强于ESV低值区,区域间的ESV差距会在这种反馈机制中不断扩大。
图7
 新窗口打开|下载原图ZIP|生成PPT
图7生态系统服务价值演化的自我强化与自我保护机制
Fig. 7Self-reinforcement and self-protection mechanism of ecosystem service value evolution
4 结论与讨论
4.1 结论
基于2000—2015年多种遥感数据和格网数据,结合统计分析、空间分析和面板分位数回归模型,本文揭示了粤港澳大湾区生态系统服务价值的数值变化和空间分布特征,并深入探究了生态系统服务价值对土地利用类型变化的响应,以及在生态系统服务价值水平不同的区域,影响因素发挥作用的差异,得到如下结论:(1)2000—2015年间,粤港澳大湾区的生态系统服务总价值持续下降,总计达131.08亿元。但自2005年起下降速度大幅减缓,表征着粤港澳大湾区在向人地和谐的高水平发展阶段迈进。4类一级生态系统服务价值具有与总价值类似的变化趋势,其中调节服务价值占比最高,从属于调节服务的水文调节服务是粤港澳大湾区的主导服务类型。进一步分析生态系统服务价值变化的空间分布发现,粤港澳大湾区中部和珠江入海口两岸的生态条件近些年有所恢复,但综合2010—2015年的变化而言,该人类活动集中区仍是生态系统服务下降幅度最大的区域。此外,生态系统服务价值的热点分析表明,生态系统服务价值的高值区集中分布在粤港澳大湾区北部的山地区域,低值区则在中部、珠江入海口两岸和滨海区域集聚。
(2)土地利用类型变化对粤港澳大湾区生态系统服务价值的影响在2000—2010年较弱,但在2010—2015年强烈。2010—2015年间,粤港澳大湾区土地利用类型变化较少,但生态用地转化为城镇建设用地的比例更高,带来了强烈的生态系统服务价值变化。对2000—2015年弹性系数进行空间统计发现,影响强度大的网格在城市交界处集聚,可见城市交界处的城市互动和开发行为,给推行一体化、网络化的粤港澳大湾区带来生态管控方面的挑战。
(3)用地完整度仅在生态系统服务价值的低值区与生态系统服务价值正相关,在城市建成区等生态系统服务价值低值区,更应保证用地完整性。气温对生态系统服务价值的正向作用在生态系统服务价值越高的区域越强;经济密度对生态系统服务价值的负向作用在生态系统服务价值越高的区域越弱。生态系统服务价值高的区域自我强化能力强,且受人类活动的胁迫弱,而生态系统服务价值低的区域刚好相反。若无外界干预,此类机制会不断扩大生态系统服务价值高值区和低值区的差距,形成生态系统的“马太效应”。生态系统服务价值低的区域缺少自然提升的条件且更易受到人类开发破坏,更应成为粤港澳大湾区生态保护的重点。
4.2 讨论
生态系统服务作为自然环境和人类福祉之间耦合交互的桥梁与纽带,其相关研究已经成为人地关系研究领域的重要议题[65]。生态系统服务价值核算将生态学问题转化为公众领域易于解读的指标形式,帮助发现问题;生态系统服务影响机制探究将生态问题的产生机理阐释清楚,帮助解决问题,二者结合可在区域生态系统管理和生态决策优化的过程中发挥巨大作用。生态系统服务价值评估需保证现适性和准确性,随着人与自然环境的关系不断演进,当量因子表需适应时代动态更新;考虑生态系统服务价值研究的地方性,更多具有时效性和地方性的生态指标和高精度遥感数据应纳入评估体系;生态系统服务评价模型可充分考虑生态过程,将成为价值评估的未来方向。深入且空间指向性明确的生态系统服务影响机制分析,具备更高的理论意义和现实价值。面板分位数回归可按分位点将因变量划分,获得不同ESV水平下的影响效应,进而深入理解影响机理,同时结合ESV的空间布局将影响效应在空间上定位,提供明确的政策指引。但受模型特点限制,地形等非时变性因素无法纳入研究,存在影响机理分析不全面的问题,未来可结合其他研究方法探索完整的影响机理。本文以具有重要战略意义的粤港澳大湾区为研究对象,通过对生态系统服务价值的时空分布特征、生态系统服务价值对土地利用变化的响应和生态系统服务影响因素的分段效应3个方面分析,获得如下政策启示:① 城市交界处的ESV最易受用地类型变化影响,随着粤港澳大湾区一体化和网络化进程的加快,严格管控城市交界区域的建成区扩张,同时完善城市内部的生态用地占补机制,实现有占必补以保证生态用地总量将是维护生态系统服务能力的重要应对手段;② 人类聚集区的用地完整有助于提高生态系统服务价值。对于粤港澳大湾区的城市,在进行建设用地扩张时以连续扩张为主,减少城市飞地带来的生态用地破碎,同时充分利用建设用地间夹杂的未利用地,做好存量挖掘;对于粤港澳大湾区的乡村,通过合村并居适当减少乡村聚落的空间破碎度, 既节约土地资源,又可以减少乡村聚落的水、电、路网对自然生态系统的割裂,还能提高行政资源和公共资源的社会服务效率[66]。③ 优先保护生态系统服务价值较低的生态环境,依托遥感技术和责任制打破生态系统服务“马太效应”,保证粤港澳大湾区全域的生态系统服务能力均衡发展。
参考文献 原文顺序
文献年度倒序
文中引用次数倒序
被引期刊影响因子
DOI:10.1016/j.gloenvcha.2014.04.002URL [本文引用: 1]
DOI:10.1038/387253a0URL [本文引用: 2]
[本文引用: 2]
[本文引用: 1]
[本文引用: 1]
[本文引用: 2]
[本文引用: 2]
[本文引用: 2]
[本文引用: 2]
DOI:10.15302/J-LAF-20190107 [本文引用: 1]

Through literature review, this article introduces milestones, current situation and focuses, and trends of the ecosystem service research, which concentrates recently on classification, value evaluation, identification of bundles, balance, synergy, and flow simulation of ecosystem services, and their role in decisionmaking optimization. The research involves several disciplines related to social-ecological interactions, for which the collaboration between different disciplines may facilitate the research by comprehensive considerations on more natural and social factors. In addition, ecosystem service value evaluation provides not only basic information and data for preliminary planning and design, but also a direct evidence for decision-making in social, economic, and management affairs. As a result, more diverse estimation methods should be explored for converting physical amounts into value amounts in ecosystem service value evaluation. Finally, this article proposes that by strengthening research and application of the cascade framework of ecosystem services, landscape architects may play a more important role in ecological construction.
[本文引用: 1]
DOI:10.1016/j.ecolecon.2008.05.003URL [本文引用: 1]
DOI:10.1111/j.1523-1739.2011.01649.xPMID:21507060 [本文引用: 1]
A price on carbon is expected to generate demand for carbon offset schemes. This demand could drive investment in tree-based monocultures that provide higher carbon yields than diverse plantings of native tree and shrub species, which sequester less carbon but provide greater variation in vegetation structure and composition. Economic instruments such as species conservation banking, the creation and trading of credits that represent biological-diversity values on private land, could close the financial gap between monocultures and more diverse plantings by providing payments to individuals who plant diverse species in locations that contribute to conservation and restoration goals. We studied a highly modified agricultural system in southern Australia that is typical of many temperate agriculture zones globally (i.e., has a high proportion of endangered species, high levels of habitat fragmentation, and presence of non-native species). We quantified the economic returns from agriculture and from carbon plantings (monoculture and mixed tree and shrubs) under six carbon-price scenarios. We also identified high-priority locations for restoration of cleared landscapes with mixed tree and shrub carbon plantings. Depending on the price of carbon, direct annual payments to landowners of AU$7/ha/year to $125/ha/year (US$6-120/ha/year) may be sufficient to augment economic returns from a carbon market and encourage tree plantings that contribute more to the restoration of natural systems and endangered species habitats than monocultures. Thus, areas of high priority for conservation and restoration may be restored relatively cheaply in the presence of a carbon market. Overall, however, less carbon is sequestered by mixed native tree and shrub plantings.© 2011 Society for Conservation Biology.
DOI:10.1016/j.ecoser.2012.07.005URL [本文引用: 1]
[本文引用: 2]
[本文引用: 2]
[本文引用: 3]
[本文引用: 3]
[本文引用: 1]
[本文引用: 1]
[本文引用: 1]
[本文引用: 1]
DOI:10.1007/s10531-010-9850-9URL [本文引用: 1]
PMID:23299890 [本文引用: 1]
Forests are of major importance to human society, contributing several crucial ecosystem services. Biodiversity is suggested to positively influence multiple services but evidence from natural systems at scales relevant to management is scarce. Here, across a scale of 400,000 km(2), we report that tree species richness in production forests shows positive to positively hump-shaped relationships with multiple ecosystem services. These include production of tree biomass, soil carbon storage, berry production and game production potential. For example, biomass production was approximately 50% greater with five than with one tree species. In addition, we show positive relationships between tree species richness and proxies for other biodiversity components. Importantly, no single tree species was able to promote all services, and some services were negatively correlated to each other. Management of production forests will therefore benefit from considering multiple tree species to sustain the full range of benefits that the society obtains from forests.
DOI:10.1038/35079573URL [本文引用: 1]
[本文引用: 2]
DOI:10.1016/j.ecoleng.2015.11.027URL [本文引用: 2]
DOI:10.1111/brv.2013.88.issue-2URL [本文引用: 1]
DOI:10.1016/j.envdev.2014.11.005URL [本文引用: 1]
DOI:10.1016/j.geoderma.2012.10.011URL [本文引用: 1]
[本文引用: 1]
DOI:10.1111/aje.v57.4URL [本文引用: 1]
[本文引用: 1]
DOI:10.1016/j.agee.2014.03.045URL [本文引用: 1]
DOI:10.11820/dlkxjz.2014.04.001 [本文引用: 1]
As a frontier and hot topic in ecology and geography, the study of ecosystem services has attracted the interest of many scholars and research institutions. By changing the structure and processes of ecosystems, landuse change affects the provisioning capability of ecosystems for products and services. Study of the relationships between ecosystem processes and services, the relationships among multiple ecosystem services, and the integration and optimization of these services at the regional scale in the context of land-use change urgently needs to be enhanced. The results of such research will be critically important for informing and supporting activities of ecosystem management. This paper introduces the concepts and methods of the study of land- use change and ecosystem services and discusses the shortcomings of existing studies and future prospects of land-use change and ecosystem services research.
[本文引用: 1]
DOI:10.31497/zrzyxb.20200210URL [本文引用: 1]
[本文引用: 1]
[本文引用: 1]
[本文引用: 1]
[本文引用: 1]
[本文引用: 1]
[本文引用: 1]
[本文引用: 1]
DOI:10.13249/j.cnki.sgs.2016.10.012 [本文引用: 1]
As a major water source region of the of South to North Water Diversion Project, Shangluo City was selected as a case study. Water yield sub-model of the InVEST Model and Water Retention Model were used to reveal the spatial heterogeneity and influencing factor of the service of water retention. Through the process of in-situ acquisition, the field calibration and model verification, several conclusions were drawn as the following: 1) The gross amount of water conservation was 2.748×10⁹m3/a, and the capacity of water conservation was 324.85 mm in Shangluo City. The order of the capacity of water conservation of five watersheds was the Xunhe River, the Qianyou River, the Jinqian River, theDanhe River and the Luohe River. 2) Climate factors had the greatest effect on the spatialpattern of water yield capacity, and the land use change in recent 10 years and vegetationand soil properties in different underlying surface impacted significantly on the spatial heterogeneity of water conservation. 3) There was probably a stronger correlation among the space of water yield capacity and mean annual precipitation, actural vaporation, and the effect of plant available. The key driving factors of water conservation function was potentialevaporation, soil saturated hydraulic conductivity and forest cover rate.
[本文引用: 1]
DOI:10.11821/dlxb202003012 [本文引用: 1]
<p id="C3">Ecosystem services, which include water yield services, have been incorporated into decision processes of regional land use planning and sustainable development. Spatial pattern characteristics and identification of factors that influence water yield are the basis for decision making. However, there are limited studies on the driving mechanisms that affect the spatial heterogeneity of ecosystem services. In this study, we used the Hengduan Mountain region in Southwest China, with obvious spatial heterogeneity, as the research site. The water yield module in the InVEST software was used to simulate the spatial distribution of water yield. Also, quantitative attribution analysis was conducted for various geomorphologic and climatic zones in the Hengduan Mountain region by using the geographical detector method. Influencing factors, such as climate, topography, soil, vegetation type, and land use type and pattern, were taken into consideration for this analysis. Four key findings were obtained. First, water yield spatial heterogeneity are influenced most by climate-related factors, among which precipitation and evapotranspiration are the dominant factors. Second, the relative importance of each impact factor to the water yield heterogeneity differs significantly by geomorphologic and climatic zones. In flat areas, the influence of evapotranspiration is higher than that of precipitation. As relief increases, the importance of precipitation increases and eventually, it becomes the most important factor. Evapotranspiration is the most important factor in a plateau climatic zone, while in the mid-subtropical zone, precipitation is the main controlling factor. Third, land use type is also an important driving force in flat areas. Thus, more attention should be paid to urbanization and land use planning, which involves land use changes, to mitigate the impact on water yield spatial pattern. The fourth finding was that a risk detector showed that Primarosol and Anthropogenic soil areas, shrub areas, and areas with slopes <5° and 25°-35° should be recognized as water yield important zones, while the corresponding elevation values are different in different geomorphologic and climatic zones. Therefore, the spatial heterogeneity and influencing factors in different zones should be fully considered in planning the maintenance and protection of water supply services in the Hengduan Mountain region.</p>
[本文引用: 1]
DOI:10.11821/dlxb201807007 [本文引用: 1]
Runoff generation is an important part of water conservation service, and also plays a critical role in soil and water retention. Under the background of the ecosystem degradation, which was caused by the vulnerable karst ecosystem combined with human activity, it is necessary to understand the spatial pattern and impact factors of runoff services in the karst region. The typical karst peak-cluster depression was selected as the study area. And the calibrated and verified Soil and Water Assessment Tool (SWAT) was one of the main techniques to simulate the runoff services of typical karst basin. Further, the spatial variability of different services were analyzed with the assistance of the methods of gradient analysis and local regression. Results indicated that the law of spatial difference was obvious. And the surface runoff was at a low level, but the groundwater runoff was rich (about 2-3 times the surface runoff). The runoff coefficients of total and groundwater were 70.0% and 23.9%, respectively. Terrain is a significant factor contributing to macroscopic control effect on the runoff service in the Sanchahe River Basin, where the total and groundwater runoff increased significantly with the rising elevation and slope. Then, the distribution of vegetation has great effects on surface runoff. There were spatial differences between the forest land in the upstream and orchard land in the downstream, in turn the surface runoff presented a turning point due to the influence of vegetation. Moreover, the results of spatial overlay analysis showed that the highest value of total and groundwater runoff was observed in the forest land. It is not only owing to the stronger capacity of soil water conservation of forest ecosystem, and geologic feature of rapid infiltration in this region, but also reflected the combined effects on the land cover types and topographical features, that is, forest land was mostly distributed in the area with relatively great elevation and slope. Overall, this study will promote the development and innovation of ecosystem services fields in the karst region, and further provide a theoretical foundation for ecosystem restoration and reconstruction.
[本文引用: 1]
[本文引用: 3]
[本文引用: 3]
DOI:10.13287/j.1001-9332.201912.040PMID:31840475 [本文引用: 1]
Ecosystem service value (ESV) in 1997, 2005, 2013 and 2015 of Quanzhou Bay estuary wetland was evaluated dynamicly by market value, alternative value and opportunity cost methods, combined with classification of service indicators and deduplicate computing. The main driving forces for the changes of ESV and the pathway and intensity of their actions were identified using stepwise regression and path analysis methods. The results showed that the main ecosystem services of Quanzhou Bay estuary wetland were flood regulation, climate regulation, and food supply, which were directly driven by water supply, mariculture carrying capacity, and gross value of the regional production. Other drivers exerted indirect effect on the changes of main ESVs.
PMID:31840475 [本文引用: 1]
DOI:10.11821/dlyj020170999 [本文引用: 1]
Based on the 5 phases remote sensing image data of Dongting Lake area in 1995, 2000, 2005, 2010 and 2015, under the support of ArcGIS and Geoda software, this paper used the equivalent factor method, spatial autocorrelation analysis method to estimate the service value of land ecosystem in Dongting Lake area and explore the temporal and spatial changes of land ecosystem service value in the Dongting Lake. The results are shown as follows: (1) The forest area continued to decrease and unused land area increased steadily from 1995 to 2015, cultivated land area kept rising after a large scale reduction in 1995-2000, wetlands area and waters area decreased gradually after a mass increment in 1995-2000, grassland area fluctuated from 1995 to 2015; a great reduction of forest area and significant increment of unused land area dominated the land use changes in this area in recent 20 years. (2) The total service value of land ecosystem in the study area from 2000 to 2015 was declining after the steep increment in 1995-2000, and it decreased by 21.64×10⁸ yuan, or 1.06%, in the past 20 years. The reduction of forest area was the fundamental reason for the decrease of total value of land ecosystem service in Dongting Lake area. The overall increment of wetlands area cut down the reduction margin of land ecosystem service total value. (3) In terms of the change of land ecological service value structure, the other individual ecological service value had been reduced in varying degrees apart from the slight increment of the waste treatment value, and the eco-environment conservation was always the main function of the Dongting Lake area. (4) The spatial autocorrelation of land ecosystem service value distribution was more significant in Dongting Lake area from 1995 to 2015, its high-value and low-value zones tended to be concentrated, and the agglomeration of spatial distribution of land ecosystem service value was enhancing. The spatial distribution pattern of land ecosystem service value changed obviously, the area of high-high value type zones had been reduced in the Yuanjiang River watershed of Changde, but was rapidly extending to Miluojiang River watershed, while low-low value type zones were mainly concentrated in highly concentrated town area in the north, south, west of the Dongting Lake area, and was expanding gradually to form a sheet along the town development axes and important traffic corridors.
[本文引用: 1]
DOI:10.13287/j.1001-9332.201911.031PMID:31833701 [本文引用: 1]
We quantitatively evaluated Thousand-Island Lake's aquatic ecosystem service value and analyzed its developing trend at the whole lake scale. We built an index system to evaluate the ecosystem service of Thousand-Island Lake, which included 16 indicators of 10 categories. The results showed that the total value of ecosystem services of Thousand-Island Lake was 49.3 billion and 57.2 billion yuan in 2007 and 2017, respectively. The highest value of Thousand-Island Lake's ecosystem service was its regulating function, which played an absolutely dominant role. Ranked according to their values, different functions of the final ecosystem services were in a descending order of floodwater regulation, surface water regulation, carbon sequestration (reduction), oxygen generation, tourism, water purification, fishing, energy saving through water source heat pump, water for hydropower, agriculture, forestry and animal husbandry uses of water resources, ecological and public use of water resources, water source for industrial use, volume of freight transportation, water source for city resident use, water circulation cooling, and passenger transportation. Thousand-Island Lake provided a total ecosystem services value of 86.0 million and 99.8 million yuan·km, which was 47.6 and 17.3 times as the GDP per area in Chun'an County in 2007 and 2017.
PMID:31833701 [本文引用: 1]
[本文引用: 1]
[本文引用: 1]
[本文引用: 1]
[本文引用: 1]
PMID:16180767 [本文引用: 1]
With the measurement of net primary productivity and vegetation coverage fraction based on remote sensing data,the terrestrial ecosystem service value of China in 2000 was quantitatively estimated as 9.17 x 10(12) yuan (RMB). The spatial distribution of the ecological service value showed a decreasing trend from southeast China to northwest China, which was consistent with the regional distribution of vegetation types. The service value varied with different vegetations, e. g., forests had the highest service value of 18 789 yuan x hm(-2), accounting for 40.80% of the total terrestrial ecosystem service value, and bushes and farmlands had a higher service value of 13 789 yuan x hm(-2) and 13054 yuan x hm(-2), which was 10.79% and 24.23% of total value, respectively. The service value was also varied with different ecosystem functions, i.e., gas regulation contributed the highest value of 45.16% to the total service value, and the contribution of soil conservation and water conservation was 28.83% and 14.44%, respectively. The integrated approach coupling ecology and remote sensing data provided a new method to measure the ecological service value, which could estimate the value objectively and spatial-explicitly. However, some uncertainties still existed in this approach, which should be improved in the future studies.
PMID:16180767 [本文引用: 1]
PMID:19459385 [本文引用: 1]
This paper quantitatively evaluated the economic forest ecosystem services in the provinces of China in 2003, based on the long-term and continuous observations of economic forest ecosystems in this country, the sixth China national forest resources inventory data, and the price parameter data from the authorities in the world, and by applying the law of market value, the method of substitution of the expenses, and the law of the shadow project. The results showed that in 2003, the total value of economic forest ecosystem services in China was 11763.39 x 10(8) yuan, and the total value of the products from economic forests occupied 19.3% of the total ecosystem services value, which indicated that the economic forests not only provided society direct products, but also exhibited enormous eco-economic value. The service value of the functions of economic forests was in the order of water storage > C fixation and O2 release > biodiversity conservation > erosion control > air quality purification > nutrient cycle. The spatial pattern of economic forest ecosystem services in the provinces of China had the same trend with the spatial distribution of water and heat resources and biodiversity. To understand the differences of economic forest ecosystem services in the provinces of China was of significance in alternating the irrational arrangement of our present forestry production, diminishing the abuses of forest management, and establishing high grade, high efficient, and modernized economic forests.
PMID:19459385 [本文引用: 1]
[本文引用: 1]
[本文引用: 1]
[本文引用: 1]
[本文引用: 1]
[本文引用: 1]
[本文引用: 1]
DOI:10.13249/j.cnki.sgs.2019.04.018 [本文引用: 1]
Ecosystem service value (ESV) is not only one of the important parameters to study regional ecological economic harmony, but also a key indicator to improve the sustainable development. In recent years, based on remote sensing data, the ESV model has been gradually developed and widely used, whereas it is lacking in the application of regional ESV dynamic monitoring year by year. Here, the optimal spatial resolution and long time series of remote sensing data was selected by analyzing the scale effect, and regional ESV dynamic monitoring of year level was carried out on the pixel scale from 2001 to 2013 in Central Plains Urban Agglomeration region. The results showed that: 1) The range of the optimal spatial resolution was 30 m to 1 000 m for multi-source remote sensing data, and the relative deviation of the estimation results of different scales was less than 0.4%. With the demand of dynamic monitoring, the MODIS data products (spatial resolution was 500 m, and time scale was 1 year) were selected as the optimal data source for ESV model. 2) The total value of ESV in the study region showed a significant increasing trend from 2001 to 2013, with an increase of approximately 860 million yuan/a, but experienced three fluctuations in the continuous increasing process, and the performance was more and more intense. The dynamic change of ESV in the study region was uneven in the spatial distribution, and the growth area was slightly larger than the degraded area. Overall, the method of this article was simple and feasible, and the quasi-business operation of ESV remote sensing model was implemented.
[本文引用: 1]
DOI:10.1016/j.ecoser.2017.07.012URL [本文引用: 1]
[本文引用: 1]
[本文引用: 1]
PMID:32854880 [本文引用: 1]
Increasing global pressure on natural resources requires that decision makers and land managers adopt sustainable solutions to ensure the long-term provision of essential ecosystem services (ES). Analysing the effects of land-use changes on ES can contribute to an improved understanding of the interactions between socio-economic development, landscape changes and ES, which is fundamental in order to avoid or mitigate the undesired consequences of today's decisions. Studies at longer timescales are still underrepresented, but are also fundamental for capturing slow social and ecological processes. This study therefore analysed the impacts of land-use/land cover (LULC) changes on ES values from the past to the future (1860-2100) in the Autonomous Province of South Tyrol (Italy). Future scenarios were based on socio-economic storylines and their spatial distribution mapped. By attributing ES values to LULC types, we assessed changes in ES values as well as their spatial patterns. Our results indicate that the abandonment of mountain grassland induced an ongoing shift in ES at higher elevations, from grassland-related ES towards forest-related ES. The intensification of use in the valley bottoms had predominantly negative effects on regulation & maintenance, and cultural ES in the past. Under future scenarios, changes in ES values at lower elevations greatly depend on expected socio-economic development. Negative effects on regulation & maintenance and cultural ES were highest for the 'Food sovereignty' scenario due to huge transformations of grassland and permanent cultures to arable land in order to optimise food provision at the regional level. In contrast, under the 'Liberalisation' and 'Rewilding' scenarios, there were positive trends for forest-related provisioning ES and less negative effects on regulation & maintenance and cultural ES within the study area, but the dependence on imported products increased. Our findings provide valuable information for decision-making and policy development in order to minimise negative consequences through targeted management measures or payments for environmental services.Copyright © 2020 The Authors. Published by Elsevier Ltd.. All rights reserved.
URL [本文引用: 1]
DOI:10.1007/s10980-020-01037-1URL [本文引用: 1]
DOI:10.1016/j.cosust.2012.12.002URL [本文引用: 1]
[本文引用: 1]
[本文引用: 1]
[本文引用: 1]
[本文引用: 1]
URL [本文引用: 1]
DOI:10.1257/jep.15.4.143URL [本文引用: 2]
[本文引用: 1]
[本文引用: 1]
[本文引用: 1]
[本文引用: 1]
[本文引用: 1]
[本文引用: 1]
[本文引用: 1]
[本文引用: 1]
[本文引用: 1]
[本文引用: 1]
DOI:10.13287/j.1001-9332.201612.031PMID:29704335 [本文引用: 1]
With the technology of geographic information system (GIS), the ecosystem service va-lue (ESV) coefficient of different types of land use in Dongting Lake area was estimated in this paper by interpreting the remote-sensing image for years and combining its economic development statistics. Meanwhile, the temporal-spatial evolvement characteristics of the ESV were investigated by employing the methods of spatial statistics analysis such as spatial autocorrelation, highland clustering analysis and hotspot analysis. The results showed that the ESV of Dongting Lake area increased slightly during 2000-2013, from 3868.39 billion yuan to 3886.62 billion yuan due to the increase of wetland in the area. The areas with high ESV and low ESV were infiltrated into each other, while the areas with second high ESV embraced those areas with high and low ESV. The characteristics of ESV and its dynamic evolvement in Dongting Lake area were obviously of spatial autocorrelation and high and low value clustering, but the trend was weakened. The focus of ESV hotspot of Dongting Lake area moved to northwest slightly with a "S" track in a obviously phased manner of "quick-slow-quick".
PMID:29704335 [本文引用: 1]
DOI:10.11821/dlyj201504008 [本文引用: 1]
With the rapid development of Chinese economy, many negative effects of land use transitions under the pressure of rapid urbanization on local ecological system and environment have occurred. This paper examines the dynamic patterns of land use transitions in Hunan province, using high-resolution Landsat TM (Thematic Mapper) data in 1995, 2000, 2005 and 2010, and socio-economic data from both research institutes and government departments, and assesses the changes of ecosystem services value (ESV) by drawing a connection between the observed land use dynamics and the evaluation of ESV, based on the latest research of Costanza et al. and some revisions adapted to the situation of China. The outcomes indicated that, during the period from 1995 to 2010, the land use changed significantly, characterized by the increase of construction land and the decrease of cultivated land and grassland; ESV of the study area decreased by 0.42%, from 880.78 to 877.09 billion RMB, due to the losses of large quantities of ecological land to construction land. Then, some of the major implications for improving the land use of Hunan province were discussed. The authors argue that it is fundamental to meet the demand of construction land for socio-economic development, meanwhile, to protect regional ecosystem services function and maintain its stability; only in this way Hunan province may realize the sustainable use of ecological resources in the process of rapid urbanization, as well as the integration of economic, social and ecological benefits.
[本文引用: 1]
DOI:10.18306/dlkxjz.2018.01.015 [本文引用: 1]
Ecosystem services bridge the natural environment and human well-being, and are the key content of coupled human-environment system research. This article puts forward a framework of research on ecosystem services for coupled human-environment systems, and systematically reviews the research hotspots of ecosystem services evaluation, ecosystem services trade-offs, ecosystem services driving factors, ecosystem supply-flow-demand, and identifies the key areas for future ecosystem services research. This article argues that: (1) international research on ecosystem services models have experienced a rapid development, and SAORES model is the outstanding representative of ecosystem service evaluation model in China; (2) ecosystem service trade-off analyses are relatively complex, and its mechanism depends on distinguish the relationships among ecosystem structure-process-function-service at multiple spatial and temporal scales; (3) natural factors are the basis of ecosystem services distribution, land use change can modify ecosystem structure, function, and services, and social and economic factors can lead to differences in ecosystem services trade-off and demand; (4) in order to clarify the coupling relationship between ecosystem service supply and demand, it is urgently needed to further identify the pathes of ecosystem service flowes; (5) future research of ecosystem services should include strengthening the analyses on the response of ecosystem services to global change, ecosystem services supply and demand flow focusing on the sustainable development aspect, integration and optimization of the dynamic evaluation of ecosystem services, the coupling of ecosystem services and human-environment systems, and the integration of ecosystem services and big data.
[本文引用: 1]
DOI:10.11821/dlxb201704001 [本文引用: 1]
For the sake of adapting to the changes of elements in both kernel system and external system of rural development, rural restructuring is a process of optimally allocating and efficiently managing the material and non-material elements affecting rural development, reshaping social and economic structures in rural areas and optimizing spatial pattern in rural territory, and approaching the structure optimization and function promotion of rural territorial system as well as the structure coordination and function complementation of urban-rural territorial system. Based on elaborating the concept and connotations of rural restructuring and the mechanism of promoting rural restructuring due to the evolution of "elements-structure-function", the paper probed the approaches of rural restructuring from the aspects of spatial restructuring, economic restructuring and social restructuring. In order to meet the current national strategic demands and meet the challenges of rural development in the process of urban-rural development transformation, it is in great urgency to strengthen the study on the patterns and processes, dynamic mechanism, differentiated development models, rural planning technology systems, strategies and policies for rural development, and the impacts of globalization on China's rural restructuring in the future. Finally, focusing on a series of problems in the implementation of some important government intervention policies, which is aimed at boosting the social and economic development of rural areas in recent years, a critical analysis and discussion is carried out.
[本文引用: 1]
