 ,1,2, 李忠勤,1, 张慧1, 徐春海1,3
Vulnerability of glacier change in Chinese Tianshan Mountains
CAI Xingran,1,2, LI Zhongqin,1, ZHANG Hui1, XU Chunhai1,3通讯作者:
收稿日期:2020-06-5修回日期:2021-04-16
| 基金资助: |
Received:2020-06-5Revised:2021-04-16
| Fund supported: |
作者简介 About authors
蔡兴冉(1993-), 女, 山东济宁人, 博士生, 主要从事冰冻圈与可持续发展研究。E-mail:

摘要
关键词:
Abstract
Keywords:
PDF (3686KB)元数据多维度评价相关文章导出EndNote|Ris|Bibtex收藏本文
本文引用格式
蔡兴冉, 李忠勤, 张慧, 徐春海. 中国天山冰川变化脆弱性研究. 地理学报, 2021, 76(9): 2253-2268 doi:10.11821/dlxb202109015
CAI Xingran, LI Zhongqin, ZHANG Hui, XU Chunhai.
1 引言
作为“固体水库”的冰川,在新疆水资源构成和河川径流调节方面起着双重作用。一方面,冰川融水在地表径流中占有重要比重;另一方面,冰川在年际和年内两种尺度上对河川径流进行“削峰填谷”作用。冰川在提供丰富淡水资源同时也易引发冰川洪水、冰湖溃决等灾害,威胁下游地区的社会经济发展及人民生命财产安全[1]。气候变暖背景下,全球冰川普遍处退缩状态,冰川变化及其影响引起了国内外****的广泛关注,如何应对冰川变化所产生的一系列(生态、自然、社会经济方面)影响,已成为当下亟需面对的重要现实和战略问题。而冰川及其变化的脆弱性研究是制定应对冰川变化措施的关键[2]。“脆弱性”概念由法国****Albinet和Margat于20世纪70年代提出,被用于地下水系统评估[3]。随后在脆弱性概念研究的不断拓展与多学科相互交融的背景下,脆弱性内涵朝着一维到多维、简单到复杂的方向发展。冰川变化脆弱性是在冰冻圈变化脆弱性基础上引申而来,国际上关于冰川变化脆弱性研究尚处于起步阶段。国内自2007年逐步展开冰川变化脆弱性研究,尚处于探索阶段。目前冰川脆弱性研究主要包括:冰川自身对气候变化的脆弱性和冰川变化脆弱性即各类系统对冰川变化负面影响的敏感程度,由暴露度、敏感性、适应能力构成[2]。基于系统对冰冻圈变化脆弱性的研究成果主要集中于以下4个方面:① 对冰冻圈变化的影响及脆弱性进行系统梳理,提出关键问题并明确研究方向。如丁永建等[4]、王世金等[5]基于冰冻圈与地球其他圈层的相互作用,系统阐述了冰冻圈变化对区域社会经济的影响。② 冰冻圈变化脆弱性评估体系的构建与度量,不同****根据研究区特点,科学、客观地选择评估因子,并采用相关赋权方法计算脆弱性指数。常采用的有特尔菲法[6]、模糊模式交叉迭代法[7]和主成分分析方法[8]等。③ 不同系统对冰冻圈变化的脆弱性研究,其中包括人类环境系统、社会经济系统与水资源系统等,如姚檀栋等[9]、He等[10]研究了冰川变化对区域水循环和人类社会的影响。④ 冰冻圈变化脆弱性与适应结合研究,脆弱性研究是连接影响与适应的纽带,形成了“影响—脆弱性—适应对策”研究主线。Bhadwal等[11]、Grossi等[12]、Pan[13]及Thorsteinsson等[14]对印度北部喜马拉雅山、曼陀罗和叶尔羌河流域冰川变化影响下的水资源系统脆弱性进行了评估,并基于此制定相应的适应方案。可见已有较多成果将冰冻圈作为一个整体研究其脆弱性,而针对冰冻圈单一要素—冰川变化脆弱性研究较少。
天山深居亚欧大陆内部,是中国现代冰川主要分布区之一,丰富的冰川资源为新疆社会经济发展、自然资源利用以及特色绿洲农业发展等提供了有力的水资源保障[15]。全球变暖驱动下,天山冰川普遍处于物质亏损状态, 尤其自20世纪80年代以来呈现加速消融[16]。2090年前中国天山北麓诸河80%的冰川、伊犁河流域88.6%的冰川会消失殆尽,在此之后会导致冰川融水径流锐减,大大削弱对河川径流的调节作用,间接影响该区水资源的可持续利用[17]。加强该区冰川变化脆弱性研究对区域水资源、生态环境及社会经济发展等具有重要现实意义。然而目前天山地区的冰川研究主要集中于冰川面积[18,19]、冰川储量[20,21]、冰川径流[22,23,24]、冰川物质平衡[25,26]以及冰川消融对水资源的影响[27,28]等方面,亟待开展脆弱性研究。为此,本文以该区为例,从暴露度、敏感性、适应能力对冰川变化的脆弱性进行分析,探讨冰川变化脆弱性各维度之间的相互关系及其对冰川变化适应能力的影响,以期提高对中国天山冰川变化脆弱性的认识与理解,为应对冰川变化及其影响提供科学指导与决策支持。
2 研究区概况
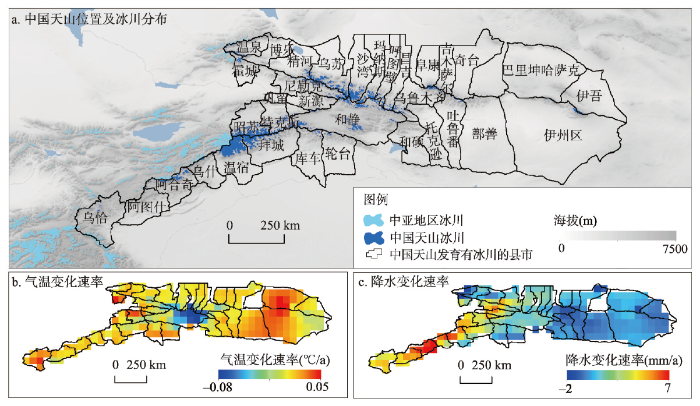
中国天山又称东天山,呈东西走向,西起中国与吉尔吉斯斯坦边界,南临塔里木盆地,北接准噶尔盆地,东至哈密市以东星星峡戈壁,长约1700 km[29]。天山山系由3列山脉组成,依次为北天山、中天山和南天山,将新疆分成南北两部分,地貌上与昆仑山—塔里木盆地—准噶尔盆地—阿勒泰山共同形成“三山夹两盆”的地貌特征,垂直结构明显,以阶梯地貌为主,山脉平均海拔4000 m以上,托木尔峰为其最高峰(7443.8 m)。受其独特地理位置的影响,天山山区大陆性气候显著,气温和降水从西北至东南呈递减趋势[30]。年内降水主要集中于夏季,年最大降水量为600~800 mm,最小降水量约为150 mm,多年平均降水量介于250~300 mm[31]。气温空间差异显著,多年平均气温约为5.0 ℃,南坡年平均气温明显高于北坡,分别为7.5~10.0 ℃和2.5~5.0 ℃[32]。据第二次中国冰川编目,天山共发育冰川7934条,面积约为7179.78 km2,储量约为756.48 km3 [33]。天山山区也是众多河川径流的发源地,包括天山北坡的博尔塔拉河、伊犁河、精河以及南坡的阿克苏河、开都河、孔雀河等。天山冰川分属于伊犁河内流水系、塔里木内流水系、吐鲁番—哈密内流水系和准噶尔内流水系,其中准噶尔内流水系的冰川数量最多,吐鲁番—哈密内流水系的冰川数量最少[34]。行政区划上,天山冰川分布于新疆维吾尔自治区的“一市(乌鲁木齐市)、四区(阿克苏地区、塔城地区、哈密地区和吐鲁番地区)、五自治州(昌吉回族自治州、巴音郭楞蒙古自治州、博尔塔拉蒙古自治州、克孜勒苏柯尔克孜自治州和伊犁哈萨克自治州)”,其中阿克苏地区冰川面积总量最大(2988.60 km2),吐鲁番地区最小(16.40 km2),共涉及34个县市。图1
 新窗口打开|下载原图ZIP|生成PPT
图1天山冰川分布及1961—2010年气温和降水变化速率
Fig. 1The glacier distribution of Chinese Tianshan Mountains and its air temperature and precipitation change rates in 1961-2010
3 数据及方法
3.1 数据
本文使用的数据包括冰川数据、数字高程模型(DEM)、气象数据和社会经济数据。其中冰川数据来自第一次和第二次中国冰川编目,第一次冰川编目的数据为1959—1980年航拍的1:5万、1:10万及1:2.5万地形图,在量测之前,先利用航空像片校准地形图上的冰川轮廓,并基于野外考察资料对地形图进行全面修订和校对。第二次冰川编目采用当前国际通用的遥感和GIS方法,以Landsat TM/ETM+遥感卫星数据为冰川边界描绘主要数据源,并以自主研发的冰川区山脊线提取方法来提取冰川区分冰岭,结合人工修订,进而形成最终的冰川边界数据。第二次冰川编目中的冰川面积绝对误差值和相对误差值分别为±1411 km2和3.2%[35]。本文使用冰川变化数据主要依据邢武成等结果[18]。第二次中国冰川编目天山地区冰川影像获取时间为2006年、2007年、2009年和2010年,其中2006年影像勾绘的冰川条数只有0.6%,大部分冰川主要涉及2007年、2009年和2010年的影像。考虑到冰川每年的面积变化不大,同时也为了便于统计与计算,本文以1960年和2010年分别作为天山山区第一、二次冰川编目年份[33],冰川编目数据来自国家冰川冻土沙漠科学数据中心(3.2 研究方法
3.2.1 指标体系构建 在客观性、科学性、可比性和可操作性原则指导下,本文从人地关系视角出发,采用目标层—准则层—指标层逐级递减的方式组织研究框架,将自然地理特征、人口状况、社会经济水平等因素纳入冰川变化脆弱性评估体系,综合评估天山地区冰川变化脆弱性。评估指标体系和评估框架见表1和图2。Tab. 1
表1
表1天山冰川变化脆弱性评估指标体系
Tab. 1
| 准则层 | 指标层 | 综合权重 | 指标说明 |
|---|---|---|---|
| 暴露度 | 冰川面积相对变化率(%) | 0.11 | 以2期冰川面积差值反映面积变化[18] |
| 冰川储量相对变化率(%) | 0.02 | 以2期冰川储量差值反映储量变化[27] | |
| 冰川末端海拔(m) | 0.03 | 反映冰川冰舌末端高度变化 | |
| 冰川海拔分布(m) | 0.03 | 基于DEM数据对冰川海拔分布统计,以反映冰川发育条件 | |
| 城镇化率(%) | 0.04 | 反映城镇化进程受冰川变化所带来的间接影响 | |
| 地区GDP(万元) | 0.07 | 反映行政区整体经济发展水平 | |
| 人口密度(人/km2) | 0.06 | 反映冰川变化影响下区域范围内人口的密集程度 | |
| 敏感性 | 气温变化率(℃/10a) | 0.03 | 反映气温变化 |
| 降水变化率(mm/10a) | 0.05 | 反映降水变化 | |
| 粮食总产量(t) | 0.07 | 反映行政区粮食生产能力 | |
| 人均有效灌溉面积(hm2) | 0.04 | 反映地区水资源丰富程度及其在农业生产过程中的稳定度 | |
| 适应 能力 | 农村居民人均纯收入(万元) | 0.02 | 反映农村居民生产水平与生活质量的变化 |
| 人均GDP(万元) | 0.09 | 反映地区经济运行状况与人民生活水平 | |
| 城镇固定资产投资完成额(万元) | 0.08 | 反映区域资本投资规模、结构与发展速度 | |
| 教育水平(人) | 0.06 | 采用普通中学在校生数,反映教育普及程度与教育设施水平 | |
| 医疗水平(张) | 0.07 | 采用医院床位数,反映医疗基础设施完备水平 | |
| 农业生产总值(万元) | 0.04 | 反映农业生产规模与水平 | |
| 第二产业增加值(万元) | 0.10 | 反映第二产业发展所带来的收益 |
新窗口打开|下载CSV
图2
 新窗口打开|下载原图ZIP|生成PPT
图2天山冰川变化脆弱性评估框架
Fig. 2Vulnerability assessment framework of glacier change in Chinese Tianshan Mountains
(1)暴露度指系统受外在压力或胁迫的不利程度。冰川变化的暴露度为自然地理位置胁迫、气候变化而导致冰川的承受压力以及社会经济承担能力共同作用的结果,包括自然暴露与社会经济暴露。本文采用冰舌末端高度、海拔分布反映冰川发育的自然条件,冰川面积变化率和储量变化率表征冰川变化的暴露强度,共同衡量区域自然暴露度。考虑到天山各县市经济发展现状、发展速率差异、城镇化进程及人口分布不均等因素,社会经济暴露指标选取地区GDP、城镇化率和人口密度。
(2)敏感性指系统中各要素对冰川变化的响应程度。研究将冰川变化的敏感性与气候要素、农业活动相联系,关注以人为本的农业活动中水资源利用受到影响或改变的程度。一方面,气候要素中气温、降水与冰川密切相关,气温决定冰川消融,固态降水决定冰川积累,二者共同作用决定了冰川的形成、发育与演化[4]。另一方面,冰川资源对其径流补给率直接影响农业活动中水资源的利用。因此,本文选取天山各县市的年均气温变化率、年均降水变化率、粮食总产量、人均有效灌溉面积表征冰川变化的敏感性。
(3)适应能力指人类主体在面对实际或预测的冰川变化影响下,采取有效措施的总和。本研究主要考虑社会、经济系统双重作用下冰川变化的适应能力。人均GDP、城镇固定资产投资完成额与第二产业增加值反映了区域经济整体发展水平的高低以及是否具有采取高水平、高科技适应措施的经济能力。此外,教育与医疗水平间接反映区域经济实力,为此将其纳入适应能力评价体系。农村居民人均纯收入与农业生产总值反映了区域农业发展水平,冰川变化会引起水资源的变化,而水资源是农业发展的决定要素,为此水资源系统的变化对农业活动具有主导作用。
3.2.2 脆弱性评估模型 根据相关****研究,脆弱性是由系统暴露度、敏感性和适应能力构成的函数,但由于各维度指标数据的计量单位以及数值大小不同,在进行脆弱性分析之前,为实现数据之间的可比性,在计算过程中采用极差标准化方法对正负指标数据进行标准化处理,以实现数据的无量纲化,并采用改进熵值法确定指标权重(表1)[36]。脆弱性指数V计算为:
式中:E为暴露度;S为敏感性;A为适应能力。该模型反映了脆弱性与3个维度之间的内在逻辑关系,系统暴露度越高,敏感性越强,适应能力越小,系统脆弱性越大;反之,系统脆弱性越小。
3.2.3 空间自相关
(1)全局自相关
为对天山地区34个县市空间整体特征进行分析,采用全局自相关模型分析34个县市冰川变化脆弱性的整体分布情况,以判断天山冰川变化脆弱性在空间上是否具有集聚性。依据相关脆弱性研究,常采用的检验统计量是Moran's I指数[37]:
式中:
(2)双变量空间自相关
为描述多变量间的相关空间分布特征,采用Anselin提出的双变量空间自相关模型[38],检验暴露度和敏感性、暴露度和适应能力以及敏感性和适应能力的空间相关性:
式中:
3.2.4 地理探测器模型 地理探测器模型是由王劲峰等提出的分析空间分异性并探测其内部主导因素的统计学方法,主要包括风险探测、因子探测、交互探测与生态探测4个部分,其本质思想是若因变量对自变量的发展具有重要作用,则因变量与自变量在空间上具有相似的分布特征或空间变化具有一定的一致性[39]。本文中地理探测器模型主要涉及因子探测与交互探测。
(1)因子探测
因子探测是采用定量化的方法分析影响因素对冰川变化适应能力的解释程度,即各影响因素在适应能力中所起到的重要性大小,用PD, E值表示:
式中:PD, E为影响因子D的因子解释力,PD, E值在0到1之间,PD, E值越趋近于1,表明影响因子D对适应能力影响程度越大;N为冰川变化适应能力;
(2)交互探测
交互探测是识别影响因素之间是否具有交互作用,即影响因子a与影响因子b共同作用时对冰川变化适应能力的解释力是否具有增强或减弱作用,或某因子单独对冰川变化适应能力发挥作用,因子之间相互独立,不存在相互影响。确定因子间是否具有交互作用,采用表2中的公式计算[39]。
Tab. 2
表2
表2交互探测类型
Tab. 2
| 类型 | 公式 | |
|---|---|---|
| 增强 | 普通 | PD, E (D1∩D2) > PD, E (D1) 或 PD, E (D2) |
| 双线性 | PD, E (D1∩D2) > PD, E (D1) 且 PD, E (D2) | |
| 非线性 | PD, E (D1∩D2) > PD, E (D1) + PD, E (D2) | |
| 削弱 | 普通 | PD, E (D1∩D2) < PD, E (D1) + PD, E (D2) |
| 双线性 | PD, E (D1∩D2) < PD, E (D1) 或 PD, E (D2) | |
| 非线性 | PD, E (D1∩D2) < PD, E (D1) 且 PD, E (D2) | |
| 相互独立 | 普通 | PD, E (D1∩D2) = PD, E (D1) + PD, E (D2) |
新窗口打开|下载CSV
4 结果与分析
4.1 中国天山冰川变化脆弱性空间分 异特征
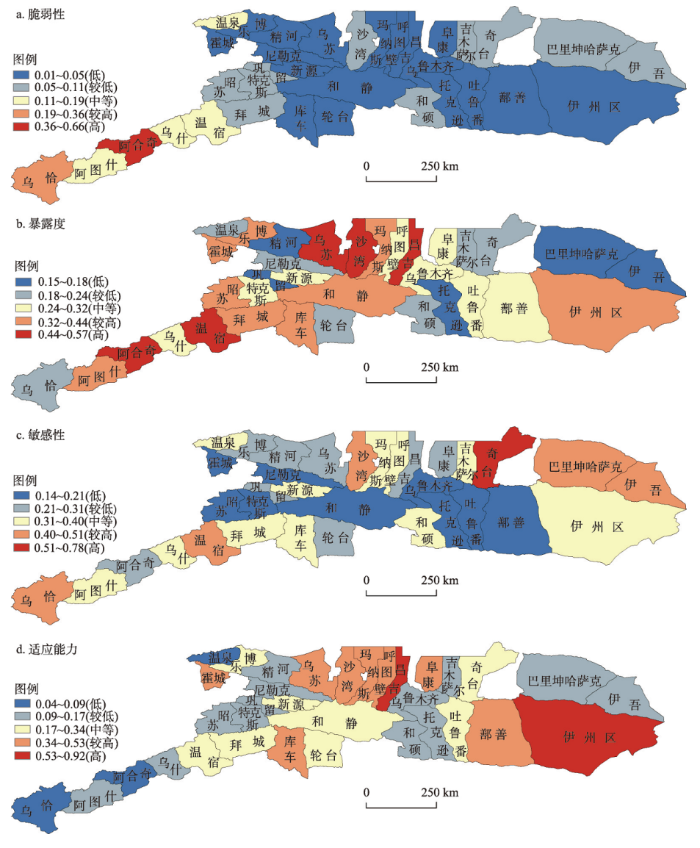
根据冰川变化脆弱性模型计算出天山各县市冰川变化脆弱性指数,运用ArcGIS软件中自然断点法,将脆弱性、暴露度、敏感性以及适应能力指数由低至高依次划分为5个等级,得到天山各县市冰川变化脆弱性空间分布图。4.1.1 脆弱性等级由西部地区向东部地区降低,水平差异显著 天山冰川变化脆弱性整体呈现出由西向东降低趋势,西部地区以高与较高等级为主,东部地区以低与较低等级为主。县市上,高与较高脆弱性仅分布在西部的阿合奇县与乌恰县,脆弱性指数分别为0.66和0.36;中等脆弱性主要分布在西部的阿图什市、乌什县、温宿县以及中部的温泉县,脆弱性指数分别为0.13、0.16、0.19和0.13;较低与低脆弱性主要分布在中部的昌吉市、和静县等以及东部的鄯善县、奇台县和伊吾县等,脆弱性指数分别为0.02、0.04、0.02、0.08和0.11。整体上天山地区冰川变化脆弱性主要集中在低、较低和中等脆弱3个等级,不同脆弱性等级县市个数为:低度脆弱>较低脆弱>中等脆弱>较高脆弱=高度脆弱,其对应县市个数占比分别为50.00%、32.35%、11.77%、2.94%和2.94%(图3a)。
4.1.2 暴露度高值集聚西、中地区,低值分散分布 天山冰川变化脆弱性主要来源于自然暴露与社会经济暴露,如气候变暖背景下冰川面积、储量变化以及地区生产总值的增减、人口快速增长等自然与社会条件的制约。由图3b所示,暴露度在天山西部、中部地区与东部地区差异明显,暴露度高值集中分布在西部的阿合奇县和温宿县以及中部的乌苏县、沙湾县和昌吉市,暴露度指数分别为0.55、0.52、0.50、0.58 和0.52;较高值集聚分布在中部的玛纳斯县、和静县、库车县等,暴露度指数分别为0.44、0.41和0.34。中等值及以下集中分布在东部的吐鲁番市、鄯善县、伊吾县等,分散分布在中部地区的新源县、特克斯县、呼图壁县等。通过对天山冰川变化暴露度高低进行排序,结果表明天山冰川变化暴露度普遍较高,中等暴露度以上县市个数占总县市的61.76%。
4.1.3 东、西部地区高敏感,中部地区低敏感 天山冰川变化的敏感性呈现出东、西部高和中部低的空间分布格局(图3c)。“东、西”为高和较高敏感性县市集聚区,“西”指西部地区的乌恰县—库车县连线,敏感性最高的是温宿县,指数为0.52;“东”指东部地区的伊吾县—沙湾县连线,敏感性最高的是奇台县,指数为0.78。中部地区以中等及其以上敏感性为主,敏感性最高的是乌什县,指数为0.40。整体上天山冰川变化的敏感性以中等敏感性为主,县市个数占总县市的32.35%;其次是低与较低敏感性,分别占26.47%和23.53%;最后是高与较高敏感性,共占17.65%,主要分布在冰川面积较少且以小冰川为主的区域。
图3
 新窗口打开|下载原图ZIP|生成PPT
图3天山冰川变化脆弱性空间分布
Fig. 3Spatially distributed vulnerability levels of glacier change in Chinese Tianshan Mountains
4.1.4 适应能力由西—中—东呈圈状递增 天山冰川变化脆弱性的应对能力空间结构特征与脆弱性等级相反,呈现出由西—中—东圈状递增分布格局(图3d)。该格局中,“西”指天山适应能力低、较低的区域,“中”指冰川分布较为集中且适应能力中等、高的区域,“东”指冰川零星分布且适应能力高、较高的区域。从县市来看,西部地区的阿合奇县、乌怡县适应能力最低,中部地区的昌吉市、玛纳斯县、沙湾县等适应能力较高,东部地区的伊州区、鄯善县等适应能力最高。天山各县市适应能力个数排序为:较低适应>中等适应=较高适应>低适应>高适应,对应县市个数分别为13、8、8、3和2,总体上天山对冰川变化的适应能力普遍较低,以中等及其以下适应能力为主。
综上所述,天山西部地区对冰川变化具有高暴露、高敏感的系统环境,有最低水平的适应能力,冰川变化的脆弱性较高;中部地区处于高暴露的系统环境,但敏感性较低,有一定应对冰川变化影响的适应能力,冰川变化的脆弱性较低;东部地区处在低暴露、高敏感的系统环境,有应对冰川变化影响的适应能力,在全区域范围内脆弱性最低。
4.2 空间全局自相关特征
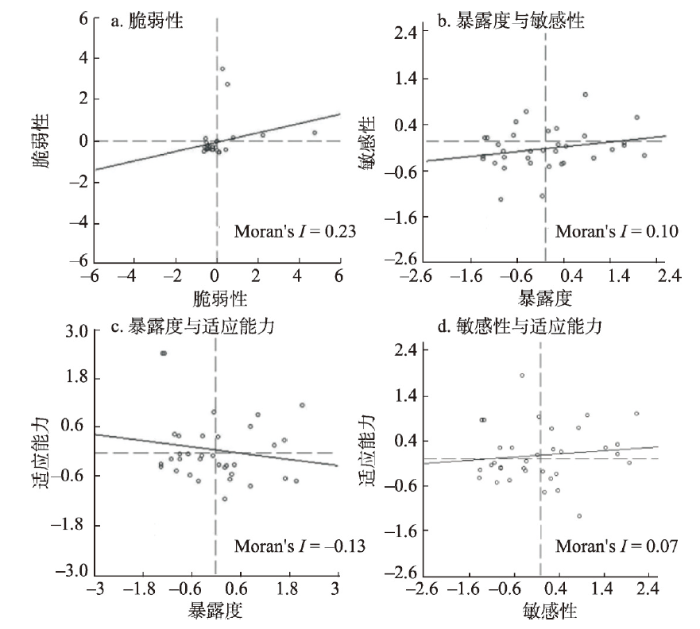
选择Moran's I指数与散点图对天山34个县市冰川变化脆弱性指数进行空间全局自相关分析,天山冰川变化脆弱性Moran's I指数为0.23,通过0.01水平的显著性检验,Z值为2.77,表明天山冰川变化脆弱性存在显著的空间正相关关系,大部分脆弱性指数散点分布于第一和三象限,只有较少脆弱性指数分布于第二、四象限(图4a),即冰川变化脆弱性指数在区域内存在高指数与高指数相邻,低指数与低指数相邻的集聚状态与相互依赖性。图4
 新窗口打开|下载原图ZIP|生成PPT
图4天山冰川变化脆弱性及各维度空间关系
Fig. 4Spatial relationship between the vulnerability of glacier change and different dimensions in Chinese Tianshan Mountains
为研究脆弱性3个维度暴露度、敏感性和适应能力之间是否存在空间相关性,进一步进行双变量空间自相关分析。由于暴露度在较大程度上取决于自然地理条件,因此分别探讨34个县市暴露度与敏感性、适应能力的空间相关性。暴露度与敏感性空间相关性结果如图4b所示,Moran's I指数为0.10,通过0.05水平的显著性检验,表明暴露度与敏感性空间上存在正相关关系,系统对冰川变化影响的暴露度高(低)指数分布区与敏感性高(低)指数分布区相邻集聚分布。图4c显示暴露度与适应能力的空间相关性结果,Moran's I指数为-0.13,通过0.05水平的显著性检验,表明暴露度与适应能力空间上存在显著的负相关关系,天山地区对冰川变化影响的暴露度高(低)指数分布区与适应能力低(高)指数分布区相邻集聚分布。图4d显示敏感性与适应能力的空间相关性结果,Moran's I指数为0.07且仅大于0,表明敏感性与适应能力空间上存在微弱正相关关系,一定程度上天山地区对冰川变化敏感性高(低)指数分布区与适应能力高(低)指数分布区相邻集聚分布。以上表明天山冰川变化具有高暴露、高敏感地区往往适应能力较低,进而导致系统脆弱性较高,而低暴露、低敏感地区则拥有较高的适应能力,系统的脆弱性也相较偏低。
5 冰川变化适应能力影响因素
5.1 变量选择
杨建平等通过空间主成分分析方法解释了中国冰川变化脆弱性的地理差异,坡向、海拔、地形遮蔽度和冰川面积变化率是导致冰川脆弱性的主要因素[2]。基于对冰川变化的主要相关因素,以及案例区冰川变化脆弱性空间分布剖析中相关因子的研究,试图探索冰川变化脆弱性影响因素及其空间特征,但因暴露度较大程度上取决于自然地理条件,敏感性主要受制于气温和降水的变化,进而间接影响暴露度因素,两个维度之间具有一定的相互作用,同时暴露度维度较为稳定,敏感性维度年际变化波动较小,且两个维度受社会经济影响较小,在短期内不易发生较大改变。而短期内适应能力最易受政策、社会、经济等因素影响,因此,研究意在从人地关系中探讨自然、社会、经济、人口等要素对天山地区冰川变化适应能力影响的差异,选择适应能力指数作为被解释变量,以县市所在的地形地貌、经济发展水平、就业水平、社会生活质量、人口规模、社会服务为解释变量构建影响因素评价体系。解释变量分别为:海拔(X1)、城镇固定资产投资额(X2)、第二、三产业产值(X3)、农林牧渔服务业总产值(X4)、年末单位从业人员数(X5)、地方财政收入(X6)、农牧民人均纯收入(X7)、城镇人口数(X8)、邮政业务量(X9)、中学以上在校人数(X10)、专业卫生技术人员(X11)。5.2 影响因素解释力分析
以县市行政单元为研究尺度,利用GeoDetector软件对天山冰川变化适应能力的影响因素解释力进行定量分析,对比11个指标因素对适应能力空间分异及高低的相对重要性。因子探测表明(表3),天山地区适应能力高低及其空间分布差异主要受到社会经济因素影响,自然因素也起到一定的作用,各因素按PD, E统计量大小排序依次为:第二、三产业产值(0.86)>城镇人口数(0.79)>城镇固定资产投资额(0.63)>年末单位从业人员数(0.60)>邮政业务量(0.57)>专业卫生技术人员(0.56)>农牧民人均纯收入(0.53)>地方财政收入(0.37)>中学以上在校人数(0.36)>海拔(0.20)>农林牧渔服务业总产值(0.12)。Tab. 3
表3
表3天山冰川变化适应能力影响因子探测结果
Tab. 3
| 影响因子 | PD, E值 | PD, E值排序 | 影响因子 | PD, E值 | PD, E值排序 |
|---|---|---|---|---|---|
| 海拔 | 0.20 | 10 | 农牧民人均纯收入 | 0.53 | 7 |
| 城镇固定资产投资额 | 0.63 | 3 | 城镇人口数 | 0.79 | 2 |
| 第二、三产业产值 | 0.86 | 1 | 邮政业务量 | 0.57 | 5 |
| 农林牧渔服务业总产值 | 0.12 | 11 | 中学以上在校人数 | 0.36 | 9 |
| 年末单位从业人员数 | 0.60 | 4 | 专业卫生技术人员 | 0.56 | 6 |
| 地方财政收入 | 0.37 | 8 |
新窗口打开|下载CSV
综合因子分析结果显示(表3):① 第二、三产业产值对适应能力解释力最强,PD, E统计量高达0.86,城镇人口数、城镇固定资产投资额与年末单位从业人员数的PD, E统计量均在0.6以上,说明这4个因素是影响天山地区适应能力的核心因素。第二、三产业产值和固定资产投资直接影响区域适应能力水平的提高,经济实力决定其在冰川变化带来的影响中采取何种措施与技术手段。城镇人口与从业人员直接影响地区经济发展规模、速度与结构,为此城镇化水平的高低及地区就业率在提高适应能力,减轻区域适应能力差异等方面具有间接作用。② 邮政业务量、专业卫生技术人员、农牧民人均纯收入、地方财政收入与中学以上在校人数的PD, E统计量均在0.3以上,说明这五个因素是适应能力水平的二级因素。伴随着城镇化进程,地区社会服务质量及设备是否完善是其应对冰川变化影响的重要条件,社会服务质量好且设备齐全能较好减轻其负面影响;反之,其作用则会被削弱。受教育水平的高低及其普及程度对提高天山冰川变化适应能力政策、规定的执行具有显著影响,当地受教育水平高且普及率广,居民接受能力与包容度则高,在政策普及推广与实施过程中发挥积极作用;反之,居民接受能力低且不易理解相关政策内容,对于政策的实施则可能具有消极作用,进而不利于提高区域的适应能力。③ 海拔的PD, E统计量仅在0.2以上,说明自然地理因素是适应能力水平的三级因素。自然地理条件在提高适应能力方面具有一定影响,但不占据主导地位,社会经济水平起主导作用。④ 农林牧渔服务业总产值PD, E统计量仅大于0.1,说明农业经济是适应能力水平的四级因素。农林牧渔服务业的发展既受自然条件的制约,又受农业技术水平、机械能力高低的影响,因此农业经济在社会经济发展过程中具有一定作用,但对适应能力主要是间接影响。基于因子分析可知,各影响因素对天山冰川变化适应能力的解释力具有一定的一致性与差异性,一致性表现在天山范围内,影响因子解释力PD, E统计量小于0.3的较少,只有4个,多数因子解释力在0.5~0.8之间,说明各因子在适应能力调整与提高过程中具有一定作用;差异性表现在影响因子解释力不同,PD, E统计量最大的为0.86,最小的为0.12,说明各因子在适应能力调整与提高过程中所起到的作用不同,经济发展水平因素起主导作用,自然地理因素起辅助作用。
5.3 影响因素交互作用分析
交互探测主要探寻影响因素对适应能力的空间分异是否存在交互作用,识别不同影响因素之间相互作用是否增强或削弱对因变量的解释力。天山冰川变化适应能力空间分异的影响因素交互探测结果显示,各影响因素交互作用之后解释力明显增强,主要表现为双线性或非线性因子增强两种组合,因子间的双线性增强较为普遍,说明导致天山冰川变化适应能力空间分异现象不是由某一影响因素造成,而是不同影响因素之间共同相互作用的结果。交互探测结果显示(表4):① 海拔、城镇固定资产投资额、农林牧渔服务业总产值、地方财政收入与其他因素交互作用呈现非线性增强。其中海拔与农林牧渔服务业总产值交互后解释力明显增强,增加率高达65.89%,与年末单位从业人员数交互后解释力增加幅度较小,为0.21%,说明自然地理位置与社会经济、就业水平、社会服务等因素交互后其解释力更趋明显,为此天山在应对冰川变化带来的影响时,应对措施采取或提高方面必须考虑自然因素的影响;② 农林牧渔服务业总产值与地方财政收入交互后解释力增加率为23.11%,说明农业经济是区域经济发展的一部分,其单独作用时对适应能力影响并不明显,但财政收入一定程度上是区域财政实力的表现,两者交互作用后对适应能力的解释增强;③ 地方财政收入与中学以上在校人数交互后解释力增加率为21.58%,说明中学以上受教育水平在单独作用时,解释力较弱,但在区域财政实力支持下,受教育水平与之交互作用后解释力呈增强趋势。④ 除上述因素外,其余因素交互作用呈现双线性增强,说明天山应对冰川变化的能力是各因子间相互作用的结果,其中海拔与第二、三产业产值交互后,解释力最大为0.97,原因在于天山海拔差异较大,而第二、三产业的发展不可避免受到海拔因素的影响;第二、三产业产值与中学以上在校人数交互作用明显,解释力为0.97,说明受教育水平的提高对第二、三产业的发展具有促进作用,进而两者对其适应能力的解释力增强。基于交互分析可知,各影响因素之间存在明显的交互作用关系,且因子间交互后解释力明显增强,从而证明天山应对冰川变化的能力是自然、社会、经济和人口等要素相互作用的结果。Tab. 4
表4
表4天山冰川变化适应能力影响因素交互探测结果
Tab. 4
| X1 | X2 | X3 | X4 | X5 | X6 | X7 | X8 | X9 | X10 | |
|---|---|---|---|---|---|---|---|---|---|---|
| X2 | 0.86 | |||||||||
| X3 | 0.97 | 0.92 | ||||||||
| X4 | 0.54 | 0.76 | 0.95 | |||||||
| X5 | 0.81 | 0.93 | 0.95 | 0.84 | ||||||
| X6 | 0.61 | 0.83 | 0.87 | 0.60 | 0.92 | |||||
| X7 | 0.65 | 0.84 | 0.94 | 0.73 | 0.85 | 0.92 | ||||
| X8 | 0.94 | 0.88 | 0.95 | 0.89 | 0.91 | 0.88 | 0.91 | |||
| X9 | 0.83 | 0.93 | 0.95 | 0.73 | 0.79 | 0.86 | 0.89 | 0.88 | ||
| X10 | 0.67 | 0.94 | 0.97 | 0.47 | 0.85 | 0.89 | 0.76 | 0.89 | 0.87 | |
| X11 | 0.69 | 0.77 | 0.95 | 0.62 | 0.93 | 0.92 | 0.88 | 0.91 | 0.88 | 0.69 |
新窗口打开|下载CSV
6 结论与讨论
6.1 结论
以中国天山为例,从暴露度、敏感性和适应能力构建了涵盖自然地理特征、人口状况、社会经济水平等因素的天山冰川变化脆弱性基本组织框架与评价指标体系,揭示了冰川变化脆弱性的空间相关特征,并基于地理探测器模型探讨了影响冰川变化适应能力的自然、社会、经济和人口因素,主要结论如下:(1)脆弱性等级由天山西部向东部地区降低,水平差异显著。天山东部地区处在低暴露、高敏感的系统环境,且拥有较好适应能力,在全区域范围内冰川变化的脆弱性最低;中部地区虽处于高暴露的系统环境,但敏感性较低,且拥有一定的适应能力,脆弱性较低;西部地区具有高暴露、高敏感的系统环境,同时拥有最低水平的适应能力,脆弱性较高。
(2)天山冰川变脆弱性存在显著的空间正相关关系,暴露度与敏感性、适应能力分别在空间上存在明显正相关与负相关关系。表明区域范围内对冰川变化具有高暴露、高敏感地区往往适应能力较低,进而导致脆弱性较高;而低暴露、低敏感地区则拥有较高的适应能力,脆弱性也相较偏低。
(3)天山应对冰川变化能力的空间异质性是自然、社会、经济、人口等因素相互共同作用的结果。其中,第二、三产业产值、城镇人口数、城镇固定资产投资额与年末单位从业人员数等经济因素具有主导作用,各影响因素之间交互作用后解释力显著增强,主要表现为双线性增强作用。
6.2 讨论
(1)冰川面积变化与冰川变化脆弱性的关系。若认定冰川面积变化大则脆弱性高则具有一定的片面性,冰川面积变化大是指冰川易受到外部环境的干扰,暴露度高且较为敏感;冰川变化脆弱性是由暴露度、敏感性、适应能力三个维度构成,暴露度高不一定具有高脆弱性。如两次中国冰川编目数据显示阿合奇县冰川面积减少544.48 km2,脆弱性指数为0.66,冰川面积变化与脆弱性具有一致性;沙湾县冰川面积减少317.32 km2,脆弱性指数为0.07,冰川面积变化与脆弱性一致性极差;乌恰县冰川面积减少41.92 km2,脆弱性指数为0.36,冰川面积变化与脆弱性一致性较差;因此,仅从冰川面积角度认定脆弱性高低具有一定偏差,也要考虑到敏感性与适应能力方面。(2)评价指标的选取对冰川变化脆弱性综合评估的影响。由于影响冰川变化脆弱性因素较多且各因素间相互作用关系较为复杂,不同研究尺度和类型对暴露度、敏感性和适应能力的理解以及相应指标参数、替代参数的选取差异明显。以暴露度为例,市、州或县等空间单元上自然暴露度指标及替代性指标参数容易获取,但空间尺度越大,自然暴露度差异越明显。如研究冰川变化脆弱性,区域间空间异质性明显比区域内更便于表达。社会经济暴露度指标则选取较难,不同尺度空间单元社会经济发展水平、人口状况、城镇化速度等因素差异显著,为此多选择空间单元共性指标评估其脆弱性程度。依据冰川变化脆弱性内涵,系统内部结构与稳定性以及人类主体社会经济发展能力决定了施加在系统上的压力或胁迫能否打破系统支撑其基本状态和基本功能的阈值,但如何通过敏感性和适应能力指标确切度量系统被损坏的临界阈值是当前冰川变化脆弱性研究的困难所在。
(3)冰川未来变化脆弱性评估。本文以县市为基本单元,着重探究特定冰川变化脆弱性空间相关特征和适应能力影响因素,从而可以实现空间单元间冰川变化脆弱性差异性比较,对针对性采取有效适应能力措施具有明确指导作用。但除冰川过去变化脆弱性评估外,冰川未来变化脆弱性时空演变分析对于研究系统脆弱性动态演变过程及其驱动机制具有重要意义。然而由于大范围冰川数据资料获取难度较大且存在一定误差,基于第一、二次中国冰川编目数据进行脆弱性特征及其影响因素研究仍停留在以往层面,缺少对未来的变化预估。选取冰川数据资料相对完善的区域,分析冰川未来变化脆弱性演变特征及其驱动机制,并提出差异化的适应策略是需要深入研究的内容。
参考文献 原文顺序
文献年度倒序
文中引用次数倒序
被引期刊影响因子
[本文引用: 1]
[本文引用: 1]
[本文引用: 3]
[本文引用: 3]
[本文引用: 1]
[本文引用: 2]
[本文引用: 2]
[本文引用: 1]
[本文引用: 1]
DOI:10.1016/j.accre.2015.11.003URL [本文引用: 1]
[D].
[本文引用: 1]
[D].
[本文引用: 1]
[D].
[本文引用: 1]
[D].
[本文引用: 1]
[本文引用: 1]
[本文引用: 1]
DOI:10.1007/s11434-012-5525-0URL [本文引用: 1]
[本文引用: 1]
DOI:10.1016/j.advwatres.2012.11.014URL [本文引用: 1]
DOI:10.1016/j.proenv.2011.09.062URL [本文引用: 1]
DOI:10.1016/j.cosust.2013.11.003URL [本文引用: 1]
DOI:10.11821/dlxb201807010 [本文引用: 1]

Strongly impacted by climate change, glacier and snow, as major parts of solid reservoirs in mountains, can regulate the local water sources. This study uses glacier and snow datasets to analyze the variations of glaciers, snow, water storage, and runoff in the Tianshan Mountains, and selects three typical river basins (Aksu River, Kaidu River, and Urumqi River) to interpret the impact of glacier and snow changes on regional water resources in this region. Results indicate that: (1) the functional relationship between glaciers retreat and glaciers area is f(x) = -0.53×x-0.15 (R2 = 0.42, RMSE = 0.086), and small glacier retreat is more sensitive under climate change. Meanwhile, glacier retreat rate at the low-middle elevation bands is faster than that of the high elevation band; (2) the decreasing rate of regional average total water storage (TWS) is -0.7±1.53 cm/a in the study area during 2003-2015. The maximum of TWS deficit region was mainly observed in the central part of the mountains, which is closely related with accelerated glacier retreats; (3) during the past half century, the increased melting of glacier and snow melt led to a runoff increase in the three typical river basins, especially in the Aksu river basin (0.4×10⁸ m3/a). The area decreasing, thinning, and rising equilibrium line altitude (ELV) of glaciers are the major factor contributing to the decreasing trend of runoff in the three river basins since the mid-1990s. Therefore, results revealed that the mechanism of influence of solid water reserves reduction in mountains on regional water resources under climate change, and also provided references for water resources management in the mountainous river basin.
[本文引用: 1]
DOI:10.1007/s11629-015-3685-5URL [本文引用: 1]
[本文引用: 1]
[本文引用: 1]
DOI:10.11821/dlxb201709005 [本文引用: 3]
Based on the glacier inventories and meteorological data, spatial-temporal variations of glaciers in Chinese Tianshan Mountains were analyzed systematically. The results show that: (1) 7934 glaciers with an area of 7179.77 km2 and volume of 756.48 km3 were identified in the study area. The number of glaciers below 1 km2 accounts for the majority part of glaciers in the Chinese Tianshan Mountains. In contrast, glaciers between 1 to 10 km2 and larger than 20 km2 have the largest proportions of the total glacier surface area. The glaciers in the study area are mainly distributed at elevations of 3800-4800 m. (2) In 10 watersheds, the Akesu River Basin contains the most of the glaciers with a surface area of 1721.75 km2, but the Yiwu River Basin has the least glaciers whose surface area is 56.03 km2. There is an obvious difference of glaciers in different regions. In the Akesu region, glacier resource is the most abundant, which accounts for 43.28% and 68.85% in total surface area and volume. In the Turpan region, glacier resource is the least, which accounts for only 0.23% and 0.07% of the total surface area and volume in this region. (3) In the past half century, the loss in glacier area and ice volume were 1619.85 km2 (-18.64%) and 104 km3 (21.63%), respectively. Glaciers smaller than 1.0 km2 constituted the main body of the decreased glacier number. Glaciers below 5 km2 experienced a significant recession. (4) The relative rates of area change for these glaciers were different for different drainage basins. The fastest change of glacier area occurred on the northern slope of the Bogda Basin and the lowest appeared in the Weigan River Basin. The main reason for glacier retreat in this region was that glacier melting caused by rising summer temperatures is greater than glacier mass supply by increased precipitation during the study period.
[本文引用: 3]
[本文引用: 1]
[本文引用: 1]
[本文引用: 1]
[本文引用: 1]
[本文引用: 1]
[本文引用: 1]
[本文引用: 1]
[本文引用: 1]
[本文引用: 1]
[本文引用: 1]
[本文引用: 1]
[本文引用: 1]
DOI:10.3390/w9010001URL [本文引用: 1]
DOI:10.1016/j.gloplacha.2014.01.001URL [本文引用: 1]
DOI:10.13249/j.cnki.sgs.2017.11.020 [本文引用: 2]
<p>Based on topographic maps, remote sensing images, meteorological and hydrological data, glacier change and its impact on water resources are investigated in the Kuytun River Basin under the background of climatic change. Results show that glacier area decreased by 65.4 km<sup>2</sup> with a retreating rate of -32.6%, 31 glaciers disappeared, and mean glacier area reduced by 0.19 km<sup>2</sup> from 1964 to 2015. Loss of glacier volume is approximately 4.39 km<sup>3 </sup>with an annual loss rate of 0.084 km<sup>3 </sup>in 52 years. APAC(Annual percentage of area change)increases since 2000,which indicates that accelerated glacier shrinkage is observed.</p><p>Annual mean temperature in the basin exhibits a marked rising trend over the study period with a tendency rate of 0.39℃/10a. Results of MK(Mann-Kendall) mutation test indicate that mutation point of annual mean temperature occurs in 1988, and annual mean temperature increased rapidly since 1988.There is no mutation year for annual precipitation, which exhibits a slightly decreased tendency from 1964 to 2009. Present-day glacier shrinkage is a mix response to past and current climate fluctuation, and glacier ablation is highly correlated to the positive accumulated temperature over the ablation period, while accumulation is originated from the annual precipitation. The analysis shows that expenditure of glacier mass (ablation) caused by the positive accumulated temperature increase during the ablation period larger than mass income (accumulation) originated from annual precipitation is the main reason for glacier retreat. </p><p>There is a rising trend for annual runoff with a tendency rate of 0.13×10<sup>8</sup>m<sup>3</sup>/10a from 1964 to 2010, and mean annual runoff is approximately 6.54×10<sup>8</sup>m<sup>3</sup>. Annual runoff is on the decline from 1964 to 1993, but displays an upward tendency since 1993. Results of wavelet analysis show that there exists the periodic fluctuation of 3-15 years approximately for annual runoff, which also change since 1993, and maximum wet season appears in the period of 1995-2000. Results of MK mutation test show that no mutation year is found for annual runoff in 47 years.</p><p> Net loss of water resources caused by glacier ablation is approximately 39.5×10<sup>8</sup>m<sup>3</sup> with an annual loss rate of 0.76×10<sup>8</sup>m<sup>3</sup>/a, which accounts for 12% of mean annual runoff over the study period. Affected by climatic warming, glacial meltwater increased since 1980s and its proportion in annual runoff rose. Besides, glacier coverage of the basin decreased by 3.4% in 52 years. With the ice loss gradually, the contribution of glacial meltwater to runoff would decrease step by step in the future forecasting warming scenario. Despite the importance of glacier for the local hydrological cycle, there is urgent necessity to reinforce the monitoring and study of glacier status, which could provide the better decision-making value for assessment, allocation and sustainable utilization of local water resources.</p>
[本文引用: 2]
DOI:10.1007/s40333-015-0139-4URL [本文引用: 1]
[本文引用: 1]
[本文引用: 1]
[D].
[本文引用: 1]
[D].
[本文引用: 1]
[D].
[本文引用: 1]
[D].
[本文引用: 1]
[本文引用: 1]
[本文引用: 1]
DOI:10.11821/dlxb201501001 [本文引用: 2]
The Second Chinese Glacier Inventory (SCGI) was compiled based on remote sensing images after 2004 including Landsat TM/ETM+ and ASTER images, and the digital elevation models (DEMs) from SRTM. The SCGI shows that there are 48,571 glaciers with a total area of 5.18×10⁴ km2 and ice volume of 4.3×10³-4.7×10³ km3 in China (including glaciers measured from 1:50,000 or 1:100,000 topographic maps made from the 1960s to the 1980s because of no high quality remote sensing images for the contemporary glacier inventories). The number of glaciers with the area below 0.5 km2 reaches 33,061 and accounts for the majority part (66.07%) of glaciers in China. Glaciers with areas between 1.0 km2 and 50.0 km2 are totaled as ~3.40×10⁴ km2 (~2.65×10³ km3 in ice volume) and constitute the main part of glaciers in China. The Yengisogat Glacier (359.05 km2), located in the Shaksgam Valley, north slope of the Karakoram Mountain, is the largest glacier in China. The glaciers are spatially distributed in 14 mountains and plateaus in western China. The Kunlun Mountains has the largest number of glaciers in China, followed by Tianshan Mountains, Nyainqêntanglha Range, the Himalayas and Karakoram. Glaciers in the above five mountains account for 72.26% of the total glacier number in China, however, over 55% of the total area of glaciers and 59% of the total ice storage in China are concentrated in the Kunlun Mountains, Nyainqêntanglha Range and Tianshan Mountains. The number and area of glaciers in Karakoram Mountains are less than those in the Himalayas, but the volume of the former is more than that of the latter because the glaciers in the Karakoram are generally larger. Some 4/5 of the total area of glaciers in China is mainly distributed in an altitudinal band between 4500-6500 m a.s.l. with regional differences depending on the general elevations of various mountains. Analogously, there is an obvious difference of glaciers in basins. The first level basin having the most glaciers is the East Asia interior drainage area (5Y) which occupies ~40% of glaciers in China. The Yellow River basin (5J) has the fewest glaciers where only 164 with an area of 126.72 km2 are distributed. Xinjiang and Xizang autonomous regions are the two provincial units rich in glaciers, with ~9/10 of the total area and ice storage of glaciers in China.
[本文引用: 2]
[本文引用: 1]
[本文引用: 1]
DOI:10.3189/2015JoG14J209URL [本文引用: 1]
[本文引用: 1]
[本文引用: 1]
DOI:10.11821/dlxb201906012 [本文引用: 1]
Villages in mountainous areas are under the risk of topography, geomorphology and frequent natural disasters in a long term. Rural transportation system is characterized by low network degree and weak capacity to resist disasters, and the problem of vulnerability of traffic environment is prominent. Taking Luonan county in the Qinling-Daba mountainous areas as an example and based on exposure, sensitivity and response capacity of human-environment system vulnerability, this paper constructed a basic framework of rural transportation environment vulnerability, which contained the key elements of risk events, geographical features, key travel path, road network structures, public and private vehicles, family capital etc., and established a targeted evaluation index system. With the aid of ArcGIS and GeoDa, this research examined the spatial structure and spatial autocorrelation of the transportation environment vulnerability in Luonan county at the village level. It also utilized a geographical weighted regression model to explore the factors of natural conditions, population, socio-economic development, which had influence on response capacity of traffic risk and its spatial difference. The results showed that the vulnerability of transportation environment took the county seat and the suburbs as the center increasing outward, which presents a circle structure featured by great difference in vertical direction. Simultaneously, the vulnerability of the transportation environment in village-level residential areas showed a significant positive spatial autocorrelation, but both exposure degree and sensitivity showed a significant spatial negative correlation with the response capacity. There were three patterns of local spatial correlation in transportation environment vulnerability: the vulnerability of the local "hot spots" areas was widely observed in the north- central mountainous area and fell into the dilemma of high exposure, high sensitivity and low response capacity, while the "cold spots" villages were founded in suburbs or areas adjacent to the towns with higher income, which had low sensitivity and high response capacity. There were a few "heterogeneity points", and these villages were adjacent to low-vulnerable villages, but they belonged to high-vulnerable areas. Moreover, topographical condition, industrial distribution, population structure, education level and family size had a significant impact on response capacity of transportation risk. In addition, the effect direction and intensity of the influencing factors had significant spatial differences.
[本文引用: 1]
DOI:10.1177/016001769702000109URL [本文引用: 1]
DOI:10.11821/dlxb201701010 [本文引用: 2]
Spatial stratified heterogeneity is the spatial expression of natural and socio-economic process, which is an important approach for human to recognize nature since Aristotle. Geodetector is a new statistical method to detect spatial stratified heterogeneity and reveal the driving factors behind it. This method with no linear hypothesis has elegant form and definite physical meaning. Here is the basic idea behind Geodetector: assuming that the study area is divided into several subareas. The study area is characterized by spatial stratified heterogeneity if the sum of the variance of subareas is less than the regional total variance; and if the spatial distribution of the two variables tends to be consistent, there is statistical correlation between them. Q-statistic in Geodetector has already been applied in many fields of natural and social sciences which can be used to measure spatial stratified heterogeneity, detect explanatory factors and analyze the interactive relationship between variables. In this paper, the authors will illustrate the principle of Geodetector and summarize the characteristics and applications in order to facilitate the using of Geodetector and help readers to recognize, mine and utilize spatial stratified heterogeneity.
[本文引用: 2]
