 ,1, 马丹阳2, 邓浩宇1, 吴绍洪,1,3
Climate change risk assessment of ecosystem productivity in the arid/humid transition zone of northern China
YIN Yunhe,1, MA Danyang2, DENG Haoyu1, WU Shaohong,1,3通讯作者:
收稿日期:2020-05-9修回日期:2020-12-23网络出版日期:2021-07-25
| 基金资助: |
Received:2020-05-9Revised:2020-12-23Online:2021-07-25
| Fund supported: |
作者简介 About authors
尹云鹤(1979-), 女, 山东德州人, 博士, 研究员, 中国地理学会会员(S110005959M), 主要从事综合自然地理, 气候变化的影响与风险研究。E-mail:

摘要
关键词:
Abstract
Keywords:
PDF (3500KB)元数据多维度评价相关文章导出EndNote|Ris|Bibtex收藏本文
本文引用格式
尹云鹤, 马丹阳, 邓浩宇, 吴绍洪. 中国北方干湿过渡区生态系统生产力的气候变化风险评估. 地理学报[J], 2021, 76(7): 1605-1617 doi:10.11821/dlxb202107003
YIN Yunhe, MA Danyang, DENG Haoyu, WU Shaohong.
1 引言
全球以增暖为主要特征的气候变化问题日益突出,气候变化风险是人类社会发展面临的严峻挑战[1,2,3,4],特别是系统性风险和突变事件造成的风险[5]。陆地生态系统是赖以生存与发展的生命支持系统,对于维护全球生态安全、保护地球生态环境具有不可替代的作用。全球变暖背景下,驱动生态系统响应的关键气候条件发生改变[6,7]。生态系统的类型组成及分布、物候期、生产力和碳库等方面均受到气候变化的显著影响[8,9,10]。在未来气温升高叠加极端气候事件频率增加的情景下,气候变化将可能加剧对生态系统碳储存、生物多样性和生产功能等造成的潜在风险[11,12,13]。尽管未来气候变化具有不确定性,气候变化对植被产生力的影响以及由此带来的风险问题已受到了普遍关注。植被响应气候变化的风险评估中,生态系统净初级生产力(Net Primary Productivity, NPP)的降低损失是体现关键气候变量对生态系统结构与功能综合影响和风险的关键指标。NPP反映植被生长状况、体现植被固定和转换光合产物的能力[14],是生态过程和生态系统碳循环中的重要因子[15,16]。温度上升会促使高纬或高寒地区森林NPP增加[17],而增温引起的潜在蒸散增强及土壤缺水则可能导致热带森林NPP降低[18]。气候变化特别是极端气候可能造成树木死亡率增加或森林大面积死亡,进而降低森林NPP[19,20]。在未来气候变化情景下,全球的寒—温交错带将因高温和干旱胁迫而发生大规模的森林死亡事件[21]。增暖与干旱事件可能导致热带或亚热带森林NPP降低,较高排放情景下甚至造成全球陆地生态系统NPP降低[22,23]。NPP与水分等综合指标被纳入风险评估中,表明21世纪末中国生态系统高风险区将主要分布于青藏高原区域以及从青藏高原延伸至东北一带[24]。已有生态系统的气候变化风险研究在指标选取、阈值辨析等方面取得了重要进展,但大多忽略了关键指标趋势性变化在气候变化风险评估中的作用。
干湿过渡区是指湿润区向干旱区过渡的地带[25],在中国位于东亚季风边缘区,同时也是农牧交错带的主要分布区,对气候波动响应敏感[26,27]。气候过渡地带生态系统对人类和自然干扰响应不稳定,开展过渡区气候与生态相互作用研究对理解全球变化极为重要[28]。区域分布典型自然植被类型以半湿润区的森林草原和半干旱区的草原及草甸草原为主[29]。随着全球变暖,干湿过渡区遭受更为严重的自然灾害,土地退化和荒漠化风险也可能进一步加剧[30,31,32]。因此,干湿过渡区是植被对全球变化响应敏感且复杂的气候和生态过渡地带,在气候变化响应与风险研究中具有独特性。
本文利用多模式多情景气候数据,评估未来中国北方地区的干湿过渡区生态系统生产力的气候变化风险。研究有助于理解植被与气候相互作用,是准确预估气候变化风险与陆地生态系统未来可能变化的重要基础,也可为制定区域应对气候变化的适应策略、加强生态恢复与保护并促进可持续发展提供科学依据。
2 数据与方法
2.1 研究区概况
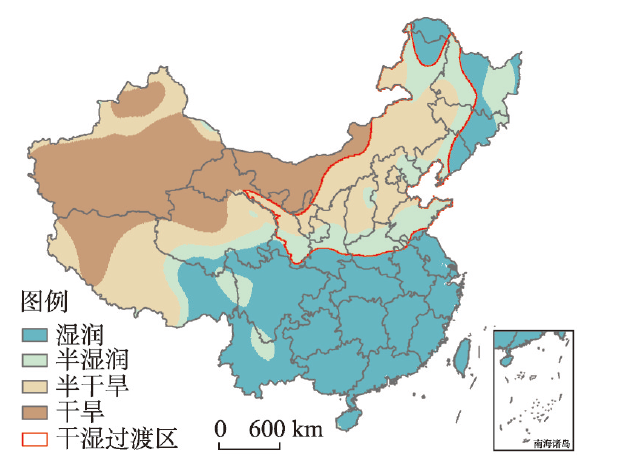
基于Penman-Menteith方法计算年潜在蒸散量和年降水量之比的干湿指数(Aridity Index, AI),以其作为衡量区域干湿状况和划分全国干湿气候区的指标[33,34]。根据1982—2010年AI均值,中国半湿润与半干旱区(1.0 ≤ AI < 4.0)主要分布在北方和青藏高原。由于高原高寒陆表系统分异显著,因此选取中国北方连续分布区域(98.87°E~128.04°E,33.04°N~53.29°N)为本文重点研究的干湿过渡区(Arid/humid Transition Zone, AHTZ)(图1)。图1
 新窗口打开|下载原图ZIP|生成PPT
图1中国北方干湿过渡区位置
注:基于自然资源部标准地图服务网站GS(2019)1822号的标准地图制作,底图无修改。
Fig. 1Arid/humid transition zone in northern China
研究区总面积约196.75万km2,占全国陆域20.71%,大部分地区海拔高度低于1500 m。中国北方干湿过渡区从大兴安岭延伸至青藏高原以东、秦岭—淮河以北,大致呈东北—西南方向,主要包括内蒙古高原东部、黄土高原、东北平原和华北平原北部。该区域受东亚夏季风和中纬度西风的相互作用影响,自沿海向内陆由暖温带向中温带过渡,湿润程度逐渐降低。其中位于内蒙古高原东南边缘和黄土高原北部的北方农牧交错带,属于典型的温带半干旱大陆性季风气候,降水年际变率较大。
2.2 气候变化情景数据
多模式集合预估和气候变化情景分析是预测未来生态系统变化及其对全球变化响应的有效手段。采用跨领域影响模式比较计划(Intersectoral Impact Model Intercomparison Project, ISI-MIP)提供的参与耦合模式比较计划第五阶段(Coupled Model Intercomparison Project Phase 5, CMIP5)[35]试验的多模式数据集,包含5个大气环流模式(General Circulation Model, GCM),分别为HadGEM2-ES、IPSL-CM5A-LR、GFDL-ESM2M、MIROC-ESMCHEM和NorESM1-M[36]。模式输出结果经过降尺度和偏差校正处理,空间分辨率为0.5°×0.5°。模式模拟的气候变量包括平均气温、最高气温、最低气温、降水量、短波辐射、风速和相对湿度。本文采用5个GCM的多模式集合平均,假设这些模式各自独立,并给予它们相等权重。多模式平均方法对全球及区域气候的模拟效果通常优于单个模式[37,38]。研究表明,气温、降水等要素的多模式集合平均模拟值与观测值相近[39],模式结果可用于预估未来干湿过渡区的气候变化风险。未来风险评估采用两个时段,分别为中期(2041—2070年)和远期(2071—2099年)[40]。气候变化情景采用4种典型浓度路径(Representative Concentration Pathway, RCP)RCP2.6、RCP4.5、RCP6.0和RCP8.5排放情景,分别代表2100年辐射强迫水平达到2.6 W m-2、4.5 W m-2、6.0 W m-2和8.5 W m-2,其中RCP8.5是在2100年辐射强迫达到8.5 W m-2左右的最高排放情景,大约相当于1370 ppm的大气CO2浓度[41]。
2.3 气候变化风险等级划分
2.3.1 风险评价指标和等级划分标准 运用风险分析手段描述和刻画未来气候的影响,需要识别气候变化超越何种界限时将被认为是不可接受的,即UNFCCC提出的“危险的气候变化”[42,43]。通过确定合适的阈值作为风险评价的标准,是对气候变化影响进行风险分析的基本要求。本文风险标准主要考虑两方面,一方面参考Scholze等[44]和Shi等[45],主要以NPP低于平均值减去若干标准差的异常变化,利用距平与标准差的倍数关系作为不同风险等级划分依据;另一方面考虑NPP在评估时段内的变化趋势。首先计算未来中期和远期时段NPP相对基准时段(1981—2010年)的距平:
式中:
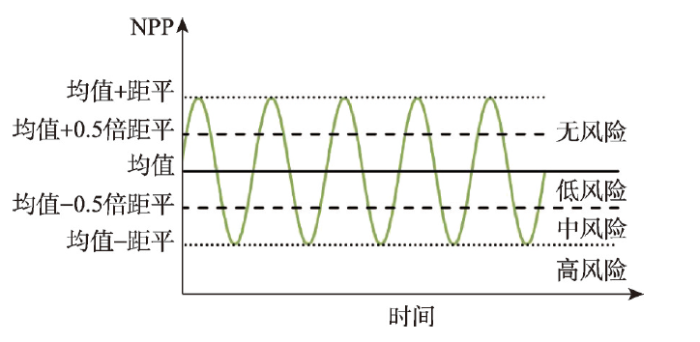
气候变化风险指气候系统变化对承险体造成不利影响的可能性及其程度的结合[46],即承险体可能遭受的损失。因此,将正距平定义为无风险,负距平定义为有风险。对每个距平为负的像元计算其基准时段的NPP序列标准差。当负距平的绝对值是该标准差的0~0.5倍、0.5~1.0倍、1.0倍以上时,分别对应低风险、中风险、高风险。变化趋势采用最小二乘法拟合,并运用非参数Mann-Kendall趋势检测法检验显著性[47]。对未来时段NPP减少趋势显著(p < 0.05)的像元风险等级提高一个级别(图2)。标准差计算公式:
式中:δ为某像元位置上的基准期标准差;xi为第i年NPP值;n为基准期总年数(n=30)。
图2
 新窗口打开|下载原图ZIP|生成PPT
图2生态系统生产力的气候变化风险等级划分
Fig. 2Climate change risk ranking of ecosystem productivity
负距平值与基准期标准差倍数α的计算公式为:
生态系统生产力的气候变化风险水平即依据以上倍数值划定。
2.3.2 基于LPJ动态植被模型的NPP模拟LPJ动态植被模型(Lund-Potsdam-Jena Dynamic Global Vegetation Model)是一个基于生理生态过程的动态全球植被模型,通过输入月气候数据,大气CO2浓度数据和土壤质地数据来驱动模型,计算植物—土壤—大气之间养分循环、碳水通量与碳储量、光合作用强度、植被格局动态等,是模拟大尺度生态系统结构和功能、预测气候变化对生态系统潜在影响的有效工具[48]。LPJ采取简化的Farquhar光合方案,光合速率(And)是关于植被吸收的光合有效辐射、温度、日长和冠层导度的函数[49,50]。模型包含10种植物功能型,对每种功能型通过碳水耦合作用计算总初级生产力,减去维持呼吸和生长呼吸后剩余部分为NPP。
本文利用经过潜在蒸散模块和林火模块改进的LPJ模型估算生态系统NPP[51]。其中,潜在蒸散模块采用考虑了最低/最高温度、相对湿度、风速和辐射等多个要素的FAO56-Penman-Monteith模型[52,53]。林火模块引入可燃物载量与火灾发生概率的线性关系[54],从而更好地反映燃料可获得性对火灾发生的影响。
LPJ模型在模拟之前假设全为裸地,因而在利用模型模拟生态系统生产力之前,需先用一段观测时期的气候数据反复运转模型[48, 51],以确保碳库和植被覆盖达到平衡态。因此,本文首先循环使用1981—2010年的气候数据驱动模型运行1000 a,然后利用2011—2099年的气候数据继续模拟未来生态系统生产力变化。
3 结果分析
3.1 干湿过渡区未来气候变化预估
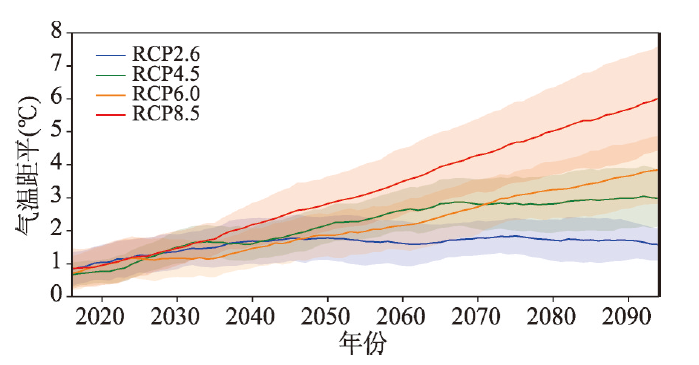
图3展示了多模式预估的未来21世纪干湿过渡区区域平均气温相对1981—2010年的距平变化。总体上,4种排放情景的气温均呈上升趋势,但不同情景之间变化幅度存在差异。相对基准时段,气温将在2020年时上升1 ℃左右,2030年以后情景之间的差异越来越大。具体说来,RCP2.6情景下气温距平基本不超过2 ℃,并且在21世纪下半叶处于平稳状态。RCP4.5情景下,距平值将在21世纪中叶超过2 ℃,在2060—2070年后变化趋于平稳并达到约3 ℃。气温在RCP6.0和RCP8.5情景下表现为持续上升趋势,其中RCP6.0的增温幅度从2070年以后由低于转变为高于RCP4.5的增温水平,至21世纪末增温将接近4 ℃。而RCP8.5情景下,气温距平从2035年左右开始即始终高于所有其他情景。如图3所示,21世纪末干湿过渡区气温将在RCP2.6、RCP4.5、RCP6.0和RCP8.5情景下相对基准时段分别上升1.58 ℃、2.99 ℃、3.85 ℃和6.02 ℃。图3
 新窗口打开|下载原图ZIP|生成PPT
图321世纪干湿过渡区相对基准时段的气温距平变化
注:实线代
Fig. 3Temperature anomalies in the AHTZ during the 21st century (relative to the baseline period)
图4展示了未来21世纪中远期干湿过渡区年降水量相对基准时段的多模式集合平均预估变化结果。4种RCP情景下,大部分地区的降水量将可能增加,但是增加幅度具有明显的空间差异。21世纪中期,干湿过渡区降水量在RCP2.6、RCP4.5、RCP6.0和RCP8.5情景下,平均距平值将分别为8.91%、8.46%、3.22%和10.23%。其中,RCP2.6和RCP4.5情景下的变化格局较为相似,研究区东部尤其是环渤海地区,降水增加幅度达到10%以上,黄土高原的降水增加相对较少,基本在4%~6%之间。RCP6.0情景下,干湿过渡区降水整体变化幅度较小,多数地区相对基准时段增加不超过4%,黄土高原地区甚至出现降水减少。降水增加幅度最大的是RCP8.5情景,研究区南部增幅高于北方,华北北部超过12%。到21世纪远期,除RCP4.5的降水高值区南移至华北平原与黄土高原外,其他情景的格局与中期相似;4种情景下的干湿过渡区降水量有进一步增加的趋势,平均距平值将分别为9.19%、10.54%、9.21%和17.51%。
图4
 新窗口打开|下载原图ZIP|生成PPT
图42041—2070年及2071—2099年不同情景下干湿过渡区降水相对基准时段的距平百分率
Fig. 4Percentage deviations in precipitation over the AHTZ under RCP2.6, RCP4.5, RCP6.0, and RCP8.5 for 2041-2070 and 2071-2099, relative to the baseline period
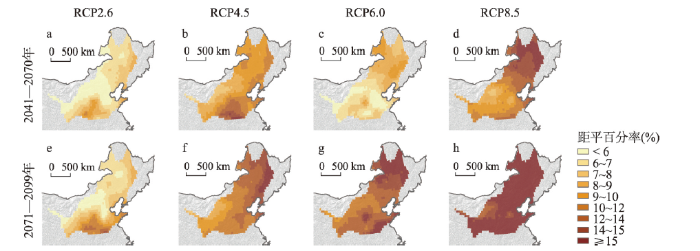
图5是潜在蒸散预估值对于基准期的相对距平分布。结果显示,未来潜在蒸散在4种情景下全部表现为增加。21世纪中期,在温室气体浓度增加最高的RCP8.5情景下,潜在蒸散的增加幅度最大,尤其是在干湿过渡区北缘增幅超过15%。RCP2.6和RCP6.0情景的潜在蒸散变化相似,其正距平在内蒙古东南和华北地区东部低于6%,其他地区为6%~10%。RCP4.5情景下的潜在蒸散增加幅度高于RCP2.6和RCP6.0的水平,增加明显的地区位于华北平原南部。不同情景下,区域平均的潜在蒸散距平在21世纪中期分别为6.56%(RCP2.6)、9.93%(RCP4.5)、7.35%(RCP6.0)和12.14%(RCP8.5)。与降水相比,潜在蒸散变化的空间差异略小。到21世纪远期,除RCP4.5的潜在蒸散高值区北移至东北平原东部外,其他情景的格局与中期相似;4种情景下的干湿过渡区潜在蒸散有进一步增加的趋势,平均距平值将分别为7.42%、12.02%、13.68%和20.17%。
图5
 新窗口打开|下载原图ZIP|生成PPT
图52041—2070年及2071—2099年不同情景下干湿过渡区潜在蒸散相对基准时段的距平百分率
Fig. 5Percentage deviations in reference evapotranspiration over the AHTZ under RCP2.6, RCP4.5, RCP6.0, and RCP8.5 for 2041-2070 and 2071-2099, relative to the baseline period
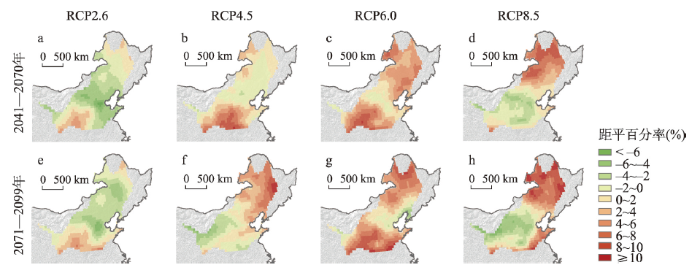
干湿指数负距平代表湿润程度增加,正距平则表示干旱程度加深。图6展示了2041—2070年及2071—2099年干湿指数相对1981—2010年距平变化的空间分布。4种情景下干湿指数变化的区域格局差异显著。21世纪中期,在RCP4.5、RCP6.0和RCP8.5情景下干湿过渡区平均距平值分别为1.53%,4.07%和2.03%,整体表现出一定的干旱化趋势。仅在RCP2.6情景下,干湿指数距平均值为-1.79%,相对基准期轻微下降,中部地区倾向于湿润。对于RCP6.0情景来说,干湿过渡区北部潜在蒸散的增幅高于降水的增幅,从而导致干湿指数上升,而南部尤其是黄土高原的干湿指数上升幅度达到10%以上,则是由于潜在蒸散增加和降水减少的共同作用。RCP8.5情景下,干湿过渡区北部干旱趋势较强,南部地区降水量增幅超过潜在蒸散增加程度引起干湿指数下降,从而缓解干旱影响。到了远期,在RCP4.5情景下,由于潜在蒸散高值区的北移和降水高值区的南移,黄土高原干湿指数距平转而为负,东北平原干湿指数距平则明显增加;在其他情景下干湿指数距平空间分布则仍类似于中期格局。从区域平均来看,远期的干湿过渡区较中期干旱,4种情景下的干湿指数平均距平将分别增至-1.29%、1.87%、4.38%和2.70%。
图6
 新窗口打开|下载原图ZIP|生成PPT
图62041—2070年及2071—2099年不同情景下干湿过渡区干湿指数相对基准时段的距平百分率
Fig. 6Percentage deviations in aridity index over the AHTZ under RCP2.6, RCP4.5, RCP6.0, and RCP8.5 for 2041-2070 and 2071-2099, relative to the baseline period
3.2 干湿过渡区NPP的气候变化风险时空特征
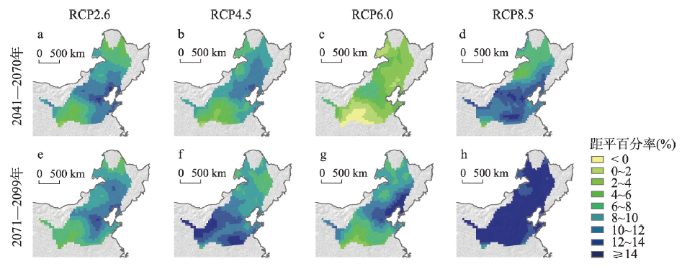
干湿过渡区NPP相对于基准期(1981—2010年)的距平和未来的变化速率均表现出随排放情景明显变化的空间分布特征。2041—2070年,在RCP2.6情景下,NPP负距平主要出现在东北平原北部、黄土高原北部和华北平原中部;随着排放情景加强,NPP负距平空间分布有可能扩张。这30年间,东北平原中部的NPP在RCP2.6和RCP6.0情景下显著(p < 0.05)减少,内蒙古东部草原、黄土高原和华北平原的NPP也在RCP4.5和RCP6.0情景下显著减少。相比于2041—2070年,2071—2099年RCP2.6情景下的NPP负距平在华北平原和黄土高原扩张,但在东北平原几乎消失;RCP4.5情景下的NPP负距平在东北平原扩张且加强,在黄土高原南部消失;RCP6.0和RCP8.5情景下的NPP负距平则均发生扩张与加强。在远期的30年间,NPP的显著负变化主要发生在各情景下的黄土高原,RCP6.0和RCP8.5情景下的华北平原,以及RCP8.5情景下的东北平原。风险评估结果发现,未来气候变化风险范围和程度随RCP2.6、RCP4.5、RCP6.0和RCP8.5情景将可能逐步扩大和增强(表1、图7)。在低排放情景(RCP2.6)下,未来2041—2070年NPP风险面积较小,且以低等级风险为主,集中分布于东北平原中北部、黄土高原北部和华北平原中部,随着排放浓度加强,不仅东北平原和华北平原的风险区域可能扩展,内蒙古东部草原区在中高排放情景下也将面临风险。4种情景下,NPP风险区域分别占干湿过渡区面积的29.45%、49.97%、72.22%和60.72%。不同等级风险的面积比例呈低风险>中风险>高风险的结构。4种情景中,RCP2.6情景下低风险占比最高,中风险和高风险占比最高的分别是RCP6.0和RCP8.5情景,高风险区主要分布在干湿过渡区北部和东部。RCP6.0情景下低、中、高风险的面积均最大。相对于RCP6.0情景,RCP8.5情景的总风险面积比例虽然略有减少,但减少的主要是低、中等级风险面积,高风险面积变化不明显。
Tab. 1
表1
表12041—2070年不同情景下干湿过渡区风险面积占比(%)
Tab. 1
| 风险等级 | RCP2.6 | RCP4.5 | RCP6.0 | RCP8.5 |
|---|---|---|---|---|
| 低风险 | 23.15 | 23.71 | 31.04 | 27.40 |
| 中风险 | 5.46 | 14.88 | 26.62 | 19.22 |
| 高风险 | 0.84 | 11.39 | 14.57 | 14.11 |
| 总计 | 29.45 | 49.97 | 72.22 | 60.72 |
新窗口打开|下载CSV
图7
 新窗口打开|下载原图ZIP|生成PPT
图72041—2070年不同情景下干湿过渡区风险分布
Fig. 7Spatial distributions of risk in the AHTZ under RCP2.6, RCP4.5, RCP6.0, and RCP8.5 during 2041-2070
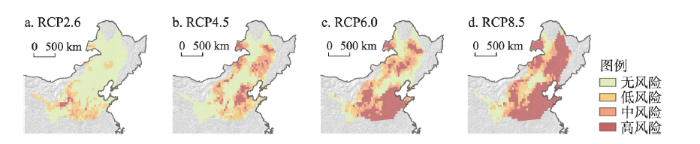
相对于2041—2070年,未来2071—2099年干湿过渡区NPP的风险格局发生了明显变化(图8),4种情景下,总风险区域分别占研究区面积的26.29%、50.56%、72.13%和81.85%(表2)。其中,RCP2.6情景下的总风险比例下降,RCP4.5和RCP6.0情景的总风险比例几乎不变,但局部地区的风险都发生了变化。RCP2.6情景下华北平原中部的中低风险区,RCP4.5情景下东北地区的中高风险区,以及RCP6.0情景下黄土高原和华北平原的高风险区都进一步扩大。RCP8.5情景的总风险比例较2041—2070年期间增加幅度超过21%,这主要归因于部分中低风险区域转变为高等级风险,同时高风险区域显著扩张。而在RCP8.5情景下,不同等级风险的面积比例变为了高风险>(中风险+低风险)的结构,高风险面积比例达到了54.71%,分布范围几乎蔓延至干湿过渡区整个东部平原以及内蒙古东部草原区。
图8
 新窗口打开|下载原图ZIP|生成PPT
图82071—2099年不同情景下干湿过渡区风险分布
Fig. 8Spatial distribution of risk in the AHTZ under RCP2.6, RCP4.5, RCP6.0, and RCP8.5 during 2071-2099
Tab. 2
表2
表22071—2099年不同情景下干湿过渡区风险面积占比(%)
Tab. 2
| 风险等级 | RCP2.6 | RCP4.5 | RCP6.0 | RCP8.5 |
|---|---|---|---|---|
| 低风险 | 19.77 | 22.16 | 20.54 | 14.28 |
| 中风险 | 4.77 | 18.83 | 18.68 | 12.86 |
| 高风险 | 1.75 | 9.58 | 32.92 | 54.71 |
| 总计 | 26.29 | 50.56 | 72.13 | 81.85 |
新窗口打开|下载CSV
3.3 各气候变化风险区的NPP变化特征
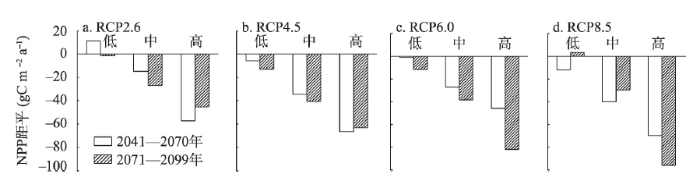
在各情景下中期或远期,NPP距平均随着气候变化风险区的严重度递减,即低风险区距平最高,高风险区距平最低(图9)。只有在RCP2.6情景下的中期,以及RCP8.5情景下的远期,低风险区的NPP距平为正(图9a、9d),说明这两种情况下的低风险区很可能是依据NPP的减少趋势判定的(图10a、10d)。在RCP2.6和4.5情景高风险区,远期NPP距平均比中期NPP距平要高,说明NPP在期间发生了以增加为主的变化,距平风险发生了下降。在RCP6.0情景下,远期的NPP距平明显比中期的低,高风险区的NPP距平甚至从(-45.80±13.23) gC m-2 a-1降低至(-81.91±23.34) gC m-2 a-1,说明远期的距平风险更高。不论是中期还是远期,RCP8.5情景下的高风险区NPP距平是4种情景中最低的,分别达到(-69.80±21.95) gC m-2 a-1和(-96.00±46.95) gC m-2 a-1,即同样是高风险区,RCP8.5情景下的NPP距平风险要更高些。图9
 新窗口打开|下载原图ZIP|生成PPT
图9不同情景下干湿过渡区各风险等级区域的NPP距平(相对于1981—2010年)
Fig. 9NPP anomalies of each risk level in the AHTZ under RCP2.6, RCP4.5, RCP6.0, and RCP8.5, relative to 1981-2010
图10
 新窗口打开|下载原图ZIP|生成PPT
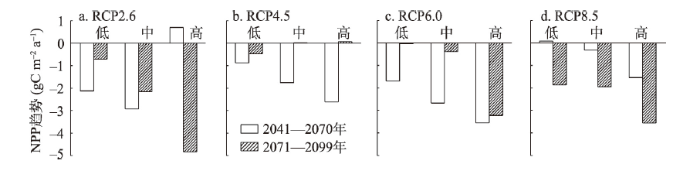
图10不同情景下干湿过渡区各风险等级区域的NPP趋势
Fig. 10NPP trends of each risk level in the AHTZ under RCP2.6, RCP4.5, RCP6.0, and RCP8.5
除RCP2.6情景中期的高风险区,以及RCP4.5远期外,各情景下NPP变化速率基本按低、中、高风险区递增(图10)。在2041—2070年,虽然RCP2.6情景下大部分风险区为低风险,但中低风险区的NPP减少速率均快于其他3种情景,其中低风险区的平均NPP减少趋势为(-2.13±2.01) gC m-2 a-1,中风险区甚至达到(-2.92±1.62) gC m-2 a-1,说明NPP显著降低的风险较高;同时,在风险面积最大的RCP6.0情景下,NPP的减少速率也整体较快,其中高风险区的减少速率快于其他3种情景,高达(-3.55±1.32) gC m-2 a-1。
到2071—2099年,RCP2.6情景的高风险区NPP变化趋势从增加最快变为减少最快,达到(-4.83±1.30) gC m-2 a-1;在RCP4.5情景下,各风险区的NPP变化趋势不明显,基本在±0.5 gC m-2 a-1以内;而在RCP6.0情景下,则只有高风险区的NPP仍保持明显的减少趋势((-3.22±2.52) gC m-2 a-1);RCP8.5情景下风险区的NPP负变化趋势明显,低风险区NPP的变化趋势从增加变为明显减少,中高风险区的NPP减少趋势也倍增,其中高风险区高达(-3.56±3.40) gC m-2 a-1。因此在RCP8.5情景下从中期到远期,不仅高风险区大幅扩张,且NPP下降趋势变得更明显。
4 结论与讨论
生态系统NPP变化反映了关键气候变量对生态系统结构和功能尤其是对碳循环的综合影响。本文以CMIP5多气候模式多情景数据为基础,预估并分析了未来中国干湿过渡区主要气候要素的变化特征,通过改进LPJ模型的潜在蒸散模块和林火模块进行NPP模拟,以未来NPP负距平相对自然年际变率的幅度表征风险等级,研究揭示了气候变化情景下干湿过渡区生态系统NPP面临的气候变化风险,主要结论如下:(1)未来气候变化情景下干湿过渡区气温预估可能持续上升,总体上研究区年潜在蒸散将可能增加,降水则呈波动上升的变化特征。不同情景下的干湿变化存在区域差异,在RCP6.0和RCP8.5情景下干湿指数相对基准期增加,表明21世纪中远期中高排放情景下大部分地区将可能表现出一定的干旱化趋势。
(2)未来中远期干湿过渡区生态系统生产力面临的气候变化风险面积将可能扩大,风险等级将可能加剧,高排放情景下的风险更加严重。远期(2071—2099年)不同情景的NPP风险总面积在26.29%(RCP2.6)和81.85%(RCP8.5)之间。高风险变化在多数情景下呈现出增加趋势,特别是RCP8.5情景下,高风险面积将可能从2041—2070年的14.11%扩大至2071—2099年的54.71%,同时高风险区的NPP距平可能从(-69.80±21.95) gC m-2 a-1下降至(-96.00±46.95) gC m-2 a-1,NPP下降速率可能从(-1.53±1.91) gC m-2 a-1加速至(-3.56±3.40) gC m-2 a-1。
(3)干湿过渡区东部平原和内蒙古东部草原区预估将可能成为风险主要集中区域,这些地区未来的植被生长将可能受到气候变化的不利影响。增温加剧和干旱程度加重可能是未来气候变化风险的重要驱动因素。未来情景预估生态系统生产力下降叠加旱涝等灾害风险,不仅使当地自然生态系统面临风险,也很可能对当地农牧业生产带来严重威胁。
生态系统的气候变化风险评估不确定性主要来源包括气候情景数据、生态模型生理机制描述与参数、植被响应气候敏感性等方面。生态模型是生态系统生产力模拟和预估的重要工具,本文利用改进的LPJ模型模拟的基准时段(1981—2010年)全国潜在植被NPP总量为(3.61±0.13) Gt C a-1,这与Mao等[55]、Yuan等[56]和Pan等[57]的结果较为接近。空间上随着植被类型由林向草过渡,多年平均NPP空间表现为由东南向西北递减;此外与GPPDI数据库[58]中中国区域NPP观测数据进行对比,两者平均相对误差为9.94%。以上结果表明LPJ模型对中国生态系统NPP具有较好的模拟能力。在未来气候变化和人类活动共同作用下植被生长状况可能变得愈加不稳定,植被对不同气候因子的敏感性以及控制植被变化的关键气候要素和阈值等可能发生改变[59,60,61]。
从当前方法评估的结果来看,气候变化风险表现出生态系统类型间差异。东部农用地和内蒙草原的风险均高于东北林地,而这3种生态类型的风险又比处于农林牧交错带的森林草原严重。上述差异可能与生态系统结构组成有关。森林草原及森林的生态系统构成与功能比农用地和草原复杂,因而可能在气候变化影响下具有更高的稳定性[62]。此外,LPJ模型是一种中等复杂的全球植被动力学模型,因以植被功能型为植被类型的基本单元而具有多尺度(中尺度、大尺度、全球尺度)适用性[63],便于本研究的风险评估方法在其他区域和尺度上进行推广应用。
本文风险辨识标准综合了NPP变化趋势以及变化幅度与其自然变率(以基准期标准差表征)之间的倍数关系,强调未来气候变暖对生态系统生产力的负面影响。近年来气候变化风险评估研究取得重要进展,气候变化可能破坏生态系统的结构和功能,气候变化下生态系统的风险评估通常需要筛选生态系统的关键属性作为气候变化的响应指标,以其不能接受的临界损失作为气候变化对生态系统的影响阈值[64,65]。例如,基于关键气候变量和影响模型给出参考阈值,则根据超过阈值的条件概率可自下而上地评估风险[66]。利用NPP自然变率估算风险损失,能够直观展示超过关键阈值的区域空间信息,便于和预测的未来气候要素变化对应分析[67]。在多模式多情景下,以基准期气候变量的均值和标准差来定义气候阈值,则可通过统计发生超过阈值气候变化的模型次数比例来表征风险的高低[44],然而该方法容易在概念上将风险发生的可能性与风险高低混淆。近年来有研究采用未来预估值相对过去长期平均值的变化量来描述生态系统的状态变化,常用状态变量在过去时段的标准差来表征生态系统的自然波动,当生态系统的变化程度超出了自然波动范围时,则认为生态系统属性达到了不可接受的临界值[21, 24, 68]。因此,风险阈值的定量识别是气候变化风险分析在未来研究的重点和难点,同时,还需充分考虑到生态系统面临外界压力时产生的弹性和恢复力。
参考文献 原文顺序
文献年度倒序
文中引用次数倒序
被引期刊影响因子
DOI:10.1126/science.aaa4984PMID:25931559 [本文引用: 1]

Current predictions of extinction risks from climate change vary widely depending on the specific assumptions and geographic and taxonomic focus of each study. I synthesized published studies in order to estimate a global mean extinction rate and determine which factors contribute the greatest uncertainty to climate change-induced extinction risks. Results suggest that extinction risks will accelerate with future global temperatures, threatening up to one in six species under current policies. Extinction risks were highest in South America, Australia, and New Zealand, and risks did not vary by taxonomic group. Realistic assumptions about extinction debt and dispersal capacity substantially increased extinction risks. We urgently need to adopt strategies that limit further climate change if we are to avoid an acceleration of global extinctions. Copyright © 2015, American Association for the Advancement of Science.
DOI:10.1016/j.eng.2017.12.014URL [本文引用: 1]
[本文引用: 1]
[本文引用: 1]
[本文引用: 1]
[本文引用: 1]
[本文引用: 1]
[本文引用: 1]
DOI:10.1126/science.1237123PMID:23908225 [本文引用: 1]
Terrestrial ecosystems have encountered substantial warming over the past century, with temperatures increasing about twice as rapidly over land as over the oceans. Here, we review the likelihood of continued changes in terrestrial climate, including analyses of the Coupled Model Intercomparison Project global climate model ensemble. Inertia toward continued emissions creates potential 21st-century global warming that is comparable in magnitude to that of the largest global changes in the past 65 million years but is orders of magnitude more rapid. The rate of warming implies a velocity of climate change and required range shifts of up to several kilometers per year, raising the prospect of daunting challenges for ecosystems, especially in the context of extensive land use and degradation, changes in frequency and severity of extreme events, and interactions with other stresses.
[本文引用: 1]
DOI:10.1038/nature16986URL [本文引用: 1]
DOI:10.1038/s41586-018-0399-1URL [本文引用: 1]
DOI:10.1038/nclimate3277URL [本文引用: 1]
[本文引用: 1]
DOI:10.1016/j.ecoleng.2017.12.030URL [本文引用: 1]
DOI:10.1038/s41558-019-0630-6URL [本文引用: 1]
[本文引用: 1]
[本文引用: 1]
DOI:10.1126/science.280.5368.1393URL [本文引用: 1]
DOI:10.1111/gcb.2010.17.issue-2URL [本文引用: 1]
DOI:10.1088/1748-9326/6/4/045503URL [本文引用: 1]
DOI:10.1073/pnas.0504949102URL [本文引用: 1]
DOI:10.1016/j.foreco.2009.09.001URL [本文引用: 1]
DOI:10.1007/s10584-010-9858-xURL [本文引用: 1]
DOI:10.1088/1748-9326/6/3/034036URL [本文引用: 2]
DOI:10.1016/j.gloplacha.2016.12.007URL [本文引用: 1]
DOI:10.1371/journal.pone.0112810URL [本文引用: 1]
DOI:http://www.geog.com.cn/article/2021/0375-5444/10.1038/srep20905URL [本文引用: 2]
DOI:10.1007/s00382-016-3400-4URL [本文引用: 1]
[本文引用: 1]
[本文引用: 1]
[本文引用: 1]
[本文引用: 1]
[本文引用: 1]
[本文引用: 1]
[本文引用: 1]
DOI:10.1088/1748-9326/10/9/094008URL [本文引用: 1]
PMID:17495163 [本文引用: 1]
In this millennium, global drylands face a myriad of problems that present tough research, management, and policy challenges. Recent advances in dryland development, however, together with the integrative approaches of global change and sustainability science, suggest that concerns about land degradation, poverty, safeguarding biodiversity, and protecting the culture of 2.5 billion people can be confronted with renewed optimism. We review recent lessons about the functioning of dryland ecosystems and the livelihood systems of their human residents and introduce a new synthetic framework, the Drylands Development Paradigm (DDP). The DDP, supported by a growing and well-documented set of tools for policy and management action, helps navigate the inherent complexity of desertification and dryland development, identifying and synthesizing those factors important to research, management, and policy communities.
[本文引用: 1]
[本文引用: 1]
DOI:10.3354/cr01500URL [本文引用: 1]
DOI:10.1360/04yd0009URL [本文引用: 1]
DOI:10.1175/BAMS-D-11-00094.1URL [本文引用: 1]
DOI:10.1073/pnas.1312330110PMID:24344316 [本文引用: 1]
The Inter-Sectoral Impact Model Intercomparison Project offers a framework to compare climate impact projections in different sectors and at different scales. Consistent climate and socio-economic input data provide the basis for a cross-sectoral integration of impact projections. The project is designed to enable quantitative synthesis of climate change impacts at different levels of global warming. This report briefly outlines the objectives and framework of the first, fast-tracked phase of Inter-Sectoral Impact Model Intercomparison Project, based on global impact models, and provides an overview of the participating models, input data, and scenario set-up.
DOI:10.1073/pnas.0900094106PMID:19439652 [本文引用: 1]
Regional or local climate change modeling studies currently require starting with a global climate model, then downscaling to the region of interest. How should global models be chosen for such studies, and what effect do such choices have? This question is addressed in the context of a regional climate detection and attribution (D&A) study of January-February-March (JFM) temperature over the western U.S. Models are often selected for a regional D&A analysis based on the quality of the simulated regional climate. Accordingly, 42 performance metrics based on seasonal temperature and precipitation, the El Nino/Southern Oscillation (ENSO), and the Pacific Decadal Oscillation are constructed and applied to 21 global models. However, no strong relationship is found between the score of the models on the metrics and results of the D&A analysis. Instead, the importance of having ensembles of runs with enough realizations to reduce the effects of natural internal climate variability is emphasized. Also, the superiority of the multimodel ensemble average (MM) to any 1 individual model, already found in global studies examining the mean climate, is true in this regional study that includes measures of variability as well. Evidence is shown that this superiority is largely caused by the cancellation of offsetting errors in the individual global models. Results with both the MM and models picked randomly confirm the original D&A results of anthropogenically forced JFM temperature changes in the western U.S. Future projections of temperature do not depend on model performance until the 2080s, after which the better performing models show warmer temperatures.
[本文引用: 1]
[本文引用: 1]
DOI:10.1002/joc.4295URL [本文引用: 1]
DOI:10.1007/s10584-014-1257-2URL [本文引用: 1]
DOI:10.1038/nature08823URL [本文引用: 1]
PMID:16506969 [本文引用: 1]
The notion of "dangerous climate change" constitutes an important development of the 1992 United Nations Framework Convention on Climate Change. It persists, however, as an ambiguous expression, sustained by multiple definitions of danger. It also implicitly contains the question of how to respond to the complex and multi-disciplinary risk issues that climate change poses. The invaluable role of the climate science community, which relies on risk assessments to characterize system uncertainties and to identify limits beyond which changes may become dangerous, is acknowledged. But this alone will not suffice to develop long-term policy. Decisions need to include other considerations, such as value judgments about potential risks, and societal and individual perceptions of "danger," which are often contested. This article explores links and cross-overs between the climate science and risk communication and perception approaches to defining danger. Drawing upon nine articles in this Special Issue of Risk Analysis, we examine a set of themes: limits of current scientific understanding; differentiated public perceptions of danger from climate change; social and cultural processes amplifying and attenuating perceptions of, and responses to, climate change; risk communication design; and new approaches to climate change decision making. The article reflects upon some of the difficulties inherent in responding to the issue in a coherent, interdisciplinary fashion, concluding nevertheless that action should be taken, while acknowledging the context-specificity of "danger." The need for new policy tools is emphasised, while research on nested solutions should be aimed at overcoming the disjunctures apparent in interpretations of climate change risks.
DOI:10.1023/B:CLIM.0000024781.48904.45URL [本文引用: 1]
PMID:16924112 [本文引用: 2]
We quantify the risks of climate-induced changes in key ecosystem processes during the 21st century by forcing a dynamic global vegetation model with multiple scenarios from 16 climate models and mapping the proportions of model runs showing forest/nonforest shifts or exceedance of natural variability in wildfire frequency and freshwater supply. Our analysis does not assign probabilities to scenarios or weights to models. Instead, we consider distribution of outcomes within three sets of model runs grouped by the amount of global warming they simulate: <2 degrees C (including simulations in which atmospheric composition is held constant, i.e., in which the only climate change is due to greenhouse gases already emitted), 2-3 degrees C, and >3 degrees C. High risk of forest loss is shown for Eurasia, eastern China, Canada, Central America, and Amazonia, with forest extensions into the Arctic and semiarid savannas; more frequent wildfire in Amazonia, the far north, and many semiarid regions; more runoff north of 50 degrees N and in tropical Africa and northwestern South America; and less runoff in West Africa, Central America, southern Europe, and the eastern U.S. Substantially larger areas are affected for global warming >3 degrees C than for <2 degrees C; some features appear only at higher warming levels. A land carbon sink of approximately 1 Pg of C per yr is simulated for the late 20th century, but for >3 degrees C this sink converts to a carbon source during the 21st century (implying a positive climate feedback) in 44% of cases. The risks continue increasing over the following 200 years, even with atmospheric composition held constant.
DOI:10.1080/10807039.2015.1138090URL [本文引用: 1]
[本文引用: 1]
[本文引用: 1]
DOI:10.1016/S0021-9258(17)43970-6URL [本文引用: 1]
DOI:10.1046/j.1365-2486.2003.00569.xURL [本文引用: 2]
DOI:10.1016/0168-1923(91)90002-8URL [本文引用: 1]
DOI:10.1071/PP9920519URL [本文引用: 1]
DOI:10.1038/s41598-017-18798-6URL [本文引用: 2]
[本文引用: 1]
DOI:10.1016/j.agwat.2007.09.002URL [本文引用: 1]
[本文引用: 1]
DOI:10.1007/s00376-009-9006-6URL [本文引用: 1]
DOI:10.1007/s11442-014-1069-3URL [本文引用: 1]
DOI:10.1016/j.chnaes.2015.03.001URL [本文引用: 1]
[本文引用: 1]
DOI:10.1111/gcb.12789PMID:25363193 [本文引用: 1]
Altered precipitation patterns resulting from climate change will have particularly significant consequences in water-limited ecosystems, such as arid to semi-arid ecosystems, where discontinuous inputs of water control biological processes. Given that these ecosystems cover more than a third of Earth's terrestrial surface, it is important to understand how they respond to such alterations. Altered water availability may impact both aboveground and belowground communities and the interactions between these, with potential impacts on ecosystem functioning; however, most studies to date have focused exclusively on vegetation responses to altered precipitation regimes. To synthesize our understanding of potential climate change impacts on dryland ecosystems, we present here a review of current literature that reports the effects of precipitation events and altered precipitation regimes on belowground biota and biogeochemical cycling. Increased precipitation generally increases microbial biomass and fungal:bacterial ratio. Few studies report responses to reduced precipitation but the effects likely counter those of increased precipitation. Altered precipitation regimes have also been found to alter microbial community composition but broader generalizations are difficult to make. Changes in event size and frequency influences invertebrate activity and density with cascading impacts on the soil food web, which will likely impact carbon and nutrient pools. The long-term implications for biogeochemical cycling are inconclusive but several studies suggest that increased aridity may cause decoupling of carbon and nutrient cycling. We propose a new conceptual framework that incorporates hierarchical biotic responses to individual precipitation events more explicitly, including moderation of microbial activity and biomass by invertebrate grazing, and use this framework to make some predictions on impacts of altered precipitation regimes in terms of event size and frequency as well as mean annual precipitation. While our understanding of dryland ecosystems is improving, there is still a great need for longer term in situ manipulations of precipitation regime to test our model. © 2014 John Wiley & Sons Ltd.
DOI:http://www.geog.com.cn/article/2021/0375-5444/10.1038/ncomms5799URL [本文引用: 1]
DOI:http://www.geog.com.cn/article/2021/0375-5444/10.1038/srep24639URLPMID:27091439 [本文引用: 1]
Drought is a main driver of interannual variation in global terrestrial net primary production. However, how and to what extent drought impacts global NPP variability is unclear. Based on the multi-timescale drought index SPEI and a satellite-based annual global terrestrial NPP dataset, we observed a robust relationship between drought and NPP in both hemispheres. In the Northern Hemisphere, the annual NPP trend is driven by 19-month drought variation, whereas that in the Southern Hemisphere is driven by 16-month drought variation. Drought-dominated NPP, which mainly occurs in semi-arid ecosystems, explains 29% of the interannual variation in global NPP, despite its 16% contribution to total global NPP. More surprisingly, drought prone ecosystems in the Southern Hemisphere, which only account for 7% of the total global NPP, contribute to 33% of the interannual variation in global NPP. Our observations support the leading role of semi-arid ecosystems in interannual variability in global NPP and highlight the great impacts of long-term drought on the global carbon cycle.
DOI:10.1111/ele.2013.16.issue-s1URL [本文引用: 1]
PMID:24765870 [本文引用: 1]
Dynamic global vegetation model (DGVM) is an important and efficient tool for study on the terrestrial carbon circle processes and vegetation dynamics. This paper reviewed the development history of DGVMs, introduced the basic structure of DGVMs, and the outlines of several world-widely used DGVMs, including CLM-DGVM, LPJ, IBIS and SEIB. The shortages of the description of dynamic vegetation mechanisms in the current DGVMs were proposed, including plant functional types (PFT) scheme, vegetation competition, disturbance, and phenology. Then the future research directions of DGVMs were pointed out, i. e. improving the PFT scheme, refining the vegetation dynamic mechanism, and implementing a model inter-comparison project.
PMID:24765870 [本文引用: 1]
DOI:10.1088/1748-9326/8/4/044018URL [本文引用: 1]
DOI:10.1073/pnas.1222471110URL [本文引用: 1]
DOI:10.1002/wcc.v2.2URL [本文引用: 1]
[本文引用: 1]
DOI:10.1371/journal.pone.0085593URL [本文引用: 1]
