 ,1, 黎夏,2, 石洪1, 刘晓娟1
An assessment of the effectiveness of China's nature reserves for mitigating anthropogenic pressures based on propensity score matching
ZHANG Han,1, LI Xia,2, SHI Hong1, LIU Xiaojuan1通讯作者:
收稿日期:2020-03-22修回日期:2020-12-20网络出版日期:2021-03-25
| 基金资助: |
Received:2020-03-22Revised:2020-12-20Online:2021-03-25
| Fund supported: |
作者简介 About authors
张涵(1996-), 女, 云南巍山人, 硕士生, 研究方向为自然保护区有效性评估。E-mail:

摘要
关键词:
Abstract
Keywords:
PDF (3351KB)元数据多维度评价相关文章导出EndNote|Ris|Bibtex收藏本文
本文引用格式
张涵, 黎夏, 石洪, 刘晓娟. 基于倾向得分匹配方法的中国自然保护区缓解人类活动压力评估. 地理学报[J], 2021, 76(3): 680-693 doi:10.11821/dlxb202103013
ZHANG Han, LI Xia, SHI Hong, LIU Xiaojuan.
1 引言
建立自然保护区是世界各国和地区避免人类活动损害生物多样性和生态系统服务的主要手段[1]。世界自然保护联盟(International Union for Conservation of Nature, IUCN)在最新的保护星球报告中指出,全球陆地保护区覆盖率从2016年的14.7%增长至2021年的15.4%[2,3]。虽然不断扩张的保护用地在一定程度上为自然留出了空间,但它仍不能完全免受人类活动的影响。有研究证明,全球1/3的自然保护地正承受着巨大的人类活动压力[4]。并且人类活动压力在生物多样性高的地方非常强烈、广泛,且呈现迅速加剧趋势[5]。自然保护区内持续增长的人类活动压力会削减其本身的保护效果。如人类活动会破坏自然保护区的生态系统[6],使得动物的栖息地减少[7,8]。此外,有研究证实人类活动带来的压力增加了物种灭绝的风险[9]。因此,对自然保护区内人类活动压力现状及其变化进行监测是保护区有效性评价的有效手段。在这一研究领域中,获取代表人类活动的数据是最困难的。一些研究通过实地调查(航空摄影、问卷调查等)的手段监测保护区内的人类活动[10,11]。这种方法精准且具有针对性,但成本较大,难以进行大尺度的研究。所以,采用耦合多源数据构建人类活动压力数据产品的方法更为通用。目前,全球已有很多套衡量人类活动压力的数据产品,涵盖了不同分辨率及类型。其中包括单一压力产品和综合压力产品。单一压力产品包括土地利用、交通与可达性、污染物、人口、入侵物种等[12]。综合压力产品则是将上述压力图层中具有代表性的几类赋予权重后叠加得到[12,13]。二者均在监测保护区内人类活动压力的研究中有着广泛的应用,但综合压力产品估算方法已成为较为普遍的共识[13]。
监测自然保护区内人类活动压力现状及其变化的目的,旨在于评估保护区缓解人类活动压力的效果。目前研究的方法大致可分为两类:不对比和对比的方法。第一种方法仅考虑保护区自身状态,不考虑周围地区。如Jones等[4]使用人类足迹产品来测量全球保护区内的人类活动压力。第二种方法将保护区内部的人类活动压力与所有未受保护地区或者缓冲区的人类活动压力进行对比。如Hellwig等[14]比较了欧洲的保护区、非保护区和保护区周围1 km缓冲区内的土地覆盖变化。Guetté等[15]探究了全球保护区和生物多样性热点区域及其25 km、25~70 km的缓冲区内夜间灯光遥感影像像元亮度值(Digital Number, DN)的变化趋势。Durán等[16]揭示了4种金属采矿活动与全球保护区及其10 km缓冲区的重叠。Radeloff等[17]采用了1940—2030年美国的住房增长数据,量化了荒野地区、国家公园和国家森林及其缓冲区的住房增长率。Qiu等[18]计算了云南省58个自然保护区及其2 km缓冲区内的3种单一压力指数(人口密度、GDP、土地利用)和综合压力指数。
以上方法存在一定的局限性。第一种方法仅考虑保护区自身的人类活动压力状况,没有与未受保护地区进行对比,难以得出合理的结论。第二种方法则难以克服样本选择性偏差的问题,即保护区的位置选择受海拔、气候、可达性等因素的影响[19,20],很难分清保护区内的人类活动压力增长量小于保护区外的原因是由于保护区的建立,还是保护区本身的地理背景影响。因此,匹配法开始被用来解决这种非随机位置的偏差[21]。Geldmann等[22]采用倾向得分匹配(Propensity Score Matching, PSM),对全球保护区的人类活动压力进行了研究,证实了该方法的有效性和合理性。倾向得分匹配是一种统计学方法,它的核心思想是根据多维观测变量来计算样本的倾向得分(Propensity Score),并将实验组和对照组的倾向得分作为距离函数来进行匹配,使两个组的观测变量尽可能相似,从而消除样本选择性偏差[23]。
目前,对中国自然保护区的研究极少考虑样本选择性偏差的问题,而全球尺度的研究则缺乏较为全面、精确的中国自然保护区边界数据。此外,受限于综合压力产品的时间分辨率,目前对保护区缓解人类活动压力的效果研究大多都停留在1990—2010年这一阶段。2010年的《生物多样性公约》第十次缔约方大会提出了2010—2020年全球生物多样性战略目标[24]。中国是《生物多样性公约》的缔约方,因此,评估中国自然保护区在2010—2020年间缓解人类活动压力的效果,对于追踪中国的保护进展有着重要的意义。
基于此,本文借鉴目前最全面的综合压力产品估算方法,耦合多源数据构建了2013年、2015年、2017年3年的中国人类活动压力指数。采用倾向得分匹配方法消除自然保护区内、外的样本选择性偏差后,选择相对有效性指标对中国自然保护区缓解人类活动压力的效果进行了评估,并通过面板模型进一步探究全国及六大地理分区的自然保护区建设对缓解人类活动压力的影响。
2 数据与方法
2.1 研究区概况
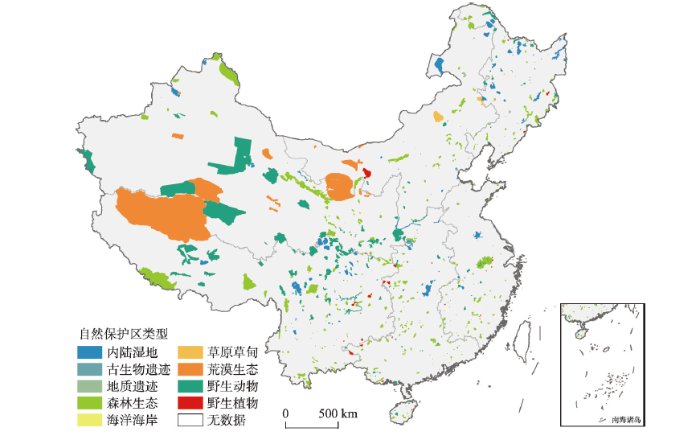
本文自然保护区边界数据来源于中国自然保护区标本资源共享平台地理信息库,共计799条矢量面数据。将采集到的数据与生态环境部发布的2017年全国自然保护区名录进行匹配,删除面积小于1 km2的保护区,最终得到680个保护区矢量边界数据,其中包括9种保护区类型(图1),覆盖了中国30个省、自治区、直辖市(暂缺上海、台湾、香港、澳门的数据)。这些保护区均建立在2013年之前。图1
 新窗口打开|下载原图ZIP|生成PPT
图12017年中国680个自然保护区空间分布
注:基于自然资源部标准地图服务网站GS(2016)2887号标准地图制作,底图无修改,下文同。
Fig. 1Spatial distribution of 680 nature reserves in China in 2017
2.2 人类活动压力指数
参考Venter等[13]的方法,选取城市建设用地、人口密度、电力设施、农田、公路和铁路来构建人类活动压力指数。构建得分规则如表1所示,将所有得分相加后,得到综合的人类活动压力指数,范围为0~57。所有数据都使用WGS 1984圆柱等面积投影,空间分辨率采样为1 km。值得注意的是,本文构建的是综合人类活动压力指数,所选择的几类压力可能存在一定关联,并非相互排斥。人类活动压力指数构建见公式(1)。式中:sall是人类活动压力总得分;surban是城市建设用地的压力得分;spop是人口的压力得分;selec是电力设施的压力得分;scrop是农田的压力得分;shighway是公路的压力得分;srail是铁路的压力得分。
Tab. 1
表1
表16种单一压力得分分配的规则
Tab. 1
| 压力 | 得分 | 描述 |
|---|---|---|
| 城市建设用地 | 0, 10 | 所有城市建设用地像元得分均为10 |
| 人口密度 | 0~10 | 人口密度大于1000人/km2的像元得分为10,其余按公式计算 |
| 电力设施 | 0~10 | 对夜间灯光数据进行分位数分级 |
| 农田 | 0, 7 | 所有农田像元得分均为7 |
| 公路 | 0~10 | 公路像元得分为10,公路外部按距离以指数递减,一直到距离公路15 km处 |
| 铁路 | 0, 10 | 所有铁路像元得分为10 |
新窗口打开|下载CSV
建设用地给自然系统带来的压力是不能忽略的。由于乡镇和村庄建设用地不易提取,此处仅考虑城市建设用地。为了便捷、准确地获得全国城市建设用地,本文采用VIIRS DNB夜间灯光数据结合统计数据的方法来提取[25]。夜间灯光数据来源于美国海洋和大气管理局国家环境信息中心数据库,全国城市建设用地面积数据来源于中华人民共和国国家统计局。首先采用VIIRS DNB夜间灯光月度数据来合成年度数据。为了减少VIIRS数据的异常值,以北京、上海、广州3个城市的像元最大值作为全国范围内的像元最大值,将大于这个值的像元都用邻域内像元的最大值取代[26]。5—8月份的VIIRS数据在北半球高纬度地区存在值缺失的情况[27],因此把至少有6个月像元值均大于0的像元作平均,并将值小于0.3 nw cm-2 sr-2的像元作为背景噪声置为0[28],得到合成年度数据。最后采用二分法找到最适提取阈值[25],提取出全国城市建设用地,并将其压力得分置为10。
人口密度数据来源于美国国家航空航天局社会经济数据和应用中心。假设人类对自然系统的压力随人口密度的增加呈对数增加,并在1000人 km-2的密度下达到饱和。于是,将人口密度大于1000人 km-2的格网压力得分置为10,而人口密度低于1000人 km-2格网,以公式(2)来计算得分。
式中:pps为人口压力得分;pd为人口密度。
电力设施可以很好地估计当地的技术发展和化石燃料的使用[29],采用VIIRS夜间灯光数据来量化它。将2013年的夜间灯光数据的辐射值用分位数的方法划分为0~10,2015年、2017年也按照同样的值来划分,让年间具有可比性。
农田提取自欧空局的土地覆盖数据,舍去农田与其他土地类型混合的像元,只保留完整农田,并将农田的压力得分置为7。
道路数据来源于开放道路数据,由于本文考虑的主要是人类活动压力在生态保护区的增长,因此主要选择了该数据中连接城镇间的道路。公路和铁路都是不透水面,因此将其本身的压力得分置为10。公路两边的压力值随着距离的增长呈现指数递减,一直到距离公路15 km。因为铁路沿线极少有人活动,因此不考虑间接影响。
2.3 倾向得分匹配方法
选取保护区内部的随机点作为实验组,保护区外部的随机点作为对照组。具体做法是,在保护区边界内创建随机点,设置距离不小于1 km,生成了27594个随机点。对应的,保护区外部则生成20万个随机点,同样设置距离不小于1 km。本文构建的人类活动压力产品的空间分辨率为1 km,若随机点的距离小于1 km,样本点可能会进入同一像元;而且研究的自然保护区最小面积约为1 km2,间距设置太大则不能保证一定的样本数量,因此选择了1 km作为最小间隔。为了避免自然保护区溢出效应的影响,保护区外部的随机点不在保护区10 km缓冲区内生成[30]。在采用对比法来探究自然保护区缓减人类活动压力的效果之前,本文参照类似研究[22, 31],选择了倾向得分匹配的方法来消除样本选择性偏差。假设人类活动压力完全取决于一组观测变量,那么通过匹配使对照组与实验组的观测变量尽可能相似,从而使两组随机点仅在是否受到保护方面有所不同[32],达到消除样本选择性偏差的目的。倾向得分匹配方法将两组随机点的倾向得分作为距离函数,根据最邻近或整体匹配的规则来进行匹配[33]。随机点i的倾向得分定义为,在给定观测变量Xi的情况下,随机点i进入实验组或对照组的概率[23]。其计算方法表示如下:
式中:
选择了高程、坡度、年均降水、年均温度、到建设用地的距离、到道路的距离和土地覆盖类型作为观测变量。高程数据来源于联合国粮食及农业组织,坡度数据采用高程数据计算得到。降水和气温站点数据来源于美国海洋和大气管理局国家环境信息中心数据库,通过反距离权重插值得到最终结果。通过现有的城市建设用地数据和道路数据计算欧氏距离,以此作为可达性的指标。六大类土地覆盖数据通过对欧空局的土地覆盖数据进行重分类得到。将2013年观测变量的值提取至点后,对实验组和对照组的随机点采取最邻近匹配的规则进行匹配,采用倾向得分的样本标准差的1/4作为卡尺大小[34](即
2.4 缓解人类活动压力的相对有效性指标
参照Geldmann等的研究,以匹配后对照组的人类活动压力增长量平均值作为基准,将保护区内人类活动压力增长量平均值减去该基准得到相对有效性指标[22],以此来量化单个保护区缓解人类活动压力的效果。当相对有效性指标为负时,保护区内的人类活动压力增长小于保护区外的基准,从某种程度上说明了该保护区达到了缓解人类活动压力的目的,即保护效果较好,反之保护效果较差。也就是说,相对有效性指标的数值越小,保护区缓解人类活动压力的效果越好。相对有效性指标的公式如下:式中:re为相对有效性指标;n1为某个保护区内的像元个数;
2.5 面板模型
当以同一基准来评估自然保护区缓解人类活动压力的效果时,其区域性差异会被忽略。因此,本文运用匹配后的随机点在2013年、2015年、2017年的变量值构建了面板模型,探讨全国及各大区的自然保护区建设对缓解人类活动压力的影响。具体做法是,对样本点构建虚拟变量PAS,值为0代表对照组,即匹配后代表非保护区的随机点;值为1代表实验组,即匹配后代表保护区的随机点。模型公式如下:式中:Yit为随机点i第t年的人类活动压力;PASit为个体哑变量,PASit = 1为实验组,PASit = 0为对照组。Xit为一系列控制变量,本文选择高程、坡度、年均降水、年均温度作为控制变量。εit为随机误差项。因为虚拟变量PAS不随时间变化,面板模型不能用固定效应模型,故采用随机效应模型。所使用的数据集如表2所示。
Tab. 2
表2
表2中国自然保护区缓解人类活动压力评估所使用的数据集
Tab. 2
| 数据 | 数据属性 | 年份 | 数据来源 |
|---|---|---|---|
| 中国自然保护区矢量边界 | 矢量数据 | - | http://www.papc.cn/ |
| 中国自然保护区名录 | 统计数据 | 2017 | http://www.mee.gov.cn/ |
| VIIRS DNB夜间灯光影像 | 遥感影像 | 2013、2015、2017 | https://www.ngdc.noaa.gov/eog/viirs/ download_dnb_composites.html |
| 中国城市建设用地面积 | 统计数据 | 2013、2015、2017 | http://www.stats.gov.cn/ |
| 人口密度 | 栅格数据 | 2010、2015、2020 | https://sedac.ciesin.columbia.edu/data/ collection/gpw-v4/sets/browse |
| 农田 | 栅格数据 | 2013、2015、2017 | http://maps.elie.ucl.ac.be/CCI/viewer/ index.php |
| 公路、铁路 | 矢量数据 | 2014、2015、2017 | https://download.geofabrik.de/ |
| 高程 | 栅格数据 | - | http://www.fao.org/soils-portal/soil-survey/soil-maps-and-databases/harmonized-world-soil-database-v12/zh/ |
| 气温、降水 | 站点数据 | 2013、2015、2017 | https://data.nodc.noaa.gov/cgi-bin/iso?id=gov.noaa.ncdc:C00516 |
新窗口打开|下载CSV
3 结果与分析
3.1 中国自然保护区的人类活动压力指数空间分布
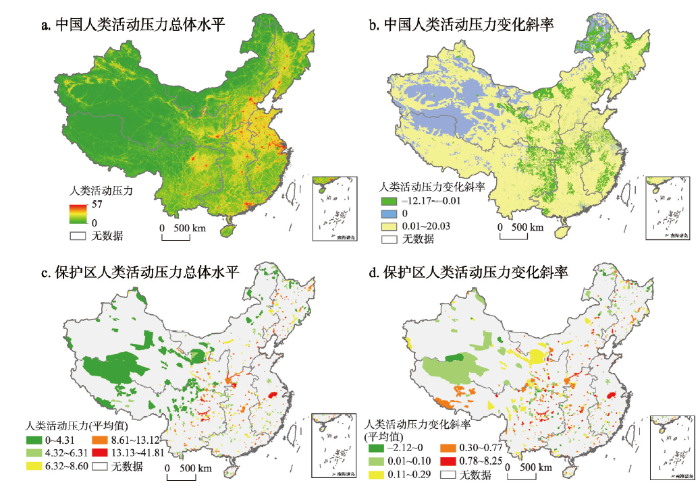
在基于倾向得分匹配方法评估保护区缓解人类活动压力的效果之前,本文对中国自然保护区的人类活动压力指数在研究时段内的总体水平和变化趋势作了分析。以2013年、2015年、2017年的平均值来衡量这3年人类活动压力指数的总体水平(图2a、2c)。采用最小二乘法计算了趋势线斜率,来表征这3年人类活动压力指数的变化趋势(图2b、2d)。斜率为正,说明人类活动压力在这段时间内呈现上升趋势,斜率为负说明呈现下降趋势,斜率为0则说明维持不变。图2
 新窗口打开|下载原图ZIP|生成PPT
图22017年中国及其自然保护区人类活动压力指数空间分布
Fig. 2Spatial distribution of Anthropogenic Pressure Index in China and its nature reserves
由图3a可见,54.68%的保护用地承受着不同程度的人类活动压力。其中,9.13%的保护用地人类活动压力指数大于7,7为农田的压力得分;5.52%的保护用地人类活动压力指数大于10,10为单一压力得分的最大值。从图2b可以看出,人类活动压力变化趋势维持不变的主要分布在城市地区、青藏高原及新疆、内蒙古部分地区,大部分地区表现出人类活动压力的上升趋势。这种趋势同样也体现在自然保护区中(图2d)。人类活动压力呈现上升趋势的自然保护区占保护区总数的86.72%,面积占43.80%,且变化斜率大多集中在0~2之间(图3b)。人类活动压力维持不变的保护用地占49.24%,呈现下降趋势的占6.98%。
图3
 新窗口打开|下载原图ZIP|生成PPT
图32017年中国自然保护区人类活动压力指数总体水平和变化斜率数值分布
Fig. 3Numerical distribution of the overall level and slope of Anthropogenic Pressure Index in China's nature reserves
3.2 倾向得分匹配的平衡性检验结果
判断匹配过程的效果主要看两点,一是看匹配前后的t统计量显著性水平的变化,二是看匹配前后标准偏差的变化[35]。倾向得分匹配的平衡性检验结果如表3所示。经t统计检验,在0.05的水平下,实验组与对照组的观测变量经匹配后无显著性差异,且所有观测变量在匹配后的标准偏差绝对值都小于5%,说明匹配结果相对较好,选择的匹配变量和匹配方法是合理的。匹配结束后,实验组、对照组分别剩余24954个、170938个随机点作为样本。Tab. 3
表3
表3倾向得分匹配的平衡性检验结果
Tab. 3
| 变量 | 均值 | 标准偏差 (%) | 标准偏差减小 幅度(%) | t检测 | |||
|---|---|---|---|---|---|---|---|
| 实验组 | 对照组 | t统计量 | t检验相伴概率 | ||||
| lnpecp | 匹配前 | -2.5682 | -2.8677 | 37.5 | 50.42 | 0.000 | |
| 匹配后 | -2.5682 | -2.5679 | 0.2 | 99.5 | 0.22 | 0.824 | |
| lntemp | 匹配前 | 3.9294 | 3.9054 | 10.3 | 15.26 | 0.000 | |
| 匹配后 | 3.9294 | 3.935 | -2.4 | 76.9 | -2.55 | 0.011 | |
| lnslope | 匹配前 | 0.76959 | 0.23972 | 29.9 | 44.54 | 0.000 | |
| 匹配后 | 0.76959 | 0.76637 | 0.2 | 99.4 | 0.22 | 0.829 | |
| lnelev | 匹配前 | 6.7174 | 6.5833 | 9.1 | 12.84 | 0.000 | |
| 匹配后 | 6.7174 | 6.7039 | 0.9 | 89.9 | 1.07 | 0.286 | |
| lntjcq | 匹配前 | 10.496 | 10.454 | 4.3 | 5.69 | 0.000 | |
| 匹配后 | 10.496 | 10.497 | -0.0 | 99.3 | -0.03 | 0.973 | |
| lntoroad | 匹配前 | 10.805 | 10.716 | 7.5 | 10.06 | 0.000 | |
| 匹配后 | 10.805 | 10.797 | 0.7 | 91.0 | 0.76 | 0.445 | |
| lnlandcover | 匹配前 | 0.73629 | 0.73672 | -0.1 | -0.10 | 0.918 | |
| 匹配后 | 0.73629 | 0.74132 | -0.9 | -1053.9 | -1.07 | 0.284 | |
新窗口打开|下载CSV
3.3 中国自然保护区缓解人类活动压力的相对有效性分析
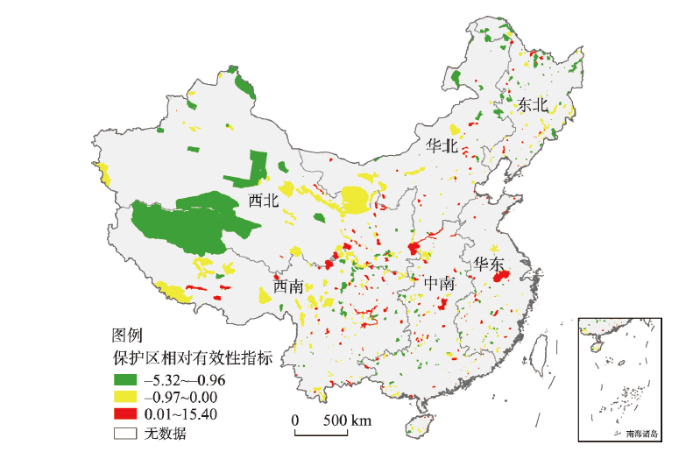
图4显示了中国自然保护区缓解人类活动压力的相对有效性指标空间分布。可以看出,全国大部分保护区的相对有效性指标都为负,数量占比约69.85%(表4),这些自然保护区在缓解人类活动压力方面的效果较好。其中,在六大地理分区中,东北、华北、西北、西南地区的相对有效性指标(平均值)为负,而华东和中南地区的相对有效性指标(平均值)为正(表4)。在不同保护区类型中,保护效果排序为荒漠生态>草原草甸>内陆湿地>森林生态>地质遗迹>古生物遗迹>野生动物>野生植物>海洋海岸(表5)。在不同保护区级别中,级别越高的保护区保护效果越好(表6),这与实际情况相符合。图4
 新窗口打开|下载原图ZIP|生成PPT
图42017年中国自然保护区缓解人类活动压力的相对有效性指标空间分布
Fig. 4The spatial distribution of relative effectiveness of China's nature reserves for mitigating anthropogenic pressures
Tab. 4
表4
表42017年中国自然保护区的相对有效性按六大区统计
Tab. 4
| 保护区类别 | 保护区数目 | 指标为负(%) | 指标为正(%) | 相对有效性(平均值) |
|---|---|---|---|---|
| 东北 | 115 | 79.13 | 20.87 | -0.40 |
| 华北 | 66 | 68.18 | 31.82 | -0.31 |
| 华东 | 90 | 56.67 | 43.33 | 0.43 |
| 中南 | 154 | 66.23 | 33.77 | 0.06 |
| 西北 | 87 | 74.71 | 25.29 | -0.30 |
| 西南 | 158 | 72.15 | 27.85 | -0.18 |
| 全国 | 670 | 69.85 | 30.15 | -0.11 |
新窗口打开|下载CSV
Tab. 5
表5
表52017年中国自然保护区的相对有效性按保护区类别统计
Tab. 5
| 保护区类别 | 保护区数目 | 指标为负(%) | 指标为正(%) | 相对有效性(平均值) |
|---|---|---|---|---|
| 草原草甸 | 7 | 85.71 | 14.29 | -0.37 |
| 地质遗迹 | 21 | 71.43 | 28.57 | -0.04 |
| 古生物遗迹 | 11 | 81.82 | 18.18 | -0.02 |
| 海洋海岸 | 11 | 63.64 | 36.36 | 0.53 |
| 荒漠生态 | 16 | 81.25 | 18.75 | -0.67 |
| 内陆湿地 | 81 | 67.90 | 32.10 | -0.28 |
| 森林生态 | 304 | 70.72 | 29.28 | -0.18 |
| 野生动物 | 179 | 68.72 | 31.28 | 0.04 |
| 野生植物 | 40 | 62.50 | 37.50 | 0.19 |
新窗口打开|下载CSV
Tab. 6
表6
表62017年中国自然保护区的相对有效性按保护区级别统计
Tab. 6
| 保护区类别 | 保护区数目 | 指标为负(%) | 指标为正(%) | 相对有效性(平均值) |
|---|---|---|---|---|
| 国家级 | 359 | 73.54 | 26.46 | -0.29 |
| 省级 | 128 | 69.53 | 30.47 | -0.06 |
| 地级市级 | 46 | 63.04 | 36.96 | 0.06 |
| 县级 | 137 | 62.77 | 37.23 | 0.27 |
新窗口打开|下载CSV
3.4 中国自然保护区建设对缓解人类活动压力的影响
面板模型结果见表7。从全国层面来看,相较于保护区外,中国自然保护区在2013—2017年可以缓解22.90%的人类活动压力。东北、华东和西南地区的自然保护区建设在缓解人类活动压力方面的效果最为显著,系数分别为-61.40%、-61.30%和-51.60%。需要注意的是,西北地区的保护区在2013—2017年并没有缓解人类活动压力,反而使人类活动压力增加。可能的原因是,中国西北地区人口较少,人类活动压力增加主要来源于道路建设,在西部大开发等政策影响下,西部地区的基础设施建设在这一阶段大幅增加,如公路和高铁,这使得保护区内的人类活动压力增加。Tab. 7
表7
表7基于倾向得分匹配的面板模型分析结果
Tab. 7
| 变量 | (1) | (2) | (1) | (2) | (3) | (4) | (5) | (6) |
|---|---|---|---|---|---|---|---|---|
| 全国 | 全国 | 东北 | 华北 | 西北 | 华东 | 西南 | 中南 | |
| PAS | -0.192*** | -0.229*** | -0.614*** | -0.263*** | 0.252*** | -0.613*** | -0.516*** | -0.279*** |
| (0.0138) | (0.0126) | (0.0292) | (0.0384) | (0.0389) | (0.0194) | (0.0194) | (0.0081) | |
| lnelev | -0.675*** | -0.568*** | -0.620*** | -0.697*** | -0.123*** | -1.183*** | -0.173*** | |
| (0.0034) | (0.0169) | (0.0113) | (0.0197) | (0.0063) | (0.0087) | (0.0036) | ||
| lnslope | 0.252*** | -0.0282*** | 0.175*** | 0.306*** | -0.0141*** | 0.0852*** | -0.0654*** | |
| (0.0030) | (0.0094) | (0.0084) | (0.0081) | (0.0048) | (0.0063) | (0.0025) | ||
| lnpecp | -0.0262*** | 0.00668*** | -0.0125*** | -0.00529*** | -0.00353 | -0.0204*** | -0.0346*** | |
| (0.0005) | (0.0022) | (0.0013) | (0.0011) | (0.0026) | (0.0010) | (0.0016) | ||
| lntemp | -0.0878*** | -0.0284*** | -0.0660*** | -0.128*** | -0.297*** | -0.294*** | -0.164*** | |
| (0.0009) | (0.0014) | (0.0017) | (0.0021) | (0.0083) | (0.0058) | (0.0058) | ||
| _cons | 1.383*** | 6.010*** | 5.145*** | 5.403*** | 6.030*** | 4.294*** | 11.38*** | 3.951*** |
| (0.0049) | (0.0226) | (0.0962) | (0.0771) | (0.1471) | (0.0484) | (0.0732) | (0.0332) | |
| N | 587448 | 577719 | 55552 | 95390 | 147855 | 56697 | 142963 | 79062 |
| R2 | 0.0010 | 0.1677 | 0.1204 | 0.0948 | 0.0340 | 0.1580 | 0.2458 | 0.3527 |
新窗口打开|下载CSV
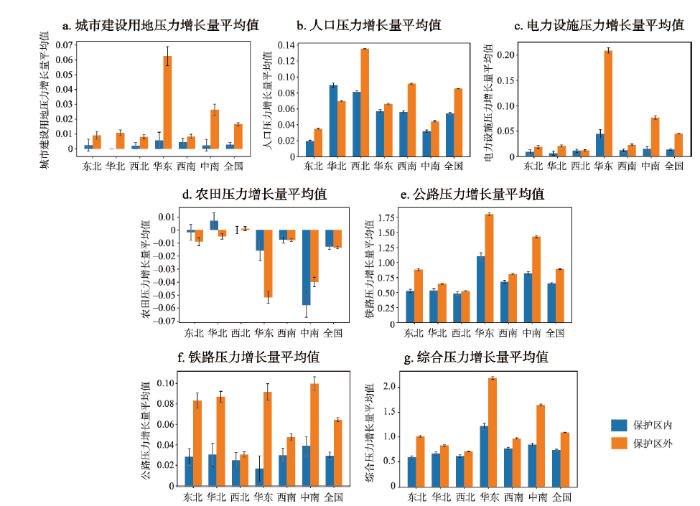
为了直观地看出不同压力指数在保护区内、外的增长量,本文计算了倾向得分匹配后随机点的人类活动压力增长量平均值(图5,其中5a~5f为单一压力指数,5g为综合压力指数,误差条为1个标准误差)。图5a、5d、5f中的单一压力指数均只有2个值,所以标准误差偏大,但本文研究的是综合压力指数,因此不影响最终结论。可以看出,公路压力增长量在综合压力增长量中占很大的比重(全国范围内,公路压力增长量总和占综合压力增长量总和的82.30%),而西北地区保护区内公路压力的增长量和保护区外接近(图5e),这证实了上述猜想。在6种单一压力指数中,除了农田以外,其他的压力均在增长,且保护区内的增长水平大都低于保护区外。值得注意的是,华北地区的保护区内人口压力增长水平高于保护区外(图5b,保护区内:平均值为0.09,标准误差为0.0026;保护区外:平均值为0.07,标准误差为0.0007)。
图5
 新窗口打开|下载原图ZIP|生成PPT
图52013—2017年人类活动压力增长量平均值(匹配后)
Fig. 5Mean change in anthropogenic pressures between 2013 and 2017 (after matching)
4 结论与讨论
4.1 结论
本文提出了基于倾向得分匹配的方法来对中国自然保护区缓解人类活动压力进行研究,发现在2013—2017年中国自然保护区的人类活动压力总体呈现上升趋势。其中人类活动压力呈现上升趋势的保护区占保护区总数的86.72%,面积约占43.80%。69.85%的自然保护区的相对有效性指标均为负,表现出较好的缓解人类活动压力的效果。尤其华东和中南地区的自然保护区内人类活动压力增长量远远超过其他地区,保护效果较差。在不同保护区类型中,除了海洋海岸、野生植物、野生动物类型以外,其余保护区类型的保护效果都较好。在不同保护区级别中则表现出级别越高的自然保护区保护效果越好。
2013—2017年中国自然保护区建设能缓解22.90%的人类活动压力。且保护区缓解人类活动压力的能力存在区域性差别,东北、华东地区和西南地区的保护区缓解人类活动压力的能力最为显著,系数分别为61.40%、61.30%和51.60%。但西北地区的保护区建设在研究时段内反而使人类活动压力增加,这可能与西部地区的基础设施建设在这一阶段大幅增加有关。
4.2 讨论
虽然中国69.85%的自然保护区在缓解人类活动压力方面表现出较好的效果,但华东和中南地区的自然保护区保护效果较差。因此,在这些区域需要控制保护区内开发与保护的关系,完善保护区管理体制。比如,在生物多样性和生态系统服务核心区,通过建设国家公园,实行划区管理[36],既能减少人类活动压力,也能满足当地发展的需求。人类活动压力增长量大的自然保护区表现出相对有效性指标数值偏大,但从面板模型的结果中可以看出,不同区域有不同的发展水平和模式,在探讨保护区缓解人类活动压力的效果时不能一刀切。在控制人类活动压力增长的同时,为了使区域经济能持续健康发展,需要区域根据发展情况来制定不同的限制增长策略,划定生态红线。比如,西北地区大幅增加的基础设施建设削弱了其自然保护区的保护效果,这需要控制自然保护区内基础设施建设的增长;华北地区的自然保护区内人口压力增长水平高于保护区外,这就需要分析这种现象的原因,并制定相应的应对措施。为了让数据在来源、分辨率上尽可能保持一致,本文没有考虑畜牧、偷猎、污染物等对自然系统产生的压力[13],这会使自然保护区内的人类活动压力被低估。同样,本文的研究时段也受到了数据本身的限制。将本研究的自然保护区面积与全国自然保护区名录中记录的面积作对比,二者的
虽然大数据和遥感在人类活动压力的研究中发挥着重要作用[37],但数据在来源、分辨率、精确度上仍存在问题。比如,由于空间分辨率、数值单位等不同,常用来代表社会经济活动的两种夜间灯光数据NPP-VIIRS和DMSP/OLS[38]还不能在时间分辨率上互补;来源一致、实时更新、精确度较高的道路数据较难获取;一些特殊的人类活动压力(比如偷猎、放牧等)也难以在大尺度上进行量化。因此,提高人类活动压力产品的质量是目前的研究方向之一。在评估自然保护区有效性的研究中,以人类活动压力作为有效性指标[22, 39]或以生物多样性和生态系统服务作为有效性指标[40,41,42,43,44]的研究都很多,但单方面评估的局限性很明显。未来对保护区有效性的研究应该聚焦到因果关系上,比如人类活动压力如何影响不同自然保护区的保护结果,以及这些保护结果将如何作出响应。
参考文献 原文顺序
文献年度倒序
文中引用次数倒序
被引期刊影响因子
DOI:10.1073/pnas.1620503114URLPMID:28137858 [本文引用: 1]

Recent expansion of the scale of human activities poses severe threats to Earth's life-support systems. Increasingly, protected areas (PAs) are expected to serve dual goals: protect biodiversity and secure ecosystem services. We report a nationwide assessment for China, quantifying the provision of threatened species habitat and four key regulating services-water retention, soil retention, sandstorm prevention, and carbon sequestration-in nature reserves (the primary category of PAs in China). We find that China's nature reserves serve moderately well for mammals and birds, but not for other major taxa, nor for these key regulating ecosystem services. China's nature reserves encompass 15.1% of the country's land surface. They capture 17.9% and 16.4% of the entire habitat area for threatened mammals and birds, but only 13.1% for plants, 10.0% for amphibians, and 8.5% for reptiles. Nature reserves encompass only 10.2-12.5% of the source areas for the four key regulating services. They are concentrated in western China, whereas much threatened species' habitat and regulating service source areas occur in eastern provinces. Our analysis illuminates a strategy for greatly strengthening PAs, through creating the first comprehensive national park system of China. This would encompass both nature reserves, in which human activities are highly restricted, and a new category of PAs for ecosystem services, in which human activities not impacting key services are permitted. This could close the gap in a politically feasible way. We also propose a new category of PAs globally, for sustaining the provision of ecosystems services and achieving sustainable development goals.
DOI:10.1016/j.jnc.2019.125723URL [本文引用: 1]
[本文引用: 1]
DOI:10.1126/science.aap9565URLPMID:29773750 [本文引用: 2]
In an era of massive biodiversity loss, the greatest conservation success story has been the growth of protected land globally. Protected areas are the primary defense against biodiversity loss, but extensive human activity within their boundaries can undermine this. Using the most comprehensive global map of human pressure, we show that 6 million square kilometers (32.8%) of protected land is under intense human pressure. For protected areas designated before the Convention on Biological Diversity was ratified in 1992, 55% have since experienced human pressure increases. These increases were lowest in large, strict protected areas, showing that they are potentially effective, at least in some nations. Transparent reporting on human pressure within protected areas is now critical, as are global targets aimed at efforts required to halt biodiversity loss.
DOI:10.1038/ncomms12558URLPMID:27552116 [本文引用: 1]
Human pressures on the environment are changing spatially and temporally, with profound implications for the planet's biodiversity and human economies. Here we use recently available data on infrastructure, land cover and human access into natural areas to construct a globally standardized measure of the cumulative human footprint on the terrestrial environment at 1 km(2) resolution from 1993 to 2009. We note that while the human population has increased by 23% and the world economy has grown 153%, the human footprint has increased by just 9%. Still, 75% the planet's land surface is experiencing measurable human pressures. Moreover, pressures are perversely intense, widespread and rapidly intensifying in places with high biodiversity. Encouragingly, we discover decreases in environmental pressures in the wealthiest countries and those with strong control of corruption. Clearly the human footprint on Earth is changing, yet there are still opportunities for conservation gains.
DOI:10.1126/science.aav0564URLPMID:30923217 [本文引用: 1]
Protected areas provide major benefits for humans in the form of ecosystem services, but landscape degradation by human activity at their edges may compromise their ecological functioning. Using multiple lines of evidence from 40 years of research in the Serengeti-Mara ecosystem, we find that such edge degradation has effectively
DOI:10.1126/sciadv.1501675URLPMID:27051881 [本文引用: 1]
The global population of wild tigers remains dangerously low at fewer than 3500 individuals. Habitat loss, along with poaching, can undermine the international target recovery of doubling the number of wild tigers by 2022. Using a new satellite-based monitoring system, we analyzed 14 years of forest loss data within the 76 landscapes (ranging from 278 to 269,983 km(2)) that have been prioritized for conservation of wild tigers. Our analysis provides an update of the status of tiger habitat and describes new applications of technology to detect precisely where forest loss is occurring in order to curb future habitat loss. Across the 76 landscapes, forest loss was far less than anticipated (79,597 +/- 22,629 km(2), 7.7% of remaining habitat) over the 14-year study period (2001-2014). Habitat loss was unevenly distributed within a subset of 29 landscapes deemed most critical for doubling wild tiger populations: 19 showed little change (1.5%), whereas 10 accounted for more than 98% (57,392 +/- 16,316 km(2)) of habitat loss. Habitat loss in source population sites within 76 landscapes ranged from no loss to 435 +/- 124 km(2) ([Formula: see text], SD = 89, total = 1676 +/- 476 km(2)). Doubling the tiger population by 2022 requires moving beyond tracking annual changes in habitat. We highlight near-real-time forest monitoring technologies that provide alerts of forest loss at relevant spatial and temporal scales to prevent further erosion.
DOI:10.1111/gcb.12553URL [本文引用: 1]
China's extensive urbanization has resulted in a massive loss of natural habitat, which is threatening the nation's biodiversity and socioeconomic sustainability. A timely and accurate understanding of natural habitat loss caused by urban expansion will allow more informed and effective measures to be taken for the conservation of biodiversity. However, the impact of urban expansion on natural habitats is not well-understood, primarily due to the lack of accurate spatial information regarding urban expansion across China. In this study, we proposed an approach that can be used to accurately summarize the dynamics of urban expansion in China over two recent decades (1992-2012), by integrating data on nighttime light levels, a vegetation index, and land surface temperature. The natural habitat loss during the time period was evaluated at the national, ecoregional, and local scales. The results revealed that China had experienced extremely rapid urban growth from 1992 to 2012 with an average annual growth rate of 8.74%, in contrast with the global average of 3.20%. The massive urban expansion has resulted in significant natural habitat loss in some areas in China. Special attention needs to be paid to the Pearl River Delta, where 25.79% or 1518 km(2) of the natural habitat and 41.99% or 760 km(2) of the local wetlands were lost during 1992-2012. This raises serious concerns about species viability and biodiversity. Effective policies and regulations must be implemented and enforced to sustain regional and national development in the context of rapid urbanization.
DOI:10.1038/s41467-018-07049-5URLPMID:30397204 [本文引用: 1]
[本文引用: 1]
DOI:10.1016/j.gecco.2018.e00405URL [本文引用: 1]
DOI:10.1111/cobi.12332URL [本文引用: 2]
It is widely accepted that the main driver of the observed decline in biological diversity is increasing human pressure on Earth's ecosystems. However, the spatial patterns of change in human pressure and their relation to conservation efforts are less well known. We developed a spatially and temporally explicit map of global change in human pressure over 2 decades between 1990 and 2010 at a resolution of 10 km(2). We evaluated 22 spatial data sets representing different components of human pressure and used them to compile a temporal human pressure index (THPI) based on 3 data sets: human population density, land transformation, and electrical power infrastructure. We investigated how the THPI within protected areas was correlated to International Union for Conservation of Nature (IUCN) management categories and the human development index (HDI) and how the THPI was correlated to cumulative pressure on the basis of the original human footprint index. Since the early 1990s, human pressure increased 64% of the terrestrial areas; the largest increases were in Southeast Asia. Protected areas also exhibited overall increases in human pressure, the degree of which varied with location and IUCN management category. Only wilderness areas and natural monuments (management categories Ib and III) exhibited decreases in pressure. Protected areas not assigned any category exhibited the greatest increases. High HDI values correlated with greater reductions in pressure across protected areas, while increasing age of the protected area correlated with increases in pressure. Our analysis is an initial step toward mapping changes in human pressure on the natural world over time. That only 3 data sets could be included in our spatio-temporal global pressure map highlights the challenge to measuring pressure changes over time. Mapeo del Cambio en la Presion Humana Global en Tierra y Dentro de areas Protegidas;Resumen Se acepta ampliamente que el principal conductor de la declinacion observada en la diversidad biologica esta incrementando la presion humana sobre los ecosistemas de la Tierra. Sin embargo, los patrones espaciales de cambio en la presion humana y su relacion con los esfuerzos de conservacion son menos conocidos. Desarrollamos un mapa temporal y espacialmente explicito del cambio global en la presion humana a lo largo de 2 decadas entre 1990 y 2010 y con una resolucion de 10 Km(2). Evaluamos 22 series de datos espaciales que representaban diferentes componentes de la presion humana y los usamos para compilar un indice de presion humana temporal (THPI, en ingles) basado en 3 series de datos: densidad de poblacion humana, transformacion de suelo y la infraestructura de poder electrico. Investigamos como el THPI dentro de areas protegidas estaba correlacionado con las categorias de manejo de la Union Internacional para la Conservacion de la Naturaleza (UICN) y el indice de desarrollo humano (HDI, en ingles) y como el THPI estaba correlacionado con la presion acumulativa con base en el indice original de la huella humana. Desde principios de los 90, la presion humana incremento en 64% de las areas terrestres; siendo los incrementos mayores en el sureste asiatico. Las areas protegidas tambien exhibieron incrementos generales en la presion humana, cuyo grado vario de acuerdo a la localidad y la categoria de manejo de la UICN. Solo las areas silvestres y los monumentos naturales (categorias de manejo Ib y III) exhibieron disminuciones en la presion. Las areas protegidas sin una categoria asignada exhibieron los incrementos mas grandes. Los valores altos de HID y la elevacion media mayor se correlacionaron con reducciones mayores en la presion a lo largo de areas protegidas, mientras incrementaban la edad del area protegida correlacionada con incrementos en la presion. Nuestro analisis es un paso inicial hacia el mapeo de cambios en la presion humana sobre el mundo natural a traves del tiempo. El hecho de que solamente 3 series de
DOI:10.1038/sdata.2016.67URLPMID:27552448 [本文引用: 4]
Remotely-sensed and bottom-up survey information were compiled on eight variables measuring the direct and indirect human pressures on the environment globally in 1993 and 2009. This represents not only the most current information of its type, but also the first temporally-consistent set of Human Footprint maps. Data on human pressures were acquired or developed for: 1) built environments, 2) population density, 3) electric infrastructure, 4) crop lands, 5) pasture lands, 6) roads, 7) railways, and 8) navigable waterways. Pressures were then overlaid to create the standardized Human Footprint maps for all non-Antarctic land areas. A validation analysis using scored pressures from 3114x1 km(2) random sample plots revealed strong agreement with the Human Footprint maps. We anticipate that the Human Footprint maps will find a range of uses as proxies for human disturbance of natural systems. The updated maps should provide an increased understanding of the human pressures that drive macro-ecological patterns, as well as for tracking environmental change and informing conservation science and application.
DOI:10.1371/journal.pone.0219374URLPMID:31314769 [本文引用: 1]
Land cover change is a dynamic phenomenon driven by synergetic biophysical and socioeconomic effects. It involves massive transitions from natural to less natural habitats and thereby threatens ecosystems and the services they provide. To retain intact ecosystems and reduce land cover change to a minimum of natural transition processes, a dense network of protected areas has been established across Europe. However, even protected areas and in particular the zones around protected areas have been shown to undergo land cover changes. The aim of our study was to compare land cover changes in protected areas, non-protected areas, and 1 km buffer zones around protected areas and analyse their relationship to climatic and socioeconomic factors across Europe between 2000 and 2012 based on earth observation data. We investigated land cover flows describing major change processes: urbanisation, afforestation, deforestation, intensification of agriculture, extensification of agriculture, and formation of water bodies. Based on boosted regression trees, we modelled correlations between land cover flows and climatic and socioeconomic factors. The results show that land cover changes were most frequent in 1 km buffer zones around protected areas (3.0% of all buffer areas affected). Overall, land cover changes within protected areas were less frequent than outside, although they still amounted to 18,800 km2 (1.5% of all protected areas) from 2000 to 2012. In some parts of Europe, urbanisation and intensification of agriculture still accounted for up to 25% of land cover changes within protected areas. Modelling revealed meaningful relationships between land cover changes and a combination of influencing factors. Demographic factors (accessibility to cities and population density) were most important for coarse-scale patterns of land cover changes, whereas fine-scale patterns were most related to longitude (representing the general east/west economic gradient) and latitude (representing the north/south climatic gradient).
DOI:10.1016/j.biocon.2018.04.018URL [本文引用: 1]
DOI:10.1016/j.biocon.2013.02.003URL [本文引用: 1]
The global protected area (PA) system has a key role to play in biological conservation, and it is thus vital to understand the factors that are likely to limit this potential. Attention to date has focused foremost on the consequences of biases in the spatial distribution of PAs for their effectiveness and efficiency in representing biodiversity. What is less clear is the extent to which these biases may also have affected the likelihood with which PAs coincide with or are influenced by particular kinds of threatening processes, further undermining their role. An obvious candidate for such concerns is metal mining activities. Here we demonstrate that approximately 7% of mines for four key metals directly overlap with PAs and a further 27% lie within 10 km of a PA boundary. Moreover, those PAs with mining activity within their boundaries constitute around 6% of the total areal coverage of the global terrestrial PA system, and those with mining activity within or up to 10 km from their boundary constitute nearly 14% of the total area. Given the distances over which mining activities can have influences, the persistence of their effects (often long after actual operations have closed down), and the rapidly growing demand for metals, there is an urgent need to limit or mitigate such conflicts. (C) 2013 Elsevier Ltd.
DOI:10.1073/pnas.0911131107URLPMID:20080780 [本文引用: 1]
Protected areas are crucial for biodiversity conservation because they provide safe havens for species threatened by land-use change and resulting habitat loss. However, protected areas are only effective when they stop habitat loss within their boundaries, and are connected via corridors to other wild areas. The effectiveness of protected areas is threatened by development; however, the extent of this threat is unknown. We compiled spatially-detailed housing growth data from 1940 to 2030, and quantified growth for each wilderness area, national park, and national forest in the conterminous United States. Our findings show that housing development in the United States may severely limit the ability of protected areas to function as a modern
DOI:10.1038/s41598-018-21654-wURLPMID:29459749 [本文引用: 1]
The analysis of status and major sources of human pressures on natural reserves (NRs) is important for optimizing their management. This study selected population density, gross domestic product (GDP) density and areal percentage of human land use to reveal the human pressures of national and provincial NRs (NNRs and PNRs) in Yunnan Province, China. We calculated three types of internal and external human pressure index (HPI) and comprehensive HPI (CHPI) for NRs. Human pressures on most of NRs were slight and light, indicating that most of NRs were well protected. Human pressures on PNRs were higher than on NNRs; with respect to five types of NRs, geological relict NRs were facing the highest human pressures, followed by wetland ecosystem NRs. Land use and population density were the main human pressures on these NRs. Yunnan Province should put the highest emphasis on three NNRs and two Ramsar site PNRs with severe CHPI, secondly pay attention to eight conservation-oriented PNRs with extreme or severe CHPI. It's urgent for Yunnan to implement scientific policies and measures to reduce land use and population density pressures of NRs, especially with severe and extreme CHPI, by transforming internal land use and/or implementing residents' eco-migration.
DOI:10.3724/SP.J.1003.2013.08048URL [本文引用: 1]
To protect its huge biodiversity, China has established 2,640 nature reserves, including 318 terrestrial national nature reserves, covering ~15% of its landmass. It is necessary to characterize the geographical distribution of these nature reserves along natural and socio-economic gradients before evaluating their effectiveness in conserving China’s biodiversity. We did this using geographic information system (GIS) analysis. The results show that, the coverage of nature reserves is unbalanced across China. In total, there are 2,150 counties (91% of the total) with <10% coverage of nature reserves, of which 150 have <6% coverage and 1,726 (73%) have no nature reserves at all. A higher coverage of nature reserves tends to occur in regions of higher elevation, lower temperature, less precipitation, and less vegetation productivity. Nature reserves tend to be established therefore at high and cold locations in poor remote areas where human activities (including farming) are greatly reduced. In contrast, in warm humid and productive areas for farming and horticulture, nature reserve coverage is relatively low.
[本文引用: 1]
DOI:10.1371/journal.pone.0008273URLPMID:20011603 [本文引用: 1]
BACKGROUND: About an eighth of the earth's land surface is in protected areas (hereafter
DOI:10.1111/j.1749-6632.2009.05162.xURLPMID:20146766 [本文引用: 1]
Protected areas are leading tools in efforts to slow global species loss and appear also to have a role in climate change policy. Understanding their impacts on deforestation informs environmental policies. We review several approaches to evaluating protection's impact on deforestation, given three hurdles to empirical evaluation, and note that
DOI:10.1073/pnas.1908221116URLPMID:31659036 [本文引用: 4]
One-sixth of the global terrestrial surface now falls within protected areas (PAs), making it essential to understand how far they mitigate the increasing pressures on nature which characterize the Anthropocene. In by far the largest analysis of this question to date and not restricted to forested PAs, we compiled data from 12,315 PAs across 152 countries to investigate their ability to reduce human pressure and how this varies with socioeconomic and management circumstances. While many PAs show positive outcomes, strikingly we find that compared with matched unprotected areas, PAs have on average not reduced a compound index of pressure change over the past 15 y. Moreover, in tropical regions average pressure change from cropland conversion has increased inside PAs even more than in matched unprotected areas. However, our results also confirm previous studies restricted to forest PAs, where pressures are increasing, but less than in counterfactual areas. Our results also show that countries with high national-level development scores have experienced lower rates of pressure increase over the past 15 y within their PAs compared with a matched outside area. Our results caution against the rapid establishment of new PAs without simultaneously addressing the conditions needed to enable their success.
DOI:10.1093/biomet/70.1.41URL [本文引用: 2]
[本文引用: 1]
[本文引用: 1]
URL [本文引用: 2]
Night\|light data from the Defense Meteorological Satellite Program (DMSP) Operational Linescan System (OLS) has been widely utilized to derive the urban built\|up areas.Four major methods,including Empirical Thresholding,Sudden Change Detection,Statistics\|assisted Thresholding,and TM\|assisted Thresholding,have been proposed to determine the threshold value for separating the illuminated urban areas from the dark background of rural areas in DMSP/OLS night\|light images.This paper makes a comprehensive assessment of those methods through a case study of Shanghai,China.The methods are implemented to extract the urban built\|up area for Shanghai using DMSP/OLS stable light data acquired in 2003.Then,the same threshold values obtained from 2003 DMSP/OLS night\|light data are applied respectively to the 2000 and 2006 DMSP/OLS data,resulting in a significant error in urban built\|up area detection.This analysis result suggests that the threshold value determined for a specific year cannot be extended and transferred to other years.The failure in temporal extensibility of threshold value means that an appropriate threshold value has to be determined for every year when a time series of DMSP/OLS nigh\|light data need to be processed.Therefore,the method that determines threshold value independent of reference data is more suitable for processing time series DMSP/OLS data.The Sudden Change Detection method does not require ancillary reference data and is the best choice of those methods considering the convenience,accuracy,and automated data processing,and it is then adopted to derive the urban built\|up areas of Shanghai from 2000 to 2006.
[本文引用: 2]
DOI:10.3390/su9020305URL [本文引用: 1]
DOI:10.1080/01431161.2017.1331060URL [本文引用: 1]
DOI:10.1080/01431161.2018.1482022URL [本文引用: 1]
DOI:10.1641/0006-3568(2002)052[0891:THFATL]2.0.CO;2URL [本文引用: 1]
DOI:10.1111/cobi.12851URLPMID:27696505 [本文引用: 1]
1, p
DOI:10.1016/j.biocon.2018.11.012URL [本文引用: 1]
DOI:10.1016/j.scitotenv.2020.137001URL [本文引用: 1]
2nd ed.
[本文引用: 1]
2版.
[本文引用: 1]
[本文引用: 1]
[本文引用: 1]
[本文引用: 1]
[本文引用: 1]
[本文引用: 1]
DOI:10.1016/j.gloenvcha.2019.02.001URL [本文引用: 1]
DOI:10.1016/j.rse.2017.01.005URL [本文引用: 1]
[本文引用: 1]
[本文引用: 1]
DOI:10.1038/ncomms12306URLPMID:27465407 [本文引用: 1]
Protected areas are widely considered essential for biodiversity conservation. However, few global studies have demonstrated that protection benefits a broad range of species. Here, using a new global biodiversity database with unprecedented geographic and taxonomic coverage, we compare four biodiversity measures at sites sampled in multiple land uses inside and outside protected areas. Globally, species richness is 10.6% higher and abundance 14.5% higher in samples taken inside protected areas compared with samples taken outside, but neither rarefaction-based richness nor endemicity differ significantly. Importantly, we show that the positive effects of protection are mostly attributable to differences in land use between protected and unprotected sites. Nonetheless, even within some human-dominated land uses, species richness and abundance are higher in protected sites. Our results reinforce the global importance of protected areas but suggest that protection does not consistently benefit species with small ranges or increase the variety of ecological niches.
DOI:10.1016/j.biocon.2013.02.018URL [本文引用: 1]
Protected Areas (PAs) are a critical tool for maintaining habitat integrity and species diversity, and now cover more than 12.7% of the planet's land surface area. However, there is considerable debate on the extent to which PAs deliver conservation outcomes in terms of habitat and species protection. A systematic review approach is applied to investigate the evidence from peer reviewed and grey literature on the effectiveness of PAs focusing on two outcomes: (a) habitat cover and (b) species populations. We only include studies that causally link conservation inputs to outcomes against appropriate counterfactuals. From 2599 publications we found 76 studies from 51 papers that evaluated impacts on habitat cover, and 42 studies from 35 papers on species populations. Three conclusions emerged: first, there is good evidence that PM have conserved forest habitat; second, evidence remains inconclusive that PAs have been effective at maintaining species populations, although more positive than negative results are reported in the literature; third, causal connections between management inputs and conservation outcomes in PM are rarely evaluated in the literature. Overall, available evidence suggests that PM deliver positive outcomes, but there remains a limited evidence base, and weak understanding of the conditions under which PM succeed or fail to deliver conservation outcomes. (C) 2013 Elsevier Ltd.
DOI:10.1890/100093URL [本文引用: 1]
Mainland China has 2538 nature reserves, covering approximately 15% of its total land area. However, little is known of their effectiveness in capturing the country's ecological diversity. We calculated the degree of representation of terrestrial ecoregions, biodiversity priority areas, and vegetation types within 2217 of these reserves for which spatial data were available. Of the total area set aside as nature reserves, almost 56% was concentrated in the three western provinces of Tibet, Qinghai, and Xinjiang. Of the 53 ecoregions found in China, 29 had over 10% of their land protected through the reserve system; in addition, most (81%) of China's natural vegetation communities were represented in at least one nature reserve. On the basis of these findings, we recommend that China should (1) conduct a nationwide ecoregional biodiversity assessment; (2) establish a georeferenced (spatially referenced) database of nature reserves and other types of protected areas; (3) increase efforts to improve international cooperation regarding management of cross-border ecoregions; and (4) create or expand reserves in eastern and southern China, with a focus on protecting ecosystem services to help sustain local communities' economies.
DOI:10.1073/pnas.0800437105URLPMID:18854414 [本文引用: 1]
Global efforts to reduce tropical deforestation rely heavily on the establishment of protected areas. Measuring the effectiveness of these areas is difficult because the amount of deforestation that would have occurred in the absence of legal protection cannot be directly observed. Conventional methods of evaluating the effectiveness of protected areas can be biased because protection is not randomly assigned and because protection can induce deforestation spillovers (displacement) to neighboring forests. We demonstrate that estimates of effectiveness can be substantially improved by controlling for biases along dimensions that are observable, measuring spatial spillovers, and testing the sensitivity of estimates to potential hidden biases. We apply matching methods to evaluate the impact on deforestation of Costa Rica's renowned protected-area system between 1960 and 1997. We find that protection reduced deforestation: approximately 10% of the protected forests would have been deforested had they not been protected. Conventional approaches to evaluating conservation impact, which fail to control for observable covariates correlated with both protection and deforestation, substantially overestimate avoided deforestation (by over 65%, based on our estimates). We also find that deforestation spillovers from protected to unprotected forests are negligible. Our conclusions are robust to potential hidden bias, as well as to changes in modeling assumptions. Our results show that, with appropriate empirical methods, conservation scientists and policy makers can better understand the relationships between human and natural systems and can use this to guide their attempts to protect critical ecosystem services.
DOI:10.1016/j.jnc.2019.125749URL [本文引用: 1]
