 ,, 游珍,, 杨艳昭, 施慧中国科学院地理科学与资源研究所资源利用与环境修复实验室,北京100101
Comprehensive evaluation of resource and environment carrying capacity of Tibet based on a three-dimensional tetrahedron model
FENG Zhiming,, YOU Zhen,, YANG Yanzhao, SHI HuiResource Utilization and Environmental Remediation Laboratory, Institute of Geographic Sciences and Natural Resources Research, CAS, Beijing 100101, China通讯作者:
收稿日期:2020-06-30修回日期:2021-03-9网络出版日期:2021-03-25
| 基金资助: |
Received:2020-06-30Revised:2021-03-9Online:2021-03-25
| Fund supported: |
作者简介 About authors
封志明(1963-), 男, 河北平山人, 博士, 研究员, 主要从事资源开发与区域可持续发展。E-mail:

摘要
关键词:
Abstract
Keywords:
PDF (4778KB)元数据多维度评价相关文章导出EndNote|Ris|Bibtex收藏本文
本文引用格式
封志明, 游珍, 杨艳昭, 施慧. 基于三维四面体模型的西藏资源环境承载力综合评价. 地理学报[J], 2021, 76(3): 645-662 doi:10.11821/dlxb202103011
FENG Zhiming, YOU Zhen, YANG Yanzhao, SHI Hui.
1 引言
资源环境承载力是对资源承载力、环境容量(环境承载力)、生态承载力等概念与内涵的集成表达[1]。作为地理学、生态学、环境科学等学科的研究热点,资源环境承载力不仅是一个探讨“最大负荷”的具有人类极限意义的科学命题[2],而且是一个极具实践价值的人口与资源环境协调发展的政策议题,甚至是一个涉及人与自然关系、关乎人类命运共同体的哲学问题[2]。早在20世纪初期,资源环境承载力概念已具雏形,最早可见于1902年Pfaundler的“物理观点之世界经济”和美国1906年农业部年鉴[3,4]。20世纪末期以来,出于对资源耗竭和环境恶化的科学关注,资源环境承载力在区域规划、生态系统服务评估、全球环境现状与发展趋势以及可持续发展研究领域受到越来越多的重视[5,6,7]。作为描述发展限制的概念,国内****长期致力于资源环境承载力评价方法研究,水土资源[8,9,10,11,12,13,14,15,16,17]、生态环境[18,19,20,21,22,23,24,25]和海洋资源[26,27,28]等主要类别的资源环境承载力成果为主体功能区划、人口发展规划、灾后重建规划和国土空间规划等发挥了重要的科技支撑作用[29,30,31,32,33,34,35,36]。资源环境承载力评价从分类到综合,已由关注单一资源约束发展到人类对资源占有的综合评估。资源环境承载力综合研究兴起以来,为统一量纲,人们试图把不同物质折算成能量、货币或其他尺度,以求横向对比与综合计量。从20世纪末——21世纪初,****们发展了基于生态足迹的“虚拟土地”[37,38,39]、基于水足迹的“虚拟水”[40,41]和基于能值分析的“虚拟能量”[42,43,44,45]等理论与实践相结合的资源环境承载力综合评价理论与方法,极大地推动了承载力研究的跨世纪发展。上述基于当量折算的思想开展的资源环境承载力综合评价与模型方法在实践中仍存在一些缺憾,如生态足迹法主要根据吸收CO2排放量转化为对应土地面积的计算方法忽视了不同国家和地区地理环境的差异以及人类社会对自然资产的储存等[46],所计算的结果多为象征性的指向指标,对可持续发展的指导意义相对有限[47];“虚拟水”与水足迹强调通过贸易的手段节约农业需水,但如果所节约的水量无法被二、三产业吸收以产生更大的效益,所节约的水资源反而成为了一种浪费[48];能值理论与能值分析方法计算较为繁杂、能值流程图尚未有一个较为科学而全面的绘制标准、能值计算过程中对研究对象的区域性和动态性考虑不周等[49,50,51]。基于“压力—状态—响应”[52,53,54,55]等相关理论,通过对一系列指标进行数学处理或直接加权得出一个综合指数,也是近年来资源环境承载力综合评价的一种典型研究方法,这种综合评价忽略了单要素承载力的基础意义,评价结果的综合指数为一个无量纲的表征值,导致物理意义不清晰,政策指导意义不强[56]。也有****将系统动力学模型[57]、多目标函数[58]、神经网络[59]等方法用于资源环境承载力综合模拟评价,但都未能解决承载力的物理意义不清晰的弊端。
资源环境承载力定量评价与综合计量是资源环境承载力研究由分类走向综合、由基础走向应用的关键技术环节所在。如何在现有较为成熟的单要素承载力评价的基础之上,发展一套标准化、模式化的资源环境承载力综合评价方法,是当前资源环境承载力研究的重点任务和亟待解决的关键问题。基于此,本文以水土资源和生态环境承载力分类评价为基础,结合人居环境适宜性评价与社会经济发展适应性评价,研究提出了“人居环境适宜性分区—资源环境承载力限制性分类—社会经济发展适应性分等—资源环境承载力警示性分级”的资源环境承载力综合评价的研究思路与技术路线,构建了具有平衡态意义的资源环境承载能力综合评价的三维四面体模型;面向第二次青藏高原科学考察的现实需求,以公里格网为基础,以分县为基本文单元,实证评估了西藏自治区的资源环境综合承载力,定量揭示了西藏不同地区的资源环境综合承载力及其承载状态,以期为区域资源环境承载力监测预警提供决策支持,为实现区域可持续发展提供科学依据。
2 基本思路与研究方法
2.1 理论框架与基本思路
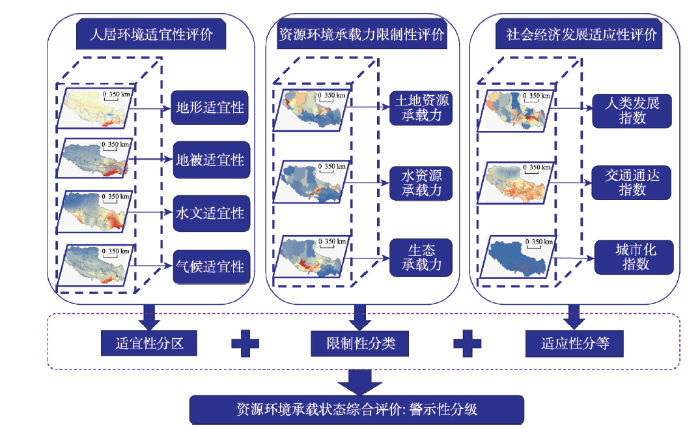
人地关系是人类存在就有的客观关系,人地关系地域系统是一个复杂巨系统,人是该系统的主体与核心,资源、环境则是该系统存在的物质基础[60]。根据增长极限理论,人类社会在追求经济增长的同时,必须关注资源环境承载力问题。同时,对于如此复杂的巨系统,我们需从系统的角度强调整体有机性,一方面,人是社会经济活动的主体,以其特有的文明和智慧协同大自然为自己服务,使其物质文化生活水平以正反馈为特征持续上升;另一方面,人是大自然的一员,其一切宏观性质的活动,都不能违背自然生态系统的基本规律,都受到自然条件的负反馈约束和调节[61]。《我们共同的未来》中首次提出实现可持续发展的概念,其实质就是要促进人与自然的和谐,实现经济发展和人口、资源、环境相互协调[62]。具体来说,由地形、气候、地被和水文等自然因子构成的人居环境,是人类联系自然、作用自然的主要场所,从根本上制约着区域人口的集聚水平与分布格局[63];而水土资源和生态环境则是人类生存和发展需要的主要资源环境要素,是关乎区域发展“最大负荷”的限制性条件[64];与此同时,社会经济发展对区域资源环境承载力综合承载状态起着调节作用,可以通过人类发展水平、交通通达度和城市化率等指标来评价。也就是说,一方面,人口发展与空间布局既要与人居环境自然适宜性相一致,又要与资源环境承载力相适应。这不仅体现了人居环境的自然适宜性,也体现了资源环境承载力的自然限制性;另一方面,人口发展与空间布局既要与资源环境承载力相适应,也要与社会经济发展相协调,这体现了社会经济发展对资源环境限制性的进一步适应,包括强化和调整[65]。根据以上理论框架,本文的基本思路是基于人口与资源环境和社会经济协调发展的视角,以人居环境自然适宜性分区为前提,以资源环境承载力限制性分类为基础,以社会经济发展适应性分等为调控,最终从系统角度完成区域尺度上资源环境承载力的警示性分级,实现区域资源环境承载力系统集成与综合评价,总体研究思路如图1所示。
图1
 新窗口打开|下载原图ZIP|生成PPT
图1资源环境承载力综合评价研究思路示意图
Fig. 1Research thoughts for comprehensive evaluation of resource and environmental carrying capacity
2.2 研究方法与技术流程
遵循“人居环境适宜性分区——资源环境承载力限制性分类——社会经济发展适应性分等——资源环境承载力警示性分级”的资源环境承载力综合评价的研究思路和技术路线,由分类到综合,建立基于人居环境适宜指数、资源承载限制指数和社会经济发展指数的资源环境综合承载指数模型,逐步完成人居环境适宜性分区、水土资源和生态环境限制性分类、社会经济发展适应性分等和资源环境承载状态警示性分级。第一步,建立基于地形起伏度、地被指数、水文指数和温湿指数的人居环境适宜指数(HSI)模型,以公里格网为基础,逐步完成区域人居环境适宜性评价与适宜性分区。
第二步,建立基于土地资源承载指数、水资源承载指数和生态承载指数的资源承载限制指数(RCI)模型,以分县或适宜流域为单元,逐步完成水土资源和生态环境承载力评价和限制性分类。
第三步,建立基于人类发展指数、交通通达指数和城市化指数的社会经济发展指数(SDI)模型,以分县为研究单元逐步完成区域社会经济发展水平评价与适应性分等。
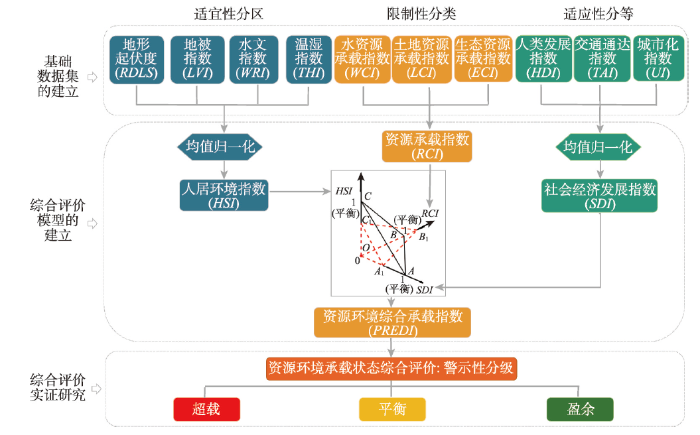
第四步,建立基于人居环境适宜指数、资源承载限制指数和社会经济发展指数的资源环境综合承载指数(PREDI)模型,从分项到综合,逐级完成区域资源环境承载力综合评价与警示性分级。以上“3+1”框架的总体技术路线如图2所示。
图2
 新窗口打开|下载原图ZIP|生成PPT
图2西藏资源环境承载综合评价工作流程图
Fig. 2Flow chart of comprehensive evaluation methods of resource and environmental carrying in Tibet
(1)人居环境适宜指数模型
区域人居环境适宜性可以通过人居环境适宜指数来表达。人居环境适宜指数是归一化后的地形起伏度、地被指数、水温指数和温湿指数的数理综合(各基础指数计算方法见表1)[63],具体归一化方法如下:
Tab. 1
表1
表1人居环境各分项指数的计算方法列表
Tab. 1
| 指标名称 | 计算公式 | 变量解释 |
|---|---|---|
| 地形起伏度 | RDLS为地形起伏度;ALT为以某一栅格单元为中心一定区域内的平均海拔;Max(H)和Min(H)分别为该区域内的最高与最低海拔;P(A)为区域内的平地面积;A为区域总面积。 | |
| 地被指数 | LTi为以某一栅格单元为中心一定区域的土地利用类型指数;Li为该区域内的第i种土地利用类型;Ai为该区域内第i种土地利用类型的面积;A为区域总面积;LVI为地被指数;NNDVI为该单元格标准化后的归一化植被指数;NLTi为归一化后的土地利用类型指数。 | |
| 水文指数 | WRI为水文指数;P为归一化的降水量;Wa为归一化的水网密度;L为归一化的湖泊密度;α、β和λ分别为降水、水网与湖泊的权重。 | |
| 温湿指数 | THI为温湿指数;t为月均温;f为月均空气相对湿度。 |
新窗口打开|下载CSV
式中:xi*为变量x在区域i归一化后的值;xi为变量x在区域i的原始值;X是变量x的集合。在本文中,只有地形起伏度用式(2)进行归一化,其它指数依式(1)进行归一化。考虑到地形因素对人居环境的决定性作用,本文建立了以地形起伏度为高,地被指数、水温指数和温湿指数为底的三角锥空间模型(图3),用来计算人居环境适宜指数。为了保留“3+1”框架下综合指数为1时的物理意义(即平衡状态),本文将归一化后的HSI进行了平移化处理,即均值归一化,其计算方法如下:
式中:HSI是均值归一化处理之后的人居环境适宜指数;HSIone为HSIv按式(1)归一化之后的人居环境适宜指数;k为研究区域HSIone的均值[63];V1为四面体A1B1C1D1的体积;V0为四面体ABCD的体积;OA1、OB1、OC1和OD1分别为地被指数、水文指数、温湿指数和地形起伏度归一化后的实际值;OA、OB、OC和OD分别为地被指数、水文指数、温湿指数和地形起伏度归一化后的标准值,均为1。
图3
 新窗口打开|下载原图ZIP|生成PPT
图3人居环境适宜性指数模型
Fig. 3Human settlement environment index model
由于基于公里网格数据的人居环境适宜性样本数据量大,本文采用均值标准差分级法,能最大化显示要素属性值与平均值之间的差异(表2)。当HSI = 1时,代表区域人居环境的平均状态,STD为研究区域HSIone的标准差。
Tab. 2
表2
表2人居环境适宜性分区标准
Tab. 2
| 人居环境适宜性分区 | 取值范围 |
|---|---|
| 不适宜地区 | HSI < 1-0.5STD |
| 临界适宜地区 | 1-0.5STD ≤ HSI < 1+0.5STD |
| 适宜地区 | HSI ≥ 1+0.5STD |
新窗口打开|下载CSV
(2)资源承载限制指数模型
区域水土资源和生态环境限制性可以通过资源承载限制指数来表征。资源承载限制指数是土地资源承载指数、水资源承载指数和生态承载指数的数学综合,用来反映区域水土资源和生态环境的综合承载状态,计算方法如表3所示[12, 17, 66]。
Tab. 3
表3
表3资源承载各分项指数的计算方法列表
Tab. 3
| 指标名称 | 计算公式 | 变量解释 |
|---|---|---|
| 土地资源 承载指数 | LCI为土地资源承载指数;Pa为现实人口数量;LCC为土地资源现实承载力或土地资源承载潜力;En为耕地资源产品转换为热量总量,Enpc人均热量摄入标准,现实承载力以2521 kcal 人/天计。 | |
| 水资源 承载指数 | WCI为水资源承载指数;Pa为现实人口数量;WCC为水资源承载力;W为水资源可利用量;Wpc为人均综合用水量。 | |
| 生态 承载指数 | ECI为生态承载指数;Pa为现实人口数量;ECC为生态承载力;SNPP代表生态供给总量;CNPPave代表人均生态消耗量。 |
新窗口打开|下载CSV
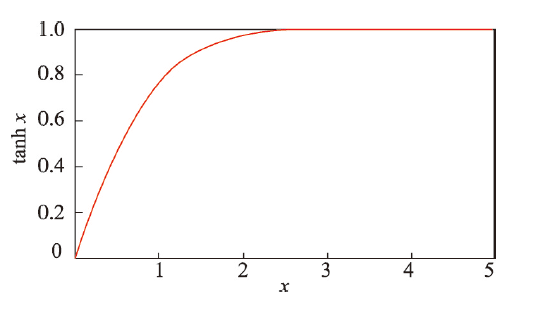
为了消除指数融合时区域某类资源承载状态过分盈余或亏缺而对该区域其它类型资源承载状态的信息覆盖,本文利用了双曲正切函数(tanh)对各承载指数的倒数进行了规范化处理(图4),并保留了承载指数为1时的平衡状态的实际物理意义。此外,本文以国际主流的城市化进程三阶段为依据[67],在不同城市化进程阶段的区域,结合实际情况对3项承载指数赋予了不同权重(表4)。资源承载限制指数的具体计算方法如下:
图4
 新窗口打开|下载原图ZIP|生成PPT
图4双曲正切函数示意图
Fig. 4Schematic diagram of hyperbolic tangent function
Tab. 4
表4
表4各项承载指数权重
Tab. 4
| 城市化进程阶段 | 城镇人口占比 | WL | WW | WE |
|---|---|---|---|---|
| 初期阶段 | [0, 30%] | 0.5 | 0.3 | 0.2 |
| 加速阶段 | (30%, 70%] | 1/3 | 1/3 | 1/3 |
| 后期阶段 | (70%, 100%] | 0.2 | 0.5 | 0.3 |
新窗口打开|下载CSV
当RCI = 1时,代表资源承载的理论平衡状态。根据专家咨询及作者多年承载力研究的经验,将资源承载状态划分为3种限制类型(表5)。
Tab. 5
表5
表5资源环境承载力限制性分类标准
Tab. 5
| 资源环境承载力限制性分类 | 取值范围 |
|---|---|
| 超载 | RCI < 0.9 |
| 平衡 | 0.9 ≤ RCI < 1.1 |
| 盈余 | RCI ≥ 1.1 |
新窗口打开|下载CSV
(3)社会经济发展指数模型
区域社会经济适应性可以通过社会经济发展指数来表征。社会经济发展指数是人类发展指数、交通通达指数和城市化指数的数学综合,各指数计算方法如表6所示[65]。为减少各分项指标对其他指标极值的覆盖,本文建立了三维立方体模型对归一化后的HDI、TAI和UI进行融合(图5)和均值归一化处理,其具体计算公式如下:
式中:SDI是进行均值归一化处理之后的社会经济发展指数;SDIone为SDIv按式(1)进行归一化之后的社会经济发展指数;k为研究区SDIone的均值;V1为立方体OE1F1G1H1I1J1K1的体积;V0为立方体OEFGHIJK的体积;OE1、OF1、OH1分别为HDI、TAI、UI归一化后的实际值;OE、OF、OH分别为HDI、TAI、UI归一化后的标准值,均为1。
Tab. 6
表6
表6社会经济各分项指数的计算方法列表
Tab. 6
| 指标名称 | 计算公式 | 变量解释 |
|---|---|---|
| 人类发展指数 | HDI为人类发展指数;LEI为预期寿命;EI为教育指数;II为人均GDP;ALI为成人识字率;GEI为小学、中学、大学综合入学率。 | |
| 交通通达指数 | TAI为交通通达指数;TDI为交通密度指数;TCI为交通便捷指数;r1,r2和r3分别为道路密度指数(RDI)、铁路密度指数(RWDI)和水路密度指数(WDI)与人口密度之间的相关系数;SDRI为中心点到道路最短距离指数;SDRWI为中心点到铁路最短距离指数;SDAI为中心点到机场最短距离指数;SDPI为中心点到港口最短距离指数。 | |
| 城市化指数 | UI为城市化指数;UPI为归一化后的人口城市化率;ULI为归一化后的土地城市化率。 |
新窗口打开|下载CSV
图5
 新窗口打开|下载原图ZIP|生成PPT
图5社会经济发展指数模型
Fig. 5Socioeconomic development index model
当SDI = 1时,代表区域社会经济发展的平均状态,STD为研究区域SDIone的标准差。通过均值标准差分级法,能最大化显示要素属性值与平均值之间的差异(表7)。
Tab. 7
表7
表7社会经济发展适应性分等标准
Tab. 7
| 社会经济发展适应性分等 | 取值范围 |
|---|---|
| 社会经济发展低水平地区 | SDI < 1-0.5STD |
| 社会经济发展中等地区 | 1-0.5STD ≤ SDI < 1+0.5STD |
| 社会经济相对发达地区 | SDI ≥ 1+0.5STD |
新窗口打开|下载CSV
(4)资源环境综合承载指数模型
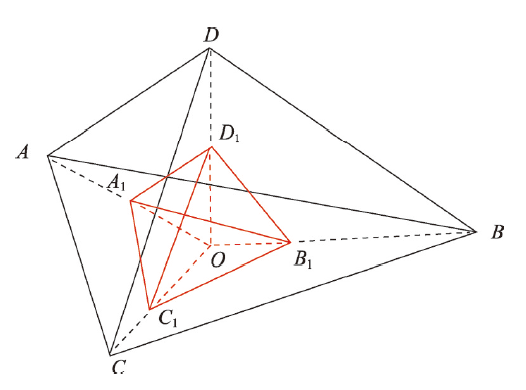
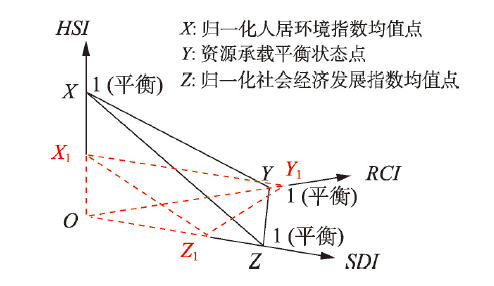
遵循“适宜性分区——限制性分类——适应性分等——警示性分级”的研究思路和技术路线,建立基于三维四面体模型的资源环境综合承载指数,以定量评估区域资源环境综合承载状态。在保留综合指数为1即平衡状态的基础上,本文建立了一个三维四面体模型来计算资源环境综合承载指数(图6),其具体计算公式如下:
式中:PREDI为资源环境综合承载指数;V1为四面体OX1Y1Z1的体积;V0为四面体OXYZ的体积;OX1、OY1、OZ1分别为HSI、RCI和SDI的实际值;OX、OY、OZ则分别为HSI、RCI和SDI的标准平衡值,均为1。
图6
 新窗口打开|下载原图ZIP|生成PPT
图6资源环境综合承载指数模型(PREDI)
Fig. 6Resource and environment development index model
当PREDI = 1时,代表区域资源环境承载的理论平衡状态。根据PREDI指标,可以将区域资源环境综合承载状态划分为如下3种警示等级(表8):PREDI < 0.9时,代表资源环境承载力处于超载状态,发展空间有待拓展;PREDI介于0.9~1.1时,代表资源环境承载力处于平衡状态,需要适度调整;PREDI ≥ 1.1时,代表资源环境承载力处于盈余状态,尚有发展空间。
Tab. 8
表8
表8资源环境综合承载力警示性分级标准
Tab. 8
| 资源环境综合承载力警示性分级 | 取值范围 |
|---|---|
| 超载 | PREDI < 0.9 |
| 平衡 | 0.9 ≤ PREDI < 1.1 |
| 盈余 | PREDI ≥ 1.1 |
新窗口打开|下载CSV
2.3 数据来源与处理
研究数据主要涉及分县尺度的人口、资源和社会经济数据,基于格网尺度的人口、环境、生态数据,以及2017年基础地理数据等,主要数据来源与技术处理过程如下:人居环境主要数据包括气象台观测数据、数字高程模型(DEM)、归一化植被指数、土地利用数据以及河流水网数据图层。其中,温度、相对湿度和降水气象数据来源于国家气象局数据共享中心,本文分别采用克里格法、样条法以及梯度距离平方反比法对各要素进行插值,进而获取了西藏1 km×1 km网格气象要素图层;DEM来源于由USGS制备的全球GTOPO 30,其空间分辨率为30′,本文经过正轴等面积双标准纬线割圆锥投影,得到1 km×1 km西藏DEM图;2000—2017年逐旬1 km×1 km归一化植被指数数据来源于中国地球科学数据共享平台;1∶10万土地利用类型图、水网分布矢量图源于中国科学院地理科学与资源研究所数据中心,土地利用数据经过矢量与栅格数据的转换工具转化为1 km×1 km栅格尺度,水网分布矢量数据通过构建1 km×1 km的fishnet,运用“intersect”等空间分析工具,计算格网的水网密度后,将fishnet转化为1 km×1 km栅格尺度,由此完成了气候、地形、水文、地被4个关键因子的基础数据归一化处理。县界、乡镇界线和居民点的矢量数据是在中国地球科学数据共享平台提供的1∶25万基础地理信息数据基础上,通过最新地图比对更新、修正取得。1 km×1 km栅格尺度的人口密度数据来源于美国橡树岭实验室提供的LandScan 2017。
资源承载力研究数据主要涉及分县土地面积、粮食和肉类产量、多年平均水资源量、NPP、生态消耗等数据。其中分县粮食产量、肉类产量数据源于2018年中国和分省统计年鉴;分县多年平均水资源数据源于国家人口发展战略研究集成成果;NPP来源于中国地球科学数据共享平台,生态消耗数据来源于统计年鉴中的农牧业生产数据,本文经过空间统计得到区域生态供给量(SNPP)数据,利用生物量与碳含量转换系数得到区域生态消耗量(CNPP)数据。
社会经济发展数据主要涉及基于分县尺度的出生人口预期寿命、成人识字率和小学、中学、大学综合入学率、人均GDP、城市人口的统计数据,矢量的道路、铁路、水路、港口、机场分布数据,以及土地利用数据和夜间灯光数据。其中,道路和铁路数据来源于DIVA-GIS,水路用50 m河道数据来替代,来源于Natural Earth,与上文水网密度计算方法相同,本文计算了栅格尺度下的道路密度、铁路密度和水路密度;港口数据来源于联合国粮农组织的全球地理信息系统(FAO GeoNetwork),机场数据来源于OurAirports,为获取各区域到道路、铁路、机场、港口最短距离的栅格图层,本文提取了网格几何中心,并通过“near analysis”工具计算了各网格中心点分别到4种交通工具的最短距离,最终将其转化为栅格数据;300 m×300 m土地利用数据来源于欧空局,通过计算各网格内城市用地的占比获取土地城市化的栅格图层;DMSP/OLS夜间灯光数据来源于美国国家海洋大气局,通过与城市人口统计数据相融合,获取栅格尺度下的人口城市化数据图层。
3 基于PREDI的西藏资源环境承载力综合评价:从分类到综合
3.1 基于HSI的人居环境适宜性评价:适宜性分区
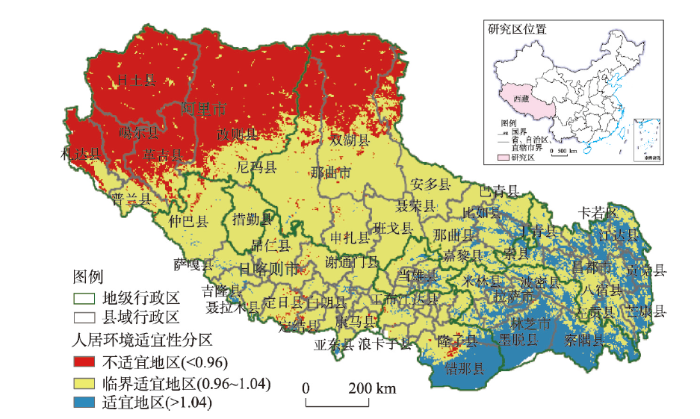
基于HSI的西藏人居环境自然适宜性评价结果表明(图7、表9),西藏人居环境适宜指数均值为0.95,人居环境适宜地区占比仅为13.28%,人居环境以不适宜和临界适宜为主要特征,在较大范围内限制了西藏资源环境承载力的发挥。具体而言:图7
 新窗口打开|下载原图ZIP|生成PPT
图7西藏人居环境适宜性分区评价
注:基于自然资源部标准地图服务网站审图号为GS(2019)1825号的标准地图制作,底图无修改。
Fig. 7Classification of human settlement environment suitability in Tibet
Tab. 9
表9
表9西藏人居环境自然适宜性分区统计
Tab. 9
| 人居环境自然适宜性分区 | HSI | 土地 | 人口 | ||||
|---|---|---|---|---|---|---|---|
| 面积(万km2) | 占比(%) | 数量(万人) | 占比(%) | 密度(人/km2) | |||
| 不适宜地区 | 0.94 | 35.73 | 29.72 | 5.07 | 1.47 | 0.14 | |
| 临界适宜地区 | 0.99 | 68.52 | 57.00 | 142.67 | 41.50 | 2.08 | |
| 适宜地区 | 1.17 | 15.97 | 13.28 | 196.08 | 57.03 | 12.28 | |
新窗口打开|下载CSV
(1)西藏人居环境不适宜地区面积占比29.72%,主要分布在藏西北地区;人口占比为1.47%,相对集中分布在阿里地区西北部的札达县和噶尔县,区内地广人稀疏,人口密度仅为0.14人/km2;不适宜地区土地覆被类型以草地和未利用地为主,海拔均值高达5081 m,年均温度值为-7.27 ℃,年均湿度为0.33,年均降水量为405.32 mm,大部分区域全年基本没有气候舒适期。
(2)西藏人居环境临界适宜地区面积占比57.00%,主要分布在那曲南部、日喀则市、一江两河地区以及山南和林芝北部地区;142.67万人长期生活和居住在此,占比为41.50%,人口密度为2.08人/km2;临界适宜地区土地覆被类型以草地和林地为主,海拔均值高达4904 m,年均温度值为-2.67 ℃,年均湿度为0.45,年均降水量为528.74 mm,全年气候舒适期大部分处于为3~5个月之间。
(3)西藏人居环境适宜地区面积占比仅为13.28%,分布在藏东南、一江两河和澜沧江上游的河谷绿洲地带;196.08万人长期生活和居住在此,占比为57.03%,人口密度为12.28人/km2;该类地区林地和草地面积所占比重较大,城镇化率较高,基本不受水文、气候、地被条件制约,海拔相对较低,人体感觉比较舒适。
3.2 基于RCI的资源环境限制性评价:限制性分类
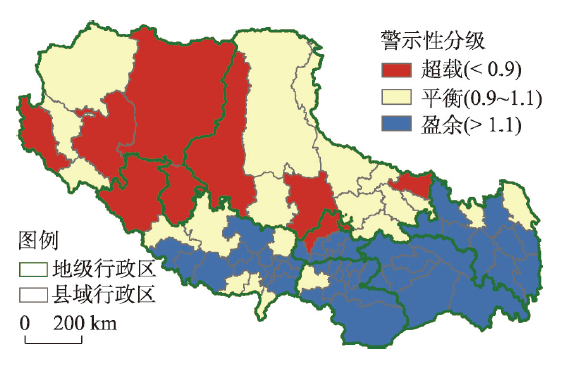
基于RCI的西藏资源环境限制性评价结果表明(图8、表10),西藏资源环境承载力限制指数(RCI)均值为1.08,全区有66个县域处于盈余或平衡状态,面积占比3/4以上、相应人口占比9/10,资源环境承载力以盈余为主要特征。具体而言:图8
 新窗口打开|下载原图ZIP|生成PPT
图8西藏资源环境限制性分类评价
Fig. 8Restrictive classification of resource and environmental carrying capacity in Tibet
Tab. 10
表10
表10西藏资源承载状态统计
Tab. 10
| 资源限制性分类 | RCI | 土地 | 人口 | 县域 | ||||||
|---|---|---|---|---|---|---|---|---|---|---|
| 面积(万km2) | 占比(%) | 数量(万人) | 占比(%) | 密度(人/km2) | 数量(个) | 占比(%) | ||||
| 超载 | 0.87 | 27.73 | 23.06 | 31.66 | 9.21 | 1.14 | 8 | 10.81 | ||
| 平衡 | 1.01 | 46.44 | 38.63 | 138.62 | 40.32 | 2.98 | 24 | 32.43 | ||
| 盈余 | 1.16 | 46.06 | 38.31 | 173.55 | 50.48 | 3.77 | 42 | 56.76 | ||
新窗口打开|下载CSV
(1)西藏资源环境承载力超载地区包含8个县域,面积占比23.06%,只有不到一成的人居住于此,人口密度为1.14人/km2。该地区自然条件较为恶劣,耕地占比较低,受土地资源限制性较大。
(2)西藏资源环境承载力平衡地区包含24个县域,大部分分布在阿里地区西部、日喀则北部、那曲地区西部和东部,面积占比38.63%,有138.62万人居住于此类地区,人口密度为2.98人/km2,该类地区又可以分为两类:承载力和实际人口都较低的县域,如札达县、日土县等,承载力和实际人口都比较高的县域,如城关区、桑珠孜区等。
(3)西藏资源环境承载力盈余地区包含42个县域,面积占比为38.31%,主要集中在山南地区、林芝地区、双湖县等(图8),超过50%的人口分布在该类地区,人口密度为3.77人/km2。
3.3 基于SDI的社会经济适应性评价:适应性分等
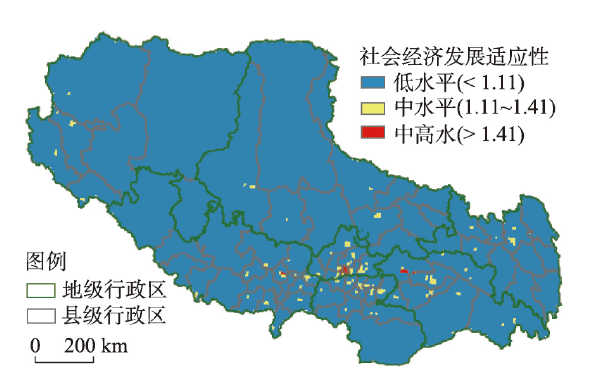
基于SDI的西藏社会经济适应性评价结果表明(图9、表11),西藏自治区社会经济绝大部分地区都属于低水平发展区域(自然断点法进行分等),面积占比超过99%,相应人口占比80%,这在一定程度上限制了区域资源环境综合承载力的发挥。具体而言:图9
 新窗口打开|下载原图ZIP|生成PPT
图9西藏社会经济适应性分等评价
Fig. 9Classification of socioeconomic development in Tibet
Tab. 11
表11
表11西藏社会经济发展水平统计
Tab. 11
| 社会经济适应性分等 | SDI | 土地 | 人口 | ||||
|---|---|---|---|---|---|---|---|
| 面积(万km2) | 占比(%) | 数量(万人) | 占比(%) | 密度(人/km2) | |||
| 低水平发展区域 | 1.00 | 118.96 | 98.95 | 277.75 | 80.78 | 2.33 | |
| 中水平发展区域 | 1.22 | 1.13 | 0.94 | 34.95 | 10.16 | 30.86 | |
| 中高水平发展区域 | 1.59 | 0.12 | 0.10 | 31.12 | 9.05 | 250.61 | |
新窗口打开|下载CSV
(1)西藏社会经济低水平地区社会经济发展指数一般低于1.11,均值趋近于1;面积占比98.95%,虽然全区八成人口汇聚于该类地区,但人口密度仅为2.33人/km2。
(2)西藏社会经济中水平地区社会经济发展指数介于1.11~1.41,均值在1.22;面积占比仅0.94%,超过一成的人口居住于此,主要分布在一江两河地带、仁布县、江孜县、乃东县、墨竹工卡县等地区,人口密度30.86人/km2,该类地区自然资源丰富,海拔较低,发展潜力较大,但较低的城镇化水平制约了该类地区的社会经济发展。
(3)西藏社会经济中高水平发展地区社会经济发展指数(SDI)一般在1.41以上,均值为1.59;面积占比仅为0.10%,将近一成的人口居住于此,零星分布在拉萨市城关区、日喀则市桑珠孜区、工布江达镇等基础设施相对完善、城镇化率相对较高的城镇,该类区域人口密度高达250.61人/km2。
3.4 基于PREDI的资源环境承载力综合评价:警示性分级
基于PREDI的西藏资源环境承载力综合评价表明(图10~11、表12),全域有超过3/4的县域处于盈余或平衡状态,面积占比超过70%,相应人口占比超过86%,资源环境综合承载状态整体良好;从空间分布看,东南部县、市优于西北部县、市。具体而言:图10
 新窗口打开|下载原图ZIP|生成PPT
图10西藏资源环境综合承载状态分布
Fig. 10Distribution of resource and environmental comprehensive carrying status in Tibet
图11
 新窗口打开|下载原图ZIP|生成PPT
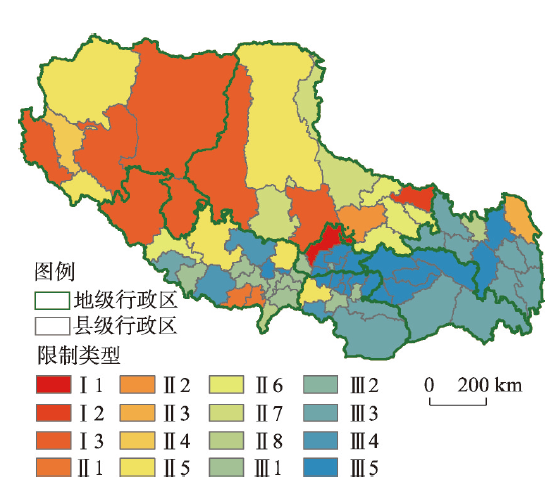
图11西藏资源环境综合承载状态与限制类型分布
Fig. 11Distribution of resource and environmental carrying status classification in Tibet
Tab. 12
表12
表12西藏资源环境综合承载状态与限制类型统计表
Tab. 12
| 资源环境综合 承载状态 | 限制 类型 | PREDI | HSI | RCI | SDI | 县 | 土地 | 人口 | ||||||
|---|---|---|---|---|---|---|---|---|---|---|---|---|---|---|
| 数量(个) | 占比(%) | 面积(万km2) | 占比(%) | 数量/万人 | 占比(%) | 密度(人/km2) | ||||||||
| 超载(Ⅰ) | R限制型(I1) | 0.8725 | 1.0018 | 0.8654 | 1.0065 | 1 | 1.35 | 4.82 | 4.01 | 17.86 | 5.19 | 4.55 | ||
| R&D限制型(I2) | 0.8352 | 1.0161 | 0.8246 | 0.9969 | 1 | 1.35 | 4.60 | 3.82 | 18.56 | 5.40 | 4.96 | |||
| E&R&D限制型(I3) | 0.8607 | 0.9692 | 0.8906 | 0.9973 | 7 | 9.46 | 25.23 | 20.99 | 8.79 | 2.56 | 0.43 | |||
| 小计 | 0.8592 | 0.9781 | 0.8805 | 0.9982 | 9 | 12.16 | 34.65 | 28.82 | 45.21 | 13.15 | 1.60 | |||
| 平衡(Ⅱ) | E限制型(II1) | 1.0832 | 0.9847 | 1.0962 | 1.0035 | 2 | 2.70 | 2.31 | 1.92 | 5.92 | 1.72 | 3.15 | ||
| R限制型(II2) | 0.9392 | 1.0135 | 0.9261 | 1.0006 | 1 | 1.35 | 7.65 | 6.36 | 41.82 | 12.16 | 6.72 | |||
| D限制型(II3) | 1.0758 | 1.0500 | 1.0269 | 0.9977 | 1 | 1.35 | 6.23 | 5.18 | 29.23 | 8.50 | 5.76 | |||
| E&R限制型(II4) | 0.9059 | 0.9440 | 0.9560 | 1.0039 | 1 | 1.35 | 8.54 | 7.10 | 6.50 | 1.89 | 0.93 | |||
| E&D限制型(II5) | 1.0380 | 0.9728 | 1.0689 | 0.9980 | 6 | 8.11 | 19.71 | 16.39 | 11.57 | 3.36 | 0.72 | |||
| R&D限制型(II6) | 0.9320 | 1.0182 | 0.9176 | 0.9972 | 5 | 6.76 | 4.93 | 4.10 | 14.04 | 4.08 | 3.50 | |||
| E&R&D限制型(II7) | 0.9312 | 0.9820 | 0.9505 | 0.9976 | 2 | 2.70 | 16.36 | 13.61 | 11.16 | 3.25 | 0.84 | |||
| 均衡型(II8) | 1.0421 | 1.0229 | 1.0166 | 1.0022 | 2 | 2.70 | 2.50 | 2.08 | 12.07 | 3.51 | 5.94 | |||
| 小计 | 0.9961 | 0.9957 | 1.0019 | 0.9991 | 20 | 27.03 | 68.21 | 56.74 | 132.29 | 38.48 | 2.38 | |||
| 盈余(Ⅲ) | E限制型(III1) | 1.1594 | 0.9914 | 1.1578 | 1.0101 | 10 | 13.51 | 2.01 | 1.67 | 12.48 | 3.63 | 7.64 | ||
| R限制型(III2) | 1.7285 | 1.0288 | 0.9844 | 1.7068 | 1 | 1.35 | 0.25 | 0.21 | 107.28 | 31.20 | 533.23 | |||
| D限制型(III3) | 1.2436 | 1.0778 | 1.1550 | 0.9985 | 12 | 16.22 | 7.25 | 6.03 | 15.33 | 4.46 | 2.60 | |||
| E&D限制型(III4) | 1.1569 | 0.9829 | 1.1793 | 0.9980 | 3 | 4.05 | 5.15 | 4.28 | 14.29 | 4.16 | 3.41 | |||
| 均衡型(III5) | 1.2188 | 1.0230 | 1.1604 | 1.0268 | 19 | 25.68 | 2.71 | 2.26 | 16.94 | 4.93 | 7.67 | |||
| 小计 | 1.2194 | 1.0280 | 1.1557 | 1.0287 | 45 | 60.81 | 17.36 | 14.44 | 166.32 | 48.37 | 11.77 | |||
新窗口打开|下载CSV
(1)西藏资源环境承载力超载地区资源环境综合承载指数一般低于0.9,均值在0.86。全区处于超载状态的县域有9个,数量占比12.16%,面积占比28.82%,全区13.15%人口分布在该类地区,人口密度为1.60人/km2。这类地区主要分布于阿里地区、日喀则北部和那曲西部,受到人居环境适宜性、资源环境限制性和社会经济发展的高度制约,自然环境较为恶劣,资源禀赋不足,社会经济发展水平滞后,需要加强资源环境承载力监测预警机制建设。
(2)西藏资源环境承载力平衡地区资源环境综合承载指数介于0.9~1.1之间,均值趋近于1。全区处于平衡状态的县域有20个,数量占比27.03%,面积占比56.74%,全区将近四成的人口分布在该类地区,人口密度为2.38人/km2,该类地区主要分布于那曲地区。其中受人居环境限制的县域有11个,受当地资源承载限制的县域有9个,受社会经济发展水平限制的县域有14个,类乌齐县和亚东县资源环境与社会经济发展相对均衡,那曲县和江达县分别受到资源环境和社会经济单因素限制,安多县和申扎县受到资源环境和社会经济的高度制约,人口密度仅为0.84人/km2。
(3)西藏资源环境承载力盈余地区资源环境综合承载指数一般高于1.1,均值为1.22。全区处于盈余状态的县域有45个,数量占比60.81%,面积占比为14.44%,相应人口占比为48.37%,人口密度为11.77人/km2,该类地区主要集中于一江两河区域、藏东南及昌都大部分地区。从限制性因素来看,受人居环境限制的县域有13个,仅城关区受当地资源承载限制,受社会经济发展水平限制的县域有15个,19个县域三方面发展相对均衡,主要集中在一江两河,林芝北部和昌都西部。
3.5 讨论
西藏资源环境承载力综合评价实证研究,着力通过承载指数解决承载状态评价,为西藏不同地区的资源环境承载力监测预警提供技术支撑,但未能综合计量承载力的数值,对区域承载人口的“天花板”尚未确定,研究结果只能是一种参考。本模型中,人居环境适宜指数和社会经济发展指数是以栅格数据为基础,资源承载限制指数则是以分县为基本研究单元,因此,在综合计量时,势必经历空间尺度转换的过程,即由公里格网到分县单元的尺度上推,目前本文使用的是取平均值的聚合方式来实现。但事实上,地表空间作为一个具有很高复杂性的巨系统,在某一尺度上观测到的现象、总结出的规律,在另一尺度上可能有效、可能相似,而更多需要修正。因此,在综合过程中由于空间尺度上推导致的误差可能会对结果产生影响。
此外,对于藏南部分边境县域,其常住人口数、农产品产量、社会经济现状等统计数据尚不全面,因此除却人居环境自然适宜性评价能较为全面反映区域整体特征外,资源环境限制性和社会经济适应性评价有待进一步完善,综合承载力评价结果需待进行修正。
4 结论与展望
基于人口发展与资源环境基础和社会经济发展的互动关系,从系统出发,研究提出了“人居环境适宜性分区——资源环境承载力限制性分类——社会经济发展适应性分等——资源环境承载力警示性分级”的资源环境承载力综合评价研究思路与技术体系,构建了具有平衡态意义的资源环境承载力综合评价的三维四面体模型,实现了资源环境承载力的定量评价与综合计量。基于上述模型方法,以公里格网为基础,以分县为基本研究单元,实证开展了西藏的资源环境承载力综合评价。研究表明:(1)基于人居环境适宜指数(HSI)、资源承载限制指数(RCI)和社会经济发展指数(SDI)构建的资源环境承载力综合指数(PREDI)模型,即资源环境承载力综合评价的三维四面体模型蕴含了平衡态为1的物理意义,对区域资源环境承载力监测预警具有更清晰的政策指导意义和实用价值。
(2)综合看,西藏全域接近九成的县域处于盈余或平衡状态,相应土地面积占比将近3/4,相应人口占比将近9/10,资源环境综合承载状态整体良好,且东南县、市优于西北县、市,符合自然大势。
(3)分析看,水土资源与生态环境承载力对西藏发展尚未构成限制,人居环境自然适宜性较大范围地限制了西藏资源环境承载力水平,较低的社会经济发展水平一定程度上也降低了西藏资源环境综合承载力的提升能力。
资源环境承载力综合研究的认知未统一,限于相对较短的发展历史,统一的理论基础和方法体系尚未完全成形。本文基于人口发展与资源环境基础和社会经济水平的互动关系,研究提出了一套资源环境承载力综合评价的模型方法,与当前开展的“双评价”实践工作不同之处在于,本文依据承载力的起源及其科学涵义,以人为基本量纲,来量化资源环境承载力。但仍未解决承载阈值界定与关键参数率定等关键技术问题,在模型的综合过程中,由于数据融合的需要,尺度转换会对结果产生误差。未来研究将对承载阈值界定与关键参数率定两个技术难点做专门探讨,同时,为解决现有升尺度转换过程中存在的问题,后续将结合自上而下的演绎方法和自下而上归纳方法,探讨构建严谨、统一、自洽的升尺度转换模型,完成合理的尺度转换。通过以上问题的突破,将承载力研究实现从分类到综合、从定性到定量、从基础到应用,发展一套标准化、模式化、计算机化的评价方法与技术体系,助力完成承载力的综合计量,以期为实现科学认识区域资源环境承载力,促进区域人口与资源环境协调发展提供决策支持。
参考文献 原文顺序
文献年度倒序
文中引用次数倒序
被引期刊影响因子
URL [本文引用: 1]

It is an innovative work of comprehensive deepening reforms of China to establish the mechanism of monitoring and early-warning of carrying capacity. Based on the scientific connotation of the carrying capacity of national resources and environment and oriented to regional sustainable development, this article explores the"pressure-state-response" process of the interaction between the carrying body: the natural foundation (which consists of resources, environment, ecology and disasters) with the carrying object: the human production and life activities, and presents the academic thought that the early-warning of the national resources and environment carrying capacity is an overload early-warning according to the cap of the constraints of resources and environment or the population and economic rational scales or other key thresholds, and also presents a process early-warning in terms of the changes of the natural basic conditions or the tendencies of the impact of resource utilization and environmental changes. According to the exploration on the principles of early-warning carrying capacity, this article constructs the differential indicator system and the overall technical process of early-warning of marine and terrestrial resources and environment carrying capacity. Land resources stress index, water resources use intensity index, environmental stress strength index and vegetation coverage change range index are chosen as basic indicators to conduct an overall regional evaluation, and different specific indicators, such as the pollution level of dust-haze, the increase and decrease of arable land, equilibrium index of grass and livestock and the variation of eco-environmental quality, are chosen to conduct the specific evaluation respectively for the urbanized areas, major grain producing areas, pastoral and semi-pastoral areas and ecological function areas, and then the key thresholds of these indicators are determined to conduct classifying evaluation. Finally, this article integrates all the evaluations and puts forward an evaluation method which shows the differentials in terms of major function oriented zone and evaluation results of consistent expression, and then carries out the process evaluation using two indexes of resource utilization efficiency and environment pollution pressure to reflect auxiliary the early-warning state of China's resources and environment carrying capacity and sustainable development abilities, thus providing a scientific basis for the proposed recommendations for restrictive measures and the improvement of monitoring and early-warning mechanisms.
[本文引用: 1]
DOI:10.18402/resci.2017.03.01URL [本文引用: 2]
Carrying Capacity(CC)was first coined in biology and ecology in the 1920s,and later developed rapidly in related sciences such as natural resources science and environment science. The concept of Resources and Environment Carrying Capacity(RECC),from theoretical investigation to practical implementation,has become an effective and operational tool to describe development restrictions and quantify regional sustainable development. RECC research has become a hot topic methodologically and theoretically in ecology,geography and natural resource and environment. It primarily focuses on the ultimate limit of population and economic development on earth. After briefly looking at the origin of the concept and early headway,we summarize RECC research from land resource carrying capacity,water resource carrying capacity,and environmental carrying capacity(environment capacity). The following evaluating methods,including ecological footprint and virtual land (or the biological productive land by ecological footprint),water footprint and virtual water (or the global flow of virtual water),emergy analysis and virtual energy(or energy equilibrium),are considered as important research progresses in the past century. However,there is still lack of a standard set of evaluation theories and methodologies for RECC research in China and globally,leading to much debate over the objectivity and comparability of resultant figures. Concerning this issue,we propose that RECC research in the future should pay more attention to enhancing exploratory studies in basic theories and carrying mechanisms,thresholds determination and synthetical calculation,technological standards/manuals setting,measurable assessment and systematical integration. More effort is needed to promote the standardization,digitalization and systematization of RECC research in China before according with national practical and operational demands.
[本文引用: 2]
[本文引用: 1]
[本文引用: 1]
[本文引用: 1]
DOI:10.1038/nature02619URL [本文引用: 1]
DOI:10.1126/science.1227620URLPMID:22997311 [本文引用: 1]
[本文引用: 1]
[本文引用: 1]
[本文引用: 1]
[本文引用: 1]
[本文引用: 1]
[本文引用: 1]
DOI:10.11849/zrzyxb.1990.03.010URL [本文引用: 1]
In this paper, after analysing the current land productivity and estimating the potential crop productivity, an evalution model of land resource productivity-Model of Fuzzy ISODATA Claster Analysis (MFICA) and an optimization model of land resource utilization-Model of Linear Programming (MLP) are set up in the IBM-PC computer. Then, on the basis of above, the regional agricultural productivity and the land resource carrying capacity in Dingxi county for the years 1990, 2000, 2025 and after 2025 are given. At last, the development of land resource carrying capacity and the future trend of land-food-population relationship in Dingxi county are explained.It provides a workable way for the study of regional land resource carrying capacity.
[本文引用: 1]
[本文引用: 2]
[本文引用: 2]
[本文引用: 1]
[本文引用: 1]
[本文引用: 1]
[本文引用: 1]
DOI:10.11849/zrzyxb.2006.05.002URL [本文引用: 1]
China is one of the countries facing the most serious water shortage crisis.In recent years,the water problem has become more and more projecting,especially for urban area where water shortage has been a common problem-water demand is mounting up rapidly due to population burgeon and improvement of living people's standards.The serious dearth of water has turned out to be a bottleneck in the region's social and economic development,which makes the research on water resource more pressing.In this paper,we mainly study the water resources carrying capacity(WRCC),as the groundwork of the study of water resources security stratagem,which plays an important role in the harmonious development of regional water-ecology-socio-economy complex system.Jingjinji region located in the Haihe River valley is chosen as a typical area to study the water shortage problem.This region includes Beijing,Tianjin and eight cities in Heibei province:Shijiazhuang,Tangshan,Qinhuangdao,Baoding,Zhangjiakou,Chengde,Cangzhou and Langfang,which is around Greater Beijing Economic Hub and is the core area of the Bohai Bay Trade Hub.Mean while it is severely short of water resources,the average water resources of which is only 370×108m3,1.3% less than the national average level,but it carries about 10% of the national population,food and GDP. A model of water resources is developed for analyzing the carrying capacity of water resources in different years in this region.The model for calculating WRCC is established by taking the "population capacity capacity" as its synthetic index and using the system optimizati-on method.And a formula of load factors is also used to compute the potential of water resources in different areas. The final results indicate that:1)There are still 684×108m3 of potential water resources which come from rain and flood in the region,and could be exploited.2)In the years of normal precipitation(p=50%),according to the "having enough to eat and wear" life standard,the population that water resources can carry is larger than that of nowadays;while,if according to the "better-off"life standard,the water resources cannot support today's population.3)In drought years,in developed area,the population can be carried by lowering the living standard,however,in underdeveloped areas,when having a long-term drought,the population cannot be supported.4)Although the water carrying capacity of Jingjinji region may be improved after completing the South to North Water Transfer Project,the living standard might not be improved,for it can be offset by the increasing population.So,the rudimentary method for solving the problem of water scarcity is stringent population control.
[本文引用: 1]
DOI:10.11849/zrzyxb.2002.03.001URL [本文引用: 1]
Water resources carrying capacity(WRCC)is a basic measurement of water resources security that plays a very important role in recognizing and building water resources security system.This paper focuses on the WRCC's measurement and quantifying method,which include the usable water resources evaluation,water demand calculation from eco-system and socio-eco-nomic development and the indicator of WRCC and its vector index.As a representative of water conflict in the Northwestern part of China,this paper addresses several key issues related to quantifying WRCC in this region,such as water cycle modeling in the changing environment,water demand problem for eco-system etc.It holds that the hydrological basis related to WRCC,integrated study of natural change and social economics,present practical models and RS/GIS technology,as well as regional variability should be emphasized.
[本文引用: 1]
[本文引用: 2]
[本文引用: 2]
[本文引用: 1]
[本文引用: 1]
[本文引用: 1]
[本文引用: 1]
[D].
[本文引用: 1]
[D].
[本文引用: 1]
DOI:10.1016/j.chnaes.2018.12.006URL [本文引用: 1]
[本文引用: 1]
[本文引用: 1]
[本文引用: 1]
[本文引用: 1]
[本文引用: 1]
URL [本文引用: 1]
This paper discusses the definition of the bearing capacity of the atmospheric environment. Meanwhile, the calculation principle of bearing capacity by plume footprint method and its formulas are also deduced. The specific equation for calculating plume footprint function in given regional meteorological conditions and the bearing capacity of the atmosphere are presented. The method of plume footprint provides a technical support in emission tradings between regions.
[本文引用: 1]
[本文引用: 1]
[本文引用: 1]
[本文引用: 1]
[本文引用: 1]
[本文引用: 1]
[本文引用: 1]
[本文引用: 1]
[本文引用: 1]
[本文引用: 1]
[本文引用: 1]
DOI:10.11821/dlxb201406001URL [本文引用: 1]
The relationship between population distribution and resources, environment, social and economic development has attracted much attention for a long time. This paper set up an index system and some models for the assessment of the coordination between population and resources, environment, social and economic development. Then it used the index system and models to evaluate this coordination quantitatively at the county level. Based on this, the suitability and restriction of population distribution at the county level was graded and classified respectively, and its spatial and temporal patterns as well as regional characteristics were also revealed quantitatively. The results showed that: (1) population distribution was generally coordinated with human settlements environment in more than 3/5 of counties in China in 2010, which meant that population distribution was highly consistent with the natural suitability of human settlements environment at the county level; (2) population growth was merely not restricted by water and land resources in about half of counties in China in 2010, indicating that population distribution had medium coordination with the suitability of water and land resources; (3) population distribution was generally coordinated with social and economic development in more than 3/5 of counties in China in 2010, suggesting that population distribution was highly consistent with social and economic development; (4) the suitability degree of population distribution was larger than 60 in about 3/5 of counties in China in 2010, which showed that the relationship between population, resources, environment and development was coordinated or relatively coordinated; (5) as for the coordination between population, resources, environment and development at the county level, the eastern region was the best, the central region ranked second and the western region was the worst; (6) the suitability degree of population distribution at the county level could be identified into four grades, including basic coordination, relative coordination, under coordination and urgent need for coordination and 10 restricted classes.
[本文引用: 1]
[本文引用: 1]
[本文引用: 1]
[本文引用: 1]
[本文引用: 1]
URL [本文引用: 1]
Evaluation of the resources and environment bearing capacity is an important part of the national restoration and reconstruction planning after Wenchuan earthquake.It aims for putting forward the population quantity suitable for the resources and environment bearing capacity.This paper proposes an evaluating method based on three key factors:water resources,cultivated land resources and environmental capacity.The evaluating method has been applied to calculate the population bearing capacity of resources and environment of Ya’an city which was heavily damaged by the earthquake.According to “cask effect”,the population bearing capacity based on cultivated land resources has been selected to reflect the resources and environment bearing capacity.Population bearing capacity have been analyzed from cultivated landgrain resources and income from cultivated land economy to determine the proper population scale synthetically.It is concluded that the population bearing capacity based on resources and environment before 2010 is 1535~159 million,and it’s not necessary to transfer population in large scale.For meeting welloff standard in 2020,it is 1585~164 million.Totally the resources and environment can meet postearthquake population demand for welloff society,but it needs to take comprehensive policies to lead the population to migrate to Yucheng and Mingshan County which have more capacity potential,strong industry and population concentration abilities 〖WTHZ
[本文引用: 1]
[本文引用: 1]
[本文引用: 1]
[本文引用: 1]
[本文引用: 1]
URL [本文引用: 1]
[本文引用: 1]
URLPMID:12827888 [本文引用: 1]
The ecological footprint method put forward and improved by William Rees and Mathis Wackernagel presents a methodologically simple but integrated framework for national natural capital accounting, which is capable of measuring the impact of Human's consumption on ecosystem. Based on the ecological footprint theory and calculation method, a flow network analysis method was introduced to illuminate the structure of complex ecological economic system, and the relationship among ecological footprint, diversity and development capacity was analyzed. In this paper, the ecological footprints of China and its provinces was calculated and compared with the national and local ecological carrying capacity. The results showed that the ecological footprints of China and most of its provinces were beyond the available ecological capacity, and China and its most provinces run 'national or regional ecological deficit'. In case of China, the national ecological deficit was 0.645 hm2 per cap in 1999. Secondly, we introduced a flow network analysis method, taking various ecological productive area as note, and adopted Ulanowicz's development capacity formula to analyze the relationship among ecological footprint diversity, development capacity and output. The results demonstrated that Ulanowicz's development capacity was a good predictor of economic system output. At the same time, two distinct ways to change development capacity were produced. Increasing ecological footprint or increasing ecological footprint's diversity would both increase development capacity. Due to the fact that the ecological footprints had already been beyond bio-capacities, the only way to increase development capacity was to increase ecological footprint's diversity. The positive relationship between ecological footprint diversity and resources utilization efficiency demonstrated that there was no conflict between increasing ecological footprint's diversity and reducing footprints while not comprising our quality of life.
PMID:12827888 [本文引用: 1]
DOI:10.11849/zrzyxb.2005.02.018URL [本文引用: 1]
Urbanization is a typical feature of socio-economic development.According to the sta-tistics,from 1980 to 2001,China's urbanization level rose from 17.92% to 37.66%.Urbanization has many positive effects such as organizing mass production,improving the progress of sci-technology and education,enhancing people's living standard and so on.However,some negative effects of urbanization have been emerging especially its ecological and environmental effects. Along with the process of urbanization,lots of people migrate from countryside to city.The increase of urban residents and the change of living style increase the consumption of natural resources and natural ecosystems.So,the quantitative analysis of urban residents' living consum-ption and its appropriation to natural ecosystems can demonstrate the influences of urbanization and sustainable development in urban areas. As a new method for quantitatively measuring natural resources used by humans,ecological footprint can illustrate regional sustainable development through the analysis of energy and other resources consumption.In this paper,taking Taizhou in Jiangsu Province of East China,Shangqiu in Henan Province of Central China,Tongchuan of Shaanxi Province of Northwest China and a typical resource city,and Xilin Gol of Inner Mongolia of North China and pastoral area as examples,ecological footprints of residents'living consumption were calculated and compared. The results show that (1) about 90% of ecological footprints in Taizhou,Shangqiu and Tongchuan come from the consumption of eating and wearing but below 70% in Xilin Gol where living ener-gy consumption occupies relatively high proportion;(2)for the sake of different geographical areas,residents have different consumption styles which cause different ecosystem appropriation, e.g. per capita residents living in Xilin Gol (pastoral area) occupy 0.333hm2 of grassland ecosystem which is several times that of in other cities,residents living in Taizhou (the Yangtze valley area) occupy 0.116hm2 of water ecosystem which is two or more times in other cities;and (3)compared to the bio-productive area,the ecological footprints of city residents in Shangqiu,Taizhou and Tongchuan are all more than the whole city's ecological capacity which approves that city is one of the typical kind of ecological deficit areas.Therefore,how to effectively adjust urban residents' consumption style and structure is very significant to improve sustainable development in urban areas.
[本文引用: 1]
DOI:10.11849/zrzyxb.2010.01.005URL [本文引用: 1]
[本文引用: 1]
URL [本文引用: 1]
Water resources are the basic elements of ecological environments, the indispensable basis for our survival, and the key to sustainable socioeconomic development. In the wake of population growth and development, the demand-supply imbalance of global water resources has become serious, and water shortages have become an important limiting factor for the sustainable development of many nations. Water shortages, water pollution, floods and water-logging disasters have threatened and restricted sustainable development and so it is necessary to evaluate the water resources management concept. Water footprint is an indicator of freshwater use that looks at direct water use and indirect water use, and can be regarded as a comprehensive indicator of freshwater resources appropriation, next to the traditional and restricted measure of water withdrawal. This study analyzed the spatial and temporal characteristics of water stress, and the water footprint of production in China. Water eco-function zoning in China was conducted according to three-order basins and combined with water ecosystem service assessment theory. The water eco-function zoning scheme in China revealed six first level eco-function zones: the Northeast Songliao Mountain and Plain Less Water Zone, North China Huang Sea and Huai Sea Plain Less Water Zone, Northeast Inland Dry Scarce Water Zone, South Mountain Hill Wet Zone, Qinghai-Tibet Plateau Water Tower Zone, Southwest Plateau Valley Wet Zone. There were 100 second level zones according to functional: water and water products supply function zone (life and production water, water products, shipping, hydropower, etc); water resources habitat sustain function zone (biodiversity sustain, aquatic habitat, spawning ground, wintering ground, etc); water resources environment regulation function zone (climate regulate, water self purification, reservation flood, etc); and water recreation service function zone (tourism, culture and education, etc). The study provides theoretical support for the scientific management of water resources and safeguards the security of national water resources. Our framework reveals water ecosystem health and trends in the development of watershed ecosystem protection and recovery strategies, and supports the transformation of national water resources management philosophy.
[本文引用: 1]
DOI:10.11849/zrzyxb.2013.03.006URL [本文引用: 1]
Agricultural activities influence the stability of oasis by changing its aquatic ecosystem that oasis depends on. The agricultural water footprint of Wuwei Oasis in 2007 is about 8 times of that in 1950, while the efficiency of agricultural water footprint grows slowly only by 1.75 times. There is significant negative correlation between the efficiency and the proportion of the food crops water footprint. The proportion of the food crops water footprint in Wuwei Oasis presents a declining trend before 2002 and upgrades after 2002. The lowest proportion is 58.63% in 2002. The rapid population growth and livelihood demand are the main driving factors for the increase of the land development intensity and the agricultural water footprint. Therefore, appropriate decrease of agricultural scale, agricultural structural adjustment, increasing the government’s inputs to agricultural water-saving irrigation, extending agricultural water-saving technology as well as improving water management systems are all effective measures to control the excessive growth of water footprints, to achieve efficient utilization of agricultural water resources and further to maintain the stability of oasis ecosystem in Wuwei.
[本文引用: 1]
[本文引用: 1]
[本文引用: 1]
[本文引用: 1]
DOI:10.11849/zrzyxb.2009.04.005URL [本文引用: 1]
[本文引用: 1]
URL [本文引用: 1]
In order to avoid some shortages of traditional ecological footprint model, the authors proposed an integrated model by using emergy theory, which is namedas Emergy-Ecological Footprint Integrated Model. In ecological carrying capacity calculation, the proposed model adds the carrying capacity of actual product output and virtual product supply based on material input-output theory and people ’s innovation. In ecological footprint calculation, the proposed model considers waste ecological footprint into evaluation system. Finally, the proposed model is applied in Tianjin eco-city evaluation from 2001 to 2008. The calculating result shows that the ecological carrying capacity is higher than ecological footprint, and ecological surplus is in rising tendency which expresses that Tianj in is in sustainable state.
[本文引用: 1]
[本文引用: 1]
[本文引用: 1]
[本文引用: 1]
[本文引用: 1]
DOI:10.7522/j.issn.1000-0240.2013.0058URL [本文引用: 1]
A new explanation of virtual water strategy is presented in this article. Based on the discussion of inadequacy of Allan's standpoint, the concept of virtual water strategy is redefined and its connotation is extended. In fact, Allan's virtual water strategy is suit for extremely water-deficient areas. In those areas, the virtual water strategy is an effective route to improve regional water security and people's living standard by allocating water resources optimally (both entitative water and virtual water). In other areas, the core of virtual water strategy is selecting an appropriate route to develop the secondary and tertiary industries that leads water resources flow to industry and service sectors by dint of positive feedback ring. Based on the analysis of the ecological economical development in Zhangye Municipality, it is found that the ecological economical strategy practiced in the city is an innovative virtual water strategy.
[本文引用: 1]
DOI:10.11849/zrzyxb.2006.04.020URL [本文引用: 1]
Associated with rapid development of economy and increase of population,we face a series of contradictions among the natural resources,environment and economy,such as resources depression,environmental deterioration and so on.To be sustainable,humanity must live within the limits of nature's carrying capacity.In the 1990s,Rees and Wackernagel put forward the ecological footprints model,which offers an easy and rapid method to measure the environmental situations of eco-economic system. The aim of the paper is to show a modified model of ecological footprint calculation by combining emergy analysis with conventional ecological footprint model of calculations,in the framework of the theory of ecological footprint,to apply the method of emergy analysis and introduce the concept of emergy density into the calculation models,in order to translate all kinds of energy flows in the eco-economic systems into the corresponding biological productive units.In this paper we present a new method of ecological footprint calculation,based on the emergy analysis.The translation of human demand of natural resources and the supply of nature services into understandable and quantifiable concepts is the main objective of this new method.Firstly,the amounts of human consumption corresponding to six categories of ecological productive areas and the amounts of natural supply are calculated.And then,these amounts are translated into common unit emergy through the emergy analysis.Thirdly,in this new method we are proposing,we will derive the ecological footprint and carrying capacity by dividing the emergy amounts by the emergy density.Finally,we compare the ecological footprint with the carrying capacity to measure the environmental status of sustainability in the given region. With Jiangsu Province in the year 2003 as an example,we apply the modified model to it to analyze the ecological environmental situations.According to the calculation equations,we get the annual total emergy amount of Jiangsu was 7.828×10²¹sej and its emergy density was 7.629×10²¹sej/ha.And then we get the carrying capacity of Jiangsu was 0.299 7ha/cap,the ecological footprint of biological resources and energy resources was 4.722 8ha/cap,and the ecological deficit was 4.423 2ha/cap.So we conclude that the ecological footprint of Jiangsu has exceeded its carrying capacity,which conforms with the calculation results of conventional model of ecological footprints.This indicates that the new method of ecological footprint calculation is effective and feasible. By analyzing the strong points of the modified model,we find that the calculation results of the modified model give a more realistic picture of the environmental situations of the eco-econo-mic systems,compared to the conventional one.
[本文引用: 1]
DOI:10.11686/cyxb20110233URL [本文引用: 1]
[本文引用: 1]
URL [本文引用: 1]
Agro-ecological economic system is a kind of a special complex artificial-natural system coupled by the agro-ecosystem and the agricultural economic system, which is also one of the main targets studied in the field of regional human-natural relationship, and the central agent of research on ecological economics. This paper briefly discusses the concept and framework of emergy theory, and then, by literature analysis based on the database of CNKI and Web of knowledge, we concluded that the emergy theory has universal recognition in the field of agriculture, and presents an increasing trend. The emergy theory applied in Agro-ecological economic system research makes some progress in the field of basic theory research, indicators development and empirical studies. However, there are also some key issues that need to be resolved, including agricultural emergy flow diagrams, regional applicable of emergy theory, and comparative research on space-time scale.
[本文引用: 1]
[本文引用: 1]
DOI:10.1007/s11769-014-0732-zURL [本文引用: 1]
[本文引用: 1]
[本文引用: 1]
[本文引用: 1]
[本文引用: 1]
DOI:10.11821/dlxb201908006URL [本文引用: 1]
As natural resources are experiencing rapid reduction and the environment is degenerating, resource environmental carrying capacity has attracted more and more attention in China. However, current research on resource environmental carrying capacity still stays at theoretical level leaving the gap with applications. Moreover, the study conclusions are usually not of policy implications and lack of operability. This study develops a comprehensive analytical framework for the co-development of industries, population, economy, resources and environment. The framework first evaluates the importance of all industries to local social economy and determines the direction of industrial structure adjustment, and then identifies the interaction relationships among the socioeconomic development, resource consumption and environment emission, and subsequently evaluates the resource environmental carrying capacity, which helps achieve the maximum socio-economic development under the premise of environmental protection and efficient resource utilization. The Tibet case study estimates the local resource environmental carrying capacity under different development scenarios and therefore determines the maximum population and economic scale through industrial structure adjustments under the constraints of resource and environment. The results show that to focus on the development of tourism can significantly improve the resource environmental carrying capacity of Tibet. The results could help make decision regarding local industrial structure adjustments to achieve sustainable development. In conclusion the proposed analytical framework provides an operational decision support tool for "socio-ecological" sustainability. It can be extended to other regions through minor parameter adjustments.
[本文引用: 1]
[本文引用: 1]
[本文引用: 1]
DOI:10.3390/su5125391URL [本文引用: 1]
DOI:10.1016/j.scitotenv.2013.11.115URL [本文引用: 1]
Considering the limitation of the traditional method to assess the ecological carrying capacity and the complexity of the water ecological system, we used system dynamics, ANN, and CA Markov to model a water ecological system. The social component was modeled according to Granger causality test by system dynamics. The natural component consists of the water resource and water environmental capacity, which were forecasted through the prediction of precipitation and change in land use cover. The interaction of the social component and the natural component mainly reflected environmental policies, such as the imposition of an environmental fee and environmental tax based on their values. Simulation results showed the different assessments on water ecological carrying capacity under the two policies. The population grew (2.9 million), and less pollution (86,63237 t COD and 2854.5 t NH4N) was observed with the imposition of environmental tax compared with the imposition of an environmental fee (2.85 million population, 10,8381 t COD and 3543 t NH4N) at the same GDP level of 585 billion CNY in 2030. According to the causality loop, we discussed the different states under the policies and the reasons that caused the differences in water ecological carrying capacity state. According to game theory, we explained the limitation of the environmental fee policy on the basis of marginal benefit and cost. The externality was cleared up by the environmental tax policy. (C) 2013 Elsevier B.V.
DOI:10.2307/140646URL [本文引用: 1]
[本文引用: 1]
[本文引用: 1]
[本文引用: 1]
[本文引用: 1]
[本文引用: 1]
[本文引用: 3]
[本文引用: 3]
DOI:10.31497/zrzyxb.20170967URL [本文引用: 1]
[本文引用: 1]
[本文引用: 2]
DOI:10.5814/j.issn.1674-764x.2018.02.001URL [本文引用: 1]
With the intensive research into global coupling relationships, ecological carrying capacity (ECC), seen as the crucial link between natural ecosystems and human systems, has gradually become an important tool for interdisciplinary research in ecology, resources science and environmental science, as well as for research on regional sustainable development. However, ECC research remains immature and lacks a complete theoretical system, as a result of many limiting factors and different space-time conditions. At present, Chinese and foreign studies focus on methods to evaluate ECC while neglecting to identify the internal driving mechanisms of ECC. In this article, based on the development and conceptualization of ECC, we introduce three evaluation methods for ECC: ecological footprint (EF), human appropriation of net primary production (HANPP) and ecosystem services consumption (ESC). Furthermore, we illuminate research focuses and developmental directions for ECC with respect to driving mechanisms, threshold, comprehensive evaluation systems and coupling dynamic model of multi ecological factors, in order to provide a reference for future ECC research.
[本文引用: 1]
[本文引用: 1]
