 ,1,2,3
Spatial identification and scenario simulation of ecotone distribution in China
FAN Zemeng,1,2,3收稿日期:2020-10-19修回日期:2021-03-9网络出版日期:2021-03-25
| 基金资助: |
Received:2020-10-19Revised:2021-03-9Online:2021-03-25
| Fund supported: |
作者简介 About authors
范泽孟(1977-), 男, 云南镇雄人, 博士, 副研究员, 中国地理学会会员(S110007694M), 研究方向为气候变化与生态系统响应、生态模型与系统模拟、土地覆盖情景预测及生物多样性模拟。E-mail:

摘要
关键词:
Abstract
Keywords:
PDF (6829KB)元数据多维度评价相关文章导出EndNote|Ris|Bibtex收藏本文
本文引用格式
范泽孟. 中国生态过渡带分布的空间识别及情景模拟. 地理学报[J], 2021, 76(3): 626-644 doi:10.11821/dlxb202103010
FAN Zemeng.
1 引言
自1905年生态过渡带的概念被Clements[1]提出后,其定义和内涵经历了很长时期的讨论,于1988年在巴黎召开的第七届环境问题科学委员会(SCOPE)上被明确定义为:在时间和空间上特征具有不确定性,且相互影响的2个相邻生态系统之间的生态地带[2]。而且会议认为生态过渡带的概念把生态系统界面理论以及非稳定的脆弱性特征结合起来,可以作为识别全球变化的基本指标,呼吁国际生态学界对生态过渡带开展研究[2]。随着生态过渡带概念定义的明确和研究热度的增加[3,4,5],国际上将生态过渡带的研究逐渐延伸到100 m~10 km的空间尺度上,认为生态过渡带在空间格局水平上,可定义为是某一空间范围内的优势植被类型之间,在气候变化和人类活动驱动下发生快速交替演变的生态过渡区域[6,7]。基于上述定义,可认为生态过渡带不仅具有时间和空间2个维度的不确定性特征[8],生态过渡带内还通常叠加有两种或两种以上的生态系统类型,而不同生态系统间容易相互渗透、相互联系和相互作用。尤其是在一定的空间格局和空间尺度上,在气候变化和人类活动驱动下,生态过渡带内的优势生态系统之间会发生快速交替演变[9],进而引起生态过渡带时空分布的演替变化[5, 10]。譬如,生态过渡带的植被类型分布变化及其对气候变化的响应速度均快于相邻的非生态过渡带区域[11,12];气候干旱和变暖对生态过渡带植物物种消长影响的风险要高于非过渡带区域[13,14,15];生态过渡带的土地覆盖变化强度及其景观多样性均高于非过渡带[16,17];降雨量对生态过渡带常绿植物冠层的影响会引起的植物组成结构变化幅度高于非过渡带[18];生态过渡带是植物生长及其光合作用对气候变暖响应敏感性较高的区域[19]。
一方面,现有研究均表明生态过渡带是对气候变化和人类活动最为敏感的区域[20,21,22],不仅生态过渡带区域的生物物种易于扩散和传播,而且生态过渡带生物多样性更容易受到气候变化的影响而发生改变[23]。开展生态过渡带的生态系统时空变化研究比非过渡带更需要关注[24],这将有助于分析生态过渡带物种传播模式,有效构建物种类群优先保护框架[25],进而降低气候变化对生物多样性影响的风险系数[26]。另一方面,目前虽在针对某一类生态过渡带区域内的土地利用/覆盖变化[17, 27-30]、植被结构与分布[6]、生物多样性[31,32,33]、生态系统评估[34]、遥感监测[35]等方面开展系列研究,但这些研究主要是开展某一类型的生态过渡带区域内的生态系统对气候变化和人类活动响应规律,而在生态过渡带空间分布范围和边界的定量识别领域,则一直主要是处于生态过渡带边界确定的讨论及概念模型构建,两种生态系统类型过渡带以及某一区域的生态过渡带边界识别的研究阶段[36]。譬如,基于景观格局过渡与边界概念关系的生态过渡带层次概念模型[37];运用线性和“S”型回归方法构建植被—气候关系方程识别美国明尼苏达州草原和森林生态系统边界[38];基于Alpha和Gamma多样性分析澳大利亚荒漠沙丘区域的三叶草地和金合欢灌丛之间的过渡和突变边界[39];依据食草动物空间活动特征区分陆地与水生生态系统的过渡带边界[40]。
鉴于此,如何构建能够适用于大尺度生态过渡带类型及其分布范围的空间识别方法,定量揭示生态过渡带类型空间分布范围、时空变化特征及其类型间差异,是厘清各类生态过渡带及其内部的各种生态系统类型之间对气候变化和人类活动响应的时空差异特征亟需研究的热点问题。因此,本文旨在对HLZ(Holdridge Life Zone)模型进行拓展,建立生态过渡带类型判别规则,进而构建生态过渡带类型的空间分析模型,实现全国生态过渡带类型及其分布范围的空间识别。并在此基础上,结合平均中心的时空偏移分析模型,运用全国气候观测数据和IPCC CMIP5的不同气候情景模式数据,对全国生态过渡带类型及空间分布及未来变化趋势的情景模拟。
2 数据与方法
2.1 数据收集与处理
用于生态过渡带类型空间识别及模拟分析的气候数据,主要包括观测数据和模式模拟的情景数据。其中,气候观测数据来源于全国752个气象观测站点的月观测数据(1981—2010年)。气候情景数据采用IPCC数据分布中心的CMIP5情景中代表温室气体排放的高中低3种情景[41],即:RCP 2.6(低排放情景)、RCP 4.5(中间排放情景)、RCP 8.5(高排放情景)(https://esgf-node.llnl.gov/projects/cmip5/)的2011—2040年(T1)、2041—2070年(T2)和2071—2100年(T3)3个时段的气候情景数据。全国1 km×1 km的DEM采用SRTM数据来自于美国航空航天局(NASA)的数据网站(http://srtm.csi.cgiar.org)。如何对气候站点观测数据进行空间插值和对气候模式情景数据进行空间降尺度,进而获得高精度的气候要素空间分布数据,对生态过渡带空间分布及情景变化模拟结果具有重要影响,甚至直接关系到生态过渡带类型定量识别的准确度。空间插值和降尺度模型主要包括反距离加权模型(IDW)、三角网模型(TIN)、克里金模型(Kriging)和样条插值模型(Spline),以及基于微分几何学曲面理论发展的高精度曲面建模(HASM,High Accuracy Surface Modeling)方法[42]。HASM方法能够克服IDW、TIN、Kriging、Spline等方法存在的理论缺陷,大幅度提高气候数据的空间插值和降尺度精度[43,44]。因此,文中采用高精度曲面建模(HASM)方法,结合经纬度及高程数据,实现气候观测数据的空间插值和未来气候情景数据的降尺度处理,分别获得全国1 km×1 km空间分辨率的T0(1981—2010年)、T1(2011—2040年)、T3(2041—2070年)和T3(2071—2100年)4个时段的年平均生物温度、年降水量和潜在蒸散比率数据。
2.2 生态过渡带类型的空间识别模型
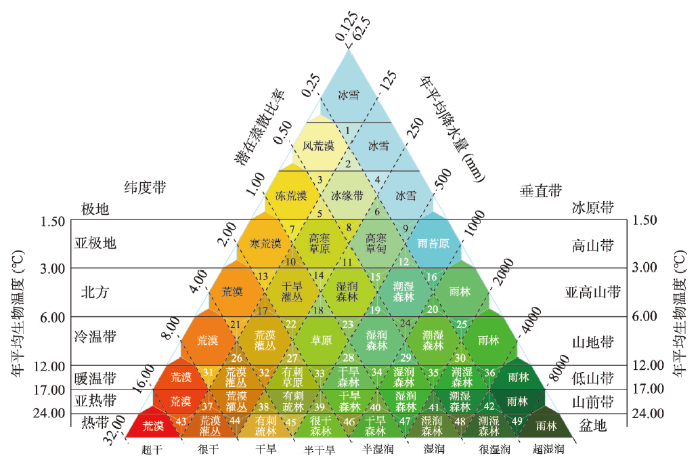
平均生物气温、降水及潜在蒸散比率等关键气候要素空间分布的连续性特征[45],决定两种甚至多种生态系统类型在地球表层空间上并不是独立分布,而是在这些生态系统的空间分布边界地带形成一定范围的重叠区域。在这些区域内,平均生物气温、降水及潜在蒸散比率等关键气候要素的时空变化将直接影响到各种生态系统类型边界的拓展和萎缩。这些多种生态系统类型重叠区域则称之为生态过渡带(Ecotone)。在模型构建的过程中,基于GIS空间分析方法,在对HLZ模型参数格式、运行模式进行改进的基础上[46,47,48,49],将其分类体系中平均生物温度、平均降水和潜在蒸散比率刻度线相交而成的正三角形定义为生态过渡带(原HLZ模型中相邻正六边形的相交地带),从而建立生态过渡带类型的理论判别体系(图1)。图1
 新窗口打开|下载原图ZIP|生成PPT
图1生态过渡带空间识别机理及模型框架
Fig. 1Mechanism and scheme for identifying ecotones
具体计算方法为:根据重新定义的生态过渡带判别体系,计算每一类生态过渡带的年均生物温度的边界阈值(
式中,
Tab. 1
表1
表1生态过渡带类型的判别标准
Tab. 1
| 编码 | BTZ类型 | MAB(℃) | TAP(mm) | PER |
|---|---|---|---|---|
| 1 | 风荒漠与冰雪过渡带 | > 0.375 | < 125 | < 0.25 |
| 2 | 风荒漠—冰缘与冰雪过渡带 | < 0.75 | > 125 | > 0.25 |
| 3 | 风荒漠—冻荒漠与冰缘过渡带 | > 0.75 | < 125 | < 0.50 |
| 4 | 冰缘与冰雪过渡带 | > 0.75 | < 250 | < 0.25 |
| 5 | 冻荒漠—冰缘与高寒草原过渡带 | < 1.50 | > 125 | > 0.50 |
| 6 | 冰缘—冰雪与高寒草甸过渡带 | < 1.50 | > 250 | > 0.25 |
| 7 | 冻荒漠—高寒荒漠/草原过渡带 | > 1.50 | < 125 | < 1.00 |
| 8 | 冰缘—高寒草原/草甸过渡带 | > 1.50 | < 250 | < 0.50 |
| 9 | 冰雪—高寒草甸与苔原过渡带 | > 1.50 | < 500 | < 0.25 |
| 10 | 高寒荒漠/草原与干旱灌丛过渡带 | < 3.00 | > 125 | > 1.00 |
| 11 | 高寒草原/草甸与北方湿润森林过渡带 | < 3.00 | > 250 | > 0.50 |
| 12 | 高寒草甸/苔原与北方潮湿森林过渡带 | < 3.00 | > 500 | > 0.25 |
| 13 | 高寒荒漠与北方荒漠/干旱灌丛过渡带 | > 3.00 | < 125 | < 2.00 |
| 14 | 高寒草原与北方干旱灌丛/湿润森林过渡带 | > 3.00 | < 250 | < 1.00 |
| 15 | 高寒草甸与北方湿润/潮湿森林过渡带 | > 3.00 | < 500 | < 0.50 |
| 16 | 北方潮湿/雨林与苔原过渡带 | > 3.00 | < 1000 | < 0.25 |
| 17 | 北方荒漠/灌丛与冷温带荒漠灌丛过渡带 | < 6.00 | > 125 | > 2.00 |
| 18 | 北方干旱灌丛/湿润森林与冷温带草原过渡带 | < 6.00 | > 250 | > 1.00 |
| 19 | 北方湿润/潮湿森林与冷温带湿润森林过渡带 | < 6.00 | > 500 | > 0.50 |
| 20 | 北方潮湿/雨林与冷温带潮湿森林过渡带 | < 6.00 | > 1000 | > 0.25 |
| 21 | 北方荒漠与冷温带荒漠/灌丛过渡带 | > 6.00 | < 125 | < 4.00 |
| 22 | 北方干旱灌丛与冷温带荒漠灌丛/草原过渡带 | > 6.00 | < 250 | < 2.00 |
| 23 | 北方湿润森林与冷温带草原/湿润森林过渡带 | > 6.00 | < 500 | < 1.00 |
| 24 | 北方潮湿森林与冷温带湿润/潮湿森林过渡带 | > 6.00 | < 1000 | < 0.50 |
| 25 | 北方雨林与冷温带潮湿森林/雨林过渡带 | > 6.00 | < 2000 | < 0.25 |
| 26 | 冷温带荒漠/灌丛与暖温带荒漠灌丛过渡带 | < 12.00 | > 125 | > 4.00 |
| 27 | 冷温带荒漠灌丛/草原与暖温带有刺草原过渡带 | < 12.00 | > 250 | > 2.00 |
| 28 | 冷温带草原/湿润森林与暖温带干旱森林过渡带 | < 12.00 | > 500 | > 1.00 |
| 29 | 冷温带湿润/潮湿森林与暖温带湿润森林过渡带 | < 12.00 | > 1000 | > 0.50 |
| 30 | 冷温带潮湿森林/雨林与暖温带潮湿森林过渡带 | < 12.00 | > 2000 | > 0.25 |
| 31 | 冷温带荒漠与暖温带荒漠/灌丛过渡带 | > 12.00 | < 125 | < 8.00 |
| 32 | 冷温带荒漠灌丛与暖温带荒漠灌丛/有刺草原过渡带 | > 12.00 | < 250 | < 4.00 |
| 33 | 冷温带草原与暖温带有刺草原/干旱森林过渡带 | > 12.00 | < 500 | < 2.00 |
| 34 | 冷温带湿润森林与暖温带干旱/湿润森林过渡带 | > 12.00 | < 1000 | < 1.00 |
| 35 | 冷温带潮湿森林与暖温带湿润/潮湿森林过渡带 | > 12.00 | < 2000 | < 0.50 |
| 36 | 冷温带雨林与暖温带潮湿森林/雨林过渡带 | > 12.00 | < 4000 | < 0.25 |
| 37 | 亚热带荒漠/灌丛与热带荒漠灌丛过渡带 | < 24.00 | > 125 | > 8.00 |
| 38 | 亚热带灌丛/有刺草原与热带有刺疏林过渡带 | < 24.00 | > 250 | > 4.00 |
| 39 | 亚热带有刺疏林/干旱森林与热带很干森林过渡带 | < 24.00 | > 500 | > 2.00 |
| 40 | 亚热带干旱/湿润森林与热带干旱森林过渡带 | < 24.00 | > 1000 | > 1.00 |
| 41 | 亚热带湿润/潮湿森林与热带湿润森林过渡带 | < 24.00 | > 2000 | > 0.50 |
| 42 | 亚热带潮湿森林/雨林与热带潮湿森林过渡带 | < 24.00 | > 4000 | > 0.25 |
| 43 | 亚热带荒漠与热带荒漠/灌丛过渡带 | > 24.00 | < 125 | < 16.00 |
| 44 | 亚热带荒漠灌丛与热带荒漠灌丛/有刺疏林过渡带 | > 24.00 | < 250 | < 8.00 |
| 45 | 亚热带有刺疏林与热带有刺疏林/很干森林过渡带 | > 24.00 | < 500 | < 4.00 |
| 46 | 亚热带干旱森林与热带很干/干旱森林过渡带 | > 24.00 | < 1000 | < 2.00 |
| 47 | 亚热带湿润森林与热带干旱/湿润森林过渡带 | > 24.00 | < 2000 | < 1.00 |
| 48 | 亚热带潮湿森林与热带湿润/潮湿森林过渡带 | > 24.00 | < 4000 | < 0.50 |
| 49 | 亚热带雨林与热带潮湿/雨林过渡带 | > 24.00 | < 8000 | < 0.25 |
新窗口打开|下载CSV
在对生态过渡带类型进行空识别的过程中,当空间栅格单元
2.3 生态过渡带平均中心偏移的时空分析模型
在计算生态过渡带空间分布平均中心的过程中,引入中心模型并赋予每个输入因子相应的含义[23,24,25],构建了生态过渡带平均中心偏移的时空分析模型,其理论计算公式可表达为:式中:t为时间变量;Ij(t)为
第
其中,dj为第
3 结果分析
3.1 生态过渡带空间分布特征
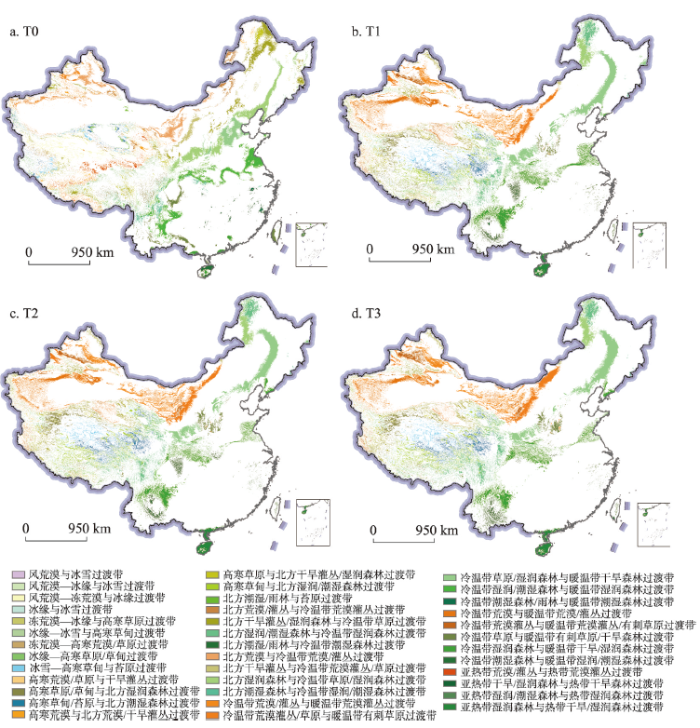
IPCC RCP 2.6、RCP 4.5、RCP 8.5气候情景驱动下的T0~T3时段的生态过渡带未来情景模拟结果显示,全国总共将出现41种生态过渡带类型(图2~图4)。其中,东部地区的生态过渡带类型呈东北向西南方向的条带状分布,西部地区的生态过渡带类型分布零散且空间异质性高,生态过渡带区域主要分布在山区,而平原、盆地内部分布较少。在所有生态过渡带类型中,冷温带草原/湿润森林与暖温带干旱森林过渡带、冷温带湿润森林与暖温带干旱/湿润森林过渡带、北方湿润/潮湿森林与冷温带湿润森林过渡带是主要的过渡带类型,3种生态过渡带类型面积占所有过渡带面积的1/3。冷温带草原/湿润森林与暖温带干旱森林过渡带主要分布在长白山、吕梁山和太行山南部地区以及渭河北岸山地丘陵地区。冷温带湿润森林与暖温带干旱/湿润森林过渡带主要分布在长江中下游沿岸山区及云贵高原西部。北方湿润/潮湿森林与冷温带湿润森林过渡带主要分布在大兴安岭北部、横断山地区及四川盆地西北部的山区。风荒漠与冰雪过渡带、风荒漠—冰缘与冰雪过渡带、风荒漠—冻荒漠与冰缘过渡带、冰缘与冰雪过渡带、冻荒漠—冰缘与高寒草原过渡带、冻荒漠—高寒荒漠/草原过渡带、高寒荒漠/草原与干旱灌丛过渡带、高寒荒漠与北方荒漠/干旱灌丛过渡带、北方潮湿/雨林与苔原过渡带、北方荒漠/灌丛与冷温带荒漠灌丛过渡带、北方潮湿/雨林与冷温带潮湿森林过渡带、北方雨林与冷温带潮湿森林/雨林过渡带、冷温带潮湿森林/雨林与暖温带潮湿森林过渡带、亚热带荒漠/灌丛与热带荒漠灌丛过渡带、亚热带湿润/潮湿森林与热带湿润森林过渡带的面积之和仅占全国生态过渡带面积的2%左右,均主要分布在在青藏高原地区。图2
 新窗口打开|下载原图ZIP|生成PPT
图2基于RCP 2.6情景的中国生态过渡带空间分布
注:基于自然资源部标准地图服务网站GS(2016)2923号标准地图制作,底图无修改,
Fig. 2Ecotones distribution in China under RCP2.6 scenario
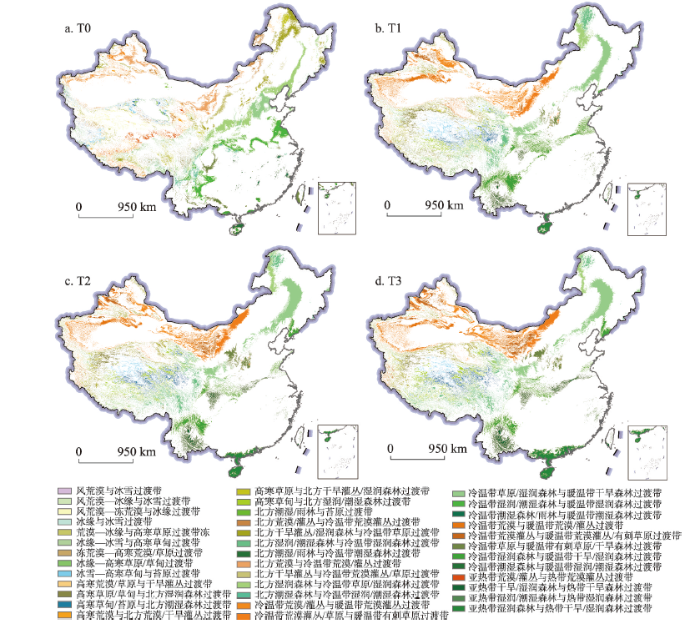
图3
 新窗口打开|下载原图ZIP|生成PPT
图3基于RCP 4.5情景的中国生态过渡带空间分布
Fig. 3Ecotones distribution in China under RCP 4.5 scenario
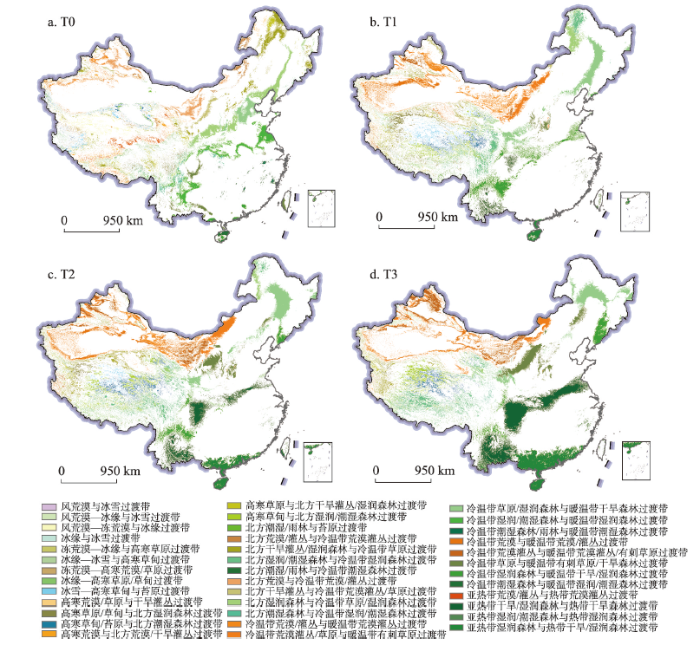
图4
 新窗口打开|下载原图ZIP|生成PPT
图4基于RCP 8.5情景的中国生态过渡带空间分布
Fig. 4Ecotones distribution in China under RCP 8.5 scenario
3.2 生态过渡带分布面积及格局变化
对RCP 2.6、RCP 4.5、RCP 8.5气候情景驱动下中国生态过渡带的模拟结果(图2~图4)进行统计分析表明(表2),在2011—2100年间不同气候情景下的全国生态过渡带将呈现出系列变化趋势。Tab. 2
表2
表2不同情景下的生态过渡带面积(km2)
Tab. 2
| 编码 | T0 | RCP 2.6 | RCP 4.5 | RCP 8.5 | ||||||||
|---|---|---|---|---|---|---|---|---|---|---|---|---|
| T1 | T2 | T3 | T1 | T2 | T3 | T1 | T2 | T3 | ||||
| 1 | 0 | 18 | 11 | 28 | 33 | 20 | 16 | 19 | 12 | 4 | ||
| 2 | 0 | 331 | 319 | 186 | 359 | 234 | 60 | 358 | 44 | 8 | ||
| 3 | 0 | 112 | 61 | 44 | 99 | 82 | 32 | 106 | 36 | 6 | ||
| 4 | 4133 | 2523 | 1929 | 2252 | 2249 | 1362 | 1255 | 2311 | 1251 | 177 | ||
| 5 | 69 | 1733 | 1621 | 1066 | 2043 | 1487 | 444 | 1937 | 235 | 21 | ||
| 6 | 67207 | 10165 | 5417 | 5630 | 9968 | 2705 | 2324 | 9085 | 2328 | 1271 | ||
| 7 | 0 | 496 | 569 | 85 | 494 | 503 | 38 | 462 | 33 | 0 | ||
| 8 | 21710 | 11833 | 8575 | 10436 | 11382 | 6306 | 5947 | 10986 | 6176 | 1778 | ||
| 9 | 50942 | 61529 | 54199 | 57642 | 56865 | 39831 | 35050 | 58659 | 30123 | 3972 | ||
| 10 | 6226 | 8108 | 7560 | 4602 | 7505 | 7651 | 3534 | 6888 | 1899 | 51 | ||
| 11 | 42813 | 72193 | 62699 | 63182 | 77481 | 51897 | 33686 | 74401 | 29872 | 9700 | ||
| 12 | 51665 | 60798 | 74726 | 76468 | 56264 | 81194 | 91293 | 57836 | 86511 | 64255 | ||
| 13 | 3698 | 2938 | 2566 | 1301 | 3330 | 2810 | 891 | 3097 | 568 | 9 | ||
| 14 | 33304 | 43970 | 35350 | 28835 | 44576 | 26912 | 22438 | 39653 | 26194 | 20468 | ||
| 15 | 53039 | 104570 | 121523 | 125735 | 105814 | 129326 | 145756 | 109206 | 147273 | 124791 | ||
| 16 | 20394 | 10 | 16 | 14 | 14 | 1 | 27 | 14 | 15 | 414 | ||
| 17 | 14482 | 16502 | 13437 | 13794 | 17491 | 11940 | 11067 | 15377 | 10001 | 3115 | ||
| 18 | 31289 | 45109 | 46366 | 43487 | 39986 | 50052 | 53911 | 40208 | 57198 | 32904 | ||
| 19 | 52387 | 135375 | 135381 | 167223 | 152001 | 164383 | 160644 | 151677 | 152096 | 182743 | ||
| 20 | 5537 | 0 | 0 | 0 | 0 | 21 | 21 | 0 | 15 | 14 | ||
| 21 | 13194 | 22047 | 18090 | 14887 | 20233 | 9779 | 5739 | 17244 | 4532 | 2311 | ||
| 22 | 63353 | 42135 | 42346 | 47085 | 45189 | 44690 | 46499 | 47416 | 45579 | 28390 | ||
| 23 | 148436 | 108981 | 102719 | 96813 | 104815 | 91829 | 77895 | 106336 | 86948 | 58513 | ||
| 24 | 21484 | 2006 | 4495 | 2412 | 1909 | 2212 | 5104 | 1702 | 1580 | 9054 | ||
| 25 | 186 | 0 | 0 | 0 | 0 | 0 | 0 | 0 | 0 | 0 | ||
| 26 | 130080 | 145120 | 136429 | 143718 | 143769 | 105773 | 102151 | 150962 | 92610 | 23052 | ||
| 27 | 49453 | 107082 | 126616 | 131613 | 116791 | 144363 | 139982 | 120822 | 144384 | 119965 | ||
| 28 | 206067 | 247976 | 236233 | 227930 | 215464 | 268572 | 267315 | 215277 | 230023 | 200860 | ||
| 29 | 37587 | 5908 | 7822 | 2878 | 204 | 1386 | 3071 | 133 | 315 | 1645 | ||
| 30 | 17 | 43 | 32 | 32 | 39 | 11 | 3 | 41 | 3 | 0 | ||
| 31 | 17491 | 107649 | 119337 | 105099 | 92396 | 114786 | 145654 | 104675 | 152720 | 101876 | ||
| 32 | 3540 | 21099 | 32599 | 39582 | 23460 | 70216 | 104171 | 26351 | 115379 | 175955 | ||
| 33 | 98325 | 19043 | 29874 | 32358 | 27524 | 50384 | 46884 | 28507 | 102668 | 167583 | ||
| 34 | 221686 | 226182 | 188416 | 212098 | 239735 | 163580 | 154365 | 225159 | 132460 | 132566 | ||
| 35 | 15214 | 6769 | 3878 | 4046 | 6482 | 2097 | 1362 | 6260 | 1291 | 16 | ||
| 37 | 0 | 0 | 0 | 0 | 0 | 0 | 0 | 0 | 0 | 884 | ||
| 38 | 13 | 0 | 0 | 0 | 0 | 0 | 0 | 0 | 0 | 0 | ||
| 39 | 62 | 0 | 0 | 0 | 0 | 0 | 0 | 0 | 0 | 0 | ||
| 40 | 65438 | 40014 | 39494 | 36285 | 48298 | 89004 | 109617 | 66368 | 237548 | 515481 | ||
| 41 | 25166 | 364 | 3349 | 1005 | 3 | 2304 | 5937 | 0 | 2991 | 7498 | ||
| 47 | 18348 | 39697 | 55697 | 54925 | 41424 | 85862 | 134610 | 42064 | 157828 | 317434 | ||
新窗口打开|下载CSV
在RCP 2.6情景下的T0~T3时段内,北方潮湿/雨林与冷温带潮湿森林过渡带、北方雨林与冷温带潮湿森林/雨林过渡带、亚热带荒漠/灌丛与热带荒漠灌丛过渡带、亚热带灌丛/有刺草原与热带有刺疏林过渡带、亚热带有刺疏林/干旱森林与热带很干森林过渡带将有可能消失。T0~T3时段内,北方湿润/潮湿森林与冷温带湿润森林过渡带、冷温带荒漠与暖温带荒漠/灌丛过渡带、冷温带荒漠灌丛/草原与暖温带有刺草原等过渡带的面积增幅最大,将分别增加11.4万km2、8.7万km2和8.2万km2;冷温带草原与暖温带有刺草原/干旱森林过渡带、冰缘—冰雪与高寒草甸过渡带、北方湿润森林与冷温带草原/湿润森林过渡带的面积减少最多,将分别平均减少6.5万km2、6.1万km2和5.1万km2;冻荒漠—冰缘与高寒草原过渡带、冷温带荒漠灌丛与暖温带荒漠灌丛/有刺草原过渡带增长速度最快,分别以144%/10a和101%/10a的速度增长;北方潮湿/雨林与苔原过渡带、亚热带湿润/潮湿森林与热带湿润森林过渡带减少速度最快,分别以9.9%/10a和9.6%/10a的速度减少。
在RCP 4.5情景下的T0~T3时段内,北方雨林与冷温带潮湿森林/雨林过渡带、亚热带荒漠/灌丛与热带荒漠灌丛过渡带、亚热带灌丛/有刺草原与热带有刺疏林过渡带、亚热带有刺疏林/干旱森林与热带很干森林过渡带将可能完全消失。冷温带荒漠与暖温带荒漠/灌丛过渡带、亚热带湿润森林与热带干旱/湿润森林过渡带、北方湿润/潮湿森林与冷温带湿润森林过渡带相均呈快速增长趋势,在T0~T3时段内将分别增长12.8万km2、11.6万km2和10.8万km2。北方湿润森林与冷温带草原/湿润森林过渡带、冷温带湿润森林与暖温带干旱/湿润森林过渡带、冰缘—冰雪与高寒草甸过渡带将呈严重缩减趋势,在T0~T3时段内将分别减少7万km2、6.7万km2和6.4万km2。冷温带荒漠灌丛与暖温带荒漠灌丛/有刺草原过渡带、冷温带荒漠与暖温带荒漠/灌丛过渡带增长速度最快,在T0~T3时段内将分别以284%/10a和73%/10a的速度增长,而北方潮湿/雨林与苔原过渡带、北方潮湿/雨林与冷温带潮湿森林过渡带则均以9.9%/10a的速度减少。
在RCP 8.5情景下的T0~T3时段内,北方雨林与冷温带潮湿森林/雨林过渡带、亚热带灌丛/有刺草原与热带有刺疏林过渡带、亚热带有刺疏林/干旱森林与热带很干森林过渡带将可能消失。亚热带干旱/湿润森林与热带干旱森林过渡带、亚热带湿润森林与热带干旱/湿润森林过渡带、冷温带荒漠灌丛与暖温带荒漠灌丛/有刺草原过渡带呈快速扩张趋势,T0~T3时段分别扩张45万km2、29.9万km2和17.2万km2。冷温带荒漠/灌丛与暖温带荒漠灌丛过渡带、北方湿润森林与冷温带草原/湿润森林过渡带、冷温带湿润森林与暖温带干旱/湿润森林过渡带缩减面积最大,T0~T3时段内分别减少10.7万km2、9万km2和8.9万km2。冷温带荒漠灌丛与暖温带荒漠灌丛/有刺草原过渡带、亚热带湿润森林与热带干旱/湿润森林过渡带增长速度最快,T0~T3将分别以每10年487%和163%的速度增长。冷温带潮湿森林与暖温带湿润/潮湿森林过渡带、高寒荒漠与北方荒漠/干旱灌丛过渡带、北方潮湿/雨林与冷温带潮湿森林过渡带的缩减速度最快,T0~T3时段内将分别以每10年9.9%的速度减少。
3.3 生态过渡带平均中心的时空偏移
运用生态过渡带平均中心时空偏移模型对基于RCP 2.6、RCP 4.5和RCP 8.5三种情景的生态过渡带平均中心的时空偏移进行求算(表3~5,表中的空白均表示某一种生态过渡带类型在相邻两个时段内的某一个时段没有出现),并对平均中心偏移距离大于50 km的生态过渡带类型的平均中心进行时空变化趋势制图(图4),发现RCP 2.6情景驱动下的生态过渡带平均中心偏移距离大于50 km的生态过渡带有15种类型,RCP 4.5情景驱动下的生态过渡带有27种类型,RCP 8.5情景驱动下的生态过渡带有31种类型。Tab. 3
表3
表3RCP 2.6情景下生态过渡带平均中心的时空偏移(km)
Tab. 3
| 编码 | T0~T1 | T1~T2 | T2~T3 | |||||
|---|---|---|---|---|---|---|---|---|
| 偏移距离 | 偏移方向 | 偏移距离 | 偏移方向 | 偏移距离 | 偏移方向 | |||
| 1 | 575.89 | 东南 | 158.44 | 西 | ||||
| 2 | 36.46 | 北 | 364.35 | 东南 | ||||
| 3 | 524.49 | 西北 | 440.09 | 东南 | ||||
| 4 | 313.37 | 西 | 45.65 | 西北 | 33.72 | 西 | ||
| 5 | 163.57 | 东北 | 204.43 | 西北 | 80.98 | 东南 | ||
| 6 | 75.23 | 南 | 111.08 | 西北 | 34.18 | 西南 | ||
| 7 | 62.35 | 东 | 183.79 | 西北 | ||||
| 8 | 344.76 | 西 | 9.82 | 东北 | 34.16 | 南 | ||
| 9 | 65.01 | 北 | 66.15 | 西 | 3.16 | 东北 | ||
| 10 | 114.76 | 西北 | 102.64 | 西北 | 80.54 | 西北 | ||
| 11 | 133.99 | 南 | 90.37 | 西北 | 25.27 | 南 | ||
| 12 | 265.35 | 东北 | 75.64 | 西 | 10.24 | 东 | ||
| 13 | 221.6 | 西 | 33.91 | 西北 | 23.62 | 西 | ||
| 14 | 226.46 | 西南 | 72.05 | 西北 | 153.18 | 西北 | ||
| 15 | 171.44 | 东南 | 110.42 | 西 | 36.23 | 东南 | ||
| 16 | 2827.93 | 东北 | 251.73 | 西南 | 251.45 | 东北 | ||
| 17 | 289.66 | 西南 | 134.86 | 西 | 218.66 | 西 | ||
| 18 | 447.75 | 南 | 64.87 | 西南 | 127.8 | 北 | ||
| 19 | 119.67 | 东南 | 150.92 | 西南 | 197.31 | 南 | ||
| 21 | 86.68 | 东南 | 56.18 | 西南 | 97.37 | 西南 | ||
| 22 | 981.11 | 西南 | 167.08 | 西南 | 30.74 | 东北 | ||
| 23 | 533.87 | 西南 | 66.24 | 西 | 309.09 | 东北 | ||
| 24 | 2268.19 | 东北 | 843.93 | 西南 | 1032.88 | 东北 | ||
| 26 | 54.23 | 西南 | 18.27 | 西 | 9.99 | 东南 | ||
| 27 | 101.5 | 东北 | 38.75 | 西北 | 167.87 | 东 | ||
| 28 | 216.51 | 东北 | 101.74 | 东北 | 72.23 | 东北 | ||
| 29 | 160.22 | 西 | 20.78 | 西 | 46.98 | 北 | ||
| 30 | 766.46 | 东南 | 13.12 | 南 | 0 | |||
| 31 | 259.19 | 东南 | 95.16 | 东南 | 44.37 | 西北 | ||
| 32 | 839.21 | 北 | 415.56 | 东南 | 112.89 | 西北 | ||
| 33 | 294.23 | 西南 | 48.46 | 西北 | 21.06 | 东南 | ||
| 34 | 220.07 | 西南 | 52.5 | 北 | 19.88 | 西北 | ||
| 35 | 378.48 | 东 | 35.47 | 东南 | 9.45 | 东南 | ||
| 40 | 488.65 | 西北 | 48.12 | 东北 | 381.42 | 南 | ||
| 41 | 641.45 | 东北 | 216.49 | 东北 | 169.64 | 东北 | ||
| 47 | 29.03 | 西北 | 61.2 | 北 | 2.36 | 南 | ||
新窗口打开|下载CSV
Tab. 4
表4
表4RCP 4.5情景下生态过渡带平均中心的时空偏移(km)
Tab. 4
| 编码 | T0~T1 | T1~T2 | T2~T3 | |||||
|---|---|---|---|---|---|---|---|---|
| 偏移距离 | 偏移方向 | 偏移距离 | 偏移方向 | 偏移距离 | 偏移方向 | |||
| 1 | 293.08 | 东 | 123.63 | 南 | ||||
| 2 | 36.08 | 东北 | 279.36 | 东南 | ||||
| 3 | 473.97 | 西北 | 494.86 | 东南 | ||||
| 4 | 320.13 | 西 | 52.11 | 西北 | 57.99 | 西 | ||
| 5 | 170.54 | 东 | 203.39 | 西北 | 70.2 | 东南 | ||
| 6 | 87.43 | 南 | 237.81 | 西 | 161.8 | 西北 | ||
| 7 | 120.74 | 西北 | 104.33 | 南 | ||||
| 8 | 321.52 | 西 | 28.5 | 北 | 112.16 | 西北 | ||
| 9 | 64.65 | 北 | 115.89 | 西北 | 71.13 | 西北 | ||
| 10 | 170.76 | 西北 | 119.2 | 西北 | 33.71 | 西 | ||
| 11 | 131.38 | 南 | 114.57 | 西北 | 101.63 | 西北 | ||
| 12 | 268.45 | 东北 | 149.39 | 西 | 95.55 | 西 | ||
| 13 | 226.55 | 西 | 28.13 | 北 | 54.75 | 西 | ||
| 14 | 217.42 | 西南 | 248.67 | 西 | 175.08 | 西北 | ||
| 15 | 213.48 | 东南 | 120.03 | 西北 | 119.29 | 西 | ||
| 16 | 2827.64 | 东北 | 2225.08 | 西南 | 60.36 | 南 | ||
| 17 | 384.24 | 西 | 372.57 | 西 | 72.11 | 西南 | ||
| 18 | 325.97 | 西南 | 234.82 | 南 | 52.36 | 南 | ||
| 19 | 174.34 | 南 | 432.43 | 西南 | 308.11 | 西南 | ||
| 20 | 0.28 | 东北 | ||||||
| 21 | 69.1 | 南 | 377.76 | 西南 | 412.93 | 西南 | ||
| 22 | 919.58 | 西南 | 332.35 | 西南 | 150.7 | 西南 | ||
| 23 | 445.81 | 西南 | 260.71 | 西南 | 155.94 | 西南 | ||
| 24 | 2650.17 | 东北 | 179.94 | 西南 | 1561.57 | 西南 | ||
| 26 | 63.85 | 西 | 82.43 | 西 | 57.92 | 西南 | ||
| 27 | 306.92 | 东 | 146.99 | 西北 | 140.7 | 西北 | ||
| 28 | 320.71 | 东北 | 191.07 | 东北 | 24.79 | 西北 | ||
| 29 | 153.5 | 西北 | 214.07 | 西 | 103.68 | 西 | ||
| 30 | 768.54 | 东南 | 19.08 | 北 | 24.07 | 北 | ||
| 31 | 235.48 | 东南 | 346.37 | 东 | 67.52 | 东南 | ||
| 32 | 743.09 | 北 | 664.54 | 东南 | 20.01 | 北 | ||
| 33 | 274.56 | 西南 | 99.58 | 西北 | 89.56 | 西北 | ||
| 34 | 322.29 | 西南 | 137.42 | 东北 | 76.99 | 东北 | ||
| 35 | 384.46 | 东 | 105.23 | 东南 | 94.5 | 东南 | ||
| 40 | 556.84 | 西 | 253.32 | 东北 | 108.94 | 东北 | ||
| 41 | 1017.64 | 东北 | 58.91 | 东南 | 7.72 | 东北 | ||
| 47 | 34.71 | 西北 | 136.54 | 东北 | 74.47 | 北 | ||
新窗口打开|下载CSV
Tab. 5
表5
表5RCP 8.5情景下生态过渡带平均中心的时空偏移(km)
Tab. 5
| 编码 | T0~T1 | T1~T2 | T2~T3 | |||||
|---|---|---|---|---|---|---|---|---|
| 偏移距离 | 偏移方向 | 偏移距离 | 偏移方向 | 偏移距离 | 偏移方向 | |||
| 1 | 122.27 | 东南 | 333.54 | 西 | ||||
| 2 | 930.5 | 东南 | 285.74 | 东南 | ||||
| 3 | 297.21 | 东南 | 81.38 | 东 | ||||
| 4 | 326.75 | 西 | 136.14 | 西北 | 64.26 | 南 | ||
| 5 | 173.46 | 东 | 246.25 | 东南 | 840.32 | 东南 | ||
| 6 | 86.9 | 南 | 445.58 | 西北 | 133.04 | 西北 | ||
| 7 | 295.09 | 东南 | ||||||
| 8 | 333.53 | 西 | 147.15 | 西北 | 78.14 | 西 | ||
| 9 | 67.49 | 北 | 185.05 | 西北 | 150.35 | 西北 | ||
| 10 | 189.19 | 西北 | 76.72 | 西 | 74.34 | 南 | ||
| 11 | 137.95 | 南 | 239.1 | 西北 | 265.65 | 西北 | ||
| 12 | 280.61 | 东北 | 257.8 | 西 | 290.64 | 西 | ||
| 13 | 224.04 | 西 | 79.49 | 西南 | 50.82 | 西北 | ||
| 14 | 259.6 | 西南 | 386.82 | 西北 | 113.5 | 西北 | ||
| 15 | 196.98 | 东南 | 202.81 | 西北 | 299.93 | 西北 | ||
| 16 | 2827.64 | 东北 | 2282.75 | 西南 | 206.86 | 南 | ||
| 17 | 479.18 | 西 | 346.49 | 西南 | 49.96 | 西 | ||
| 18 | 326.78 | 西南 | 349.86 | 南 | 428.34 | 西南 | ||
| 19 | 231.84 | 南 | 727.43 | 西南 | 656.35 | 西 | ||
| 20 | 1.12 | 南 | ||||||
| 21 | 100.83 | 南 | 1140.32 | 西南 | 89.01 | 西北 | ||
| 22 | 956.6 | 西南 | 508.54 | 西南 | 719.47 | 西南 | ||
| 23 | 389.8 | 西南 | 791.86 | 西南 | 1331.83 | 西南 | ||
| 24 | 2649.15 | 东北 | 744.07 | 西南 | 1838.76 | 西南 | ||
| 26 | 64.76 | 西 | 206.18 | 西 | 427.11 | 西 | ||
| 27 | 289.31 | 东北 | 278.89 | 西北 | 378.4 | 西 | ||
| 28 | 364.48 | 东北 | 312.33 | 东北 | 176.63 | 北 | ||
| 29 | 153.47 | 西北 | 267.16 | 西 | 138.46 | 北 | ||
| 30 | 767.04 | 东南 | 39.75 | 北 | ||||
| 31 | 260.29 | 东南 | 388.81 | 东 | 189.04 | 东 | ||
| 32 | 720.01 | 北 | 631 | 东南 | 250.86 | 西北 | ||
| 33 | 280.88 | 西南 | 215.3 | 西北 | 137.05 | 北 | ||
| 34 | 349.58 | 西南 | 165.45 | 北 | 953.92 | 东北 | ||
| 35 | 401.18 | 东 | 232.65 | 东南 | 202.82 | 东南 | ||
| 40 | 510.16 | 西 | 418.01 | 东北 | 128.65 | 东北 | ||
| 41 | 13.76 | 西北 | ||||||
| 47 | 36.96 | 西北 | 233.08 | 东北 | 102.5 | 北 | ||
新窗口打开|下载CSV
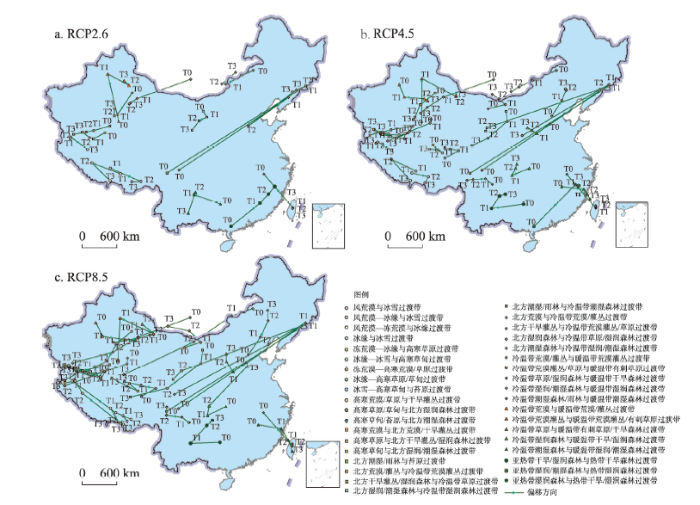
其中,① 高寒荒漠/草原与干旱灌丛过渡带、高寒草原/草甸与北方湿润森林过渡带、高寒草原与北方干旱灌丛/湿润森林过渡带等生态过渡带的平均中心整体上呈向西北偏移趋势。揭示出随着平均气温的逐渐上升,随着主要位于青藏高原和天山区域的冰川消融的增加,相应的高寒生态过渡带将逐渐演替成其邻域内的非过渡带类型。② 北方干旱灌丛/湿润森林与冷温带草原过渡带、北方湿润/潮湿森林与冷温带湿润森林过渡带、北方荒漠与冷温带荒漠/灌丛过渡带、北方干旱灌丛与冷温带荒漠灌丛/草原过渡带、北方湿润森林与冷温带草原/湿润森林过渡带等生态过渡带的平均中心整体上呈向西南偏移趋势。③ 冰雪、高寒草甸与苔原过渡带、亚热带湿润森林与热带干旱/湿润森林过渡带等生态系统类型的平均中心整体上呈向北偏移趋势。
3.4 3种情景下的生态过渡带时空变化对比分析
RCP 2.6、RCP 4.5和RCP 8.5的3种气候变化情景下的全国生态过渡带时空分布及变化趋势模拟表明:随着平均生物温度的不断上升和和降水的不断增加,全国生态过渡带类型空间格局及其平均中心在2011—2100年间,将会发生一系列的时空变化趋势,且不同的气候变化情景对生态过渡带类型的变化将产生不同的驱动效应。其中,① 冰缘与冰雪过渡带、冰缘—冰雪与高寒草甸过渡带、冰缘—高寒草原/草甸过渡带、冷温带潮湿森林与暖温带湿润/潮湿森林过渡带的面积,在RCP 4.5和RCP 8.5气候变化情景下均将呈持续减少趋势,而亚热带湿润森林与热带干旱/湿润森林过渡带的面积将呈持续增加趋势;② 北方湿润/潮湿森林与冷温带湿润森林过渡带的面积在RCP 2.6和RCP 8.5气候变化情景下将持呈续增加趋势,而RCP 4.5情景下也仅是在T2~T3时段有呈减少趋势;③ 高寒草甸/苔原与北方潮湿森林过渡带、高寒草甸与北方湿润/潮湿森林过渡带的面积在RCP 2.6和RCP 4.5气候变化情景下将呈持续增加趋势,而RCP 8.5情景下也仅是在T2~T3时段有呈减少趋势;④ 2种情景下的高寒荒漠与北方荒漠/干旱灌丛过渡带、北方湿润森林与冷温带草原/湿润森林过渡带的面积均将呈持续减少趋势而冷温带荒漠灌丛与暖温带荒漠灌丛/有刺草原过渡带的面积将呈持续增加趋势。总之,在RCP 2.6、RCP 4.5和RCP 8.5的3种气候变化驱动的未来情景下,高寒冰雪等高寒过渡带类型约占总生态过渡带总面积的20%。虽有个别高寒生态过渡带的面积呈增长趋势,如高寒草甸/苔原与北方潮湿森林过渡带、高寒草甸与北方湿润/潮湿森林过渡带,但大部分高寒生态过渡带呈减少趋势,甚至部分过渡带面临消失,如风荒漠与冰雪过渡带、风荒漠、冻荒漠与冰缘过渡带、冻荒漠、高寒荒漠/草原过渡带的面积均不超过50 km2。其中,冻荒漠、高寒荒漠/草原过渡带将在RCP 8.5情景的T3时段消失。这一研究显示,未来的全球气候变暖,将会使冰雪消融增加,导致土壤水分增加,进而引起冻荒漠、高寒荒漠/草原过渡带朝其邻域的非过渡带类型发生演替。
图5
 新窗口打开|下载原图ZIP|生成PPT
图5不同情景下的中国生态过渡带平均中心偏移趋势
Fig. 5Shift trends of mean center in ecotones under the three scenarios of RCP 2.6, RCP 4.5 and RCP 8.5
另外,在3种气候变化情景的驱动下,高寒草原与北方干旱灌丛/湿润森林过渡带、北方荒漠/灌丛与冷温带荒漠灌丛过渡带、北方干旱灌丛/湿润森林与冷温带草原过渡带、北方湿润/潮湿森林与冷温带湿润森林过渡带、北方干旱灌丛与冷温带荒漠灌丛/草原过渡带、北方湿润森林与冷温带草原/湿润森林过渡带,冷温带潮湿森林/雨林与暖温带潮湿森林过渡带、冷温带荒漠灌丛与暖温带荒漠灌丛/有刺草原过渡带、亚热带干旱/湿润森林与热带干旱森林过渡带等生态过渡带类型的平均中心时空偏移幅度整体上大于其它生态过渡带类型的平均中心偏移幅度。以上生态过渡带的平均中心在T0~T3时段内,每个时段的平均偏移幅度均超过150 km。这表明在同样的气候变化条件下,以上生态过渡带类型对气候相关因子的灵敏性高于其它的生态过渡带类型。
4 讨论
如何获取高精度的年平均生物温度、年平均降水和潜在蒸散比率等关键模型参数的空间分布数据,直接关系到生态过渡带空间识别模型模拟结果的质量[16]。文中结合经纬度及高程数据,采用HASM方法,对年平均生物温度、年平均降水和潜在蒸散比率三个关键模型参数的现状数据和未来情景进行空间插值和降尺度模拟,能够有效保证生态过渡带模型参数的精度和质量。基于HLZ模型修正和拓展构建的生态过渡带类型的空间识别模型,能够通过年平均生物温度、年平均降水和潜在蒸散比率3个关键模型参数对生态过渡带类型及空间分布进行定量刻画和求算,有效弥补了现有研究仅通过景观格局过渡与边界概念关系确定生态过渡带层的次概念模型[37]、运用线性和“S”型回归方法构建植被—气候线性关系模型[38],以及仅局限于局地区域的边界识别或者是两种生态系统类型的突变边界识别[40]的研究缺陷。另外,生态过渡带空间识别模型能够结合不同的未来气候变化情景数据对生态过渡带类型未来变化的时空情景进行模拟分析。
运用RCP 2.6、RCP 4.5和RCP 8.5三种未来气候变化情景数据,2011—2100年间不同情景下全国生态过渡带的时空变化模拟显示,在未来80年内,随着平均气温的逐渐增加,高寒型生态过渡带的面积总体上呈现减少趋势,而且主要位于青藏高原的寒冷型生态过渡带的平均中心呈向西北偏移趋势。这一研究能够有效阐释随着气温的逐渐上升,青藏高原和天山区域的冰雪将呈逐渐向高海拔退缩的趋势,而且由于冰雪消融水导致相应区域的土壤湿度的增加,使原有的生态过渡带类型演替为邻域范围内的其他非过渡带生态类型[48,49]。另外,由于干旱区域的气温升高,蒸腾强度上升,致使干旱型的生态过渡带普遍呈向西南偏移趋势[50]。总体上看,寒冷型生态过渡带和干旱型过渡带在同样的气候变化驱动下,对气候相关因子的灵敏性普遍高于其他的生态过渡带类型。
另外,生态过渡带作为对气候变化和人类活动最为敏感的区域,区域内的植被结构及其分布、土地利用覆盖不仅在同等气候变化条件下发生的变化高于其他的非过渡带区域[20,21,22],而且在人类活动干扰下也较非过渡带容易发生变化[16]。全国的农牧交错带大部分位于生态过渡带区域,其耕地和草地之间的变化强度和幅度要高于其他的区域。尤其是处于生态过渡带的农田控制水源涵养区域,在农牧生产、林果种植及生态旅游等人类活动的作用下,植被结构和土地覆盖格局的变化要高于其他的区域[51]。该模型方法主要阐释了在不同气候变化情景驱动下的全国生态过渡带类型空间分布的时空变化趋势,有效反应了气候变化对不同生态过渡带类型时空演替的驱动效应,揭示不同生态过渡带类型对气候变化驱动效应的敏感性问题。但目前主要侧重于气候变化对生态过渡带的驱动效应分析。在后续的研究过程中,将深入探讨人类活动作用对生态过渡带时空格局变化的驱动效应,综合分析自然气候要素与人类活动双重耦合驱动下的全国生态过渡带时空变化规律,并对其变化幅度和强度进行归因分析。
5 结论
基于HLZ模型修正和拓展构建的生态过渡带类型空间识别模型,能够有效实现全国生态过渡带类型及空间分布格局的定量识别。引入平均中心空间分析模型,能够实现全国生态过渡带平均中心的偏移方向和距离的时空刻画和表征。冷温带草原/湿润森林与暖温带干旱森林过渡带、冷温带湿润森林与暖温带干旱/湿润森林过渡带、北方湿润/潮湿森林与冷温带湿润森林过渡带是全国分布最广的三种生态过渡带类型,在三种气候变化情景下的平均面积分别为564238.5 km2、566549.75 km2和525750.25 km2,其总面积约占全国生态过渡带总面积的1/3。在RCP 2.6、RCP 4.5和RCP 8.5未来气候变化情景的驱动下,冷温带荒漠灌丛与暖温带荒漠灌丛/有刺草原过渡带的面积增加最快,将分别增加3604.2 km2/10a、10063.1 km2/10a和17242 km2/10a。高寒荒漠与北方荒漠/干旱灌丛过渡带、冰缘—冰雪与高寒草甸过渡带、冷温带潮湿森林与暖温带湿润/潮湿森林过渡带等生态过渡带类型,在未来气候变化驱动下的面积减少总体上高于其他的生态过渡带类型。参考文献 原文顺序
文献年度倒序
文中引用次数倒序
被引期刊影响因子
[本文引用: 1]
[本文引用: 2]
[本文引用: 1]
[本文引用: 1]
[本文引用: 1]
[本文引用: 2]
[本文引用: 2]
DOI:10.1111/eco.2001.24.issue-4URL [本文引用: 2]
DOI:10.2307/1941905URLPMID:27759251 [本文引用: 1]

Ecological phenomena are evident over a broad spectrum of space and time scales. Ecotones, being defined as zones of transition between adjacent ecological systems, also must occur over an equally broad spectrum of space and time scales. Scale-dependent constraints influence ecological phenomena and resulting zones of transition; however, in traditional ecotone studies little treatment has been given to these influences. This paper addresses aspects of the ecotone concept that relate to the strength of interactions between adjacent systems for a hierarchy of ecotones in a biome transition area in central New Mexico on the Sevilleta National Wildlife Refuge. Zones of transition occur at plant, population, patch, landscape, and biome levels in the hierarchy suggested here. Constraints differ across this hierarchy, primarily because of the different scales at which these constraints exert their influences. The basic strategy to understand these cross-scale influences must be to perform studies at different scales, and a hierarchical approach identifies those scales. This also is important for identifying the appropriate technologies that focus at the scales where transition zones between ecological systems/phenomena are expressed. A broad array of technologies are available for integrating the pattern-process relationships that occur across the many scales in ecological systems.
DOI:10.1111/bij.12333URL [本文引用: 1]
We revise concepts, definitions and examples of biogeographical transition zones to help develop a conceptual framework and differentiate them from other transitions that occur in the geographical space. A biogeographical transition zone is defined as a geographical area of overlap, with a gradient of replacement and partial segregation between biotic components (sets of taxa that share a similar geographical distribution as a product of a common history). It is an area where physical features, environmental conditions and ecological factors allow the mixture and the co-occurrence of two or more biotic components, but also constrain their distribution further into one another. The biogeographical affinities of the taxa are the most fundamental information to consider to analyse biogeographical transition zones accurately. By plotting the frequency of different distribution patterns on maps, gradual changes in their relative contribution to a given area can be perceived. Thus, the most heterogeneous places in terms of distributional patterns can be defined numerically on strictly geographical grounds. Biogeographical transition zones can occur at every hierarchical level of a biogeographical regionalization as long as different biotic components come into contact geographically. Ecological boundaries or ecotones when characterized only by differences in dominance of some species, life forms or sets of characteristic species (not endemic) are not biogeographical transition zones as defined herein. (C) 2014 The Linnean Society of London,
DOI:10.1038/ncomms15519URL [本文引用: 1]
DOI:10.1073/pnas.97.4.1359URLPMID:10677467 [本文引用: 1]
Rapid climate change characterizes numerous terrestrial sediment records during and since the last glaciation. Vegetational response is best expressed in terrestrial records near ecotones, where sensitivity to climate change is greatest, and response times are as short as decades.
URLPMID:16217022 [本文引用: 1]
DOI:10.1073/pnas.0914211107URLPMID:21149715 [本文引用: 1]
In recent decades, intense droughts, insect outbreaks, and wildfires have led to decreasing tree growth and increasing mortality in many temperate forests. We compared annual tree-ring width data from 1,097 populations in the coterminous United States to climate data and evaluated site-specific tree responses to climate variations throughout the 20th century. For each population, we developed a climate-driven growth equation by using climate records to predict annual ring widths. Forests within the southwestern United States appear particularly sensitive to drought and warmth. We input 21st century climate projections to the equations to predict growth responses. Our results suggest that if temperature and aridity rise as they are projected to, southwestern trees will experience substantially reduced growth during this century. As tree growth declines, mortality rates may increase at many sites. Increases in wildfires and bark-beetle outbreaks in the most recent decade are likely related to extreme drought and high temperatures during this period. Using satellite imagery and aerial survey data, we conservatively calculate that approximately 2.7% of southwestern forest and woodland area experienced substantial mortality due to wildfires from 1984 to 2006, and approximately 7.6% experienced mortality associated with bark beetles from 1997 to 2008. We estimate that up to approximately 18% of southwestern forest area (excluding woodlands) experienced mortality due to bark beetles or wildfire during this period. Expected climatic changes will alter future forest productivity, disturbance regimes, and species ranges throughout the Southwest. Emerging knowledge of these impending transitions informs efforts to adaptively manage southwestern forests.
DOI:10.1038/srep24881URLPMID:27143226 [本文引用: 1]
A rapid warming in Himalayas is predicted to increase plant upper distributional limits, vegetation cover and abundance of species adapted to warmer climate. We explored these predictions in NW Himalayas, by revisiting uppermost plant populations after ten years (2003-2013), detailed monitoring of vegetation changes in permanent plots (2009-2012), and age analysis of plants growing from 5500 to 6150 m. Plant traits and microclimate variables were recorded to explain observed vegetation changes. The elevation limits of several species shifted up to 6150 m, about 150 vertical meters above the limit of continuous plant distribution. The plant age analysis corroborated the hypothesis of warming-driven uphill migration. However, the impact of warming interacts with increasing precipitation and physical disturbance. The extreme summer snowfall event in 2010 is likely responsible for substantial decrease in plant cover in both alpine and subnival vegetation and compositional shift towards species preferring wetter habitats. Simultaneous increase in summer temperature and precipitation caused rapid snow melt and, coupled with frequent night frosts, generated multiple freeze-thaw cycles detrimental to subnival plants. Our results suggest that plant species responses to ongoing climate change will not be unidirectional upward range shifts but rather multi-dimensional, species-specific and spatially variable.
DOI:10.1111/gcb.12855URLPMID:25640748 [本文引用: 1]
DOI:10.1126/science.1118160URLPMID:16339443 [本文引用: 1]
Adding the effects of changes in land cover to the A2 and B1 transient climate simulations described in the Special Report on Emissions Scenarios (SRES) by the Intergovernmental Panel on Climate Change leads to significantly different regional climates in 2100 as compared with climates resulting from atmospheric SRES forcings alone. Agricultural expansion in the A2 scenario results in significant additional warming over the Amazon and cooling of the upper air column and nearby oceans. These and other influences on the Hadley and monsoon circulations affect extratropical climates. Agricultural expansion in the mid-latitudes produces cooling and decreases in the mean daily temperature range over many areas. The A2 scenario results in more significant change, often of opposite sign, than does the B1 scenario.
DOI:10.1016/j.ecolmodel.2012.07.039URL [本文引用: 3]
The Holdridge life zone (HLZ) model has been improved to help classify the biome transition zone (BTZ) in China's Loess Plateau. A positive and negative transformation index of land-cover (PNTIL) was developed to quantitatively evaluate the land-cover changes in every type of BTZ. Three bioclimatic datasets, with a spatial resolution of 1 km x 1 km, were used to classify the BTZ type in Loess Plateau. These include the mean annual biotemperature (MAB), average total annual precipitation (TAP) and potential evapotranspiration ratio (PER). In 1985, 1995 and 2005 land cover data was used to analyze the changes within BTZs. The results show that there are 14 BTZ types, which account for 25.21% of the total land-cover area in Loess Plateau. From 1985 to 2005, cultivated land decreased 0.93% per decade; on average wetland and water areas, woodland and grassland increased 3.47%, 0.24% and 0.06% respectively per decade. During this period the total rate of whole BTZ land-cover transformation decreased from 28.53% to 21.91%. Overall the total positive and negative transformed areas of land cover in BTZs displayed a decreasing trend. Moreover, the results indicate that the transition zones may have exhibited a greater change and landscape diversity than the adjacent biomes in Loess Plateau from 1985 to 2005. (C) 2012 Elsevier B.V.
DOI:10.1038/ngeo2382URL [本文引用: 2]
DOI:10.1038/nclimate2497URL [本文引用: 1]
[本文引用: 1]
[本文引用: 1]
DOI:10.1126/science.276.5320.1855URL [本文引用: 2]
DOI:10.1126/science.290.5500.2291URL [本文引用: 2]
DOI:10.1038/35012241URLPMID:10821284 [本文引用: 2]
Human alteration of the global environment has triggered the sixth major extinction event in the history of life and caused widespread changes in the global distribution of organisms. These changes in biodiversity alter ecosystem processes and change the resilience of ecosystems to environmental change. This has profound consequences for services that humans derive from ecosystems. The large ecological and societal consequences of changing biodiversity should be minimized to preserve options for future solutions to global environmental problems.
DOI:10.1126/science.1219033URL [本文引用: 2]
DOI:10.1046/j.1365-2699.2000.00388.xURL [本文引用: 2]
DOI:10.1016/j.ecolmodel.2018.06.004URL [本文引用: 2]
DOI:10.1038/s41598-018-27066-0URLPMID:29884865 [本文引用: 1]
The agro-pastoral ecotone of northern China is one of the areas most sensitive to global temperature change. To analyze the temporal and spatial trends of extreme temperature events in this area, we calculated the values of 16 extreme-temperature indices from 1960 to 2016 based on data from 45 national meteorological stations. We found that the coldest-temperature indices decreased significantly and the warmest-temperature indices increased significantly. The warming of night temperatures contributed more than warming of day temperatures to the overall warming trend. In addition, the warm-temperature indices appeared to be increasing since the late 1980s and early 1990s. Overall, though the four extremal indices showed an increasing trend, the rate of change in the minimum temperature was greater than that of the maximum temperature; thus, the minimum temperature contributed most strongly to the overall temperature increases. The growing season is being prolonged in higher-elevation areas, but vegetation maturation in lower-elevation areas has been accelerated by the high temperatures, potentially leading to a shorter growing season at low altitudes. However, the impacts of land-use changes caused by human activities on the temperature increases will require additional study.
DOI:10.1016/j.ecolind.2018.01.067URL [本文引用: 1]
DOI:10.1007/s12665-015-4223-zURL
DOI:10.1111/gcb.12855URLPMID:25640748 [本文引用: 1]
DOI:10.11821/xb201212004URL [本文引用: 1]
A large number of nature reserves have been established in China aiming to prevent ecosystem degradation, protect natural habitats and conserve the biodiversity within the habitats. By the end of 2010, a total of 2588 nature reserves has been established in China and their total area was 149.44 million hectares, covering over 15% of China's total land area. As the primary driver of biodiversity change, land-cover change has direct effect on ecosystem structures and functions. Thus, a quantitative analysis of changes in the land-cover of nature reserves is a critical step for evaluating the effectiveness and improving the management policies of nature reserves. In terms of the ecosystem characteristics and its major protected objects, 180 National Nature Reserves (NNRs) are chosen and classified into 7 types in this paper. A Land-cover Transform Direction Index (LTDI) is developed on the basis of the contribution of each land-cover type to maintaining the ecosystem stability. In Northeast China, North China, East China, South China, Central-southern China, Northwest and Southwest China, LTDI is used to calculate the transition trend of land-cover in the core zone, buffer zone and experimental zone of each NNRs type during the period from the late 1980s to 2005. The results show that the mean transition rate of all selected NNRs types has become lower during the two decades. The land-cover transform rate of Southwest China was the largest, while that of East China was the smallest among the six regions. The mean positive and negative transform rates of land-cover in all core zones decreased by 0.69% and 0.16% respectively. The landscape pattern of land-cover in the core zones was more stable than that in the buffer zones and the experimental zones. The land-cover transformed rate of NNRs was less than that of Non-NNRs in general. Furthermore, the ecological diversity and patch connectivity of land-cover in the whole selected area increased generally during the period 1995-2005. In summary, the land-cover of NNRs in China has a beneficial change trend after the NNRs were established, especially during the period from 1995 to 2005.
[本文引用: 1]
DOI:10.1007/s11442-019-1667-1URL [本文引用: 1]
DOI:10.1038/srep32601URLPMID:27597658 [本文引用: 1]
Biodeterioration is a major problem for the conservation of cultural heritage materials. We provide a new and original approach to analyzing changes in patterns of colonization (Biodeterioration patterns, BPs) by biological agents responsible for the deterioration of outdoor stone materials. Here we analyzed BPs of four Khmer temples in Angkor (Cambodia) exposed to variable environmental conditions, using qualitative ecological assessments and statistical approaches. The statistical analyses supported the findings obtained with the qualitative approach. Both approaches provided additional information not otherwise available using one single method. Our results indicate that studies on biodeterioration can benefit from integrating diverse methods so that conservation efforts might become more precise and effective.
[本文引用: 1]
[本文引用: 1]
DOI:10.1007/s10584-011-0148-zURL [本文引用: 1]
DOI:10.1016/j.biosystems.2008.03.001URLPMID:18448239 [本文引用: 1]
Ecological boundaries have been described as being multiscalar or hierarchical entities. However, the concept of the ecological boundary has not been explicitly examined in the context of hierarchy theory. We explore how ecological boundaries might be envisioned as constituents of scalar hierarchical systems. Boundaries may be represented by the surfaces of constituents or as constituents themselves. Where surfaces would correspond to abrupt transition zones, boundary systems might be quite varied depending on hierarchical context. We conclude that hierarchy theory is compatible with a functional vision of ecological boundaries where functions can be largely represented as the processing or filtering of ecological signals. Furthermore, we postulate that emergent ecological boundaries that arise on a new hierarchical level may contribute to the overconnectedness of mature ecosystems. Nevertheless, a thermodynamic approach to the emergence and development of boundary systems does indicate that in many situations, ecological boundaries would persist in time by contributing to the energy production of higher hierarchical levels.
DOI:10.1007/s10021-007-9036-9URL [本文引用: 2]
Ecological transition zones are increasingly recognized as systems that play a critical role in controlling or modifying flows of organisms, materials, and energy across landscapes. Many concepts describing transitional areas have been proposed over the years, such as the prevalent and durable ecotone concept. Confusion among ecologists and land managers about transition zone concepts and the isolation of studies that use only one transition concept can hinder unified progress in understanding these key systems. Currently, a movement toward conceptual synthesis under the umbrella concept of ‘ecological boundary’ is underway. Here we examine the history and theoretical baggage of the ecotone, riparian zone, and several other concepts. Subsequently, we present a conceptual cluster analysis, which facilitates a better understanding of the similarities and differences between boundary and transition concepts. We emphasize the hierarchical nature of these concepts: higher-level synthetic concepts can be used in the development of theory, whereas lower-level concepts allow more specificity and the formulation of operational definitions. Finally, we look briefly at the utility and future use of boundary and transition zone concepts.]]>
DOI:10.1111/jvs.12028URL [本文引用: 2]
DOI:10.1016/j.jaridenv.2011.06.016URL [本文引用: 1]
DOI:10.1007/s10021-014-9805-1URL [本文引用: 2]
The transitions between ecosystems (ecotones) are often biodiversity hotspots, but we know little about the forces that shape them. Today, often sharp boundaries with low diversity are found between terrestrial and aquatic ecosystems. This has been attributed to environmental factors that hamper succession. However, ecosystem properties are often controlled by both bottom-up and top-down forces, but their relative importance in shaping riparian boundaries is not known. We hypothesize that (1) herbivores may enforce sharp transitions between terrestrial and aquatic ecosystems by inhibiting emergent vegetation expansion and reducing the width of the transition zone and (2) the vegetation expansion, diversity, and species turnover are related to abiotic factors in the absence of herbivores, but not in their presence. We tested these hypotheses in 50 paired grazed and ungrazed plots spread over ten wetlands, during two years. Excluding grazers increased vegetation expansion, cover, biomass, and species richness. In ungrazed plots, vegetation cover was negatively related to water depth, whereas plant species richness was negatively related to the vegetation N:P ratio. The presence of (mainly aquatic) herbivores overruled the effect of water depth on vegetation cover increase but did not interact with vegetation N:P ratio. Increased local extinction in the presence of herbivores explained the negative effect of herbivores on species richness, as local colonization rates were unaffected by grazing. We conclude that (aquatic) herbivores can strongly inhibit expansion of the riparian vegetation and reduce vegetation diversity over a range of environmental conditions. Consequently, herbivores enforce sharp boundaries between terrestrial and aquatic ecosystems.
[本文引用: 1]
DOI:10.1016/j.gloplacha.2016.09.003URL [本文引用: 1]
DOI:10.1007/s11430-019-9594-3URL [本文引用: 1]
DOI:10.1016/j.gloplacha.2005.03.001URL [本文引用: 1]
DOI:10.1016/j.gloenvcha.2006.11.010URL [本文引用: 1]
DOI:10.1098/rstb.2003.1434URL [本文引用: 1]
DOI:10.1016/j.ecolmodel.2006.05.026URL [本文引用: 1]
[本文引用: 2]
DOI:10.1007/s11442-019-1667-1URL [本文引用: 2]
[本文引用: 1]
DOI:10.11821/dlxb201703004URL [本文引用: 1]
The quantitative analysis of the effect of climate change on the fluctuation of farming-pastoral ecotone (FPE) boundary in northern China is a current focus in the field of response to climate change in ecological vulnerable regions. Previous studies have given profound descriptions about the effects of climate change on the boundary shifts of the ecotones qualitatively, but lacked quantitative analysis of the contribution of climate change on both spatial and temporal scales. Here, climate data from national meteorological stations and land use data interpreted from remote sensing images of the farming-pastoral ecotone (FPE) in northern China since 1970 were used to describe boundaries of the FPE based on both climate and land use in the 1970s, 1980s, 1990s and 2000s. Detection in horizontal and vertical directions method (FishNet) and Digital Shoreline Analysis System method (DSAS) were applied to detect the spatial pattern of the FPE boundaries and to examine how much of the boundaries shifts can be explained by climate change in different periods. The results showed that the spatial pattern of the FPE boundaries and contributions of climate varied in different regions and periods. The FPE boundaries moved slightly in the northwest part of the FPE and violently in the northeast part. The shift of climate and land use boundaries in northwest segment of the Greater Hinggan Mountains showed the most highly coupling relationship and the contribution rate of climate change reached 10.7%-44.4% in east-west direction and 4.7%-55.9% in north-south direction based on FishNet method and 1.1%-16.8% based on DSAS method from the 1970s to the 2000s. Most of the detections based on the two methods had consistent results. Moreover, DSAS method was better than FishNet method in overall accuracy and suitable for the precise detection in small range, while FishNet method was more appropriate for intuitive, rapid and low-precision analysis. Our findings highlight the importance of different adaption measures to climate change in the FPE of northern China in different regions and periods.
[本文引用: 1]
