Vertical variation of land cover in the Central Himalayas
ZHANG Yili1,2,3, WU Xue1,3, ZHENG Du1收稿日期:2018-10-10修回日期:2020-01-7网络出版日期:2020-05-25
| 基金资助: |
Received:2018-10-10Revised:2020-01-7Online:2020-05-25
| Fund supported: |
作者简介 About authors
张镱锂(1962-),男,研究员,博士生导师,主要从事生物地理与自然地理综合研究E-mail:zhangyl@igsnrr.ac.cn;wuxuexxl@163.com。

摘要
关键词:
Abstract
Firstly, the distribution of land cover in mountainous areas was characterized by an obvious vertical spectrum structure, with the south-six and north-four pattern of vertical spectrum of land cover in the Central Himalayas marked by the influence of human activities. Secondly, zonal distribution was exhibited by forests, grasslands, sparse vegetation, barren land, glaciers, and snow covers from low to high altitudes. It was markedly different in the composition and structure of land cover vertical spectrum between the northern and southern slopes of this mountain area. The vertical spectrum of land cover types on the southern slope was complete and diverse, but it was relatively simple on the northern slope. The study shows that given the same land cover type, the amplitude of elevation distribution on the southern slope was wide, while that on the northern slope was narrow. The distribution of land cover types on the southern slope was low. Thirdly, the results show that the area distribution ratio of each land cover type varied with elevation according to change mode. Vertical distribution patterns of land cover types on the southern and northern slopes were therefore divided into four categories, with glaciers, snow, sparse vegetation, and grasslands conforming to unimodal distribution patterns. The bare land also followed a unimodal distribution pattern on the southern slope, but it followed a bimodal one on the northern slope. Fourthly, all kinds of vertical belt structures and land cover divisions on the southern slope were similar, but they were different from one another on the northern slope due to division methods. In comparison with field survey data, results reported here for the sector method were more in line with the actual situation.
Keywords:
PDF (4104KB)元数据多维度评价相关文章导出EndNote|Ris|Bibtex收藏本文
本文引用格式
张镱锂, 吴雪, 郑度. 喜马拉雅山脉中段土地覆被的垂直分异特征. 地理学报[J], 2020, 75(5): 931-948 doi:10.11821/dlxb202005004
ZHANG Yili.
1 引言
人类通过改变土地覆被影响着陆地表层环境[1],土地覆被变化及其生态环境效应被众多国际组织及科学研究计划作为核心问题之一[2,3],是全球变化研究的前沿和重点领域[4]。特定条件下,自然带在垂直方向上变化的梯度是水平方向上的1000倍[5],对山地自然带的研究是揭示山地环境复杂性和异质性规律的有效手段,也是传统自然地理学研究的重要内容。垂直带谱的变化不仅对气候变化具有指示作用,还是气候变化信号的“放大器”[6],因此,山地垂直带研究的意义更为广泛。目前,全球范围内已开展了一系列的山地垂直空间格局对比研究,尤其是对雪线和森林上下限的全球尺度比较分析[5, 7-8]。相关研究表明,在高山生态系统中,气候变化影响植物群落的植物生理过程、物种组成和多样性,进而可能改变群落的结构和功能特征;这在不同植被类型间的过渡带或交错带表现得尤为敏感。如在阿尔卑斯山脉和北美山区[9]及五台山[10]等山地,表现为植被垂直带界线上移、高山林线上升[11]、极地林线植物生长改变[12,13]等。此外,一些研究还通过山地垂直带分布及其排列空间的统计分析和模拟及野外试验分析,进一步探讨气候空间变化与垂直带关系,如山地垂直带与气候因子的空间关系[14]、增温效应对垂直带谱的影响[15]、林线和树线对气候变化响应机理[16,17]等。位于喜马拉雅中段的珠穆朗玛峰(以下简称珠峰),海拔高、生境复杂、生态系统类型独特[18],具有世界上最完整的自然垂直带谱,是研究高海拔植被垂直变化的理想场所。20世纪70年代,张经炜和姜恕根据中国珠穆朗玛峰登山队科学考察队(1959—1960年)、中国科学院西藏综合考察队(1960—1961年)和中国科学院西藏科学考察队(1966—1968年)的调查资料,系统地分析了珠峰地区植被垂直分带及其与水平地带的关系;80年代郑度等进一步阐明了东喜马拉雅地区植被垂直带特征。这些研究对认识珠峰地区植被垂直带构成及其三维地带性特征与自然环境的垂直分异规律有着深远的影响。
受研究条件的限制,以往山地垂直带研究大多基于有限的野外考察或其他资料判读,时效性强,但时空连续性低;主要关注单一或少数类型(如林线、雪线等)的垂直带界线,对整个山体垂直带谱的分析较少;常以单一点或单一线(空间位置)代表垂直带中类型分布的界线,弱化了垂直带界线的过渡特征。这些简单的线型结构带谱虽然刻画了山地植被垂直结构和特点,但是却无法表现山地垂直带形成过程与机制,增加了带谱结构演变定量分析的不确定性。本文尝试从南北坡划分的视角,利用高分辨率土地覆被数据和GIS空间分析技术,探讨喜马拉雅山脉中段南北坡土地覆被的垂直结构及分布规律,这对于揭示极高山土地覆被空间分异规律具有重要意义,也是研究山地垂直带方法的一种新探索。
2 数据与方法
以中国和尼泊尔境内的柯西河流域上中游为研究区,该区位于喜马拉雅山脉中段,85°22'E~88°21'E、26°47'N~29°12'N,北至雅鲁藏布江的南部,南到尼泊尔与印度交界处(图1a),西至加德满都附近,东到中国和尼泊尔与印度接壤的地区,区域总面积53988.4 km2 [19]。平均海拔3783 m,海拔4500 m以上区域占研究区总面积的49%以上[20],区内拥有珠峰(Mt. Qomolangma, MQ;海拔8844 m,简写8844 m; 下同)、马卡鲁峰(MM; 8463 m)、卓奥友峰(MC; 8201 m)、干城章嘉峰(MK; 8586 m)、洛子峰(ML; 8516 m)和希夏邦马峰(MX; 8012 m)等6座世界高峰[19,20],山群之间沟谷分布,中国境内自西向东依次分布有波曲谷地、绒辖曲谷地和朋曲下游谷地。图1
 新窗口打开|下载原图ZIP|生成PPT
图1研究区地形与南北坡的3种划分图示
Fig. 1Map showing the terrains of the study area, and schema of three division methods for north and south slopes
2.1 数据
研究数据包括2010年土地覆被数据和地形数据,其中土地覆被数据由中国科学院地理科学与资源研究所青藏高原土地变化及区域适应研究组提供,数据空间分辨率为30 m,一级类型解译精度在71%~100%,平均为83.36%[20];DEM数据(ASTER GDEM)从USGS网获得(https://earthexplorer.usgs.gov),分辨率为30 m。2.2 方法
2.2.1 南北坡的划分与研究样区选择 为精确刻画土地覆被类型在南北坡分布形态与结构特点、研究其在山地垂直分布特性、垂直带形成过程与机制及土地覆被垂直带谱模式,进一步分析不同南北坡划分方法中土地覆被的垂直带谱结构异同,本文设计了脊线法、样带法和扇区法3种方法分析南北坡土地覆被垂直分布规律:(1)脊线法。以喜马拉雅山脉的主山脊线划分喜马拉雅山南坡和北坡(图1b),这是常规的南坡与北坡划分方法(以南坡或北坡的山底到山顶的单线来表达)。这种划分中,脊线南坡包括南坡部分的低于喜马拉雅山脊的全部山地及山地的各个坡向,北坡亦如此。
(2)样带法。以各山峰的峰顶为顶点,以0°方向为北坡坡向、180°方向为南坡坡向,按所接受阳光程度进行坡向划分。这种划分中,南坡包括山峰正南的样带内全部山地及山地的各个坡向的类型,北坡亦如此;为研究高海拔山地的土地覆被垂直分布规律,文中设计了跨越珠峰(MQ)、卓奥友峰(MC)和马卡鲁峰(MM)的3条南北坡(10 km宽)矩形样带,分别称为MQ样带、MC样带和MM样带(图1c)。
(3)扇区法。以山峰的峰顶为顶点,东南(157.5°)—南(180°)—西南(202.5°)方向的扇形区域为南坡坡向;西北(337.5°)—北(0°)—东北(22.5°)方向的扇形区域为北坡坡向(图1d)。在这种划分方法中,南、北坡分别包括南、北坡全部山体的南坡或北坡坡向,南坡山体的南坡坡向为扇区南坡,北坡山体的北坡坡向为扇区北坡。文中选择珠峰为研究样区。
2.2.2 利用ArcGIS和Matlab软件提取土地覆被数据 样区土地覆被数据提取具体流程为:① 坡向划分:脊线法,以喜马拉雅主山脉为界划分南北坡;样带法,样带的坡向分别以峰顶为定点,以0°和180°方向为中心,作半径为10 km的缓冲区,形成向南和向北的南坡条带与北坡条带;扇区法中提取157.5°~202.5°(南)和337.5°~22.5°(北)方向的扇形区域,再使用ArcGIS中的Aspect工具提取扇形区域内全部山体南坡方向(157.5°~202.5°)和北坡方向(337.5°~22.5°)区域。② 利用划分的南北坡为Mask,分别提取各坡向土地覆被类型数据。
2.2.3 土地覆被的垂直分布统计分析 利用Matlab获取垂直梯度的土地覆被数据。首先将提取的南北两坡的土地覆被和高程数据分别转换成ASCII码,分别命名为land_south、land_north和dem_south、dem_north。再利用Matlab编程叠加土地覆被和高程数据,统计海拔100 m梯度上土地覆被类型的占比。
2.2.4 相关术语的界定 为了便于理解和分析土地覆被类型的垂直带的空间结构与组成特点,本文界定了以下几个阐释某类型垂直分布状态的术语:
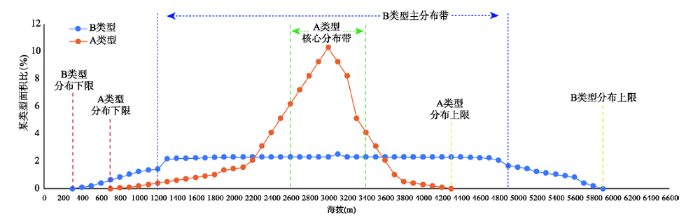
分布上限/下限,指某覆被类型连续分布的最上部/最下部边缘的高程带(图2)。在实际运算和实现中,对于某类型而言,在某垂直分布带(百米带)中出现该类型的完整像元信息,则确定为该类型出现,如此(百米)带为该类型分布的最高海拔则该高程带为该类型的上限,相反则为下限。
图2
 新窗口打开|下载原图ZIP|生成PPT
图2某土地覆被类型的垂直分布状态中有关术语图示
Fig. 2Schema of terms for altitudinal distribution of land cover types
核心分布带(核心分布范围)指某覆被类型在其垂直分布的高程范围内,高程带(如以100 m高程分割)数量占该类型分布范围内的总高程带数量的1/3 以下,其分布面积占该类总分布面积的2/3以上的高程带分布区间(图2)。该类型整个占其分布带总量的1/3以下的垂直分布范围即确定为该类型的核心分布范围,其高程分布带区间称为该类型的“核心分布带”。运用中确定方式为,以该类型面积比最大的高程带为中心,等面积比向两侧(上、下)扩展,当该类型面积比例累积达2/3以上时,其垂直分布范围确定为该类型的核心分布范围,其高程分布带区间称为该类型的“核心分布带”。
主分布带,当某覆被类型在其垂直分布的范围内无明显的核心分布带时,指其垂直分布面积占该类型面积2/3以上的垂直分布高程带区间(图2)。运用中,从其垂直分布带面积比最大的带,向两侧(上与下)等面积比扩展,当其分布面积比例占该类型总分布区面积的2/3以上时,该类型的垂直分布范围定义为该类型的主分布范围,该高程带区间称为(该类型的)主分布带。
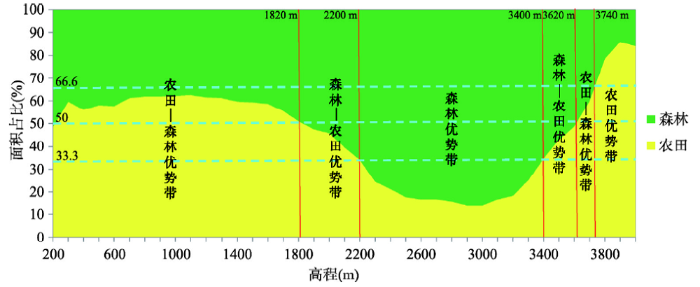
优势带,指某覆被类型在某高程带中各种覆被类型分布面积占比占绝对优势(占某高程带面积的2/3以上)的高程区间。通常,也是该类型在各个高程带中分布的面积比重最高的分布区间。在垂直分布上,各类型的优势带交替分布且不重叠。
复合优势带,指在某高程范围内,没有某一个覆被类型占绝对优势,而是两种或三种类型的面积比例几乎均等分布的高程分布区间。这种情况下,二者或三者组合被称为复合优势类型(图3),名称确定的顺序以该高程带中面积比大的为先;如在某海拔高程范围内,灌丛面积比例为52%、草地为42%,则该复合类型称为“灌丛—草地类型”,复合优势带确定为“灌丛—草地优势带”;又如某海拔高程带中,灌丛面积比为30%、森林为31%、农田为29%、建设用地为10%,该类型则称为“森林—灌丛—农田类型”,该复合优势带称为“森林—灌丛—农田优势带。
图3
 新窗口打开|下载原图ZIP|生成PPT
图3土地覆被类型垂直分布的优势带与复合优势带示意图
Fig. 3Schematic diagram showing vertical distribution of composite dominant land cover types
根据各土地覆被类型分布面积比随海拔变化的模态,依据某类型在南北两个坡向上的面积比分布峰值区的形状、数量和位置,将土地覆被类型在南、北两个坡向上的分布模式划分为:
无峰型,指某类型在某坡向上分布的面积比曲线中出现一个峰值区,而在另一个坡向上无明显峰值区的分布型,如“南单峰北无峰分布型”等。
单峰分布型,指某类型在南和北坡向上分布的面积比曲线中均出现一个峰值区的分布型。按峰值海拔高程可分为“单峰南低北高分布型”和“单峰南北一致分布型”等。
单双峰复合分布型,指某类型在某坡向上分布的面积比曲线图出现一个峰值区,而在另一个坡向上出现两个峰值区的分布型。可分为 “南单北双峰分布型”和“南双北单峰分布型等。
双峰型,指某类型在两个坡向上分布的面积比曲线图均出现两个峰值区的分布型。如“南北双峰分布型”。
3 结果与分析
3.1 土地覆被类型与组成特点
研究区土地覆被类型包括建设用地、农田、湿地、水体、森林、灌丛、草地、稀疏植被、裸地、冰川与永久积雪(简称冰川雪被)等10个一级类型及21个二级类型[22]。南坡高程范围处于海拔96~8844 m之间(表1),土地覆被类型包括10个一级类型和21个二级类型,以森林、灌丛、水体、农田和建设用地为主(表2);北坡高程范围在海拔2100~8844 m之间,有7~10个一级类型(及10~20个二级类型),以草地、稀疏植被、湿地和裸地为主。3种划分方法中,南坡的一级土地覆被类型基本一致;而北坡,扇区法和样带法则较脊线法少2~3个低海拔分布为主土地覆被类型;同样,在土地覆被二级类型中,脊线法北坡较南坡少1个类型,这一结果与该划分方法中北坡中包括北坡山地的各个坡向类型直接相关;扇区法和样带法的北坡二级类型仅10~11个较脊线法少9~10个,这个结果充分反映了北坡的高海拔区域分布特点。Tab. 1
表1
表13种坡向划分方法中南、北坡高程范围及其土地覆被类型组成
Tab. 1
| 南北坡划分 | 高程范围(m) | 类型组成 | 无分布的主要类型 | ||||||
|---|---|---|---|---|---|---|---|---|---|
| 南坡 | 北坡 | 南坡 | 北坡 | 南坡 | 北坡 | ||||
| 脊线法 | 96~8844 | 2100~8844 | 一级类型10个 二级类型21个 | 一级类型10个 二级类型20个 | 常绿阔叶林 | ||||
| 样带法 | 珠峰样带 | 146~8844 | 4167~8844 | 一级类型9个 二级类型20个 | 一级类型7个 二级类型10个 | 建设用地 | 森林、灌丛和建设用地 | ||
| 马卡鲁峰样带 | 115~8463 | 3962~8460 | 一级类型10个 二级类型21个 | 一级类型9个 二级类型13个 | 湖泊 | 森林 | |||
| 卓奥友峰样带 | 228~8200 | 3962~8200 | 一级类型9个 二级类型20个 | 一级类型7个 二级类型10个 | 建设用地 | 森林、灌丛和建设用地 | |||
| 扇区法 | 96~8844 | 4000~8844 | 一级类型10个 二级类型21个 | 一级类型8个 二级类型11个 | 森林、灌丛 | ||||
新窗口打开|下载CSV
Tab. 2
表2
表2南、北坡土地覆被类型面积组成
Tab. 2
| 类型 | 划分方法 | 南坡 | 北坡 | 南北面积比 | |||||||||||||
|---|---|---|---|---|---|---|---|---|---|---|---|---|---|---|---|---|---|
| 面积(km2) | 百分比(%) | 面积(km2) | 百分比(%) | 南:北 | |||||||||||||
| 农田 | 扇区法 | 374.20 | 44.94 | 5.66 | 1.05 | 66.11:1 | |||||||||||
| 样带法—MM样带 | 304.75 | 27.24 | 23.35 | 2.08 | 13.05:1 | ||||||||||||
| 样带法—MQ样带 | 240.29 | 19.52 | 8.21 | 0.87 | 29.27:1 | ||||||||||||
| 样带法—MC样带 | 406.96 | 31.88 | 9.04 | 1.02 | 45.02:1 | ||||||||||||
| 脊线法* | 7917.95 | 26.91 | 243.64 | 0.99 | 32.50:1 | ||||||||||||
| 森林 | 扇区法 | 342.38 | 41.12 | - | - | - | |||||||||||
| 样带法—MM样带 | 516.34 | 46.16 | - | - | - | ||||||||||||
| 样带法—MQ样带 | 559.99 | 45.50 | - | - | - | ||||||||||||
| 样带法—MC样带 | 406.80 | 31.87 | - | - | - | ||||||||||||
| 脊线法 | 11177 | 37.99 | 262.54 | 1.08 | 42.60:1 | ||||||||||||
| 灌丛 | 扇区法 | 13.62 | 1.64 | - | - | - | |||||||||||
| 样带法—MM样带 | 38.65 | 3.45 | 10.41 | 0.93 | 3.71:1 | ||||||||||||
| 样带法—MQ样带 | 34.85 | 2.83 | - | - | - | ||||||||||||
| 样带法—MC样带 | 36.13 | 2.83 | - | - | - | ||||||||||||
| 脊线法 | 1433.42 | 4.87 | 660.56 | 2.69 | 2.17:1 | ||||||||||||
| 草地 | 扇区法 | 22.17 | 2.66 | 340.08 | 62.99 | 0.07:1 | |||||||||||
| 样带法—MM样带 | 41.97 | 3.75 | 553.23 | 49.38 | 0.08:1 | ||||||||||||
| 样带法—MQ样带 | 43.26 | 3.51 | 522.06 | 55.10 | 0.08:1 | ||||||||||||
| 样带法—MC样带 | 106.15 | 8.31 | 450.42 | 50.94 | 0.24:1 | ||||||||||||
| 脊线法 | 2041.39 | 6.94 | 11886.72 | 48.40 | 0.17:1 | ||||||||||||
| 稀疏植被 | 扇区法 | 10.16 | 1.22 | 69.57 | 12.89 | 0.15:1 | |||||||||||
| 样带法—MM样带 | 28.04 | 2.51 | 96.74 | 8.63 | 0.29:1 | ||||||||||||
| 样带法—MQ样带 | 28.56 | 2.32 | 72.77 | 7.68 | 0.39:1 | ||||||||||||
| 样带法—MC样带 | 66.06 | 5.17 | 35.49 | 4.01 | 1.86:1 | ||||||||||||
| 脊线法 | 1016.77 | 3.46 | 1073.82 | 4.37 | 0.95:1 | ||||||||||||
| 水体 | 扇区法 | 9.50 | 1.14 | 0.01 | 0.00 | 950:1 | |||||||||||
| 样带法—MM样带 | 9.67 | 0.86 | 6.90 | 0.62 | 1.40:1 | ||||||||||||
| 样带法—MQ样带 | 7.90 | 0.64 | 1.43 | 0.15 | 5.52:1 | ||||||||||||
| 样带法—MC样带 | 13.69 | 1.07 | 2.40 | 0.27 | 5.70:1 | ||||||||||||
| 脊线法 | 182.87 | 0.62 | 152.43 | 0.62 | 1.20:1 | ||||||||||||
| 建设用地 | 扇区法 | 0.32 | 0.04 | 1.17 | 0.22 | 0.27:1 | |||||||||||
| 样带法—MM样带 | 0.19 | 0.02 | 0.48 | 0.04 | 0.40:1 | ||||||||||||
| 样带法—MQ样带 | - | - | - | - | - | ||||||||||||
| 样带法—MC样带 | - | - | - | - | - | ||||||||||||
| 脊线法 | 13.68 | 0.05 | 0.79 | 0.00 | 17.30:1 | ||||||||||||
| 裸地 | 扇区法 | 34.37 | 4.13 | 88.18 | 16.33 | 0.39:1 | |||||||||||
| 样带法—MM样带 | 87.34 | 7.81 | 277.88 | 24.80 | 0.31:1 | ||||||||||||
| 样带法—MQ样带 | 176.45 | 14.34 | 192.32 | 20.30 | 0.92:1 | ||||||||||||
| 样带法—MC样带 | 145.79 | 11.42 | 203.95 | 23.06 | 0.71:1 | ||||||||||||
| 脊线法 | 4010.33 | 13.63 | 7750.94 | 31.56 | 0.52:1 | ||||||||||||
| 扇区法 | 3.18 | 0.38 | 14.93 | 2.77 | 0.21:1 | ||||||||||||
| 沼泽湿地 | 样带法—MM样带 | 8.35 | 0.75 | 12.86 | 1.15 | 0.65:1 | |||||||||||
| 样带法—MQ样带 | 9.07 | 0.74 | 22.95 | 2.42 | 0.40:1 | ||||||||||||
| 样带法—MC样带 | 11.91 | 0.93 | 81.77 | 9.25 | 0.15:1 | ||||||||||||
| 脊线法 | 279.49 | 0.95 | 787.95 | 3.21 | 0.36:1 | ||||||||||||
| 冰川雪被** | 扇区法 | 22.83 | 2.74 | 20.26 | 3.75 | 1.13:1 | |||||||||||
| 样带法—MM样带 | 83.27 | 7.44 | 138.51 | 12.36 | 0.60:1 | ||||||||||||
| 样带法—MQ样带 | 130.48 | 10.60 | 127.74 | 13.48 | 1.02:1 | ||||||||||||
| 样带法—MC样带 | 83.11 | 6.51 | 101.19 | 11.44 | 0.82:1 | ||||||||||||
| 脊线法 | 1355.58 | 4.61 | 1740.59 | 7.09 | 0.78:1 | ||||||||||||
| 总计 | 扇区法 | 832.73 | 100.00 | 539.87 | 100.00 | 1.54:1 | |||||||||||
| 样带法—MM样带 | 1118.57 | 100.00 | 1120.36 | 100.00 | 1.00:1 | ||||||||||||
| 样带法—MQ样带 | 1230.85 | 100.00 | 947.48 | 100.00 | 1.30:1 | ||||||||||||
| 样带法—MC样带 | 1276.59 | 100.00 | 884.27 | 100.00 | 1.44:1 | ||||||||||||
| 脊线法 | 29428.43 | 100.00 | 24559.97 | 100.00 | 1.20:1 | ||||||||||||
新窗口打开|下载CSV
研究区南坡面积略高于北坡面积(表2)。南坡的土地覆被类型以森林和农田为主,占南坡面积的60%~86%;北坡以草地和裸地为主,二者占北坡面积的74%~80%。扇区法结果为:南坡以森林和农田为主(共占86%),二者比例相近(表2);北坡以草地为主(占63%),其次是裸地和稀疏植被(分别占16.33%和12.89%);冰川雪被面积北坡占比高。样带法结果为:南坡主要以农田和森林为主(占60%~75%),北坡以草地和裸地为主(占73%);冰川分布面积北坡大于南坡。而脊线法的南坡以森林、农田与冰川雪被分布为主,北坡以草地、裸地与冰川雪被为主;其中北坡草地分布面积远高于南坡,是南坡的6.7倍,森林主要分布在南坡。
3.2 土地覆被类型在南北坡垂向分布形态、位置与核心分布特征
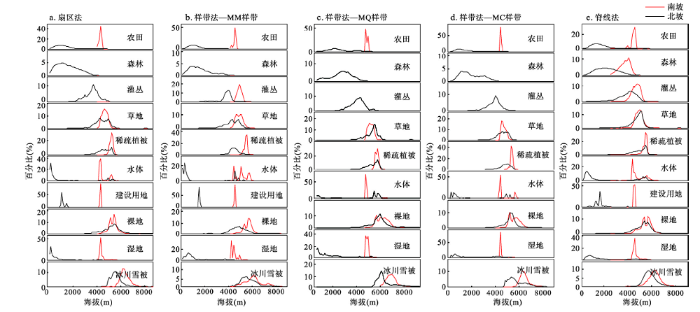
各种土地覆被类型分布随环境梯度而改变,图4呈现了土地覆被类型分布面积比重在3种南北坡划分中的垂直分布状态。土地覆被类型在南北坡上的垂直分布模式包括四大类五小类。分述如下:图4
 新窗口打开|下载原图ZIP|生成PPT
图4土地覆被类型在3种划分方法中的垂直分布模态
Fig. 4Altitudinal distribution mode of three land cover types on north and south slopes
南单北无峰分布型。分别发生在珠峰样带与卓奥友峰样带及扇区法的南北坡中,其共同特征为森林和灌丛仅分布在南坡。在珠峰,森林和灌丛在扇区法与样带法的南坡分布差异表现为:扇区法南坡森林(海拔100~4000 m,下同)和灌丛(1700~5100 m)的分布幅度大于样带法南坡森林(1700~3100 m)和灌丛(3200~4100 m)的分布幅度,峰值区略有差异。马卡鲁峰样带的森林分布属该类型。
单峰分布型。在单峰型分布模式中,有些类型的南坡分布峰值明显低于北坡,如冰川雪被在扇区法和样带法的珠峰南坡分布高程中分别低于北坡700 m和800 m。有些类型分布模式有南宽北窄的特点,如珠峰样带的草地、扇区法的农田和稀疏植被、脊线法的森林、灌丛和农田等;脊线法分布的沼泽湿地等也属本类型。在脊线法中,分布于高海拔的草地、稀疏植被和冰川雪被类型,由于多个独立高山多坡向成分的加入,几乎抵消山地南北坡分布的差异,故这几个类型分布的南北差异不明显。
南单北双峰分布型。属单双峰复合分布型的一种,在3种南北坡划分中,裸地峰值区在南北坡向上出现的位置各异。在珠峰样带南北坡中,稀疏植被、沼泽湿地和农田类型均为本分布模式。
南双北单峰分布型。是单双峰复合分布型的一种,如扇区法和脊线法分布的居民建设用地,珠峰样带南北坡和脊线法分布的水体(河流与湖泊)等。
南双北双峰分布型。扇区法分布的水体(河流与湖泊)属于本分布型,南坡水体分布的两个峰值分别出现在海拔200~300 m带(占比31%,下同)和海拔4900~5000 m(4.9%),北坡的两个峰值分别出现在4300~4400 m带(38.2%)和5200~5300 m(10.6%),高海拔区域的水体以冰湖为主。
就单一土地覆被(一级)类型在南北坡分布与构成特点而言,除森林主要分布在南坡外,其他土地覆被类型在南坡垂直分布幅度均宽于北坡,而分布高程与核心分布带均低于北坡(图4、表3)。各类型在分布顺序和具体组成上也有明显不同。在南坡,由低至高海拔,各土地覆被类型的分布范围与核心分布带分别为:农田(分布在海拔100~4000 m,核心分布带在海拔500~2200 m,下同)、森林(100~4000 m, 500~3100 m)、灌丛(300~5100 m, 3300~4600 m)、草地(1400~5900 m, 4100~5100 m)、稀疏植被(3000~5300 m, 4100~5300 m)、裸地(> 3000 m, 4300~5900 m)、冰川雪被(> 4100 m, 4700~6000 m);此外,沿山谷分布有水体(100~5400 m, 100~5400 m)、沼泽湿地(100~5200 m, 100~1400 m)、建设用地(400~2400 m, 1000~1600 m)(表3)。在北坡,从低至高海拔,各类型的分布范围与核心分布带依次为:农田(4000~4600 m, 4000~4500 m)、灌丛(4300~5300 m, 4500~5000 m)、草地(3900~5100 m, 4200~5000 m)、稀疏植被(4600~5400 m, 5000~5400 m)、裸地(> 4200 m, 5000~5900 m)、冰川雪被(> 4300 m, 5200~6700 m);而水体(4200~6100 m, 4200~5000 m)、沼泽湿地(3900~5500 m, 4000~4500 m)和建设用地(4200~4400 m, 4300~4400 m)等沿山谷依次分布。
Tab. 3
表3
表3南、北坡土地覆被类型垂直分布范围(m)
Tab. 3
| 类型 | 划分方法 | 南坡 | 北坡 | ||||||||||||||
|---|---|---|---|---|---|---|---|---|---|---|---|---|---|---|---|---|---|
| 海拔范围 | 核心分布带 | 优势带 | 海拔范围 | 核心分布带 | 优势带 | ||||||||||||
| 农田 | 扇区法 | 100~4000 | 600~1700 | 100~1800 | 4000~4500 | 4100~4500 | - | ||||||||||
| 样带法—MQ样带 | 100~4000 | 1100~2200 | 1000~1700 | 4200~4600 | 4200~4500 | - | |||||||||||
| 样带法—MM样带 | 100~4000 | 700~1500 | - | 3900~4500 | 4300~4500 | - | |||||||||||
| 样带法—MC样带 | 200~4000 | 500~1400 | 200~1400 | 4200~4500 | 4400~4500 | - | |||||||||||
| 脊线法 | 96~4300 | 700~1700 | 100~1500 | 2300~4500 | 4100~4500 | - | |||||||||||
| 森林 | 扇区法 | 100~4000 | 500~2000 | 1800~3600 | - | - | - | ||||||||||
| 样带法—MQ样带 | 100~4000 | 1700~3100 | 100~1000 1700~3900 | - | - | - | |||||||||||
| 样带法—MM样带 | 100~4000 | 600~1900 | 100~3700 | - | - | - | |||||||||||
| 样带法—MC样带 | 200~4000 | 700~2200 | 1400~3800 | - | - | - | |||||||||||
| 脊线法 | 100~4000 | 1100~2600 | 1500~3800 | 2100~4000 | 3200~4000 | 2300~3900 | |||||||||||
| 灌丛 | 扇区法 | 1700~5100 | 3300~4200 | 3600~4000 | - | - | - | ||||||||||
| 样带法—MQ样带 | 1700~5000 | 3200~4200 | 3900~4100 | - | - | - | |||||||||||
| 样带法—MM样带 | 1600~5000 | 3700~4200 | 3700~4200 | 4300~5300 | 4500~5000 | - | |||||||||||
| 样带法—MC样带 | 1600~5100 | 3500~4300 | 3800~4000 | - | - | - | |||||||||||
| 脊线法 | 300~4800 | 3400~4600 | 3800~4200 | 2400~4800 | 4200~4800 | 3900~4100 | |||||||||||
| 草地 | 扇区法 | 1600~5900 | 4100~5100 | 4000~5000 | 4000~5100 | 4500~5000 | 4000~5100 | ||||||||||
| 样带法—MQ样带 | 3000~5100 | 4600~5100 | - | 4200~5100 | 4400~4900 | 4200~5100 | |||||||||||
| 样带法—MM样带 | 1500~5100 | 4100~5000 | - | 3900~5100 | 4400~5000 | 4000~5100 | |||||||||||
| 样带法—MC样带 | 2500~5100 | 4300~5000 | 4000~5000 | 4200~5100 | 4300~4700 | 4400~5000 | |||||||||||
| 脊线法 | 1400~5100 | 4400~5000 | 4400~5000 | 2500~5100 | 4400~5000 | 4100~5100 | |||||||||||
| 稀疏植被 | 扇区法 | 3000~5300 | 4400~5300 | - | 4600~5400 | 5000~5400 | 5100~5400 | ||||||||||
| 样带法—MQ样带 | 3000~5300 | 4500~5300 | - | 4700~5300 | 5000~5300 | 5100~5300 | |||||||||||
| 样带法—MM样带 | 3300~5300 | 4100~4800 | - | 4700~5300 | 5200~5300 | 5100~5300 | |||||||||||
| 样带法—MC样带 | 3100~5300 | 4500~5200 | - | 4700~5300 | 5200~5300 | 5200~5300 | |||||||||||
| 脊线法 | 2100~5300 | 4600~5300 | - | 4000~5400 | 5000~5400 | 5100~5400 | |||||||||||
| 水体 | 扇区法 | 100~2500 4200~5300 | 100~500 | - | 4200-4500 5000~5800 | 4200~4400 | - | ||||||||||
| 样带法—MQ样带 | 100~800 1400-2200 4600~5400 | 4900~5400 | - | 4200~4400 5700~6100 | 4200~4300 | - | |||||||||||
| 样带法—MM样带 | 100~900 3700~5300 | 100~500 | - | 4200~5300 | 4200~4300 4800~5000 | - | |||||||||||
| 样带法—MC样带 | 200~1800 4200~5300 | 200~700 | - | 4200~4400 5500~5800 | 4300~4400 | - | |||||||||||
| 脊线法 | 96~2900 3700~5300 | 200~700 4900~5300 | - | 2200~5300 | 4100~4600 | - | |||||||||||
| 建设用地 | 扇区法 | 1000~1700 | 1100~1300 1500~1600 | - | 4200~4400 | 4300~4400 | - | ||||||||||
| 样带法—MQ样带 | - | - | - | - | - | - | |||||||||||
| 样带法—MM样带 | 1500~1700 | 1500~1600 | - | 4200~4400 | 4300~4400 | - | |||||||||||
| 样带法—MC样带 | - | - | - | - | - | - | |||||||||||
| 脊线法 | 400~2400 | 1000~1600 | - | 4200~4400 | 4200~4400 | - | |||||||||||
| 裸地 | 扇区法 | > 3000 | 4800~5900 | 5000~5700 | > 4200 | 5100~5600 | 5400~6000 | ||||||||||
| 样带法MQ样带 | > 3000 | 5000~5900 | 4100~5500 | > 4200 | 5000~5900 | 5300~6100 | |||||||||||
| 样带法MM样带 | > 3400 | 4300~5200 | 4200~5100 | > 4300 | 5100~5700 | 5300~5900 | |||||||||||
| 样带法MC样带 | > 3100 | 5000~5500 | 5000~5900 | > 4300 | 5000~5800 | 5000~5200 5300~6100 | |||||||||||
| 脊线法 | > 1100 | 4700~5700 | 4200~4400 5000~5700 | > 3000 | 5000~5700 | 5400~6000 | |||||||||||
| 沼泽湿地 | 扇区法 | < 2800 | 100~500 | - | 4000~5000 | 4200~4500 | - | ||||||||||
| 样带法MQ样带 | < 4900 | 100~1000 | - | 4200~5200 | 4200~4500 | - | |||||||||||
| 样带法MM样带 | 100~4500 | 400~1100 | - | 3900~5300 | 4000~4400 | 3900~4000 | |||||||||||
| 样带法MC样带 | < 5200 | 200~1400 | - | < 5500 | 4300~4400 | - | |||||||||||
| 脊线法 | < 5100 | 200~1400 | - | 3500~5300 | 4100~4400 | - | |||||||||||
| 冰川雪被 | 扇区法 | > 4400 | 5200~5900 | > 5700 | > 5100 | 6000~6600 | > 6000 | ||||||||||
| 样带法MQ样带 | > 4800 | 5100~5800 | > 5500 | > 5400 | 6000~6700 | > 6100 | |||||||||||
| 样带法MM样带 | > 4100 | 5000~6000 | > 5100 | > 4300 | 5200~6300 | > 5900 | |||||||||||
| 样带法MC样带 | > 4600 | 4700~5700 | > 5900 | > 5400 | 6000~6600 | > 6100 | |||||||||||
| 脊线法 | > 4000 | 5100~5900 | > 5700 | > 3800 | 5400~6300 | > 6000 | |||||||||||
新窗口打开|下载CSV
3.3 垂直分布特征与喜马拉雅山中部“南六北四式”土地覆被垂直带谱
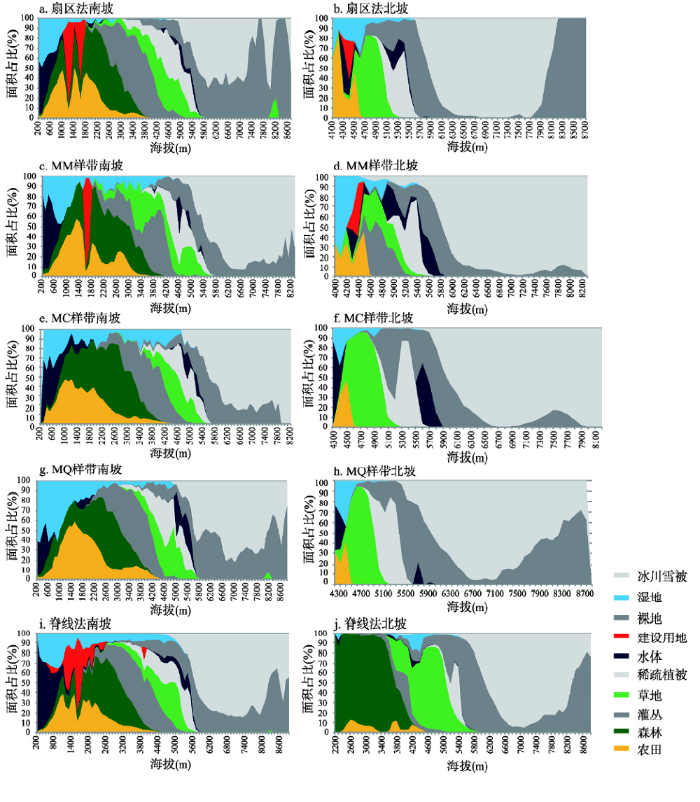
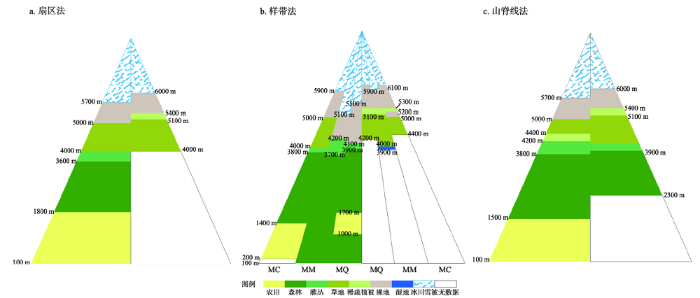
南坡土地覆被类型垂直分布幅度宽且带谱完整,北坡以极高海拔类型为主且分布幅度窄、结构简单(图5),南、北坡的垂直带结构组合不同,具有明显的山地垂直带性分异特点。而体现人类活动特点的建设用地与农田从低海拔至高海拔多沿山(河)谷分布,在低中海拔区建设用地和农田常与森林和灌丛交错分布,这种包含人类活动特点的垂直带谱恰是该地区土地覆被垂直带谱的特征之一。从图5可见南北坡各土地覆被类型的分布与组合特点。在南坡,森林、灌丛、草地、稀疏植被、裸地、冰川雪被等类型呈带状分布,而农田、建设用地、湿地、水域等从低至高海拔均有分布(图5);3种南北坡划分方法,都一定程度地展示了这个类型组成特点,仅是其分布的海拔高程及面积不同。在北坡:农田、草地、稀疏植被、裸地、冰川雪被等类型呈带状分布,农田和建设用地在北坡海拔4400 m以下山谷分布,湿地与水域相伴或分布在冰雪边缘区域。图5
 新窗口打开|下载原图ZIP|生成PPT
图5扇区法、样带法和脊线法土地覆被分布及其在各高程带构成
Fig. 5Land cover distribution and its composition of area ratio of each elevation zone on northern and southern slope
实际上,从低海拔至高海拔的每个高程带上,土地覆被类型构成由复杂至简单,即由南坡的3或4类至1类、或北坡的2或3类至1类(图5)。与海拔变化相应,某些高程带的土地覆被类型构成会发生相应变化,这显示了生态系统适应环境或受人类影响的综合结果。
为清晰阐释和模式化分析山地土地覆被垂直带结构特点,本文基于一级土地覆被类型在坡面上分布的优势带范围(表3),构建了山地土地覆被垂直带结构图(图6)。结果显示,喜马拉雅山中部珠峰地区土地覆被垂直带谱为南六北四(五)垂直结构模式(图6a、图6b)。南六包括:农田、森林、灌丛、草地、裸地和冰川雪被;北四(五)包括:草地、稀疏植被、裸地、冰川雪被(湿地)。这种结构反映了土地覆被与珠峰垂直自然带和植被垂直带结构的内在联系,同时南坡的农田或农田—森林复合带(图6b)也反映了人类活动的基本特征。
图6
 新窗口打开|下载原图ZIP|生成PPT
图63种南北坡划分方法的土地覆被优势垂直带结构示意图
注:左为南坡,右为北坡。
Fig. 6Dominant altitudinal band structure of land cover on south and north slopes based on different division methods in the Koshi basin
4 讨论
4.1 土地覆被垂直分布与气候带类型和土壤带类型分布的关系
珠峰地区巨大的地势差异使得水热组合状况随海拔升降而发生变化,区域的气候、土壤及生态系统的垂向变化明显,成为自然带垂直分异的基础。珠峰南北坡气候和土壤垂直构成迥异[21](表4);仅以土地覆被优势带的垂直分布与气候和土壤带类型垂直分布的比较结果而论,珠峰南北坡各自形成了独特的土地覆被垂直组合系列,反映了主要土地覆被类型适应特殊环境的特点。同时,部分土地覆被类型优势带分布的上下限与气候和土壤带类型分布略有差异,这可能是由于形成三者的研究样区、样带和样点位置、研究方法以及数据时空尺度不同等所致。Tab. 4
表4
表4珠穆朗玛峰南北坡土地覆被与气候和土壤带类型垂直分布关系
Tab. 4
| 珠峰气候垂直带a | 珠峰土壤垂直带a | 珠峰(扇区法)土地覆被优势带b | ||||||
|---|---|---|---|---|---|---|---|---|
| 海拔(m) | 垂直气候带类型 | 海拔(m) | 垂直土壤带类型 | 优势带 | 土地覆被类型 | |||
| 南坡 | 1600~2500 | 山地亚热带 | 1600~2500 | 山地黄棕壤 | 100~1800 | 农田 | ||
| 2500~3100 | 山地暖温带 | 2400~3100 | 山地酸性棕壤 | 1800~3600 | 森林 | |||
| 3100~3900 | 山地寒温带 | 3100~4100 | 山地漂灰土 | 3600~4000 | 灌丛 | |||
| 3900~4700 | 亚高山寒带 | 4100~4500 | 亚高山灌丛草甸土 | |||||
| 4100~4500 | 亚高山草甸土 | 4000~5000 | 草地 | |||||
| 4500~4800 | 高山草甸土 | |||||||
| 4700~5500 | 高山寒冻带 | 4800~5600 | 高山寒漠土 | 5000~5700 | 裸地 | |||
| > 5500 | 高山冰雪带 | > 5600 | 冰和雪 | > 5700 | 冰川雪被 | |||
| 北坡 | 4000~5000 | 高原寒冷带 | 4400~4700 | 亚高山草原土 | 4000~5100 | 草地 | ||
| 5000~6000 | 高山寒冻带 | 4700~5200 | 高山草甸草原土 | 5100~5400 | 稀疏植被 | |||
| 5200~5500 | 高山寒漠土 | 5400~6000 | 裸地 | |||||
| > 6000 | 高山冰雪带 | > 5500 | 冰和雪 | > 6000 | 冰川雪被 | |||
新窗口打开|下载CSV
4.2 珠峰土地覆被与植被垂直分布比较
将扇区法优势带构成的珠峰土地覆被垂直带结构图与珠峰植被垂直带结构图[22]进行对比可以发现(表5),除农田外,两者在南北坡分布组成和结构的主要特征一致。如南坡由低至高海拔依次分布着森林、灌丛、草地、稀疏植被、裸地和冰川雪被,北坡依次为草地、稀疏植被、裸地和冰川雪被。二者在(一级)大类型上基本一致,仅分布幅度上存在差异。Tab. 5
表5
表5珠穆朗玛峰土地覆被与植被垂直分布比较
Tab. 5
| 珠峰(扇区法)土地覆被类型垂直分布a | 珠峰植被垂直分带b | |||||||||||||
|---|---|---|---|---|---|---|---|---|---|---|---|---|---|---|
| 分布范围 (m) | 核心分布 (m) | 优势带 (m) | 土地覆被类型 及构成信息 | 分布范围 (m) | 植被类型及组成 | |||||||||
| 南坡 | 100~4000 | 600~1700 | 100~1800 | 农田 < 1000 m,农田—常绿阔叶林交错分布。 1400~1800 m,农田—常绿落叶阔叶混交林交错分布。 农作物主要有水稻、玉米、小麦、黍类、土豆。 | < 1000(1200) | 季雨林带 娑罗双树季雨林带的上限一般在海拔1000 m左右,局部达1200 m。 | ||||||||
| 1000~2500 | 常绿阔叶林带 通常海拔2000 m以下以印栲、木荷为主,2000 m以上中国境内被铁椆、粗穗石柯替代,尼泊尔境内被L.spicata为主的山地常绿阔叶林替代。 | |||||||||||||
| 100~4000 | 500~2000 | 1800~3600 | 森林 常绿落叶阔叶混交林 | |||||||||||
| 2500~3000 (3100) | 山地针叶阔叶(常绿、落叶)混交林带 局部上限达海拔3100m,是整个南坡植被垂直带谱中幅度较窄的一个带。主要由铁杉和高山栎的纯林或混交林组成。 | |||||||||||||
| 3000~3800 (4100) | 亚高山针叶林带 主要由冷杉林构成。阴坡分布冷杉林和糙皮桦林,阳坡高山栎林、还有桧柏梳林和灌丛。 | |||||||||||||
| 1700~5100 | 3300~4200 | 3600~4000 | 灌丛 优势种以钟花杜鹃、高山柏和刚毛杜鹃等为主。 | 3800(4100)~4500 | 高山灌丛 南坡以扁芒草禾草草甸和桧柏灌丛为主。北坡以杜鹃为主的小叶矮灌丛。 | |||||||||
| 1600~5900 | 4100~5100 | 4000~5000 | 草地 伴有撂荒地。 | 4500~5200 | 高山草甸 冰草苔原和多种垫状植物、杂草类的高山草甸。 | |||||||||
| 3000~5300 | 4400~5300 | 稀疏植被 | ||||||||||||
| > 3000 | 4800~5900 | 5000~5700 | 裸地 | 5200~5500 (5600) | 地衣砾石带 地面覆盖砾石、冰碛物,表面生有地图黄绿衣、粗糙碟衣、鸡皮衣、裂叶石耳、红橙衣、菊叶梅衣印等。 | |||||||||
| > 4400 | 5200~5900 | > 5700 | 冰川雪被 | > 5500(5600) | 永久冰雪带 | |||||||||
| 100~2500 4200~5300 | 100~500 | 水体 河流与湖泊 | ||||||||||||
| < 2800 | 100~500 | 沼泽湿地 | ||||||||||||
| 1000~1700 | 1100~1300 1500~1600 | 建设用地 | ||||||||||||
| 北坡 | 4000~4500 | 4100~4500 | 4000~5100 | 草地 以高寒草地分布为主,在河谷中分布农田。 | 3900~4400 | 草原带 以白草、固砂草草原为主。 | ||||||||
| 4000~5100 | 4500~5000 | 草地 高寒草原,以藏沙蒿,藏白蒿,细裂叶莲蒿,固沙草等为主。 | 4400~5000 | 高山草原带 以紫花针茅草原为主。 | ||||||||||
| 北坡 | 4600~5400 | 5000~5400 | 5100~5400 | 稀疏植被 主要植物为垫状点地梅,山地蚤缀,绢毛棘豆。 | 5000~5700 | 高山草甸与稀疏垫状植被带 分布冰川苔原、嵩草草甸,并且杂有多种垫状植物。 | ||||||||
| > 4200 | 5100-5600 | 5400~6000 | 裸地 | |||||||||||
| 5700~5800 (6200) | 地衣、砾石带 | |||||||||||||
| > 5100 | 6000~6600 | > 6000 | 冰川雪被 | >5800~6200 | 永久冰雪带 | |||||||||
| 4200~4500 5000~5800 | 4200~4400 | 水体 河流与湖泊 | ||||||||||||
| 4000~5000 | 4200~4500 | 沼泽湿地 | ||||||||||||
| 4200~4400 | 4300~4400 | 建设用地 | ||||||||||||
新窗口打开|下载CSV
与植被垂直带结构不同,土地覆被的类型构成与分布具有自己的特点,因其基于高分辨率的遥感影像数据和高精度的空间解译,识别出了人类土地开发活动的直接结果,包括农田和居民用地的分布及相应的对山地森林、灌丛和草地的利用;表现在分布格局上,南坡海拔1800 m以下区域形成了伴有农田优势带的农林相间分布,北坡农田和居民用地则在海拔4400 m以下分布为主。同时,也识别出河流湖泊及湿地等类型。
将本文结果与1959—1968年间的植被垂直带结构进行比较发现,珠峰地区植被垂直带的结构特征未发生实质改变,但高海拔区域地衣砾石带(土地覆被类型的裸地)因气温增高和人类活动、低海拔区森林因人类活动影响而出现局部变化:砾石区分布范围显著增大(向下拓展主要来自放牧引起的草地退化后所致[19],而向上发展更多的是高海拔冰川退缩形成的新的裸地区域[23]),森林分布范围减小与农田和居民用地分布增大有关。这些变化影响着高山总体生态系统服务功能,凸显出在珠峰地区中尼两国共同面临生态与环境保护的问题和挑战。比较而言,土地覆被垂直带研究可以更系统地反映人类活动对土地系统和植被影响的格局和过程。
5 结论
基于土地覆被和DEM等多源数据,采用3种山地南北坡向划分方法,从垂直带视角,对喜马拉雅中段土地覆被垂直带结构、组成、类型和分布特征进行研究,结果表明:(1)喜马拉雅中部土地覆被主体垂直结构与自然垂直带谱的结构基本一致,具有明确的垂直地带性结构特点。同时,土地覆被垂直带谱中反映了人类活动的特征。喜马拉雅中部土地覆被垂直带谱为南六北四式。
(2)南北坡土地覆被类型构成差异显著,南坡土地覆被类型多样、分布幅度宽,北坡类型简单且以高海拔类型为主、分布幅度窄。从低至高海拔,南坡土地覆被由森林、灌丛、草地、稀疏植被、裸地、冰川雪被等类型呈带状依次分布,北坡由草地、稀疏植被、裸地、冰川雪被等类型呈带状依次分布,而水域、湿地、农田、建设用地等多沿山(河)谷分布。
(3)3种南北坡划分方法分析结果显示,南坡的土地覆被垂直带结构相似,脊线法因其南或北坡内均包含各坡向分布类型而导致其结果不确定性较大,是形成北坡分布类型差异大的主要因素。野外调查实证表明,扇区法划分结果很好地体现了山地南北坡的土地覆被自然分布格局。
(4)与40多年前植被垂直带比较,珠峰地区植被垂直带主体结构特征未发生实质改变。变化主要表现在:裸地向上向下拓展,分布幅度显著增大;南坡低海拔地区森林转换为农田和居民用地的面积增加显著。
致谢:
王秀红、摆万奇和朱会义先生在论文撰写和修改中提出了宝贵的建议,刘林山和王兆锋等在研究分析中给予支持和帮助,特此感谢。参考文献 原文顺序
文献年度倒序
文中引用次数倒序
被引期刊影响因子
[本文引用: 1]
DOI:10.1038/nclimate1294URL [本文引用: 1]
DOI:10.1002/2013GL058085URL [本文引用: 1]
[本文引用: 1]
[本文引用: 2]
DOI:10.1111/jec.2004.92.issue-2URL [本文引用: 1]
[本文引用: 1]
DOI:10.1007/s004420050293URL [本文引用: 1]
[本文引用: 1]
[本文引用: 1]
[本文引用: 1]
DOI:10.1023/A:1024458411589URL [本文引用: 1]
DOI:10.1038/416389aURL [本文引用: 1]
[本文引用: 1]
[本文引用: 1]
[本文引用: 1]
DOI:10.11821/dlxb201503005URL [本文引用: 1]

The immense and towering Tibetan Plateau (TP) acts as a heating source and shapes the climate of both the Eurasian continent and the entire world. The heating effect of the TP was first noticed by meteorological scientists in the 1950s due to the important implications of the plateau for Asian climate. Most researches focused on its role as the heat source in summer and its implications for Asian climate, but little has been done on the quantitative information about the heating effect of the plateau and its implications for the position of mountain altitudinal belts (MABs). Using estimated air temperature data, observed meteorological data, MAB / treeline data and ASTER GDEM data, this paper compares the position / height of MABs and alpine treelines between the main TP and the surrounding mountains / lowland and explains the spatial pattern of MAB / treeline of TP from the point of view of the heating effect. The results demonstrate the following important characteristics. (1) Due to the heating effect of TP, the air temperatures and the length of growing season gradually increase from the eastern edge to the interior main TP. The monthly mean air temperature in the interior main plateau is approximately 2-7 ℃ higher than that in the surrounding mountains and adjacent lowland areas. At an elevation of 4500 m (corresponding to the mean altitude of the TP), the monthly mean temperature differences between the plateau and the Sichuan Basin range from 3.58 °C (April) to 6.63 °C (June); the height of the 10°C isotherm of the warmest month goes upward from the edge to the interior of the plateau, which is 4000 m in the Qilian Mts. and its eastern edges, while uplifts to 4600-5000 m are observed along the belt of Lhasa- Zuogong; the warmth index at the altitude of 4500 m in the interior main TP can reach 15°C / month, but it is lower than 15°C / month on the eastern edges and the northern parts of the TP. (2) In terms of air temperatures, the height of the 10°C isotherm of the warmest month and the warmth index gradually increase from the easternmost to the interior of the main plateau; MABs and treeline follow a similar trend rising inwards, the dark-coniferous forest is distributed at an altitude of 1000-1500m higher in the interior main plateau than on the eastern edges, and the alpine steppe belts are about 700-900 m higher in the interior main plateau than on the eastern edges.
DOI:10.11821/dlxb201503005URL [本文引用: 1]
The immense and towering Tibetan Plateau (TP) acts as a heating source and shapes the climate of both the Eurasian continent and the entire world. The heating effect of the TP was first noticed by meteorological scientists in the 1950s due to the important implications of the plateau for Asian climate. Most researches focused on its role as the heat source in summer and its implications for Asian climate, but little has been done on the quantitative information about the heating effect of the plateau and its implications for the position of mountain altitudinal belts (MABs). Using estimated air temperature data, observed meteorological data, MAB / treeline data and ASTER GDEM data, this paper compares the position / height of MABs and alpine treelines between the main TP and the surrounding mountains / lowland and explains the spatial pattern of MAB / treeline of TP from the point of view of the heating effect. The results demonstrate the following important characteristics. (1) Due to the heating effect of TP, the air temperatures and the length of growing season gradually increase from the eastern edge to the interior main TP. The monthly mean air temperature in the interior main plateau is approximately 2-7 ℃ higher than that in the surrounding mountains and adjacent lowland areas. At an elevation of 4500 m (corresponding to the mean altitude of the TP), the monthly mean temperature differences between the plateau and the Sichuan Basin range from 3.58 °C (April) to 6.63 °C (June); the height of the 10°C isotherm of the warmest month goes upward from the edge to the interior of the plateau, which is 4000 m in the Qilian Mts. and its eastern edges, while uplifts to 4600-5000 m are observed along the belt of Lhasa- Zuogong; the warmth index at the altitude of 4500 m in the interior main TP can reach 15°C / month, but it is lower than 15°C / month on the eastern edges and the northern parts of the TP. (2) In terms of air temperatures, the height of the 10°C isotherm of the warmest month and the warmth index gradually increase from the easternmost to the interior of the main plateau; MABs and treeline follow a similar trend rising inwards, the dark-coniferous forest is distributed at an altitude of 1000-1500m higher in the interior main plateau than on the eastern edges, and the alpine steppe belts are about 700-900 m higher in the interior main plateau than on the eastern edges.
DOI:10.1016/j.scib.2017.04.025URL [本文引用: 1]
[本文引用: 1]
[本文引用: 1]
[本文引用: 1]
DOI:10.1016/j.gloplacha.2013.06.012URL [本文引用: 3]
Considerable researches during the past several decades have focused on monitoring changes in vegetation growth due to its important role in regulating the terrestrial carbon cycle and the climate system. In this study, we combined datasets of the satellite-derived Normalized Difference Vegetation Index (NDVI) and climatic factors to analyze spatio-temporal patterns of vegetation growth in 1982-2006 in the Koshi River Basin (KRB) in the middle Himalayas. In addition, the dataset from the global land surface satellite sensor from SPOT-4's Vegetation instrument in 1998-2011 was used to further verify the results of this study. At the regional scale, although a statistically significant increase in average growing season NDVI was observed (0.0008 yr(-1), P = 0.03) during the entire study period, there existed three distinct periods with opposing trends. Growing season NDVI significantly increased in 1982-1994 (0.0019 yr(-1), P = 0.03), and then decreased in 1994-2000 (-0.0058 yr(-1), P < 0.001), while increased again in 2000-2006 (0.0049 yr(-1), P < 0.001) and in 2000-2011 (0.0034 yr(-1), P < 0.001). A sudden drop in NDVI in 1994-2000 largely contributed to these fluctuations in growing season NDVI over the KRB. Spring, summer and autumn NDVI significantly decreased in 1994-2000 (-0.0077 yr(-1), P < 0.001; -0.0067 yr(-1), P < 0.001; and -0.0155 yr(-1), P < 0.001; respectively). Our further spatial analyses supported the existence of the sudden decrease in spring, summer and autumn NDVI in 1994-2000. (C) 2013 Elsevier B.V.
DOI:10.5814/j.issn.1674-764x.2017.01.003URL [本文引用: 3]
The Koshi River Basin is in the middle of the Himalayas, a tributary of the Ganges River and a very important cross-border watershed. Across the basin there are large changes in altitude, habitat complexity, ecosystem integrity, land cover diversity and regional difference and this area is sensitive to global climate change. Based on Landsat TM images, vegetation mapping, field investigations and 3S technology, we compiled high-precision land cover data for the Koshi River Basin and analyzed current land cover characteristics. We found that from source to downstream, land cover in the Koshi River Basin in 2010 was composed of water body (glacier), bare land, sparse vegetation, grassland, wetland, shrubland, forest, cropland, water body (river or lake) and built-up areas. Among them, grassland, forest, bare land and cropland are the main types, accounting for 25.83%, 21.19%, 19.31% and 15.09% of the basin’s area respectively. The composition and structure of the Koshi River Basin land cover types are different between southern and northern slopes. The north slope is dominated by grassland, bare land and glacier; forest, bare land and glacier are mainly found on northern slopes. Northern slopes contain nearly seven times more grassland than southern slopes; while 97.13% of forest is located on southern slopes. Grassland area on northern slope is 6.67 times than on southern slope. The vertical distribution of major land cover types has obvious zonal characteristics. Land cover types from low to high altitudes are cropland, forest, Shrubland and mixed cropland, grassland, sparse vegetation, bare land and water bodies. These results provide a scientific basis for the study of land use and cover change in a critical region and will inform ecosystem protection, sustainability and management in this and other alpine transboundary basins.
[本文引用: 2]
[本文引用: 2]
[本文引用: 3]
[本文引用: 3]
DOI:10.11821/xb201001003URL [本文引用: 1]
Based on Landsat TM(/MSS) images in 1976,1988 and 2006,glacier extents in the three periods in the Mt.Qomolangma National Nature Preserve(QNNP) have been automatically derived by object-oriented image interpretation method combined with expert knowledge rules and field surveys.Spatial-temporal distribution and changes of glaciers are analyzed with the aid of GIS,RS and Tupu method.Results show that(1) The glacial area at QNNP in 2006,located mainly in the southern high mountain region with elevations of 4700-6800 m,amounted to 2710.17±0.011 km2,about 7.41% of the whole study area;(2) During 1976-2006,glaciers tended to shrink significantly by 501.91±0.035 km2 in total,and glacial lakes expanded rapidly with an increase of 36.88±0.035 km2;the rate of glacier retreat is higher in sub-basins on the southern slope(16.79%) of Himalayas than those on the northern slope(14.40%);(3) Most glaciers retreated,mainly occurred at elevations of 4700-6400 m,and the estimated upper limit of retreated zone is between 6600 m and 6700 m;(4) The temperature rise along with precipitation decrease is considered to be the key factor of glacier retreat in the region.
