The spatial pattern of grassland aboveground biomass and its environmental controls in the Eurasian steppe
JIAOCuicui收稿日期:2015-11-12
修回日期:2016-01-25
网络出版日期:2016-05-25
版权声明:2016《地理学报》编辑部本文是开放获取期刊文献,在以下情况下可以自由使用:学术研究、学术交流、科研教学等,但不允许用于商业目的.
基金资助:
作者简介:
-->
展开
摘要
关键词:
Abstract
Keywords:
-->0
PDF (6043KB)元数据多维度评价相关文章收藏文章
本文引用格式导出EndNoteRisBibtex收藏本文-->
1 引言
自工业革命以来,由于人类活动的影响,大气中的CO2浓度逐渐上升,全球不断暖化[1]。全球碳循环和碳收支格局的研究已经成为环境和生态学科中关注的焦点问题[2-4]。植被生物量作为陆地生态系统碳库的重要组成部分[5],是全球碳循环研究的重要内容[6-9]。草地是地球上广泛分布的生态系统之一,约占陆地表面的20%,碳储量约占陆地生态系统的10%[10],年均碳汇值约为0.5 Pg C,在全球碳循环和气候调节中起着重要的作用[11-13]。因此,探讨草地生物量的空间格局及其与环境因子的关系是理解全球碳循环、合理保护草地资源的基础。全球的温带草地生态系统主要有分布于北美洲的普列里(Prairie)、拉丁美洲的潘珀斯(Pampas)、非洲南部的维尔德(Veld)和欧亚大陆的斯太普(Steppe)。其中,欧亚大陆的斯太普草原(以下称“欧亚大陆草原”)位于北半球中纬度地区,是世界上面积最大的草原区,是全球草地生态系统的重要组成部分[14]。欧亚大陆草原西起欧洲多瑙河下游,呈连续的带状或宽或窄地往东延伸,经罗马尼亚、俄罗斯、蒙古,东至中国的松辽平原,西南止于喜马拉雅山脉,东西绵延近110个经度[15]。
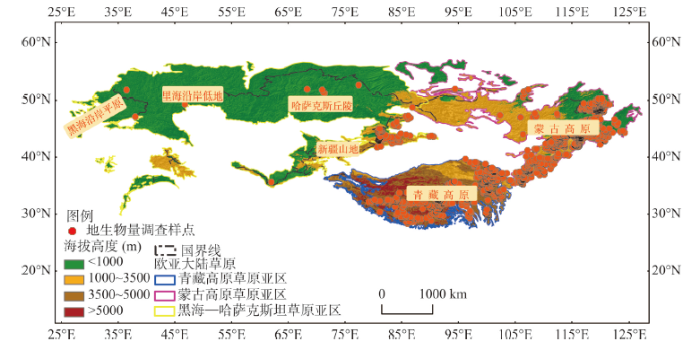
欧亚大陆草原在地域大致可划分为黑海——哈萨克斯坦草原亚区、蒙古高原草原亚区和青藏高原草原亚区[16-20]。年总降水量250~750 mm,年平均温度-10~10℃,每年有一个旱季。草原区域的东、西及中部地区处于不同的气候条件下,在哈萨克斯坦以西地区受地中海气候影响,表现为夏季干旱,在亚洲东部地区受东亚季风的影响,表现为春季干旱,在草原区域的中部,由于远离海洋,常年受副热带高气压的控制,则属于干旱、半干旱气候(图1)。
 显示原图|下载原图ZIP|生成PPT
图1欧亚大陆草原的空间范围和地上生物量调查点的空间分布
-->Fig. 1The spatial distribution of the Eurasian steppe and aboveground biomass field sites
-->
草原地上生物量(aboveground biomass, AGB)的空间格局可以概括为沿着经纬度变化的水平地带性规律和随着海拔高度变化的垂直地带性规律。关于欧亚大陆草原地域内的青藏高原和内蒙古高原已有一些研究工作,可是因研究对象区域的不同,这些研究总结出来的空间分布规律差异很大[21-23]。例如,Ma等[21]的研究表明,内蒙古温带草原AGB的空间格局呈现为自“西南向东北方向逐渐增加”的水平地带性规律;Yang等[22]的研究表明,青藏高原高原面上的高寒草地AGB呈现出“自西北向东南方向逐渐增加”的变化趋势;Wang等[23]在念青唐古拉山脉北坡的研究(海拔高度4390~5330 m)得出,AGB随着海拔的升高呈现为单峰型曲线的空间分布规律。
草地AGB的空间分异主要受到年总降水量(MAP)、年平均温度(MAT)和土壤因素格局的影响。通常情况下,草地AGB与MAP空间分异呈现为显著正相关关系[24-27],但是这种关系的函数表现形式却在不同研究结果之间存在差异。例如,Bai[24]等在中国内蒙古温带草原的研究,Yang等[22, 26]和Jiang等[28]在中国青藏高原高寒草地的研究,安尼瓦尔·买买提等[29]在中国新疆地区草地的研究都表明:AGB与MAP的空间分布呈现为简单的线性正相关关系;而Hu等[30-31]、Ma等[21]和Guo等[32]在中国内蒙古温带草原的研究则表明,AGB与MAP的空间分布呈指数正相关关系。
年平均温度对AGB空间分布的影响更加复杂,因研究对象的空间尺度,研究者采用的数据及数据分析方法等方面的差异,所得到的结论差异较大。例如Yang等[22, 26]对青藏高原高寒草地的研究表明,AGB的空间格局与MAT没有显著的相关性,而Jiang等[28]的研究则表明,高寒草原AGB的空间格局与MAT呈显著的正相关关系,高寒草甸、荒漠草原AGB的空间格局与MAT的相关性不显著。Ma等[21]和Gao等[27]对内蒙古温带草地的研究表明,AGB的空间格局与MAT呈显著的负相关关系。质地和养分等土壤因素对AGB的影响则相对较弱,一般认为这些土壤因素可以通过与MAP的交互作用影响AGB的空间格局[33-37]。
本文以欧亚大陆草原为研究对象,收集和分析该区域采用收获法实测的AGB数据,解答3个科学问题:① 欧亚大陆草原AGB空间分布的规律;② 影响欧亚大陆草原AGB空间分异的环境因素;③ 主要环境控制因素与欧亚大陆草原AGB格局的定量关系。
2 材料和方法
2.1 数据收集
(1)地上生物量数据 AGB数据均是通过样地收获法得到的实测数据。这些数据主要来自3个部分,① 通过调研已经发表的学术论文(209篇文献,具体参考文献见附件),获得的1015个调查样点生物量数据;② 从美国橡树岭国家实验室公开的全球净初级生产力数据库中,下载获得的7个调查样点生物量数据(http://www.daac.ornl.gov/NPP/npp_home.html);③ 由其他研究者提供的中国区域809个调查样点生物量数据。通过以上3种途径共计收集获得了近30年来(1980-2014年)在欧亚大陆草原区域内的1831个调查样点的AGB数据。对于获取的AGB数据,按照以下4个步骤和标准进行数据筛选:① AGB数据的调查样点必须包括经度、纬度和海拔3个的地理信息,对于文献中缺失海拔高度信息的样点,采用高精度地形网格数据库SRTM(Shuttle Radar Topography Mission)elevation database(http://srtm.csi.cgiar.org/)中的高程数据来代替[38]。② 以MODIS(Moderate resolution Image Spectroradiometer)的土地覆盖数据产品(MCD12C1)(https://lpdaac.usgs.gov/dataset_discovery /modis/modisproducts_table/mcd12c1)和中国科学院中国植被图编辑委员会[39]绘制的植被类型图为参考,剔除分布在草地生态系统与其他生态系统交界处的调查样点数据。③ 以平均值±2倍标准差为标准,剔除数值过高或者过低的生物量样点数据。④ 为了避免时间变化可能给空间格局分析造成的影响,对于有多年实测生物量数据的调查样点,取其生物量的多年平均值。按照以上标准筛选后,形成了来自1421个调查样点的AGB数据集。该数据集的调查样点分布于纬度28°N~53°N,经度36°E~125°E,海拔范围20~5600 m(图1)。(2)气候数据 在收集调查样点的AGB数据时,同时收集了调查样点的年总太阳辐射(Mean annual radiation, MAR),MAT和MAP等基本气候要素的信息,多数文献中记录的气候要素都是调查样点的多年平均气候值,对于缺失MAT和MAP信息的调查样点,用WorldClim-Global Climate Data数据集(http://www.worldclim.org)中的多年(1950-2000年)MAT和MAP来代替[40]。对于缺失MAR的调查样点,用Climate Research Unit(CRU05)的太阳辐射数据集(http://daac.ornl.gov/ISLSCPII/guidescru_monthly_ mean_xdeg.html)[41-43]中的数据代替。
(3)土壤数据 表层(0~30 cm)土壤的物理属性数据包括了砾石(Gravel)、沙粒(Sand)、粉粒(Silt)及黏粒(Clay)含量,土壤的化学属性数据包括了pH值和有机碳含量(SOC)。这些数据是来源于联合国粮食及农业组织(Food and Agriculture Organization of the United Nations, FAO)的归一化土壤数据库(Harmonized World Soil Database, HWSD v1.2)(http://webarchive.iiasa.ac.at/Research/LUC/External-World-soil-database/HTML/HWSD_Data.html?sb=4)[44]。
2.2 数据分析
欧亚大陆草原及其3个亚区的AGB与地理位置信息(纬度、经度、海拔高度)、气候要素(MAR、MAT、MAP)和表层(0~30 cm)土壤要素(Gravel、Sand、Silt、Clay、pH、SOC)之间相关关系的分析采用了一元线性和非线性回归分析方法。运用单因素方差分析法探讨了在a为0.05置信水平上,欧亚大陆草原及其3个亚区区域之间AGB的差异性。运用求算术平均的方法,统计了不同纬度(每5°N为一个间隔)、经度(每15°为一个间隔)和海拔高度(每1000 m为一个间隔)的AGB的大小。运用逐步多元回归方法分析了AGB空间变异的主要环境因素。运用多元线性和非线性回归方法,定量拟合了欧亚大陆草原及其3个亚区AGB与主要环境影响因素之间的关系。
数据分析在SPSS 20.0和R 3.1.3[45](version 3.1.3 R Development Core Team 2012)软件中实现,统计图的绘制在Sigmaplot 12.5软件中完成,研究区域生物量调查样点的空间分布图在ArcGIS 10.0软件中完成。
此外,还需要说明的是,由于本文数据集的生物量调查样点在地理空间分布不均匀,为了降低空间分布不均匀性可能给空间格局分析带来的不确定性,首先按照一定的地理空间和环境因素范围,对区域范围内的所有样点的AGB进行了算术平均,并利用该平均值分析AGB空间格局及其与环境因素的关系。计算AGB区间平均值的具体步骤为:
① 在分析AGB的空间格局时,将1个纬度(1°N)为区间间隔,计算各区间内调查样点AGB的平均值和标准差,分析AGB与纬度之间的相关关系;同样的方法被用于分析AGB与经度(1°E为区间间隔)和海拔高度(100 m为区间间隔)之间的相关关系。
② 在分析AGB空间格局与环境因素之间的关系时,分别按照MAR:100 MJ m-2a-1,MAT:1 ℃,MAP:25 mm,表层(0~30 cm)土壤因素Gravel:1% vol.,pH:0.1,SOC:0.01为各环境要素的区间间隔,分别统计AGB的平均值和标准差,分析欧亚大陆草原AGB空间变异与各环境因素之间的关系。
③ 在分析AGB与各个环境要素之间的皮尔逊系数,和定量分析AGB空间格局与主要环境影响因素之间的关系时,采用的是1.0°N×1.0°E地理格网的AGB与环境因素平均值数据集。即首先在ArcGIS 10.0软件平台上创建了覆盖研究区域的1.0°N×1.0°E的地理格网,再统计落在每个网格范围内的调查样点的AGB、以及环境要素的平均值,这样共计得到了涵盖199个格网点的数据集。
3 结果分析
3.1 地上生物量的地理格局及区域统计特征
整个欧亚大陆草原区的草地AGB变化范围为4.99~209.00 g C m-2。分别统计分析整个欧亚大陆草原及其3个亚区内调查样点的生物量得出,欧亚大陆草原、黑海——哈萨克斯坦草原亚区、蒙古高原草原亚区和青藏高原草原亚区的平均AGB分别为56.93±40.27 g C m-2,68.95±45.98 g C m-2,56.93±40.27 g C m-2和54.33±42.32 g C m-2。黑海——哈萨克斯坦草原亚区的平均AGB显著高于其他亚区(图2)。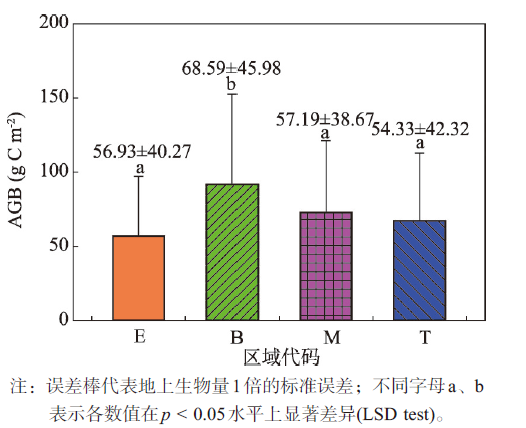 显示原图|下载原图ZIP|生成PPT
图2欧亚大陆草原地上生物量的统计特征(E:整个欧亚大陆草原区;B:黑海——哈萨克斯坦草原亚区;M:蒙古高原草原亚区;T:青藏高原草原亚区)
-->Fig. 2Statistical characteristics of AGB in the Eurasian
-->
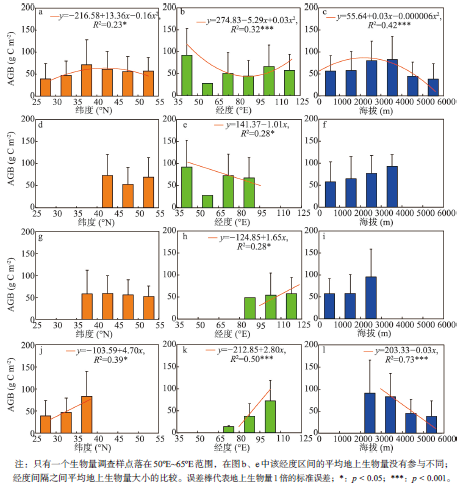
欧亚大陆草原区的草地AGB具有复杂的水平和垂直地带性分布规律。随着纬度的升高,AGB格局呈开口向下的抛物线趋势,平均AGB的最大值为71.01±56.78 g C m-2,出现在35°N~40°N纬度带(图3a)。自西向东,随经度变化,AGB格局表现为开口向上的抛物线变化趋势,平均AGB最低值为44.71±35.33 g C m-2,出现在80°E~95°E范围内(图3b)。随着海拔升高,AGB格局呈现开口向下的抛物线变化趋势,在海拔3000~4000 m范围内的平均AGB为82.95±52.33 g C m-2,高于其他海拔范围(图3c)。
 显示原图|下载原图ZIP|生成PPT
图3欧亚大陆草原地上生物量与纬度、经度和海拔高度的关系(a~c:整个欧亚大陆草原区;d~f:黑海——哈萨克斯坦草原亚区;g~i:蒙古高原草原亚区;j~l:青藏高原草原亚区)
-->Fig. 3The correlations of AGB in the Eurasian steppe to latitude, longitude and elevation
-->
欧亚大陆草原区的AGB空间格局是由区域内的三个亚区的空间格局特征叠加构成的。在黑海——哈萨克斯坦草原亚区,AGB随着自西向东的经度增加而逐渐减小,在35°E~50°E范围内的平均AGB为91.86±60.80 g C m-2,高于其他经度范围(图3e),而沿着纬度梯度和海拔梯度都没有显著的变化趋势(图3d、3f)。在蒙古高原草原亚区,AGB随着自西向东的经度增加而逐渐增大,在110°E~125°E范围内的平均AGB为57.19±38.67 g C m-2,高于其他经度范围(图3h),在纬度方向和海拔方向上都没有趋势性的变化规律(图3g、3i)。在青藏高原草原亚区,AGB随着自南向北纬度的升高以及自西向东经度的变化都呈现为逐渐增加的变化趋势(图3j、3k),而且AGB随着海拔的升高,呈逐渐降低的趋势,海拔2000~3000 m范围的平均AGB为90.67±75.41 C m-2,高于其他海拔高度范围(图3l)。
3.2 环境因素对地上生物量空间变异的影响
地上生物量(AGB)与气候要素和土壤要素之间的皮尔逊相关系数表明,欧亚大陆草原及其3个亚区的AGB与表层(0~30 cm)土壤的Sand、Silt和Clay属性之间的相关性不显著(表1)。用线性、指数和多项式等一元回归分析方法,探讨了AGB与MAR、MAT和MAP等气候要素,以及Gravel、pH、和SOC等表层土壤要素之间的关系。Tab. 1
表1
表1欧亚大陆草原地上生物量与环境因素之间的相关系数
Tab. 1Correlations between AGB and environmental factors in the Eurasian steppe
| AGB | MAP (mm) | MAT (℃) | MAR (MJ m-2a-1) | Gravel (%vol.) | Sand (%wt.) | Silt (%wt.) | Clay (%wt.) | SOC (%wt.) | pH (-log(H+)) | |
|---|---|---|---|---|---|---|---|---|---|---|
| 欧亚大陆草原 | 皮尔逊系数 | 0.45** | 0.16* | -0.26** | -0.28** | -0.09 | 0.07 | 0.08 | -0.01 | 0.08 |
| p(双侧检验) | 0.00 | 0.02 | 0.00 | 0.00 | 0.19 | 0.34 | 0.25 | 0.88 | 0.47 | |
| 样本数 | 199 | 199 | 199 | 199 | 199 | 199 | 199 | 199 | 199 | |
| 黑海——哈萨克斯坦草原亚区 | 皮尔逊系数 | 0.54** | 0.07 | -0.04 | -0.34 | -0.37 | 0.44 | 0.13 | 0.55** | -0.06 |
| p(双侧检验) | 0.00 | 0.72 | 0.85 | 0.07 | 0.05 | 0.06 | 0.51 | 0.00 | 0.59 | |
| 样本数 | 28 | 28 | 28 | 28 | 28 | 28 | 28 | 28 | 28 | |
| 蒙古高原草原亚区 | 皮尔逊系数 | 0.60** | -0.53** | -0.28* | -0.04 | -0.18 | 0.27 | -0.01 | 0.37 | -0.17 |
| p(双侧检验) | 0.00 | 0.00 | 0.01 | 0.74 | 0.11 | 0.06 | 0.96 | 0.08 | 0.13 | |
| 样本数 | 85.00 | 85.00 | 85.00 | 85.00 | 85.00 | 85.00 | 85.00 | 85.00 | 85.00 | |
| 青藏高原草原亚区 | 皮尔逊系数 | 0.53** | 0.17* | -0.40** | -0.28 | 0.17 | -0.29 | -0.05 | -0.07 | 0.38** |
| p(双侧检验) | 0.00 | 0.02 | 0.00 | 0.89 | 0.11 | 0.09 | 0.65 | 0.50 | 0.00 | |
| 样本数 | 85 | 85 | 85 | 85 | 85 | 85 | 85 | 85 | 85 |
新窗口打开
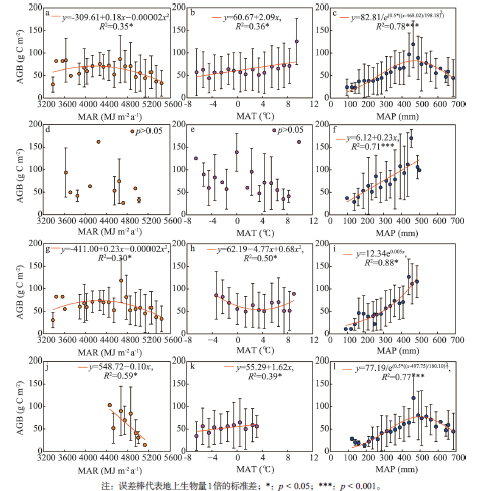
在整个欧亚大陆草原及蒙古高原草原亚区,AGB的空间格局与MAR空间变异之间的关系都表现为开口向下的二次函数关系(图4a、4g),在青藏高原草原亚区呈现为负的线性关系(图4j),在黑海——哈萨克斯坦草原亚区两者的相关性不显著(图4d)。在整个欧亚大陆草原及青藏高原草原亚区,AGB的空间格局随着MAT的升高呈现为线性增加的趋势(图4b、4k),在蒙古高原草原亚区呈开口向上的抛物线变化趋势(图4h),在黑海——哈萨克斯坦草原亚区,两者之间关系不明显(图4e)。在整个欧亚大陆草原及青藏高原草原亚区,AGB的空间格局是随着MAP的增加呈现为高斯函数的变化趋势(图4c、4l),在黑海——哈萨克斯坦草原亚区呈现为线性增加趋势(图4f),在蒙古高原草原亚区则呈现为指数增加趋势(图4i)。
 显示原图|下载原图ZIP|生成PPT
图4欧亚大陆草原地上生物量与气候因素之间的关系(a~c:整个欧亚大陆草原区;d~f:黑海——哈萨克斯坦草原亚区;g~i:蒙古高原草原亚区;j~l:青藏高原草原亚区)
-->Fig. 4The relationships between AGB in the Eurasian steppe and climatic variables
-->
 显示原图|下载原图ZIP|生成PPT
图5欧亚大陆草原地上生物量与土壤因素之间的关系(a~c:整个欧亚大陆草原区;d~f:黑海——哈萨克斯坦草原亚区;g~i:蒙古高原草原亚区;j~l:青藏高原草原亚区)
-->Fig. 5The relationships between AGB in the Eurasian steppe and soil factors
-->
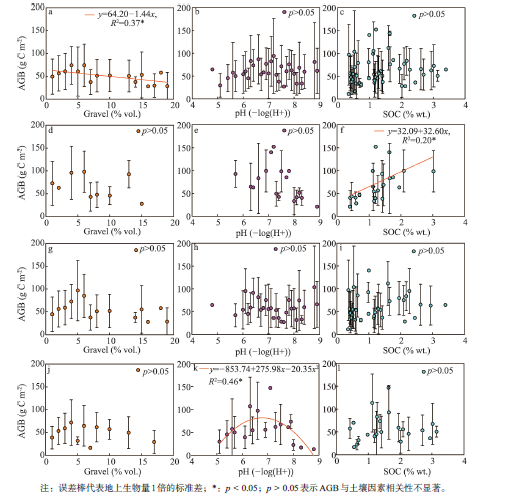
AGB的空间格局与表层(0~30 cm)土壤属性空间变异之间的回归分析表明,整个欧亚大陆草原的AGB空间格局与Gravel呈现为负的相关关系(图5a),但在3个亚区尺度上Gravel的空间分布对AGB空间分布没有显著影响(图5d、5g、5j)。在青藏高原草原亚区的AGB与土壤pH之间呈现为开口向下的抛物线变化趋势(图5k),而在整个欧亚大陆草原(图5b)、黑海——哈萨克斯坦草原亚区(图5e)和蒙古高原草原亚区(图5h)两者的相关性不显著。AGB与SOC在黑海——哈萨克斯坦草原亚区呈线性正相关关系(图5f),在整个欧亚大陆草原(图5c)、蒙古高原草原亚区(图5i)和青藏高原草原亚区(图5l)相关性不显著。
3.3 地上生物量的空间分布与环境因素变异之间的定量关系
地上生物量(AGB)空间格局与多个环境因子空间变异的逐步回归分析表明(表2),整个欧亚大陆草原AGB的空间分布主要受到MAP的影响,其可以解释地上生物量空间变异的24.91%。另外,MAT、MAR和表层土壤(0~30 cm)Gravel对AGB的空间分布也具有一定的影响,分别可以解释其空间变异的3.94%、2.09%、3.98%。上述4个环境因素的共同作用可以解释AGB空间变异的35%。对于整个欧亚大陆草原而言,其AGB与环境因子之间的定量关系可以表达为:式中:
在黑海——哈萨克斯坦草原亚区,AGB的空间分布主要受MAP和SOC的影响,两者分别可以解释AGB空间变异的29.65%和12.60%,二者的共同作用可以解释其变异的42.25%。对黑海——哈萨克斯坦草原亚区而言,AGB与环境因子之间定量关系可表达为:
式中:AGBB为黑海——哈萨克斯坦草原亚区的草地地上生物量;MAP为该亚区的年总降水量;SOC为该亚区表层(0~30 cm)土壤的有机碳含量。
在蒙古高原草原亚区,AGB的空间分布受到MAP以及MAP与MAT之间交互作用的影响,分别可以解释AGB空间变异的35.62%和4.49%,二者的共同作用可以解释其变异的40.11%。对于蒙古高原草原亚区而言,AGB与环境因子之间的定量关系可以表达为:
式中:AGBM为蒙古高原草原亚区的草地地上生物量;MAP为该亚区的年总降水量;MAT为该亚区的年平均温度。
在青藏高原草原亚区,MAP和表层土壤pH控制着AGB的空间分异,分别可以解释AGB空间变异的27.93%和7.18%,二者的共同作用可以解释其变异的35.11%。对于青藏高原草原亚区而言,AGB与环境因子之间的定量关系可以表达为:
式中:AGBT为青藏高原草原亚区的草地地上生物量;MAP为该亚区的年总降水量;pH为该亚区表层土壤(0~30 cm)的pH。
Tab. 2
表2
表2环境因素对欧亚大陆草原地上生物量空间格局的综合影响
Tab. 2Summary of the results obtained from stepwise multiple regressions between AGB and environmental variables, showing the integrative effects of environmental factors on the spatial variation of AGB in the Eurasian steppe
| 影响因素 | 自由度 | 解释率(%) | F值 | |
|---|---|---|---|---|
| 欧亚大陆草原 | MAP | 1 | 24.91*** | 55.28 |
| MAT | 1 | 3.94** | 10.96 | |
| Gravel | 1 | 3.98** | 11.09 | |
| MAR | 1 | 2.09* | 5.83 | |
| MAP×Gravel | 1 | 0.88 | 2.44 | |
| Residual | 193 | 64.21 | ||
| 黑海-哈萨克斯坦草原亚区 | MAP | 1 | 29.65*** | 13.67 |
| SOC | 1 | 12.60* | 5.81 | |
| MAP×SOC | 1 | 5.72 | 2.64 | |
| Residual | 24 | 52.04 | ||
| 蒙古高原草原亚区 | MAP | 1 | 35.62*** | 49.39 |
| MAP×MAT | 1 | 4.49* | 6.23 | |
| MAP×MAR | 1 | 2.73. | 3.78 | |
| MAT | 1 | 0.20 | 0.27 | |
| Residual | 79 | 56.96 | ||
| 青藏高原草原亚区 | MAP | 1 | 27.93*** | 36.68 |
| pH | 1 | 7.18** | 9.43 | |
| MAP×MAR | 1 | 3.16 | 4.16 | |
| MAR | 1 | 0.23 | 0.30 | |
| MAT | 1 | 1.33 | 1.74 | |
| Resiudal | 79 | 60.16 |
新窗口打开
4 讨论
4.1 草地地上生物量的空间格局
植被生物量是连接生态系统能量流动、物质循环等生态过程的关键参数[28],也是理解陆地生态系统生物地球化学循环的基础[46]。因此,探讨植被生物量空间格局对定量分析陆地生态系统碳源汇功能具有重要的意义[47]。从全球尺度来看,植被生物量的空间分布呈现出明显的纬度格局,位于赤道附近的热带雨林的生物量最大,随着纬度的升高,向极地方向生物量逐渐降低[48-50]。研究结果表明,黑海——哈萨克斯坦草原亚区的地上生物量(AGB)随着经度的增加,自西向东呈逐渐减小的变化趋势(图3e),而蒙古高原草原亚区AGB的空间格局正好相反,呈现为自西向东随着经度增加逐渐增加的变化趋势(图3h),两者的组合构成了黑海——哈萨克斯坦——蒙古高原草地的AGB沿着经度方向呈开口向上的抛物线形状的水平地带性规律”,纬度和海拔变化对AGB空间格局影响不显著。这种草地的水平地带性分布与Sala等[34]在美国中部大草原的研究,Jobbágy等[51]在巴塔哥尼亚草原的研究以及Ma等[21]在内蒙古温带草原的研究结论类似。
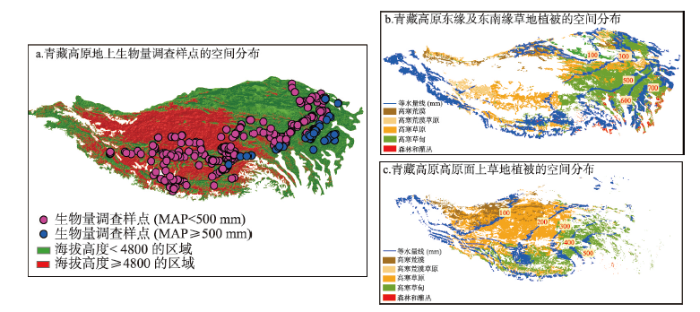
青藏高原草原亚区AGB的空间格局既具有明显的垂直方向地带性变化规律,也具有经度和纬度方向的水平地带性。在垂直方向上,随着海拔的升高,AGB显著地降低(图3l),在水平方向,随着纬度的升高和经度的增加,AGB都呈显著的增加趋势(图3j、3k)。青藏高原草原亚区AGB空间格局的水平地带性主要是由分布在青藏高原面上(海拔高于4800 m)草地AGB的空间格局所决定的(图6c、7a),其垂直地带性主要是由分布在青藏高原的东缘和南缘(海拔高度低于4800 m)的草地AGB空间格局所决定的(图6b、7c)。这一认识丰富了Yang等[22]对青藏高原面上和Wang等[23]对念青唐古拉山脉高山带AGB空间分布规律的研究结论。
 显示原图|下载原图ZIP|生成PPT
图6青藏高原东缘及东南缘(海拔低于4800 m)和高原面上(海拔高于4800 m)生物量调查样点和植被类型的分布
-->Fig. 6The spatial distribution of AGB field sites and vegetation type in the east and southeast margins (elevation < 4800 m) and the surface (elevation > 4800 m) of the Tibetan Plateau
-->
以整个欧亚大陆草原为研究对象的分析表明,AGB水平方向的空间分布规律为,随着纬度的升高,AGB自南向北呈现为开口向下的抛物线(图3a);随着经度的变化,自西向东则呈开口向上的抛物线变化趋势(图3b)。AGB垂直方向的空间分布规律为,随着海拔的升高,AGB呈开口向下的抛物线(图3c)。这一结果是欧亚大陆草原3个亚区AGB空间分布叠加的结果(图3a、3b、3c),也是对欧亚大陆草原AGB空间格局的水平地带性和垂直地带性的总体概括。
4.2 地上生物量空间格局的环境影响因素
植被生物量及初级生产力的空间格局通常受到气候、土壤及人类活动等因素的影 响[52],其中,气候要素的空间变异被认为是起主导作用的因素[23, 34, 47, 49-54]。Lieth[48]运用以MAT和MAP为输入变量的模型估算了全球植被的净初级生产力。Churkina等[52]研究表明,在全球的绝大部分地区,植被生产力都会受到MAT和MAP的影响,只有在极少数日照时数短的区域(约占全球表面的5%)才会受到MAR的影响。草地生态系统AGB的空间格局通常与MAP、MAT、土壤质地及土壤可利用养分等因素的空间变异有关系[25, 29, 35-36],其中的MAP空间变异是最为重要的影响因素[22, 34]。例如,Sala等[34]、Lauenroth等[55]在北美洲美国中部温带大草原的研究,Jobbágy等[51]在南美洲巴塔哥尼亚温带草原的研究,Bai等[56]在中国内蒙古温带草原的研究和Yang等[33]在中国青藏高原高寒草地的研究也都证实了这一认知。本文的研究结果表明,整个欧亚大陆草原以及其中的3个亚区的AGB空间分布虽然与MAT、MAR、表层土壤的Gravel、pH和SOC的空间变异都具有一定的相关关系,但是,MAP的空间变异对AGB空间格局的解释程度最大(图4,表2),这进一步证实了前人研究结论的普适意义。
在此还需要指出的是,本文的研究结果表明,欧亚大陆草原AGB与MAP空间分布之间的关系呈高斯函数(图4c)。这不同于前人研究中所报道的“草地生态系统的AGB空间格局与MAP空间变异呈线性或者指数关系”的研究结论。
从图4中可以看出,AGB与MAP的空间分布在黑海——哈萨克斯坦草原亚区呈线性函数关系(图4f),而在蒙古高原草原亚区呈现为指数函数关系(图4i),在青藏高原草原亚区则为高斯函数关系(图4l),3个亚区叠加的结果构成了整个欧亚大陆草原的AGB空间格局与MAP空间变异之间呈现高斯函数关系,其中决定这种函数关系的主要因素是青藏高原的草原分布及环境因素的空间格局,这种独特的空间格局决定了AGB与MAP空间格局关系的特殊性。
4.3 青藏高原草原地上生物量与年总降水量空间分布关系的特殊性及其成因
青藏高原草原的AGB空间格局与MAP变异之间的关系表现为高斯函数,这是青藏高原草地生态系统特殊的生态学现象,是独特高原地理环境作用的结果。就青藏高原的整体而言,在MAP低于500 mm的区域,AGB空间分布与MAP呈正相关关系;而在MAP高于500 mm的区域,AGB与MAP则呈负相关关系(图4l)。在青藏高原海拔高于4800 m的高原面上,生物量调查样点的MAP低于500 mm(图6a),该区域主要的植被类型为高寒草原和高寒草甸,高寒草原所占的比例比较大(图6c)。该区域AGB水平分布规律及其形成机制与其他平原区域草原AGB空间格局相似,主要受MAP空间变异的影响,随着MAP自东北向西南方向的增加,AGB也呈现为逐渐增加的变化趋势(图7)。 显示原图|下载原图ZIP|生成PPT
图7青藏高原高原面上(海拔高于4800 m)和东缘及东南缘(海拔低于4800 m)草地地上生物量的空间格局及其与年总降水量之间的关系
-->Fig.7The spatial patterns of AGB and its correlations to MAP in the surface (elevation > 4800 m) and the east and southeast margins (elevation < 4800 m) of the Tibetan Plateau
-->
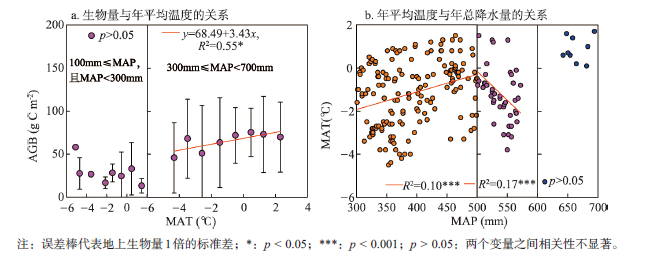
在青藏高原海拔低于4800 m的东缘及东南缘,MAP为100~700 mm,本文中MAP高于500 mm的生物量调查样点大多位于这一区域,主要植被类型为高寒草甸和高寒草原,高寒草甸所占比例较大(图6b)。该区AGB的空间格局以垂直分布为主,随着海拔变化的MAP对AGB格局的影响也十分复杂(图7c、7d)。300 mm的MAP是一个主要的气候分界线。在MAP低于300 mm的区域内,植被类型主要为高寒草原(图6b),AGB空间格局主要受MAP空间变异的影响,与MAT空间变异之间的相关性不显著(图8a)。
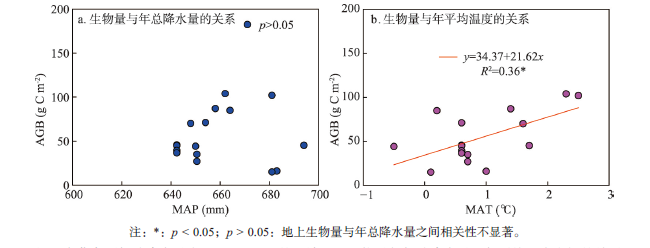
在MAP高于300 mm的区域,草地植被类型主要为高寒草甸(图6b),AGB的空间格局与MAT空间变异具有显著的正相关关系,MAT格局成为制约AGB空间变异的重要因素之一。在MAP为300~500 mm的区域,MAP与MAT的空间格局变化趋势一致(图8),因此,随着MAP的增加,AGB也逐渐增加。在MAP为500~600 mm的区域,MAP与MAT的空间格局呈负相关关系,由于温度的限制,随着MAP的增加,AGB表现出减小的趋势。在MAP为600~700 mm的区域,MAP与MAT的空间相关性不显著,且AGB的空间格局主要受到MAT空间变异的影响,与MAP空间变异的相关性不显著(图9)。
 显示原图|下载原图ZIP|生成PPT
图8不同降水梯度下青藏高原东缘及东南缘地上生物量与年平均温度的关系、年平均温度与年总降水量之间的关系
-->Fig. 8The correlations of AGB to MAT and MAT to MAP along the precipitation gradient in the east and southeast margins of the Tibetan Plateau
-->
 显示原图|下载原图ZIP|生成PPT
图9青藏高原年总降水量为600~700 mm的区域地上生物量与年总降水量和年平均温度之间的关系
-->Fig. 9The correlations of AGB to MAP and MAT in the Tibetan Plateau with MAP of 600-700 mm
-->
在不同的降水梯度下,青藏高原东缘及东南缘草地AGB空间变异的主要影响因素有所差异:MAP低于300 mm时,主要受MAP空间变异的影响,在MAP为300~500 mm时,受到MAP与MAT空间变异的共同影响,在MAP为600~700 mm时则主要受MAT空间变异的影响。MAP在500~600 mm时,MAP与MAT的空间负相关关系是形成青藏高原东缘及东南缘AGB与MAP空间变异之间呈现高斯函数关系的主要原因。
AGB与MAP的空间分异在青藏高原面上呈正相关关系(图7b),在青藏高原东缘及东南缘则为高斯函数关系(图7d),二者的叠加作用形成青藏高原草原亚区AGB空间格局与MAP空间变异之间呈现为高斯函数的关系,决定这种特殊函数关系的主要原因是东缘及东南缘MAP为500~600 mm的区域MAP与MAT的空间格局呈负相关关系。
5 结论
本文将整个欧亚大陆草原生态系统作为研究区域,分析了草地地上生物量(AGB)的空间格局及其与环境因素之间的关系,主要结论为:(1)在黑海——哈萨克斯坦草原亚区、蒙古高原草原亚区(海拔低于3000 m),以及青藏高原面(海拔高于4800 m)的草原区,MAP低于500 mm,AGB的空间格局表现为沿经度方向的水平地带性规律,主要受到MAP空间变异的影响,二者之间呈正相关 关系。
(2)在青藏高原东缘及东南缘(海拔低于4800 m),AGB的空间格局主要表现为垂直地带性规律,空间变异的主要影响因素因降水梯度的不同而有所差异。在MAP为100~300 mm的区域,AGB主要受到MAP空间变异的影响,在MAP为300~500 mm的区域,主要受MAP与MAT共同影响,在MAP为600~700 mm的区域,则主要受MAT的影响。
(3)在3个亚区AGB空间格局的叠加作用下,欧亚大陆草原AGB的空间分布规律表现为,在水平方向的自南向北随着纬度的升高,AGB的变化趋势呈开口向下的抛物线分布;自西向东随着经度的增加,则呈开口向上的抛物线分布。在垂直方向的格局则是随着海拔升高,AGB呈开口向下的抛物线变化规律。
(4)欧亚大陆草原AGB空间格局与MAP空间变异之间呈现为高斯函数关系,主要是因为青藏高原独特的草原分布及环境因素空格局特征决定的。
致谢:衷心感谢中国科学院地理科学与资源研究所客座研究生李杰和薛晶月,为本文提供的中国区域的部分草地地上生物量样点数据;感谢美国橡树岭国家实验室提供的净初级生产力数据库。
The authors have declared that no competing interests exist.
参考文献 原文顺序
文献年度倒序
文中引用次数倒序
被引期刊影响因子
| [1] | |
| [2] | <a name="Abs1"></a>Recent projections of climatic change have focused a great deal of scientific and public attention on patterns of carbon (C) cycling as well as its controls, particularly the factors that determine whether an ecosystem is a net source or sink of atmospheric carbon dioxide (CO<sub>2</sub>). Net ecosystem production (NEP), a central concept in C-cycling research, has been used by scientists to represent two different concepts. We propose that NEP be restricted to just one of its two original definitions—the imbalance between gross primary production (GPP) and ecosystem respiration (ER). We further propose that a new term—net ecosystem carbon balance (NECB)—be applied to the net rate of C accumulation in (or loss from [negative sign]) ecosystems. Net ecosystem carbon balance differs from NEP when C fluxes other than C fixation and respiration occur, or when inorganic C enters or leaves in dissolved form. These fluxes include the leaching loss or lateral transfer of C from the ecosystem; the emission of volatile organic C, methane, and carbon monoxide; and the release of soot and CO<sub>2</sub> from fire. Carbon fluxes in addition to NEP are particularly important determinants of NECB over long time scales. However, even over short time scales, they are important in ecosystems such as streams, estuaries, wetlands, and cities. Recent technological advances have led to a diversity of approaches to the measurement of C fluxes at different temporal and spatial scales. These approaches frequently capture different components of NEP or NECB and can therefore be compared across scales only by carefully specifying the fluxes included in the measurements. By explicitly identifying the fluxes that comprise NECB and other components of the C cycle, such as net ecosystem exchange (NEE) and net biome production (NBP), we can provide a less ambiguous framework for understanding and communicating recent changes in the global C cycle. |
| [3] | |
| [4] | 地球系统的碳库和碳循环过程变化是影响气候系统的重要因素,而陆地生态系统的碳收支及其循环过程机制研究一直是全球气候变化成因分析、变化趋势预测、减缓和适应对策分析领域的科学研究热点。回顾了过去几十年区域尺度陆地生态系统碳循环和碳收支研究领域的国际前沿及其关键科学问题,并分析了我国在该研究领域的科技需求和发展方向。当前国际科学研究的热点和前沿领域主要包括:生态系统和区域碳储量和碳收支的清查、综合计量与碳汇认证,陆地生态系统碳通量的联网观测及其循环过程机制,陆地生态系统碳循环过程对气候变化响应野外控制试验,陆地生态系统水、碳、氮循环及其耦合关系机制和模拟模型研究等,同时指出在这些研究领域依然存在且急需解决的关键科学问题。我国近期的科技工作重点工作应该是努力构建天-地-空一体化的碳储量和碳收支动态监测体系、开展生态系统碳-氮-水耦合循环及其区域调控管理的前瞻性研究,定量评价中国生态系统的碳收支状况和增汇潜力,评估各种典型生态系统增汇技术的经济效益,为国家尺度的温室气体管理和碳交易机制与政策体系的建立提供可报告、可度量和可核查的科学数据和技术支持。 . 地球系统的碳库和碳循环过程变化是影响气候系统的重要因素,而陆地生态系统的碳收支及其循环过程机制研究一直是全球气候变化成因分析、变化趋势预测、减缓和适应对策分析领域的科学研究热点。回顾了过去几十年区域尺度陆地生态系统碳循环和碳收支研究领域的国际前沿及其关键科学问题,并分析了我国在该研究领域的科技需求和发展方向。当前国际科学研究的热点和前沿领域主要包括:生态系统和区域碳储量和碳收支的清查、综合计量与碳汇认证,陆地生态系统碳通量的联网观测及其循环过程机制,陆地生态系统碳循环过程对气候变化响应野外控制试验,陆地生态系统水、碳、氮循环及其耦合关系机制和模拟模型研究等,同时指出在这些研究领域依然存在且急需解决的关键科学问题。我国近期的科技工作重点工作应该是努力构建天-地-空一体化的碳储量和碳收支动态监测体系、开展生态系统碳-氮-水耦合循环及其区域调控管理的前瞻性研究,定量评价中国生态系统的碳收支状况和增汇潜力,评估各种典型生态系统增汇技术的经济效益,为国家尺度的温室气体管理和碳交易机制与政策体系的建立提供可报告、可度量和可核查的科学数据和技术支持。 |
| [5] | |
| [6] | |
| [7] | Management of ecosystems at large regional or continental scales and de- termination of the vulnerability of ecosystems to large-scale changes in climate or atmo- spheric chemistry require understanding how ecosystem processes are governed at large spatial scales. A collaborative project, the Vegetation and Ecosystem Modeling and Analysis Project (VEMAP), addressed modeling of multiple resource limitation at the scale of the conterminous United States, and the responses of ecosystems to environmental change. In this paper, we evaluate the model-generated patterns of spatial variability within and be- tween ecosystems using Century, TEM, and Biome-BGC, and the relationships between modeled water balance, nutrients, and carbon dynamics. We present evaluations of models against mapped and site-specific data. In this analysis, we compare model-generated patterns of variability in net primary productivity (NPP) and soil organic carbon (SOC) to, respec- tively, a satellite proxy and mapped SOC from the VEMAP soils database (derived from USDA-NRCS (Natural Resources Conservation Service) information) and also compare modeled results to site-specific data from forests and grasslands. The VEMAP models simulated spatial variability in ecosystem processes in substantially different ways, reflect- ing the models' differing implementations of multiple resource limitation of NPP. The models had substantially higher correlations across vegetation types compared to within vegetation types. All three models showed correlation among water use, nitrogen avail- ability, and primary production, indicating that water and nutrient limitations of NPP were equilibrated with each other at steady state. This model result may explain a number of seemingly contradictory observations and provides a series of testable predictions. The VEMAP ecosystem models were implicitly or explicitly sensitive to disturbance in their simulation of NPP and carbon storage. Knowledge of the effects of disturbance (human and natural) and spatial data describing disturbance regimes are needed for spatial modeling of ecosystems. Improved consideration of disturbance is a key ''next step'' for spatial ecosystem models. |
| [8] | Abstract Evaluating the role of terrestrial ecosystems in the global carbon cycle requires a detailed understanding of carbon exchange between vegetation, soil, and the atmosphere. Global climatic change may modify the net carbon balance of terrestrial ecosystems, causing feedbacks on atmospheric CO 2 and climate. We describe a model for investigating terrestrial carbon exchange and its response to climatic variation based on the processes of plant photosynthesis, carbon allocation, litter production, and soil organic carbon decomposition. The model is used to produce geographical patterns of net primary production (NPP), carbon stocks in vegetation and soils, and the seasonal variations in net ecosystem production (NEP) under both contemporary and future climates. For contemporary climate, the estimated global NPP is 57.0 Gt C y 鈥1 , carbon stocks in vegetation and soils are 640 Gt C and 1358 Gt C, respectively, and NEP varies from 鈥0.5 Gt C in October to 1.6 Gt C in July. For a doubled atmospheric CO 2 concentration and the corresponding climate, we predict that global NPP will rise to 69.6 Gt C y 鈥1 , carbon stocks in vegetation and soils will increase by, respectively, 133 Gt C and 160 Gt C, and the seasonal amplitude of NEP will increase by 76%. A doubling of atmospheric CO 2 without climate change may enhance NPP by 25% and result in a substantial increase in carbon stocks in vegetation and soils. Climate change without CO 2 elevation will reduce the global NPP and soil carbon stocks, but leads to an increase in vegetation carbon because of a forest extension and NPP enhancement in the north. By combining the effects of CO 2 doubling, climate change, and the consequent redistribution of vegetation, we predict a strong enhancement in NPP and carbon stocks of terrestrial ecosystems. This study simulates the possible variation in the carbon exchange at equilibrium state. We anticipate to investigate the dynamic responses in the carbon exchange to atmospheric CO 2 elevation and climate change in the past and future. |
| [9] | |
| [10] | The aim of this study was to assess heart rate variability, a noninvasive parameter for studying the neurohumoral control of heart rate, in children with atrial septal . We examined five time-domain and three frequency-domain indices of heart rate variability determined from 24-hour Holter recordings in 20 children, aged 3-14 years, with who were about to undergo operation. The measures were compared to normal ranges and to the hemodynamic data of the preoperative cardiac catheterization. Most indices of heart rate variability were moderately depressed in children with atrial septal . Our data revealed negative correlations between indices and the mean right atrial pressure and the enddiastolic right ventricular pressure, respectively. The study demonstrates the importance of the right ventricular filling pressures for the autonomic control of the heart in children with atrial septal . |
| [11] | ABSTRACT Natural grasslands, especially in the tropics, urgently need more detailed study in order to determine the response of this undervalued major ecosystem type to possible climate changes. Feedback effects through environmental variables such as temperature, water and nutrient stress may be at least as significant as the increase in atmospheric CO2 concentration, but there is scarcely enough data at present to develop and validate modelling. Annual burning of large areas of tropical grasslands plays a significant role in the global carbon cycle. Net loss of soil carbon and nitrogen may result, depending upon the frequency of fire, overgrazing and drought. The UNEP Project on productivity and photosynthesis in tropical grasslands attempts to correct the gap in baseline data, and has found these ecosystems to be far more productive than previously appreciated. Based on data from three terrestrial grassland sites, the gross flux of carbon from burning of tropical grasslands falls in the range 2.4-4.2 Gt per annum, a significant amount compared with the net fluxes of 1.8 Gt estimated from deforestation and 5.3 Gt from fossil combustion. Data from this project is also being applied to modelling work in collaboration with SCOPE, in order to study climate change effects on carbon cycling in grasslands. |
| [12] | The challenge to identify the biospheric sinks for about half the total carbon emissions from fossil fuels must include a consideration of below-ground ecosystem processes as well as those more easily measured above-ground. Recent studies suggest that tropical grasslands and savannas may contribute more to the `missing sink' than was previously appreciated, perhaps as much as 0.5 Pg (=鈥0.5 Gt) carbon per annum. The rapid increase in availability of productivity data facilitated by the Internet will be important for future scaling-up of global change responses, to establish independent lines of evidence about the location and size of carbon sinks. |
| [13] | To address the need for a high quality data set based upon field observations suitable for parameterization, calibration, and validation of terrestrial biosphere models, we have developed a comprehensive global database on net primary productivity (NPP). We have compiled field measurements of biomass and associated environmental data for multiple study sites in major grassland types worldwide. Where sufficient data were available, we compared aboveground and total NPP estimated by six computational methods (algorithms) for 31 grassland sites. As has been found previously, NPP estimates were 2-5 times higher using methods which accounted for the dynamics of dead matter, compared with what is still the most commonly applied estimate of NPP (maximum peak live biomass). It is suggested that assumptions such as the use of peak biomass as an indicator of NPP in grasslands may apply only within certain subbiomes, e.g. temperate steppe grasslands. Additional data on belowground dynamics, or other reliable estimates of belowground productivity, are required if grasslands are to be fully appreciated for their role in the global carbon cycle. |
| [14] | |
| [15] | |
| [16] | |
| [17] | |
| [18] | . 正 草原植被是我国半干旱到半湿润地区最重要的天然草场资源。因此,研究作为特定植被类型的草原(Steppe),是研究我国天然草场资源的重要方面。凡是由 微湿、旱生、多年生草本植物为主(有时以旱生小半灌木为主)组成的植物群落叫做草原(Steppe)。它主要是由所在地区的气候因素和历史条件所决定的, 并在地球上占据着一定的自然地带。下面,对我国草原的分布、发生、区系组成、群落类型和分区等方面的最一般的特征进 . 正 草原植被是我国半干旱到半湿润地区最重要的天然草场资源。因此,研究作为特定植被类型的草原(Steppe),是研究我国天然草场资源的重要方面。凡是由 微湿、旱生、多年生草本植物为主(有时以旱生小半灌木为主)组成的植物群落叫做草原(Steppe)。它主要是由所在地区的气候因素和历史条件所决定的, 并在地球上占据着一定的自然地带。下面,对我国草原的分布、发生、区系组成、群落类型和分区等方面的最一般的特征进 |
| [19] | . . |
| [20] | 正草原是地球表面最主要的陆地 生态系统。欧亚草原位于北半球中纬度地区,是世界上面积最大、保存较好的草原区,在地域上可以划分为黑海—哈萨克斯坦草原亚区、亚洲中部草原亚区和青藏高 原草原亚区,我国北方草原是欧亚大陆草原的重要组成部分。欧亚草原在欧亚文明文化发展交流、国民经济发展和生态环境建设中具有非常重要的地位和作用,发挥 着多种功能和用途。然而,由于草原生态系统本身的脆弱性,加之长期不合理的开发利用,导致 . 正草原是地球表面最主要的陆地 生态系统。欧亚草原位于北半球中纬度地区,是世界上面积最大、保存较好的草原区,在地域上可以划分为黑海—哈萨克斯坦草原亚区、亚洲中部草原亚区和青藏高 原草原亚区,我国北方草原是欧亚大陆草原的重要组成部分。欧亚草原在欧亚文明文化发展交流、国民经济发展和生态环境建设中具有非常重要的地位和作用,发挥 着多种功能和用途。然而,由于草原生态系统本身的脆弱性,加之长期不合理的开发利用,导致 |
| [21] | |
| [22] | This study investigated spatial patterns and environmental controls of aboveground biomass (AGB) in alpine grasslands on the Tibetan Plateau by integrating AGB data collected from 135 sites during 2001–2004 and concurrent enhanced vegetation index derived from MODIS data sets. The AGB was estimated at 68.8gm 612 , with a larger value (90.8gm 612 ) in alpine meadow than in alpine steppe (50.1gm 612 ). It increased with growing season precipitation (GSP), but did not show a significant overall trend with growing season temperature (GST) although it was negatively correlated with GST at dry environments (<200mm of GSP). Soil texture also influenced AGB, but the effect was coupled with precipitation; increased silt content caused a decrease of AGB at small GSP, and generated a meaningful increase under humid conditions. The correlation between AGB and sand content indicated an opposite trend with that between AGB and silt content. An analysis of general linear model depicted that precipitation, temperature, and soil texture together explained 54.2% of total variance in AGB. Our results suggest that moisture availability is a critical control of plant production, but temperature and soil texture also affect vegetation growth in high-altitude regions. |
| [23] | |
| [24] | Understanding how the aboveground net primary production (ANPP) of arid and semiarid ecosystems of the world responds to variations in precipitation is crucial for assessing the impacts of climate change on terrestrial ecosystems. Rain-use efficiency (RUE) is an important measure for acquiring this understanding. However, little is known about the response pattern of RUE for the largest contiguous natural grassland region of the world, the Eurasian Steppe. Here we investigated the spatial and temporal patterns of ANPP and RUE and their key driving factors based on a long-term data set from 21 natural arid and semiarid ecosystem sites across the Inner Mongolia steppe region in northern China. Our results showed that, with increasing mean annual precipitation (MAP), (1) ANPP increased while the interannual variability of ANPP declined, (2) plant species richness increased and the relative abundance of key functional groups shifted predictably, and (3) RUE increased in space across different ecosystems but decreased with increasing annual precipitation within a given ecosystem. These results clearly indicate that the patterns of both ANPP and RUE are scale dependent, and the seemingly conflicting patterns of RUE in space vs. time suggest distinctive underlying mechanisms, involving interactions among precipitation, soil N, and biotic factors. Also, while our results supported the existence of a common maximum RUE, they also indicated that its value could be substantially increased by altering resource availability, such as adding nitrogen. Our findings have important implications for understanding and predicting ecological impacts of global climate change and for management practices in arid and semiarid ecosystems in the Inner Mongolia steppe region and beyond. |
| [25] | The knowledge of carbon(C) stock and its dynamics is crucial for understanding the role of grassland ecosystems in China's terrestrial C cycle.To date,a comprehensive assessment on C balance in China's grasslands is still lacking.By reviewing published literature,this study aims to evaluate ecosystem C stocks(both vegetation biomass and soil organic C) and their changes in China's grasslands.Our results are summarized as follows:(1) biomass C density(C stock per area) of China's grasslands differed greatly among previous studies,ranging from 215.8 to 348.1 g C m-2 with an average of 300.2 g C m-2.Likewise,soil C density also varied greatly between 8.5 and 15.1 kg C m-2.In total,ecosystem C stock in China's grasslands was estimated at 29.1 Pg C.(2) Both the magnitude and direction of ecosystem C changes in China's grasslands differed greatly among previous studies.According to recent reports,neither biomass nor soil C stock in China's grasslands showed a significant change during the past 20 years,indicating that grassland ecosystems are C neutral.(3) Spatial patterns and temporal dynamics of grassland biomass were closely correlated with precipitation,while changes in soil C stocks exhibited close associations with soil moisture and soil texture.Human activities,such as livestock grazing and fencing could also affect ecosystem C dynamics in China's grasslands. |
| [26] | ABSTRACT Aim68 To investigate large-scale patterns of above-ground and below-ground biomass partitioning in grassland ecosystems and to test the isometric theory at the community level. Location68 Northern China, in diverse grassland types spanning temperate grasslands in arid and semi-arid regions to alpine grasslands on the Tibetan Plateau. Methods68 We investigated above-ground and below-ground biomass in China's grasslands by conducting five consecutive sampling campaigns across the northern part of the country during 2001–05. We then documented the root65:65shoot ratio (R/S) and its relationship with climatic factors for China's grasslands. We further explored relationships between above-ground and below-ground biomass across different grassland types. Results68 Our results indicated that the overall R/S of China's grasslands was larger than the global average (6.3 vs. 3.7). The R/S for China's grasslands did not show any significant trend with either mean annual temperature or mean annual precipitation. Above-ground biomass was nearly proportional to below-ground biomass with a scaling exponent (the slope of log–log linear relationship between above-ground and below-ground biomass) of 1.02 across various grassland types. The slope did not differ significantly between temperate and alpine grasslands or between steppe and meadow. Main conclusions68 Our findings support the isometric theory of above-ground and below-ground biomass partitioning, and suggest that above-ground biomass scales isometrically with below-ground biomass at the community level. |
| [27] | |
| [28] | Aims Grassland is the most widely distributed vegetation type on the Xizang Plateau. Accurate remote sensing estimation of the grassland aboveground biomass (AGB) in this region is influenced by the types of vegetation indexes (VIs) used, the grain size (resolution) of the remote sensing data and the targeted ecosystem features. This study attempts to answer the following questions: (i) Which VI can most accurately reflect the grassland AGB distribution on the Xizang Plateau? (ii) How does the grain size of remote sensing imagery affect AGB reflection? (iii) What is the spatial distribution pattern of the grassland AGB on the plateau and its relationship with the climate? Methods We investigated 90 sample sites and measured site-specific AGBs using the harvest method for three grassland types (alpine meadow, alpine steppe and desert steppe). For each sample site, four VIs, namely, Normalized Difference VI (NDVI), Enhanced VI, Normalized Difference Water Index (NDWI) and Modified Soil-Adjusted VI (MSAVI) were extracted from the Moderate Resolution Imaging Spectroradiometer (MODIS) products with grain sizes of 250 m and 1 km. Linear regression models were employed to identify the best estimator of the AGB for the entire grassland and the three individual grassland types. Paired Wilcoxon tests were applied to assess the grain size effect on the AGB estimation. General linear models were used to quantify the relationships between the spatial distribution of the grassland AGB and climatic factors. Important Findings The results showed that the best estimator for the entire grassland AGB on the Xizang Plateau was MSAVI at a 250 m grain size (MSAVI(250) (m)). For each individual grassland type, the best estimator was MSAVI at a grain size of 250 m for alpine meadow, NDWI at a grain size of 1 km for alpine steppe and NDVI at a grain size of 1 km for desert steppe. The explanation ability of each VI for the grassland AGB did not significantly differ for the two grain sizes. Based on the best fit model (AGB = -10.80 + 139.13 MSAVI(250 m)), the spatial pattern of the grassland AGB on the plateau was characterized. The AGB varied from 1 to 136 g m(-2). Approximately 59% of total spatial variation in the AGB for the entire grassland was explained by the combination of the mean annual precipitation (MAP) and mean annual temperature. The explanatory power of MAP was weaker for each individual grassland type than that for the entire grassland. This study illustrated the high efficiency of the VIs derived from MODIS data in the grassland AGB estimation on the Xizang Plateau due to the vegetation homogeneity within a 1 x 1 km pixel in this region. Furthermore, MAP is a primary driver on the spatial variation of AGB at a regional scale. |
| [29] | 2004年对新疆地区的草地地上生物量进行了大范围的调查,据此 估算了新疆6种主要草地类型的地上生物量密度和总量,并探讨了草地地上生物量与环境因子的关系.结果表明,草原类型中,荒漠草原的地上生物量密度最小 (34.9 g C·m-2),草甸草原最大(87.3 g C·m-2),而典型草原(53.2 g C·m-2)和高寒草原(47.7 gC·m-2)介于两者之间;草甸类型中,山地草甸(117.4 g C·m-2)的地上生物量密度显著高于高寒草甸(58.1 gC·m-2).6种草地的地上生物量总量为14.65 Tg C,约占全国的10%.地上生物量主要集中于高寒草原和高寒草甸,两者占总量的41.7%;其次是典型草原、山地草甸和荒漠草原,分别占19.0%、 18.3%和14.6%;草甸草原因分布面积小而使得其地上生物量最小,仅占总量的6.4%.草原和草甸地上生物量的控制因子存在差异:草原地上生物量主 要受降水控制,而草甸地上生物量则与温度相关.除受气候影响外,草原地上生物量还与土壤含水率、土壤总氮含量正相关,而草甸地上生物量与土壤含水率、土壤 总氮含量均不相关. . 2004年对新疆地区的草地地上生物量进行了大范围的调查,据此 估算了新疆6种主要草地类型的地上生物量密度和总量,并探讨了草地地上生物量与环境因子的关系.结果表明,草原类型中,荒漠草原的地上生物量密度最小 (34.9 g C·m-2),草甸草原最大(87.3 g C·m-2),而典型草原(53.2 g C·m-2)和高寒草原(47.7 gC·m-2)介于两者之间;草甸类型中,山地草甸(117.4 g C·m-2)的地上生物量密度显著高于高寒草甸(58.1 gC·m-2).6种草地的地上生物量总量为14.65 Tg C,约占全国的10%.地上生物量主要集中于高寒草原和高寒草甸,两者占总量的41.7%;其次是典型草原、山地草甸和荒漠草原,分别占19.0%、 18.3%和14.6%;草甸草原因分布面积小而使得其地上生物量最小,仅占总量的6.4%.草原和草甸地上生物量的控制因子存在差异:草原地上生物量主 要受降水控制,而草甸地上生物量则与温度相关.除受气候影响外,草原地上生物量还与土壤含水率、土壤总氮含量正相关,而草甸地上生物量与土壤含水率、土壤 总氮含量均不相关. |
| [30] | Investigating the spatial and temporal variance in productivity along natural precipitation gradients is one of the most efficient approaches to improve understanding of how ecosystems respond to climate change. In this paper, by using the natural precipitation gradient of the Inner Mongolian Plateau from east to west determined by relatively long-term observations, we analyzed the temporal and spatial dynamics of aboveground net primary productivity (ANPP) of the temperate grasslands covering this region. Across this grassland transect, ANPP increased exponentially with the increase of mean annual precipitation (MAP) (ANPP=24.47e0.005MAP,R2=0.48). Values for the three vegetation types desert steppe,typical steppe, and meadow steppe were: 60.86 gm-2a-1, 167.14 gm-2a-1 and 288.73 gm-2a-1 respectively.By contrast, temperature had negative effects on ANPP. The moisture index (K), which takes into account both precipitation and temperature could explain the spatial variance of ANPP better than MAP alone (ANPP=2020.34K1.24,R2=0.57). Temporally, we found that the inter-annual variation in ANPP (calculated as the coefficient of variation, CV) got greater with the increase of aridity. However, this trend was not correlated with the inter-annual variation of precipitation. For all of the three vegetation types,ANPP had greater inter-annual variation than annual precipitation (PPT). Their difference (ANPP CV/PPT CV) was greatest in desert steppe and least in meadow steppe. Our results suggest that in more arid regions, grasslands not only have lower productivity, but also higher inter-annual variation of production. Climate change may have significant effects on the productivity through changes in precipitation pattern, vegetation growth potential, and species diversity. |
| [31] | National Natural Science Foundation of China [30590381, 40971027]; State Key Technologies RD Program [2006BAC08]; Chinese Academy of Sciences ; National Key Research and Development Program [2010CB833501] |
| [32] | Concomitant changes of annual precipitation and its seasonal distribution within the context of global climate change have dramatic impacts on aboveground net primary productivity (ANPP) of grassland ecosystems. In this study, combining remote sensing products with measurements of ANPP, we quantified the effects of mean annual precipitation (MAP) and precipitation seasonal distribution (PSD) on the spatial variations in ANPP along a climate gradient in Eurasian temperate grassland. Our results indicated that ANPP increased exponentially with MAP for the entire temperate grassland, but linearly for a specific grassland type, i.e. the desert steppe, typical steppe, and meadow steppe from arid to humid regions. The slope of the linear relationship appeared to be steeper in the more humid meadow steppe than that in the drier typical and desert steppes. PSD also had significant effect on the spatial variations in ANPP. It explained 39.4% of the spatial ANPP for the entire grassland investigated, being comparable with the explanatory power of MAP (40.0%). On the other hand, the relative contribution of PSD and MAP is grassland type specific. MAP exhibited a much stronger explanatory power than PSD for the desert steppe and the meadow steppe at the dry and wet end, respectively. However, PSD was the dominant factor affecting the spatial variation in ANPP for the median typical steppe. Our results imply that altered pattern of PSD due to climate change may be as important as the total amount in terms of effects on ANPP in Eurasian temperate grassland. |
| [33] | |
| [34] | |
| [35] | |
| [36] | Abstract. A potentially important organizing principle in arid and semi-arid systems is the inverse-texture hypothesis which predicts that plant communities on coarse-textured soils should have higher above-ground net primary productivity (ANPP) than communities on fine-textured soils; the reverse is predicted to occur in humid regions. Our objectives were: (1) to test predictions from the inverse-texture hypothesis across a regional precipitation gradient, and (2) to evaluate changes in community composition and basal cover on coarse- and fine-textured soils across this gradient to determine how these structural parameters may affect ANPP. Sites were located along a precipitation gradient through the Central Grassland region of the United States: mean annual precipitation ranges from 311 mm/y to 711 mm/y, whereas mean annual temperature ranges from 9 掳C to 11 掳C. For both coarse- and fine-textured sites in 1993 and 1994, August - July precipitation in the year of the study explained greater than 92% of the variability in ANPP. Soil texture did not explain a significant proportion of the variability in ANPP. However, soil texture did affect the proportion of ANPP contributed by different functional types. Forbs and shrubs made up a larger proportion of total ANPP on coarse- compared to fine-textured sites. Shrubs contributed more to ANPP at the drier end of the gradient. Basal cover of live vegetation was not significantly related to precipitation and was similar for both soil textures. Our results revealed that across a regional precipitation gradient, soil texture may play a larger role in determining community composition than in determining total ANPP. |
| [37] | <a name="Abs1"></a>To understand and predict the role of soils in changes in alpine meadow ecosystems during climate warming, soil monoliths, extending from the surface to the deepest roots, were collected from <i>Carex moorcroftii</i>, <i>Kobresia humilis</i>, mixed grass, and <i>Kobresia pygmaea</i> alpine meadows in the hinterland of the Tibetan Plateau, China. The monoliths were used to measure the distribution with depth of biomass, soil grain size, soil nutrient levels, and soil moisture. With the exception of the <i>K. pygmaea</i> meadow, the percentages of gravel and coarse sand in the soils were high, ranging from 37.7 to 57.8% for gravel, and from 18.7 to 27.9% for coarse sand. The texture was finest in the upper 10 cm soil layer, and generally became coarser with increasing depth. Soil nutrients were concentrated in the top 15 cm soil layer, especially in the top 10 cm. Soil water content was low, ranging from 3 to 28.4%. Most of the subsurface biomass was in the top 10 cm, with concentrations of 79.8% in the <i>K. humilis</i> meadow, 77.6% in the mixed grass meadow, and 62.3% in the <i>C. moorcroftii</i> meadow. Owing to deeper root penetration, the concentration of subsurface biomass in the upper 10 cm of <i>K. pygmaea</i> soil was only 41.7%. The subsurface biomass content decreased exponentially with depth; this is attributed to the increase in grain size and decrease in soil nutrient levels with depth. Soil water is not a primary factor influencing the vertical and spatial distribution of subsurface biomass in the study area. The lack of fine material and of soil nutrients resulted in low surficial and subsurface biomass everywhere. |
| [38] | . |
| [39] | : : |
| [40] | We developed interpolated climate surfaces for global land areas (excluding Antarctica) at a spatial resolution of 30 arc s (often referred to as 1-km spatial resolution). The climate elements considered were monthly precipitation and mean, minimum, and maximum temperature. Input data were gathered from a variety of sources and, where possible, were restricted to records from the 1950-2000 peri... |
| [41] | |
| [42] | |
| [43] | |
| [44] | |
| [45] | |
| [46] | We developed a methodology for linking together data from forest and grassland inventories and ecological research sites, and provided a comprehensive report about live biomass and net primary productivity (NPP) on the Tibetan Plateau, the "Third Pole" of the earth where little information about plant biomass and production had been available outside China. Results were as follows. (1) The total live biomass of the natural vegetation in the Xizang (Tibet) Autonomous Region and Qinghai Province was estimated as 2.17 Gg dry mass, of which 72.9% was stored in forests where spruce-fir accounted for 65.1%. (2) The total annual NPP of the natural vegetation in these two administrative regions was estimated as 0.57 Gg dry mass, of which grasslands and forests accounted for 69.5% and 18.1%, respectively. (3) The alpine spruce-fir forests of the Tibetan Plateau had the highest maximum live biomass of the spruce-fir forests globally, with values up to 500-1600 Mg DM/ha (including both aboveground and belowground biomass). (4) The QZNPP model generally predicted NPP well for most of the biomes on the plateau, and simulated the various Chinese vegetation divisions. Model results showed a positive reinforcing effect of monsoon climate in China where the warmest season coincides with the wettest season. (5) The live biomass map for 117 counties of Xizang (Tibet) and Qinghai and the potential NPP map for the whole plateau both showed the same decreasing trend from southeast to northwest. |
| [47] | . |
| [48] | Primary productivity of the biosphere edited by Helmut Lieth and Robert H. Whittaker (Ecological studies : analysis and synthesis, v. 14) Springer-Verlag, 1975 : New York : Berlin |
| [49] | Summary Annual and seasonal net primary productivity estimates (NPP) of 15 global models across latitudinal zones and biomes are compared. The models simulated NPP for contemporary climate using common, spatially explicit data sets for climate, soil texture, and normalized difference vegetation index (NDVI). Differences among NPP estimates varied over space and time. The largest differences occur during the summer months in boreal forests (50掳 to 60掳N) and during the dry seasons of tropical evergreen forests. Differences in NPP estimates are related to model assumptions about vegetation structure, model parameterizations, and input data sets. |
| [50] | |
| [51] | |
| [52] | Net primary productivity (NPP) represents the greatest annual carbon flux from the atmosphere to the biosphere, is an important component of seasonal fluctuations in atmospheric CO 2 concentrations, and is the most critical biotic component of the global carbon cycle. NPP measures products of major economic and social importance, such as crop yield and forest production. Given that global NPP can not be measured directly, model simulations must provide understanding of its global spatial and temporal dynamics. In this study, we used the biogeochemical model BIOME-BGC to simulate global terrestrial NPP and assessed relative importance of climatic controls (temperature, water availability, and radiation) in limiting NPP in the array of climatic combinations found globally. The degree of limitation on NPP by climatic controls was defined by using an empirical membership function. Results showed that temperature or water availability limited NPP over larger land areas (31% and 52%, respectively) than did radiation limitation (5%). Climatic controls appeared to be important in limiting productivity in most vegetation biomes, except for evergreen broadleaf forests. Nevertheless, there were areas of the globe (12%) where none of the climatic factors appeared to limit NPP. Our research has suggested that other environmental controls, such as nutrient availability or biological constraints, should then be considered. The wide distribution of NPP between zero and the upper boundary values in the correlation plots indicated that multivariate environmental balances, not single limiting factors, controlled biospheric productivity. |
| [53] | Actual evapotranspiration (AE) is shown to be a highly significant predictor of the net annual above-ground productivity in mature terrestrial plant communities. Communities included ranged from deserts and tundra to tropical forests. It is hypothesized that the relationship of AE to productivity is due to the fact that AE measures the simultaneous availability of water and solar energy, the most important rate-limiting resources in photosynthesis. 27 references, 1 figure, 1 table. |
| [54] | Interannual variability in aboveground net primary production (ANPP) was assessed with long-term (mean = 12 years) data from 11 Long Term Ecological Research sites across North America. The greatest interannual variability in ANPP occurred in grasslands and old fields, with forests the least variable. At a continental scale, ANPP was strongly correlated with annual precipitation. However, interannual variability in ANPP was not related to variability in precipitation. Instead, maximum variability in ANPP occurred in biomes where high potential growth rates of herbaceous vegetation were combined with moderate variability in precipitation. In the most dynamic biomes, ANPP responded more strongly to wet than to dry years. Recognition of the fourfold range in ANPP dynamics across biomes and of the factors that constrain this variability is critical for detecting the biotic impacts of global change phenomena. |
| [55] | |
| [56] | Numerous studies have suggested that biodiversity reduces variability in ecosystem productivity through compensatory effects; that is, a species increases in its abundance in response to the reduction of another in a fluctuating environment. But this view has been challenged on several grounds. Because most studies have been based on artificially constructed grasslands with short duration, long-term studies of natural ecosystems are needed. On the basis of a 24-year study of the Inner Mongolia grassland, here we present three key findings. First, that January-July precipitation is the primary climatic factor causing fluctuations in community biomass production; second, that ecosystem stability (conversely related to variability in community biomass production) increases progressively along the hierarchy of organizational levels (that is, from species to functional group to whole community); and finally, that the community-level stability seems to arise from compensatory interactions among major components at both species and functional group levels. From a hierarchical perspective, our results corroborate some previous findings of compensatory effects. Undisturbed mature steppe ecosystems seem to culminate with high biodiversity, productivity and ecosystem stability concurrently. Because these relationships are correlational, further studies are necessary to verify the causation among these factors. Our study provides new insights for better management and restoration of the rapidly degrading Inner Mongolia grassland. |
