 , ��ϲ, ��һ��, ����, ���ڲ�, ������
�Ӻ���ѧˮ��ˮ��Դ��ˮ�����̿�ѧ�����ص�ʵ���� ˮ��ˮ��ԴѧԺ,�Ͼ� 210098
Validation of watershed soil effective depth based on water balance and its effect on simulation of land surface water-carbon flux
HUANGRichao, CHENXi, SUNYimeng, GAOMan, CHENGQinbo, ZHANGYongshengͨѶ����:
�ո�����:2016-01-19
������:2016-03-24
�����������:2016-05-25
��Ȩ����:2016������ѧ�����༭�������ǿ��Ż�ȡ�ڿ����ף�����������¿�������ʹ�ã�ѧ���о���ѧ�����������н�ѧ�ȣ���������������ҵĿ��.
��������:
�����:
-->
չ��
ժҪ
�ؼ��ʣ�
Abstract
Keywords��
-->0
PDF (1827KB)Ԫ������ά��������������ղ�����
�������ø�ʽ����EndNoteRisBibtex�ղر���-->
��ȫ��仯������,ˮ��ѧ�����Ե�һˮѭ������Ϊ��Ҫ�о�����,����ˮ�֡��������������ѭ������̬ˮ��Ϊ��Ҫ�о����ݵ��ۺ��ԡ�������ѧ�Ʒ�չ[1],�о��߶ȴ�����߶��������ȫ��߶���չ��Ŀǰ,�ѷ�չ��һϵ�������ȫ��߶ȵ�½��ģ��,����ģ���Ԥ��½����ɢ�����������Լ�ֲ�����պ��ͷ�̼ͨ���ȡ���ȫ��ֲ̬��ģ����,LPJģ�ͣ�Lund-Potsdam-Jena Dynamic Global Vegetation Model�����㷺Ӧ��������仯������ֲ���仯��ˮ̼ͨ���仯�о�[2-8]����ģ����Sitch��[8]���ڹ��̵�ƽ��̬½������Ȧģ�ͣ�BIOMEģ��ϵ��[9]�����,����˾��л����Ե�½��ֲ����̬��̼��ˮģ�ͷ�չ����,֮���书�ܲ��ϵõ���չ,��������̬ϵͳˮ��̼��Ӫ������ģ��Ķ�ֲ̬�����������ѧ���ģ��LPJ-TEM[10],����ģ��ȫ��̼ѭ����ֲ����̬�����ģ�����ģ��[11],�Լ�����ʪ��ˮ�ļ�CH4ͨ���о���LPJ-WHYME[12]�ȡ�
��LPJģ���Լ�����½��ģ����,ˮƽ���������ȫ��ˮ��ѭ������������������ѭ����ϵĻ�����Ŧ��,ˮƽ�ⷽ��ͨ������Ϊ������ʽ��
ʽ�У�PΪ��ˮ��;ETΪʵ����ɢ����;RΪ������;WΪ������ˮ��,С�ڵ�����������ˮ������ˮ����WM����ʽ����һ����õ�λ���ˮ��,��ˮ�mm������P����ET������ȱˮ��֮��,��P > ET+(WM-W),��������ˮ,���γɣ��ر������£�������R�����,WM��ģ�Ͳ������������Ҫ������
WM����Ϊ�ر�����ijһ�����ֲ���ܹ����յ����ˮ��[13-14]��
ʽ�У���f����r�ֱ�Ϊ����ˮ�ʺ͵�ή��ˮ��;heΪ������Ч��Ȼ��ȡ�WMȡ�����������Ժ�ֲ��������;��f����rȡ���������ʵء��л��ʡ�����������;he��ֲ��������ȡ����ֲ����ϵ�������,����������ȡ������������[14]�����Ϲ���ũ��֯�����Ϲ��̿�����֯��FAO/Unesco��[15]����1971-1980�����106���������͵Ŀ�����ɡ�������ȷֲ�����WM�ֲ���Dunne[16]ͨ���ۺϷ���ȫ�������ʵء������л��ʺ�����ֲ����ϵ��Ⱥ��������,�����ȫ��0.50��0.50����WM�ֲ�,���ó�ȫ�������������ϼ�������⣩WMƽ��ֵΪ8.6 cm,30%��60%��89%��������ֱ����5 cm��10 cm��15 cm���й��������°���ģ�����±�ģ�ʹ�ʼ�����˿������о���Ϊ[17],WM�ڲ�ͬ���������ڲ���,��ʪ�������С,�ڸɺ����ϴ�,�糤������WM��12 cm����,����ɽ�����붫������,��16 cm���ҡ�
������Ч���he����ˮ����WM�仯��ˮ��̼ͨ��Ӱ������,��Milly[18]�о�����,��ȫ��ƽ��WM��4 cm���ӵ�60 cm,ȫ��ƽ����ɢ��������36%,��������35%;Feddema[19]��Ϊ������ˮ�ֿ�ȱ��WM���ٳ�����,��ʪ����WM�Ծ���Ӱ���Լ��ɺ���WM����ɢ��Ӱ����Ϊ������Ȼ��,LPJģ���Լ�������߶�½��ģ����,����ijһ�ض�������ȣ�he������ȫ�������½��ˮ����ƽ���Լ�ͨ������,����LPJ��he����Ϊ150 cm[5]��SSiB������Ϊ160 cm[20]��LPJģ��Ӧ����ȫ��ͬ����ˮ̼��̬�仯ģ��������,��ͬ��������ͬһheֵ�����ģ�ͼ����ˮ��ƽ���������[5]�����,��Ҫ���ݲ�ͬ�������Զ�he��������,��̽�����WM��½��ˮ̼��ͨ����Ӱ�졣
Ŀǰ,ͨ��ʵ������ȷ��he�ķ�����Ҫ������,һ�Ǹ�����������ʵ�⺬ˮ�ʱ仯���ݽ��й���,��Ladson��[14]�ռ��Ĵ�����180����������ʵ�⺬ˮ��,�������������к�ˮ�ʱ仯��������ȷ��he,�������ʪ�����ʱ������ˮ��ȷ��WM;��һ�����ۺϿ���ֲ����ϵ��ȷֲ�����������Լ��ռ��������he[16],�÷����о�����,�����ǵ�һ�µ������ػᵼ�¹����he���ڽϴ����,��Ladson��[14]����ֲ����ϵ�������,ɭ��ֲ����heֵ������1200 cm,�ݵغ�������heֵ������200 cm;��Dunne[16]��Ϊ������߶����������������ϵ֮�����,heֵ�������͡������ַ�����Ҫ��ϸ��ֲ�������Ƕȡ���ϵ�ֲ�������������ˮ�ʣ��ȹ۲�����,��ȱ���ɿ��Ĺ۲����ϵ���he��ֵ���ܴ�[14]����ʽ��1����֪,ˮ��ƽ����ۺϿ��Dz�ͬ�����µ���������������Ч���he������ˮ����WM������ɢ����������Ӱ��,���,���ĸ�������ʵ�⽵ˮ�����������Լ�DZ����ɢ��������,���������ֲ�������������Լ�ʵ����ɢ������ֲ�����ڡ��������������㷽��,�������ͬhe��WM�¾�����,�ٸ���ʵ�⾶������ģ�ͼ��㾶����֮�������С,����he��WM,������ԭLPJģ���м���Ĺ̶�������
Ϊ��,����ѡȡλ���й���ͬ��������3����������,�Զ���ˮ��ƽ��ΪĿ��,��3����������LPJģ��������Ч��Ƚ����������ڴ˻�����,�Աȷ���������Ч�������ǰ��������ˮ������LPJģ��ģ�������½��ͨ��������R,ʵ����ɢ��ET�;�����������NPP������,Ϊ��߸�ģ���ڲ�ͬ������Ӧ�ÿɿ����ṩ�ο����ݡ�
1 ����
1.1 LPJȫ��ֲ̬��ģ�ͼ�ˮ��̼���㷽��
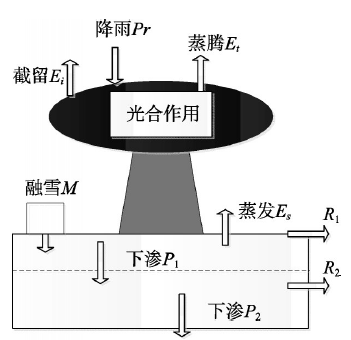
LPJģ����̼ƽ���ˮ��ƽ��Ϊ����,����������½��ֲ����̬�������ʹ���֮���ˮ��̼������̬����[5]����ģ����ÿ��������ˮƽ��ģ�ͼ�������ͼ1��ʾ,����,DZ���������������Priestley-Taylor��ʽ[5],ʵ����ɢ����ET[5]Ϊֲ������Et����������Es��ֲ������Ei���ߵ��ܺ�,��������������ֻ�����ڱ���20 cm�����ڡ�����������ü�ˮ��ģ��,�������Ϊ���㣨�ϲ���d1Ϊ50 cm,�²���d2Ϊ100 cm��,�����²�ˮ��ƽ�ʽ���£�ʽ�У�
�ܲ�����R�����ر�������R1�����¾�����R2�Լ��²���©��P2,�������£�
ʽ�У�fwhc1��fwhc2�ֱ�Ϊ���²���������ˮ��������ˮ�ʼ�ȥ��ή��ˮ�ʣ�;d1��d2�ֱ�Ϊ���²�������Ч��ȣ�cm��;RΪ�ܾ�������mm d-1��;w1��w2�ֱ�Ϊ���²�������ˮ�����������ˮ���ı�ֵ;��������֮�䲻���Dz���ˮ������������·��,����ˮ�������б��ļٶ�����ʱ���ڵ�����ˮ�����㵽������ڶ��档
LPJģ���е�̼ѭ��ģ��ģ��CO2��ֲ���������ʹ���֮��Ľ�������[4]������,������������NPP��ֲ������̼��ȡ��,Ϊ�ܳ��������л�õ�̼��ֲ��������ͷŵ�̼֮��ƽ����[2],����ʽ���£�
ʽ�У�GPPΪ�ܳ�����������g C m-2��;RmΪ����ֲ����������ά������Ҫ�ĺ������ã�g C m-2������GPP������,ˮ��в��ͨ���ڲ㵼�Ȳ����������÷�����ϵ��
1.2 ����ָ��
��ʽ��3��~��7����֪,ģ����ˮ��ƽ�������Ҫȡ�������²�������ˮ��������ʽ��5����6����fwhc1��d1��fwhc2��d2��,����,fwhc1��fwhc2�ɸ����������Ը���,���,ģ�ʹ��ʶ�����Ϊd1��d2��������ʵ��������¾�����������ERΪĿ�꺯��,�ʶ����²�������Ч��ȣ�d1��d2��,��ͳ��Nash-SutcliffeЧ��ϵ��ENS��ģ��ģ����¾������̽������ۡ�ER��ENS���㹫ʽ���£�ʽ�У�
 ��ʾԭͼ|����ԭͼZIP|����PPT
ͼ1��������ˮ��ƽ�������
-->Fig. 1The frame of the water balance computed for each grid
-->
2 �о����ſ�������
����ѡȡλ���й���ͬ��������3�������������������ż�ɽվ���ϣ�������������վ���ϣ�������������վ���ϣ���ͼ2��,������������1��ʾ������1���Կ������� ��ͬ���������������ˮ������ϴ�λ���Ϸ�ʪ������Ķ�����������꽵ˮ���ǰ�ʪ���ʪ��Ļ�������2����,�ǰ�ʪ��ɺ�����������4����;�� ������ľ�������Ƚ�ˮ�����Ϊ����,���������꾶���ǻ��������3.7��,�����������23.7��;�� ��ӳ����ɺ��̶ȵĸɺ�ָ�������������1.86,���ٵ����������1.17�����������0.59��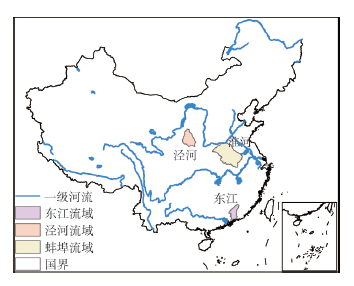 ��ʾԭͼ|����ԭͼZIP|����PPT
ͼ2�о���λ��ͼ
-->Fig. 2The location of the study regions
-->
���µ�����������,��������ɭ�ֵȸ߸���ֲ����Ҫ�����������ϲ���Եɽ��,λ�ڱ��������γء����ߵ��صĻ�����ԭ������ֲ��ϡ��,�������ɡ������������Ի������ͺ�����Ϊ��,������ԭ����������ȴ�180~200 m,���ڱ��꼯��,ˮ����ʧ����[21]������������Ȼֲ������Ҷ��Ҷ������Ҷ���ֵĻ콻��Ϊ��,������ҪΪ������ɳ��������ˮ����������������ֲ���������ȴ����곣����Ҷ�ֺ������ȴ��ݱ��Լ��˹�Ӫ�����Ҷ��,��������,��ɽ�ء������ѻ����̻�[22],���������Գ������������ˮ����Ϊ��[23]��
���IJ���1901-2000��0.5��
Tab. 1
��1
��1����������
Tab. 1List of basin characteristics
| ˮϵ | ��վ | ������� (km2) | �����ˮ�� (mm) | ��������� (mm) | �꾶��ϵ�� | �ɺ�ϵ�� | ���� |
|---|---|---|---|---|---|---|---|
| ���� | �ż�ɽ | 43216 | 454 | 40 | 0.09 | 1.86 | ��ʪ��ɺ� |
| ���� | ���� | 121330 | 863 | 256 | 0.30 | 1.17 | ��ʪ��ʪ�� |
| ���� | ���� | 25325 | 1827 | 947 | 0.52 | 0.59 | ʪ�� |
�´��ڴ�
3 �������
3.1 ����ˮ��ƽ���������Ч��ȷ���
����ˮ��ƽ�ⷴ��������Ч��ȵľ��巽��Ϊ���趨ʽ��4����5����d1�仯��ΧΪ20~130 cm���仯���Ϊ10 cm,d2�仯��ΧΪ10~300 cm���仯���Ϊ10 cm;ѡ��d1��d2��ͬ�������,ģ��1956-2000���ڼ䲻ͬd1��d2����¾�����,ͳ���¾�����ģ��ֵ��ʵ��ֵ֮�����ERֵ;ѡȡERֵ��Сʱ��Ӧ��d1��d2ֵΪģ����������²�������Ч���ֵhe������������Ϊ����ͼ3,��2�����Կ���,d1��60 cm��d2��80 cm����£�ͼ3��ʵ�߶�Ӧֵ��ER��СΪ0.1%��ENSֵ�ӽ����Ϊ47.3%����ģ����ԭ���õ�d1 = 50 cm��d2 = 100 cm�����ϣ�ͼ3�����߶�Ӧֵ����ȣ�ER = 10.0%,ENS = 45.9%��,he������ˮ��ƽ������������١�������������Ҳ������ͬ�ķ���,����3�������he����ֵ��ģ��ģ������Ч��ϵ���Ƚ������2��ʾ��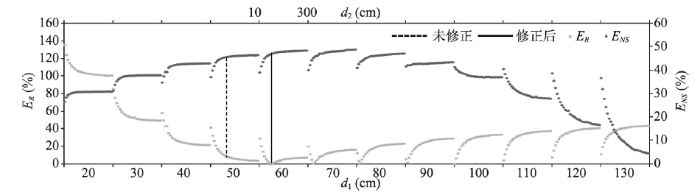 ��ʾԭͼ|����ԭͼZIP|����PPT
ͼ3��������������ER��Ч��ϵ��ENS�����²�������Ч��ȱ仯(������ÿ�����̶�֮���Ϊͬһd1ֵ,d2����������������(10~300 cm))
-->Fig. 3Efficiency coefficient and relative error against different effective depths of soil in the Jinghe River watershed (Between every two calibration values on the horizontal axis is the same value of d1, while d2 increases from left to right (10-300 cm))
-->
Tab. 2
��2
��2��Ч������ȡ���ˮ�����ʶ������ģ����ʵ�⾶�����ͳ��
Tab. 2The calibration result of effective thickness, soil water storage capacity and statistical error of simulated and measured runoff
| ���� | ���� | ���� | ���� | ||||||
|---|---|---|---|---|---|---|---|---|---|
| ����ǰ | ������ | ����ǰ | ������ | ����ǰ | ������ | ||||
| d1/d2 (cm) | 50/100 | 60/80 | 50/100 | 60/30 | 50/100 | 40/30 | |||
| WM (cm) | �����ֵ | 22.1 | 20.6 | 22.1 | 13.2 | 20.4 | 9.5 | ||
| �仯��Χ | 19.1~22.5 | 17.8~21.0 | 16.5~22.5 | 9.9~13.5 | 18.0~22.5 | 8.4~10.5 | |||
| ER (%) | 10.0 | 0.1 | 3.0 | 0.1 | 4.8 | 0.6 | |||
| ENS (%) | 45.9 | 47.3 | 53.8 | 54.6 | 60.9 | 58.0 | |||
�´��ڴ�
3�������������������Ч���he������������d1��d2֮�ͣ���70~140 cm֮�䣨��2��,��ԭģ����he����150 cmֵС����������ǰd1��d2֮�ͣ����Ա�he����ǰ��ˮƽ��Ա�,3������ģ���ˮ��ƽ�����ER�������,������������ER�ı����,��10%���ٵ�0.1%;��������ER��4.8%���ٵ�0.6%;��������ER�ı���С,��3%���ٵ�0.1%��ģ����̵�Ч��ϵ��ENSֵ�����ӡ����������������,�����������н���,Ч��ϵ��ENSֵ�仯������Ҫ������ģ��δ���ǻ��������Լ�ˮ���������õȡ�
��ÿ����������������ˮ����������Ч��ȵij˻�������������ˮ����WM,�ٸ������������Ȩƽ���������ƽ��WM����2����he����ǰ3������ƽ��WM����20.0 cm����,����֮����첻��;he������WMƽ��ֵ��ʪ��Ķ��������9.5 cm,���ӵ�ʪ��ʪ�������13.2 cm,��һ�����ӵ���ʪ��ɺ����������20.6 cm,�������еľ���ֵ�����[17]��
3.2 ½�澶��R��ʵ����ɢ��ET��������������NPPͨ��ģ����
������Ч���he����ǰ��3������ģ���1956-2000���꾶����������Լ�NPP����Ա�����3��ʾ,���Կ���,����ǰ�������R�仯�����,Ϊ50 mm;��������R�仯����С,Ϊ-4 mm;�����������м�,Ϊ9 mm�������꾶�����̱仯�����ϵ��Cv������,������������Ч���he��С,�������̱仯�̶�ȴ����,����,�����������������ʱ仯��Ϊ����,Cv������4%;����������ʱ仯��С,Cv������1.5%��Tab. 3
��3
��31956-2000��������Ч�������ǰ������ˮ��̼ͨ���ԱȽ��
Tab. 3The comparison of watershed flux of soil effective depth before and after correction during 1956-2000
| ���� | ���� | ||||||||||||||||
|---|---|---|---|---|---|---|---|---|---|---|---|---|---|---|---|---|---|
| ͨ�� | ʵ�� (mm) | δ���� | ������ | ʵ�� (mm) | δ���� | ������ | |||||||||||
| ģ�� (mm) | ER (%) | Cv (%) | ģ�� (mm) | ER (%) | Cv (%) | ģ�� (mm) | ER (%) | Cv (%) | ģ�� (mm) | ER (%) | Cv (%) | ||||||
| R | 40 | 44 | 10.0 | 69.0 | 40 | 0.1 | 73.0 | 256 | 247 | 3.0 | 38.3 | 256 | 0.1 | 39.5 | |||
| ET | 414 | 406 | 0.98 | 11.5 | 410 | 0.97 | 11.6 | 608 | 611 | 0.5 | 6.8 | 603 | 0.82 | 7.3 | |||
| NPP | 502 | 17.4 | 513 | 17.4 | 538 | 12.0 | 555 | 12.1 | |||||||||
| ���� | |||||||||||||||||
| ͨ�� | ʵ�� (mm) | δ���� | ������ | ||||||||||||||
| ģ�� (mm) | ER (%) | Cv (%) | ģ�� (mm) | ER (%) | Cv (%) | ||||||||||||
| R | 947 | 891 | 5.9 | 29.5 | 941 | 0.1 | 31.0 | ||||||||||
| ET | 880 | 931 | 5.56 | 4.0 | 882 | 0.23 | 4.7 | ||||||||||
| NPP | 622 | 8.7 | 621 | 13.7 | |||||||||||||
�´��ڴ�
��he����ǰ��3������ģ��Ķ���ƽ��ʵ����ɢ��ET��ˮ��ƽ�����ֵ��Pr-R���Ա���������3��,������ET������ER��С��1%������ǰ��3�������ET������R����,��������ET�������,������ǰ��931 mm���ٵ��������882 mm,��������5.56%���ٵ�0.23%;��������ET�ı���С,�仯ֵΪ4 mm;��������ET�ı䴦�����������м䡣��3������ET�����Cv������3��,������3������ET��ʱ仯�̶���������
������ǰ��LPJģ���NPP����Ա�����,��������ı������,Ϊ17 gCm-2a-1;��������ı�����С,ֻ��-1 gCm-2a-1;��������ı���Ϊ11 gCm-2a-1������������NPP��Cv����,������������Cv�仯����
3.3 R��ET��NPP�ռ�ֲ���������ǰ��ı仯
�����������������Ч���he,ͳ��3������ģ���1956-2000�����ƽ���꾶����R���ռ�ֲ���ͼ4��,���Կ���,3���������������R���������������ݼ������ơ��Ա�����ǰ�������R�仯,�������������������Rֵ��δ����ֵ�ձ����,�ϲ����ٽϱ���ƫ��,��С������1.5~6.3 mm֮��,���Ȩƽ��ֵ����4 mm����������������Rֵ������ǰ���Ȩƽ��ֵ����9 mm,������������Rֵ������ǰ����,����С��18.0 mm;�ϲ��ձ�����,���������60.1 mm����������������Rֵ������ǰ���Ȩƽ��ֵ����50 mm,����ֵ�ռ�仯��ΧΪ26.1~67.0 mm��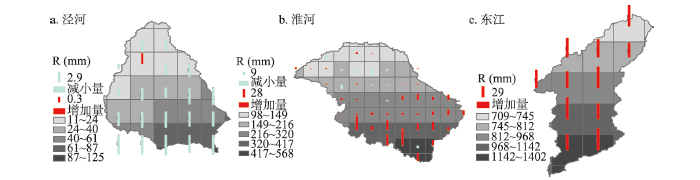 ��ʾԭͼ|����ԭͼZIP|����PPT
ͼ4�������ƽ����������R�ռ�ֲ�������ǰ��ı仯
-->Fig. 4The spatial distribution of annual mean runoff and the difference before and after correction
-->
������3���������ƽ��ʵ����ɢ��ET�ռ�ֲ��Լ�����ǰ����죨ͼ5�����Եó�,��������ͻ�������ET�ռ��ϳ����ɶ����������ݼ�������;���������в����,�ϱ�С,����ET���ֵλ���·Ὥ����ˮ����,���������õ�����SWATģ��ģ���ET�ռ�ֲ�����һ��[26]��������ǰ�������ET�����ķֲ���������,ET�仯��R�����Ŀռ�ֲ��෴,���������������������ETֵ����,�ϲ�������,�����������Ϊ6.1 mm;��������ijЩ�������������ǰ����,�ϲ��ձ����,�仯��ΧΪ-60~16.9 mm;��������ȫ�����������ǰ�������ϴ�,��С����Ϊ25.6~66.6 mm��
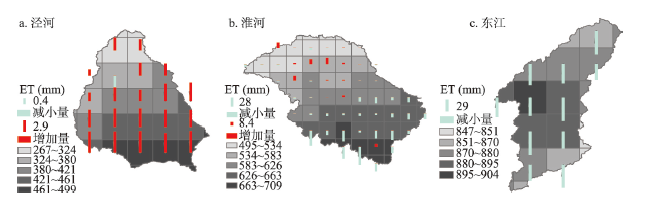 ��ʾԭͼ|����ԭͼZIP|����PPT
ͼ5�������ƽ��ʵ������ET�ռ�ֲ�������ǰ��ı仯
-->Fig. 5The spatial distribution of annual mean actual evapotranspiration and the difference before and after correction
-->
 ��ʾԭͼ|����ԭͼZIP|����PPT
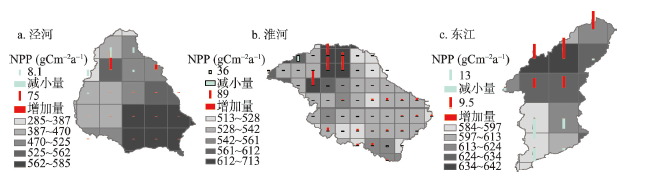
ͼ6�������ƽ����������������NPP�ռ�ֲ�������ǰ��ı仯
-->Fig. 6The spatial distribution of annual mean net primary production and the difference before and after correction
-->
�������3���������ƽ��NPP�ռ�ֲ�����ϴ�ͼ6������������NPP�ռ�仯��Χ��285~585 gCm-2a-1֮��,��������NPP���Ը�������;��������NPP�ռ�仯��Χ��513~713 gCm-2a-1֮��,��������NPP�������������;��������NPP�ռ�仯��ΧΪ584~642 gCm-2a-1,�б���NPP�����߸ߡ���������ǰ�������NPP�仯,��������ͻ�������NPP�仯���ϴ�,���Ӻͼ��ٽ�Ϊ����,����,��������NPP�������ֵΪ150.7 gCm-2a-1,��������NPP�������ֵΪ178 gCm-2a-1,�ϲ���������;���������������δ�����仯������-28.0~19.0 gCm-2a-1֮��,�ռ����ϲ��Լ���Ϊ��,����������Ϊ����
4 ���ۼ�չ��
��1�����Ļ���ˮ��ƽ���LPJģ����������Ч��Ƚ�������,����Ķ��������ӡ���������������Ч��ȷֱ�Ϊ70 cm��90 cm��140 cm,��ԭģ���в��õ�150 cm���С��������Ч��Ⱥ���ˮ������ʪ��Ķ�������ʪ��ʪ������,�Լ���ʪ��ɺ�������������������ơ�����������������Ч���,3������ģ���ˮ��ƽ�����ER�������,��1%���ڡ���2�����������ƽ��ˮ̼ͨ���仯����,������������ǰ������R��ʵ����ɢ��ET�仯�����,�ֱ�Ϊ50 mm��-49 mm;��������仯����С,�ֱ�Ϊ-4 mm��4 mm����������ǰ���NPP,��������仯�����,����������С,�ֱ�Ϊ17 gCm-2a-1��5 gCm-2a-1���ӹ��̱仯�����ϵ��Cv������,�����������R��ET��NPP��ʱ仯����
��3���������ڸ�����ˮ̼ͨ���ռ�仯����,�������������������ǰ���������ƽ��R�ձ����,���������ձ�����,�������������Լ���Ϊ��,�ϲ��ձ����ӡ�����ǰ����������ƽ��ET�����Ŀռ�ֲ���R�����Ŀռ�ֲ��෴������NPP,��������ͻ�������NPP�����仯����,�ϲ���������,���������ϲ��Լ���Ϊ��,����������Ϊ����
����ģ��������֮�䲢δ����ˮ������������·��,3������ģ������ENS��߲�������,���,���Ժ���о�����Ҫ��һ���о��������̡�
The authors have declared that no competing interests exist.
�ο����� ԭ��˳��
������ȵ���
������������
�����ڿ�Ӱ������
| [1] | . ������ˮ�Ĺ�����ֲ������� ���ɡ�������̬ˮ��ģ�͡�������̬ˮ�Ķ�����仯����Ӧ��������,�Թ���������о���״�������ܽ���������з���,��ǰ����ˮ��ѧ���ڴ��Ե�һˮѭ������ Ϊ��Ҫ�о�����չ�����о�ˮ�֡��������������ѭ���Լ�ˮ�Ĺ�������̬���̵�����õ�Ϊ��Ҫ���ݵ��ۺ��ԡ�������ѧ�ơ��ֹ�������ˮ�Ĺ�����ֲ��֮�� �Ĺ�ϵ�о��༯���ڵ������õ��о�,��ˮ�Ĺ��̶�ֲ����Ӱ���о���ֲ���仯��ˮ�Ĺ��̵�Ӱ���о�,����ˮ�Ĺ�����ֲ��֮��ķ��������Լ�������������-ֲ ��-��������ϵͳ�������о�����,ȱ��������ˮ�Ĺ�����ֲ������û�����ȫ����ʶ�����о�����,����仯�Ѿ�Ӱ�쵽����ˮ�Ĺ��̺�ֲ������,����仯�� ��������̬ˮ����Ӧ��ˮ��ѧ�о���ǰ�ؿ��⡣ˮ��ѧ��Ҫǿ����������̬ˮ�Ļ������о�,ֻ���ڳ�ֽ�ʾ������̬ˮ�Ļ�����ǰ����,����Ԥ��δ������仯�� ��������̬ˮ����Ӧ����̬������ԭ���ܹ�����ֲ������绷���仯����Ӧ,�Ӷ���Ӧ��������ֲ����ˮ�Ĺ��̵�����á�������̬������ԭ����������̬ˮ��ģ ������Ϊ��̬ˮ��ѧ���о��ȵ�֮һ�� . ������ˮ�Ĺ�����ֲ������� ���ɡ�������̬ˮ��ģ�͡�������̬ˮ�Ķ�����仯����Ӧ��������,�Թ���������о���״�������ܽ���������з���,��ǰ����ˮ��ѧ���ڴ��Ե�һˮѭ������ Ϊ��Ҫ�о�����չ�����о�ˮ�֡��������������ѭ���Լ�ˮ�Ĺ�������̬���̵�����õ�Ϊ��Ҫ���ݵ��ۺ��ԡ�������ѧ�ơ��ֹ�������ˮ�Ĺ�����ֲ��֮�� �Ĺ�ϵ�о��༯���ڵ������õ��о�,��ˮ�Ĺ��̶�ֲ����Ӱ���о���ֲ���仯��ˮ�Ĺ��̵�Ӱ���о�,����ˮ�Ĺ�����ֲ��֮��ķ��������Լ�������������-ֲ ��-��������ϵͳ�������о�����,ȱ��������ˮ�Ĺ�����ֲ������û�����ȫ����ʶ�����о�����,����仯�Ѿ�Ӱ�쵽����ˮ�Ĺ��̺�ֲ������,����仯�� ��������̬ˮ����Ӧ��ˮ��ѧ�о���ǰ�ؿ��⡣ˮ��ѧ��Ҫǿ����������̬ˮ�Ļ������о�,ֻ���ڳ�ֽ�ʾ������̬ˮ�Ļ�����ǰ����,����Ԥ��δ������仯�� ��������̬ˮ����Ӧ����̬������ԭ���ܹ�����ֲ������绷���仯����Ӧ,�Ӷ���Ӧ��������ֲ����ˮ�Ĺ��̵�����á�������̬������ԭ����������̬ˮ��ģ ������Ϊ��̬ˮ��ѧ���о��ȵ�֮һ�� |
| [2] | |
| [3] | ����1981-2010 ����ظ�ԭ80 ������̨վ�۲�����, ͨ���Ľ���LPJ ��ֲ̬��ģ��, ģ�Ⲣ��������ظ�ԭʵ����ɢ�����뽵ˮ��ƽ���ϵ(<em>P-E</em>) ��ʱ�ձ仯���о��������, �ڹ�ȥ��ʮ������ظ�ԭ��������Ա�ůΪ��Ҫ�����ı�����, ��ˮ��������������, DZ����ɢ�ʼ�������, �ر���2000 ����ǰ������������;��ظ�ԭ�ֵ���ʵ����ɢ����������, <em>P-E</em>�ı仯���Ƴ���������—���ϼ��ٵĿռ��֡�����ˮ����ɢ���������������ϻᵼ��ʵ����ɢ����, ����ظ�ԭ�ֵ���ʵ����ɢ����, ��ҪӰ�������ǽ�ˮ����, ʵ����ɢ������(����) ���Ƶ�������86% (73%) �Ľ�ˮ����(����)�� . ����1981-2010 ����ظ�ԭ80 ������̨վ�۲�����, ͨ���Ľ���LPJ ��ֲ̬��ģ��, ģ�Ⲣ��������ظ�ԭʵ����ɢ�����뽵ˮ��ƽ���ϵ(<em>P-E</em>) ��ʱ�ձ仯���о��������, �ڹ�ȥ��ʮ������ظ�ԭ��������Ա�ůΪ��Ҫ�����ı�����, ��ˮ��������������, DZ����ɢ�ʼ�������, �ر���2000 ����ǰ������������;��ظ�ԭ�ֵ���ʵ����ɢ����������, <em>P-E</em>�ı仯���Ƴ���������—���ϼ��ٵĿռ��֡�����ˮ����ɢ���������������ϻᵼ��ʵ����ɢ����, ����ظ�ԭ�ֵ���ʵ����ɢ����, ��ҪӰ�������ǽ�ˮ����, ʵ����ɢ������(����) ���Ƶ�������86% (73%) �Ľ�ˮ����(����)�� |
| [4] | <p>Lund-Potsdam-Jena Dynamic Global Vegetation Model (LPJ)ģ������Lund University, Potsdam Climate Research Centre��Max-Planck-Institute for Biogeochemistry, Jena���Ͽ�����ֲ����̬ģ�ͣ���ģ�������������ʵغ�CO<sub>2</sub>������Ϊ����ģ��ֲ���뻷����̼ˮ�������̡�Ϊ�����ø�ʱ��ֱ��ʵ��������ݣ���ģ�͵Ĵ�������˸�д����Ҵ����ӯ��վλ�ڸɺ��������͵�ũ����̬ϵͳ��Ӧ����۲�������ΪLPJ�����룬ģ������Ҵ������������̼ˮͨ���������ж��۲��DZ�Ⱥ�CO<sub>2</sub>ͨ����֤��ɢ����NEE��ģ�������������LPJģ���ܹ��Ϻõ�ģ�����������뻷��֮���̼ˮ��������ɢ����ET����ģ��ֵ��۲�ֵ��R<sup>2</sup>Ϊ0.8;NEE��ģ��ֵ��۲�ֵ��R<sup>2</sup>Ϊ0.79����<br /> </p> . <p>Lund-Potsdam-Jena Dynamic Global Vegetation Model (LPJ)ģ������Lund University, Potsdam Climate Research Centre��Max-Planck-Institute for Biogeochemistry, Jena���Ͽ�����ֲ����̬ģ�ͣ���ģ�������������ʵغ�CO<sub>2</sub>������Ϊ����ģ��ֲ���뻷����̼ˮ�������̡�Ϊ�����ø�ʱ��ֱ��ʵ��������ݣ���ģ�͵Ĵ�������˸�д����Ҵ����ӯ��վλ�ڸɺ��������͵�ũ����̬ϵͳ��Ӧ����۲�������ΪLPJ�����룬ģ������Ҵ������������̼ˮͨ���������ж��۲��DZ�Ⱥ�CO<sub>2</sub>ͨ����֤��ɢ����NEE��ģ�������������LPJģ���ܹ��Ϻõ�ģ�����������뻷��֮���̼ˮ��������ɢ����ET����ģ��ֵ��۲�ֵ��R<sup>2</sup>Ϊ0.8;NEE��ģ��ֵ��۲�ֵ��R<sup>2</sup>Ϊ0.79����<br /> </p> |
| [5] | Earth's vegetation plays a pivotal role in the global water balance. Hence, there is a need to model dynamic interactions and feedbacks between the terrestrial biosphere and the water cycle. Here, the hydrological performance of the Lund–Potsdam–Jena model (LPJ), a prominent dynamic global vegetation model, is evaluated. Models of this type simulate the coupled terrestrial carbon and water cycle, thus they are well suited for investigating biosphere–hydrosphere interactions over large domains. We demonstrate that runoff and evapotranspiration computed by LPJ agree well with respective results from state-of-the-art global hydrological models, while in some regions, runoff is significantly over- or underestimated compared to observations. The direction and magnitude of these biases is largely similar to those from other macro-scale models, rather than specific to LPJ. They are attributable primarily to uncertainties in the climate input data, and to human interventions not considered by the model (e.g. water withdrawal, land cover conversions). Additional model development is required to perform integrated assessments of water exchanges among the biosphere, the hydrosphere, and the anthroposphere. Yet, the LPJ model can now be used to study inter-relations between the world's major vegetation types and the terrestrial water balance. As an example, it is shown that a doubling of atmospheric COcontent alone would result in pronounced changes in evapotranspiration and runoff for many parts of the world. Although significant, these changes would remain unseen by stand-alone hydrological models, thereby emphasizing the importance of simulating the coupled carbon and water cycle. |
| [6] | The LPJ dynamic global vegetation and hydrology model with river routing is implemented on a compute cluster in order to reduce the overall computation time. In order to achieve this, a parallel algorithm had to be developed for the river routing part of the LPJ code. It can be shown that the run time of the parallel LPJ model scales well with the number of parallel tasks, even getting a super-linear speedup for 8–128 tasks. The sequential part of the model code can be estimated to be only 0.16%. This offers the opportunity, for example, to apply the model to find optimal climate change mitigation/adaptation paths requiring a multitude of subsequent simulation runs. The algorithm can also be used for networks with a different topology than river routing networks. |
| [7] | <p>Overall, the results show that the LPX-DGVM can successfully simulate runoff processes for small catchments in the UK. This study offers promising insights into the use of global-scale models and datasets for local-scale studies of water resources, with the eventual aim of providing local-scale projections of future water distributions. Copyright © 2013 John Wiley & Sons, Ltd.</p> |
| [8] | ABSTRACT |
| [9] | . . |
| [10] | |
| [11] | |
| [12] | For the first time, a model that simulates methane emissions from northern peatlands is incorporated directly into a dynamic global vegetation model. The model, LPJ-WHyMe (LPJ-Wetland Hydrology and Methane), was previously modified in order to simulate peatland hydrology, permafrost dynamics and peatland vegetation. LPJ-WHyMe simulates methane emissions using a mechanistic approach, although the use of some empirical relationships and parameters is unavoidable. The model simulates methane production, three pathways of methane transport (diffusion, plant-mediated transport and ebullition) and methane oxidation. Two sensitivity tests were conducted, first to identify the most important factors influencing methane emissions and secondly to justify the choice of parameters. A comparison of model results to observations from seven sites revealed in general good agreement but also highlighted some problems. Circumpolar methane emissions for the period 1961�1990 were estimated to be between 40.8 and 73.7 Tg CH4 a-1. |
| [13] | Abstract [1]69A long-standing challenge for hydrologists has been a lack of observational data on global-scale basin hydrological behavior. With observations from NASA's Gravity Recovery and Climate Experiment (GRACE) mission, hydrologists are now able to study terrestrial water storage for large river basins (>200,000 km 2 ), with monthly time resolution. Here we provide results of a time series model of basin-averaged GRACE terrestrial water storage anomaly and Global Precipitation Climatology Project precipitation for the world's largest basins. We address the short (10 year) length of the GRACE record by adopting a parametric spectral method to calculate frequency-domain transfer functions of storage response to precipitation forcing and then generalize these transfer functions based on large-scale basin characteristics, such as percent forest cover and basin temperature. Among the parameters tested, results show that temperature, soil water-holding capacity, and percent forest cover are important controls on relative storage variability, while basin area and mean terrain slope are less important. The derived empirical relationships were accurate (0.5465��65 E f 65��650.84) in modeling global-scale water storage anomaly time series for the study basins using only precipitation, average basin temperature, and two land-surface variables, offering the potential for synthesis of basin storage time series beyond the GRACE observational period. Such an approach could be applied toward gap filling between current and future GRACE missions and for predicting basin storage given predictions of future precipitation. |
| [14] | |
| [15] | . |
| [16] | Plant-extractable water capacity of soil is the amount of water that can be extracted from the soil to fulfill evapotranspiration demands. It is often assumed to be spatially invariant in large-scale computations of the soil-water balance. Empirical evidence, however, suggests that this assumption is incorrect. In this paper, we estimate the global distribution of the plant-extractable water capacity of soil.A representative soil profile, characterized by horizon (layer) particle size data and thickness, was created for each soil unit mapped by FAO (Food and Agriculture Organization of the United Nations)/Unesco. Soil organic matter was estimated empirically from climate data. Plant rooting depths and ground coverages were obtained from a vegetation characteristic data set. At each 0.5 0.5 grid cell where vegetation is present, unit available water capacity (cm water per cm soil) was estimated from the sand, clay, and organic content of each profile horizon, and integrated over horizon thickness. Summation of the integrated values over the lesser of profile depth and root depth produced an estimate of the plant-extractable water capacity of soil.The global average of the estimated plant-extractable water capacities of soil is 86cm (Greenland, Antarctica and bare soil areas excluded). Estimates are less than 5, 10 and 15 cm - over approximately 30, 60, and 89 per cent of the area, respectively. Estimates reflect the combined effects of soil texture, soil organic content, and plant root depth or profile depth. The most influential and uncertain parameter is the depth over which the plant- extractable water capacity of soil is computed, which is usually limited by root depth. Soil texture exerts a lesser, but still substantial, influence. Organic content, except where concentrations are very high, has relatively little effect. |
| [17] | |
| [18] | The sensitivity of the global water cycle to the water-holding capacity of the plant-root zone of continental soils is estimated by simulations using a mathematical model of the general circulation of the atmosphere, with prescribed ocean surface temperatures and prescribed cloud. With an increase of the globally constant storage capacity, evaporation from the continents rises and runoff falls, because a high storage capacity enhances the ability of the soil to store water from periods of excess for later evaporation during periods of shortage. In addition, atmospheric feedbacks associated with higher precipitation and lower potential evaporation drive further changes in evaporation and runoff. Most changes in evaporation and runoff occur in the tropics and the northern middle-latitude rain belts. Global evaporation from land increases by 7 cm for each doubling of storage capacity. Sensitivity is negligible for capacity above 60 cm. In the tropics and in the extratropics,increased continental evaporation is split between increased continental precipitation and decreased convergence of atmospheric water vapor from ocean to land. In the tropics, this partitioning is strongly affected by induced circulation changes, which are themselves forced by changes in latent heating. In the northern middle and high latitudes, the increased continental evaporation moistens the more» atmosphere. This change in humidity of the atmosphere is greater above the continents than above the oceans, and the resulting reduction in the sea-land humidity gradient causes a decreased onshore transport of water vapor by transient eddies. Results here may have implications for problems in global hydrology and climate dynamics, including effects of water resource development on global precipitation, climatic control of plant rooting characteristics, climatic effects of tropical deforestation, and climate-model errors. 21 refs., 13 figs., 21 tabs. «less |
| [19] | ABSTRACT This study uses a well-established water balance methodology, the Thornthwaite-Mather approach, to evaluate the effects of soil water holding capacity assumptions on estimates of African evapotranspiration rates, moisture deficit, and moisture surplus conditions. Under constant climate conditions, the model tests the impact of using a constant 150 mm soil water holding capacity compared to using a newly derived soil water holding capacity data set (the Dunne-Willmott data set). The study also uses a worldwide survey of soil degradation between 1950 and 1980 (GLASOD: Global Assessment of Soil Degradation) to evaluate the impacts of human-induced soil degradation on local water balances. The GLASOD data are used to alter local soil water holding capacities based on the Dunne-Willmott data to simulate human soil degradation patterns in Africa. Results indicate that the use of simplified soil water holding capacities can lead to significant errors in estimated evapotranspiration rates and water surplus and deficit conditions in Africa. Regions most affected are those with seasonal wet and dry climates, which are also those locations with the greatest climate variability. Because these are often the climates most studied to detect and model environmental change, it is important that accurate soil moisture estimates be used to simulate climate conditions in these regions. Results also indicate that soil degradation occurring over a 30 yr period (1950 to 1980) has had a significant impact on local water resources. The greatest impacts of these changes are in some of the more productive agricultural areas in the wetter sub-humid climates. Changes include increased runoff during wet seasons and an extended drought period during the dry seasons. Given that these agricultural systems have less flexibility to respond to long-term desiccation as compared to pastoral systems, this could lead to significant changes in local growing seasons and perhaps overall productivity in the future. |
| [20] | |
| [21] | ֲ���˻���ȫ���仯�о���һ���ص����⣬ֲ��״���ǻ�����������Ҫָ�ꡣ����8km�ֱ��ʵ�NOAA-AVHRR/NDVIʱ���������ݣ���λ�ڻ�����ԭ����������1982~2003��ֲ���������仯״������ϵͳ���������ڴ˻�������������������ֲ�������ϵ���о���Ҫ�����˱仯б�ʷ������ɷַ���������ط��������õ����½��ۣ���ȥ22a������ֲ��NDVI��ֵ�����ͱ仯����С���仯�����������������������κ������Ե��ɽ�����仯б�ʷ����ó������ƵĽ��ۣ�����仯�Լ��������µ��������øı������Ӱ��������ͬ����ֲ��״̬�仯����Ҫԭ��NDVIʱ�����е����ɷַ�������PC1��PC2��ֲ�����Ǻ�����������ϵ��PC3��PC4������Ѵ�ں�ˮ�йأ�PC5��PC6������������Ӱ�졣�����NDVI�뽵����ʾ�����õ�����ԣ�������NDVI����Ե���ֵ������550mm����ߡ� . ֲ���˻���ȫ���仯�о���һ���ص����⣬ֲ��״���ǻ�����������Ҫָ�ꡣ����8km�ֱ��ʵ�NOAA-AVHRR/NDVIʱ���������ݣ���λ�ڻ�����ԭ����������1982~2003��ֲ���������仯״������ϵͳ���������ڴ˻�������������������ֲ�������ϵ���о���Ҫ�����˱仯б�ʷ������ɷַ���������ط��������õ����½��ۣ���ȥ22a������ֲ��NDVI��ֵ�����ͱ仯����С���仯�����������������������κ������Ե��ɽ�����仯б�ʷ����ó������ƵĽ��ۣ�����仯�Լ��������µ��������øı������Ӱ��������ͬ����ֲ��״̬�仯����Ҫԭ��NDVIʱ�����е����ɷַ�������PC1��PC2��ֲ�����Ǻ�����������ϵ��PC3��PC4������Ѵ�ں�ˮ�йأ�PC5��PC6������������Ӱ�졣�����NDVI�뽵����ʾ�����õ�����ԣ�������NDVI����Ե���ֵ������550mm����ߡ� |
| [22] | [D]. [D]. |
| [23] | |
| [24] | |
| [25] | |
| [26] | �����ڷֲ�ʽˮ��ģ��SWAT�Լ�SUFI-2����Զ������������51a(1960��2010��)�¾���ģ��,���ڴ˻����������˶�������ˮ�Ĺ��̵Ŀռ���졣ģ��������,��Դվ���·Ὥˮ��Ӱ��,ģ������ȷ���Խϴ�,ȷ����ϵ��R2��Nash-SutcliffeЧ��ϵ���������վ��ϵ�,����վ������վ������վR2��Nash-SutcliffeЧ��ϵ��������ģ��������Ҫ��������ڲ���վ�ʶ���R2��Nash-SutcliffeЧ��ϵ���ֱ�Ϊ0.83��0.83,��֤��Ϊ0.84��0.84,ģ��ģ�⾫�Ƚϸߡ���������������Ҫ�ܽ�ˮ�ռ䲻��Ӱ��,�γ��ɱ�����������������ơ������µ������Բ�������Ҳ��һ��Ӱ�졣����������ˮ�����������ʡ�������Ӱ��,�ɱ����ϲ�������;��ɢ������ֲ������Ӱ�����Ϊ����,������ɢ��ռ�������ı��������в����ϲ��� . �����ڷֲ�ʽˮ��ģ��SWAT�Լ�SUFI-2����Զ������������51a(1960��2010��)�¾���ģ��,���ڴ˻����������˶�������ˮ�Ĺ��̵Ŀռ���졣ģ��������,��Դվ���·Ὥˮ��Ӱ��,ģ������ȷ���Խϴ�,ȷ����ϵ��R2��Nash-SutcliffeЧ��ϵ���������վ��ϵ�,����վ������վ������վR2��Nash-SutcliffeЧ��ϵ��������ģ��������Ҫ��������ڲ���վ�ʶ���R2��Nash-SutcliffeЧ��ϵ���ֱ�Ϊ0.83��0.83,��֤��Ϊ0.84��0.84,ģ��ģ�⾫�Ƚϸߡ���������������Ҫ�ܽ�ˮ�ռ䲻��Ӱ��,�γ��ɱ�����������������ơ������µ������Բ�������Ҳ��һ��Ӱ�졣����������ˮ�����������ʡ�������Ӱ��,�ɱ����ϲ�������;��ɢ������ֲ������Ӱ�����Ϊ����,������ɢ��ռ�������ı��������в����ϲ��� |
