 , 陶海燕, 李旭亮
Discovering urban functional regions using latent semantic information: Spatiotemporal data mining of floating cars GPS data of Guangzhou
CHENShili, TAOHaiyan, LIXuliang通讯作者:
收稿日期:2015-07-30
修回日期:2015-11-27
网络出版日期:2016-03-25
版权声明:2016《地理学报》编辑部本文是开放获取期刊文献,在以下情况下可以自由使用:学术研究、学术交流、科研教学等,但不允许用于商业目的.
基金资助:
作者简介:
-->
展开
摘要
关键词:
Abstract
Keywords:
-->0
PDF (1093KB)元数据多维度评价相关文章收藏文章
本文引用格式导出EndNoteRisBibtex收藏本文-->
1 引言
城市化是重要的全球性社会经济现象,而城市化中的功能多元化则是城市发展的基础.功能多元化形成的城市功能分工[1],为人们的居住,工作,游憩和交通提供着各方面的便利.传统的城市功能分区研究大多是采用土地利用类型现状图,调查问卷等数据,利用各种聚类或者建立指标体系等方法来对城市功能区域进行划分[2-12].数据的获取不仅耗时耗力效率低,且确定权重系数时主观因素太强.随着信息和通讯技术的发展,城市中大量的传感器,例如,全球定位系统(Global Position System, GPS),全球移动通信系统(Global System for Mobile, GSM),智能卡收费系统数据(Smart Card Data, SCD)等,可以获取大规模的,高质量的个体时空数据.这些移动定位数据获取成本低,覆盖范围广,且具有时态特性.因此,结合大数据和数据挖掘,通过人们日常行为反映城市功能分区,可以为城市研究提供一种新的方法和途径.近年来,大量国外****使用手机数据,公交车数据[13-15],GPS数据[16]以及LBS(Location Based Service)数据[17-21]开展土地利用分类,城市功能区划,活动轨迹等方面研究.同时,随着国内智慧城市建设的推广以及大数据相关研究的深入,相继有****[16, 22-30]采用GPS数据和公交车数据,通过Google软件,数据挖掘工具,建立各种模型等来研究城市空间结构.
开展城市功能分区的研究有利于合理,健康地规划未来城市.近年来,已有****采用大数据开展人们出行规律和特征等方面的研究[21-25, 31],而通过挖掘大数据中的海量潜在语义信息来辅助开展城市空间结构中的城市功能分区的研究还相对较少.因此本文拟采用在文本分类领域中能快速挖掘出海量文本中潜在语义的主题模型(LDA模型和DMR模型),以广州市为例,提取浮动车轨迹数据和兴趣点数据的潜在语义信息,然后,通过OPTICS聚类方法对不同模型处理后的结果进行聚类,并对聚类后的类别进行识别.研究结果表明,该方法能有效地识别广州市不同类型的功能区,对城市规划,政策制定,资源配置等各个领域具有辅助和引导价值.
2 研究方法和思路
潜在的狄利克雷分布(Latent Dirichlet Allocation, LDA)是一种主题模型,由Blei等于2003年提出[32].它是当前文本处理研究的范式之一,可以对文字隐含主题进行建模,不仅弥补了信息检索中传统的文本相似度计算方法的不足,并且更适合基于大规模语料库(乃至于海量互联网数据)寻找文字间的语义主题[32-33].此模型能确定一个语料库中的每一篇文档有多个主题的概率,能充分提取出一句话或者一个单词的语义信息.根据LDA模型理论,语料库中的每一篇文档都可以看作是由多个主题混合产生的,文档的每一个单词都是来自一个主题.当给定一个文档的所有单词的情况下,可以通过数学推导得到文档对应的主题分布.此模型能确定一个语料库中的每一篇文档属于多个主题的概率,能充分提取出一句话或者一个单词的语义信息.
LDA的计算模型[31]如图1所示.每个结点表示一个随机变量,并且根据其在生成过程中的角色予以标记,白色表示隐藏变量,灰色表示观测变量,矩形框内的变量表示需要循环计算,而箭头则表示参数和变量作用的方向.
 显示原图|下载原图ZIP|生成PPT
图1LDA模型
-->Fig. 1Latent Dirichlet Allocation model
-->
这里的α和η分别为狄利克雷文档--主题分布和主题--单词分布的输入参数.假设文档有K个主题,β是一个
显然,城市功能分区研究和文本表示研究具有一定的相似性.把一个区域映射为一篇文档,区域中的功能看作一个主题,每个区域内的居民出行活动当作单词,一个功能区域可以看作居民出行活动的集合,它包括交通设施,活动的人,相互作用等的输入[34].
狄利克雷多项式回归(Dirichlet Multinomial Regression, DMR)模型因其参数中需要输入先验数据,使得实验结果更贴近现实情境,与基本模型LDA相比更有优势[35].DMR模型中的先验α对每一个区域的αi而言,结合了每一个区域的POI特征项矢量.例如:
而本文中,移动模式M用一个元组表示:
式中:
研究的实现步骤如下:
(1)提取出海量浮动车数据中的起讫点(O/D)对,并通过公式(1)实现了起讫点(O/D)对与移动模式转换的一一映射;
(2)基于Mallet平台[36]建立LDA模型和DMR模型对移动模式进行处理;
(3)LDA和DMR是非监督学习模型,本身不能用于分类,需要嵌入合适的聚类算法,所以对DMR模型处理后得到的每个功能区每种主题的概率分布,采用OPTICS聚类方法得到城市功能分区的结果;
(4)利用POI类别密度方法,居民出行特征以及问卷调查结果对分区结果进行标识;
(5)利用土地利用现状图对识别结果进行精度验证,调查问卷中某区域的研究结果与功能分区相对应的空间位置的区域特征进行对比分析,分析理论与实际的差异以及背后的原因.
3 研究数据和研究区域
研究数据由广东瑞图万方科技股份有限公司提供,其数据说明参见表1.在保证研究代表典型性的前提下,综合考虑研究对象的空间分布和时间演化,采用2014年广州行政区划调整前的范围,即传统的广州市老八区(其中芳村区已并入荔湾区,东山区则并入越秀区)[37].同时,选取了高速公路,城市快速道,国道,省道,城市主干道,城市次干道6个等级道路把广州市老城区分割为439个区域.然而,又因华南快速干线上部的白云区部分区域主要以风景区,农田及山体组成,所以,本文将该区域独立出来,直接视为风景区,而不纳入研究范围.Tab. 1
表1
表1研究数据说明
Tab. 1Data specification
| 数据 | 年份 | 数量 | 详细说明 |
|---|---|---|---|
| 广州市区划图 | 2014年 | 选取广州市白云区,海珠区,黄浦区,越秀区,荔湾区以及天河区为研究对象 | |
| 道路网络数据 | 2014年 | 1028条 | 选取高速公路,快速路,国道,省道,城市主干道及城市次干道的道路功能等级为道路分割对象 |
| 兴趣点数据 | 2014年 | 182504个 | 研究对象范围内的所有兴趣点 |
| 浮动车轨迹数据 | 2013年 | 2万辆(1.315亿条) | 选取研究对象范围内的所有GPS点并提取其OD点对进行分析 |
| 居民出行调查问卷 | 2013年 | 1152份 | 调查问卷的对象,时间,主题 |
新窗口打开
兴趣点(Point Of Interest, POI)是导航,智能交通,基于位置服务等应用中一种重要的基础数据.本文所选取的POI数据的类别大类划分为15种,中类划分为65种.其中,每一个POI点,编号由大类+中类+序号组成,包括名字,经度,纬度等属性.根据本文的研究目的和需求,并经过多次试验,将POI数据合并为29个类别.需要说明的是本文中暂未考虑同一类别中不同等级兴趣点对结果可能造成的影响.
浮动车轨迹数据每隔5s左右采集一次,记录的基本信息包括出租车的车牌号码,时间,经纬度,速度,方位和载客状态等.本文采用2013年10月8日(周二)到10月14日(周一),历时一周的GPS数据.
4 基于语义信息的广州市城市功能区识别
4.1 城市功能分区结果
应用研究的实现步骤,得到9种功能分区(F0~F8)结果(图2,图3).对比不同颜色代表的不同功能区(两图中相同的颜色可能代表不同的功能类型),可见LDA模型方法与DMR模型方法得出了大致相同的功能区域的结果,而后者在部分细节区域的区分效果更显著,例如广交会展馆和五山校区.因此本文中选择DMR模型方法结果进行聚类和识别. 显示原图|下载原图ZIP|生成PPT
图2LDA模型结果
-->Fig. 2The result of LDA model
-->
 显示原图|下载原图ZIP|生成PPT
图3DMR模型结果
-->Fig. 3The result of DMR model
-->
4.2 城市功能分区识别方法
通过建模实现相同功能的区域的聚类,之后需要根据区域的实际功能进行标识.城市功能区的分类标准很多,功能区的划分也各不相同,本文主要根据社会功能,居民需求等进行划分,主要分为:科教文化区,居住区,商业娱乐区,开发区等,并根据人类活动的密集程度对部分功能区细化为成熟区和新兴区.在这里主要是根据已有数据识别功能区,通过以下三个方面来识别城市的一个功能区:
(1)计算得出每种功能区的FD(Frequency Density),即通过计算每一类POI在每类功能区中的密度,并对其进行内部索引排序即IR(Internal Ranking),从而得到该类型区域内POI的分布特征,推测该类型区域能实现的功能.其中第
其结果如表2所示.F0至F8表示不同类型的功能区,FD为POI密度,IR为单一功能区中不同POI密度的排序索引,越靠前密度值越大.颜色深浅则表示单一POI种类在不同功能区中的分布情况,较深则代表集中分布,反之亦然.
Tab. 2
表2
表2POI密度和功能区排序
Tab. 2Overall POI density vector and ranking of functional zones (FD: Frequency Density, IR: Internal Ranking, F: Functional Zones)
| POI类别 | F0 | F1 | F2 | F3 | F4 | F5 | F6 | F7 | F8 | |||||||||||||||||
|---|---|---|---|---|---|---|---|---|---|---|---|---|---|---|---|---|---|---|---|---|---|---|---|---|---|---|
| FD | IR | FD | IR | FD | IR | FD | IR | FD | IR | FD | IR | FD | IR | FD | IR | FD | IR | |||||||||
| 国际国外组织机构 | 0.0000 | 23 | 0.0008 | 26 | 0.0007 | 26 | 0.0005 | 28 | 0.0026 | 24 | 0.0000 | 27 | 0.0000 | 22 | 0.0000 | 25 | 0.0000 | 25 | ||||||||
| 技术开发 | 0.0000 | 24 | 0.0035 | 23 | 0.0032 | 21 | 0.0025 | 21 | 0.0085 | 18 | 0.0022 | 22 | 0.0047 | 19 | 0.0002 | 23 | 0.0393 | 16 | ||||||||
| 综合性大学 | 0.0000 | 25 | 0.0049 | 20 | 0.0054 | 19 | 0.0033 | 20 | 0.0060 | 21 | 0.0090 | 15 | 0.0000 | 23 | 0.0007 | 21 | 0.0187 | 19 | ||||||||
| 综合医院 | 0.0000 | 26 | 0.0037 | 22 | 0.0004 | 28 | 0.0023 | 23 | 0.0012 | 25 | 0.0004 | 25 | 0.0000 | 24 | 0.0000 | 26 | 0.0075 | 23 | ||||||||
| 广播电台 | 0.0005 | 22 | 0.0031 | 25 | 0.0015 | 23 | 0.0012 | 25 | 0.0028 | 23 | 0.0015 | 23 | 0.0000 | 25 | 0.0002 | 24 | 0.0019 | 24 | ||||||||
| 会展中心 | 0.0000 | 27 | 0.0002 | 28 | 0.0011 | 25 | 0.0006 | 27 | 0.0002 | 29 | 0.0000 | 28 | 0.0000 | 26 | 0.0000 | 27 | 0.0000 | 26 | ||||||||
| 博物馆 | 0.0000 | 28 | 0.0008 | 27 | 0.0007 | 27 | 0.0008 | 26 | 0.0005 | 27 | 0.0000 | 29 | 0.0000 | 27 | 0.0000 | 28 | 0.0000 | 27 | ||||||||
| 体育机构各类场馆 | 0.0038 | 18 | 0.0167 | 17 | 0.0116 | 17 | 0.0113 | 16 | 0.0120 | 15 | 0.0071 | 16 | 0.0156 | 16 | 0.0035 | 16 | 0.0187 | 20 | ||||||||
| 银行和保险服务 | 0.0213 | 9 | 0.1024 | 6 | 0.0827 | 7 | 0.0678 | 5 | 0.0857 | 5 | 0.0373 | 8 | 0.0779 | 6 | 0.0233 | 8 | 0.1758 | 5 | ||||||||
| 农场林场,果场生产 | 0.0066 | 15 | 0.0035 | 24 | 0.0015 | 24 | 0.0025 | 22 | 0.0039 | 22 | 0.0052 | 17 | 0.0000 | 28 | 0.0009 | 19 | 0.0206 | 18 | ||||||||
| 园艺销售 | 0.3623 | 1 | 0.0218 | 16 | 0.0187 | 16 | 0.0064 | 18 | 0.0068 | 19 | 0.0052 | 18 | 0.0125 | 17 | 0.0023 | 18 | 0.0094 | 21 | ||||||||
| 电脑网络高新技术 | 0.0027 | 20 | 0.0599 | 8 | 0.0718 | 9 | 0.0601 | 7 | 0.2128 | 2 | 0.0523 | 6 | 0.0405 | 12 | 0.0042 | 15 | 1.2590 | 1 | ||||||||
| 纺织服装生产厂 | 0.0776 | 5 | 0.4281 | 1 | 0.1597 | 3 | 0.0967 | 3 | 0.0772 | 7 | 0.1318 | 3 | 0.4798 | 1 | 0.2385 | 1 | 0.2469 | 4 | ||||||||
| 化工原料及制品 | 0.0169 | 10 | 0.0586 | 9 | 0.0748 | 8 | 0.0292 | 13 | 0.0429 | 10 | 0.0358 | 9 | 0.0374 | 13 | 0.0138 | 11 | 0.0804 | 8 | ||||||||
| 宾馆住宿 | 0.0098 | 12 | 0.0523 | 11 | 0.0600 | 10 | 0.0408 | 9 | 0.0538 | 9 | 0.0314 | 10 | 0.0561 | 8 | 0.0203 | 9 | 0.0692 | 10 | ||||||||
| 酒吧,咖啡 | 0.1290 | 3 | 0.3013 | 2 | 0.2379 | 2 | 0.2183 | 1 | 0.2221 | 1 | 0.1736 | 1 | 0.2430 | 3 | 0.1342 | 3 | 0.3349 | 3 | ||||||||
| 娱乐业 | 0.0098 | 13 | 0.0468 | 12 | 0.0506 | 11 | 0.0337 | 12 | 0.0386 | 12 | 0.0288 | 11 | 0.0607 | 7 | 0.0119 | 13 | 0.0561 | 13 | ||||||||
| 旅游业 | 0.0087 | 14 | 0.0430 | 14 | 0.0444 | 13 | 0.0340 | 11 | 0.0319 | 13 | 0.0105 | 14 | 0.0421 | 11 | 0.0170 | 10 | 0.0486 | 14 | ||||||||
| 自行车修理 | 0.0066 | 16 | 0.0041 | 21 | 0.0021 | 22 | 0.0017 | 24 | 0.0006 | 26 | 0.0015 | 24 | 0.0031 | 20 | 0.0007 | 22 | 0.0000 | 28 | ||||||||
| 开发区 | 0.0000 | 29 | 0.0000 | 29 | 0.0000 | 29 | 0.0001 | 29 | 0.0003 | 28 | 0.0004 | 26 | 0.0000 | 29 | 0.0000 | 29 | 0.0000 | 29 | ||||||||
| 商务办公楼 | 0.0038 | 19 | 0.0444 | 13 | 0.0491 | 12 | 0.0351 | 10 | 0.0423 | 11 | 0.0250 | 12 | 0.0436 | 10 | 0.0068 | 14 | 0.0823 | 7 | ||||||||
| 大厦/写字楼 | 0.0011 | 21 | 0.0077 | 19 | 0.0066 | 18 | 0.0053 | 19 | 0.0092 | 17 | 0.0052 | 19 | 0.0171 | 15 | 0.0009 | 20 | 0.0094 | 22 | ||||||||
| 住宅区 | 0.0317 | 7 | 0.2254 | 3 | 0.2521 | 1 | 0.1869 | 2 | 0.1646 | 4 | 0.1374 | 2 | 0.2196 | 4 | 0.0299 | 6 | 0.4284 | 2 | ||||||||
| 布匹,服装辅料销售 | 0.0109 | 11 | 0.0985 | 7 | 0.0277 | 15 | 0.0272 | 15 | 0.0105 | 16 | 0.0045 | 21 | 0.0078 | 18 | 0.0128 | 12 | 0.0318 | 17 | ||||||||
| 批发部 | 0.1366 | 2 | 0.1071 | 4 | 0.0842 | 6 | 0.0630 | 6 | 0.0833 | 6 | 0.0478 | 7 | 0.0467 | 9 | 0.0306 | 5 | 0.0786 | 9 | ||||||||
| 商场商厦,购物中心 | 0.0240 | 8 | 0.0423 | 15 | 0.0334 | 14 | 0.0281 | 14 | 0.0253 | 14 | 0.0228 | 13 | 0.0327 | 14 | 0.0247 | 7 | 0.0599 | 11 | ||||||||
| 物流仓储,速递运输 | 0.0322 | 6 | 0.0568 | 10 | 0.0864 | 5 | 0.0483 | 8 | 0.0558 | 8 | 0.0975 | 5 | 0.0872 | 5 | 0.1594 | 2 | 0.0861 | 6 | ||||||||
| 车船修理,销售租赁 | 0.0853 | 4 | 0.1046 | 5 | 0.1080 | 4 | 0.0854 | 4 | 0.1992 | 3 | 0.1090 | 4 | 0.2664 | 2 | 0.0866 | 4 | 0.0599 | 12 | ||||||||
| 道路附属 | 0.0060 | 17 | 0.0092 | 18 | 0.0049 | 20 | 0.0070 | 17 | 0.0068 | 20 | 0.0052 | 20 | 0.0016 | 21 | 0.0026 | 17 | 0.0412 | 15 | ||||||||
新窗口打开
(2)通过每个功能区周末和工作日的移动模式频率,即离开和到达该功能区的频次,探索该类型区域人群移动规律,从而推测功能区类型,其结果如图4所示.
 显示原图|下载原图ZIP|生成PPT
图4工作日和周末到达/离开功能区域的频次
-->Fig. 4Frequency of arrival/departure of functional regions on weekdays and weekends
-->
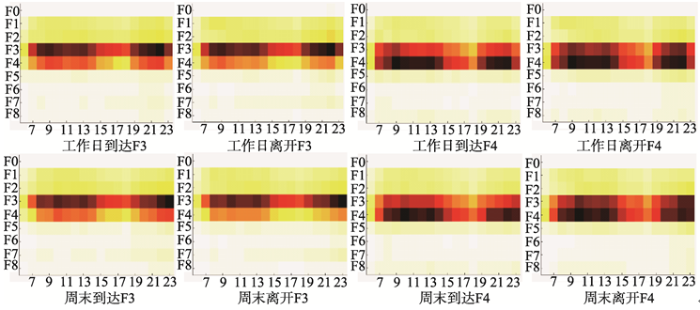
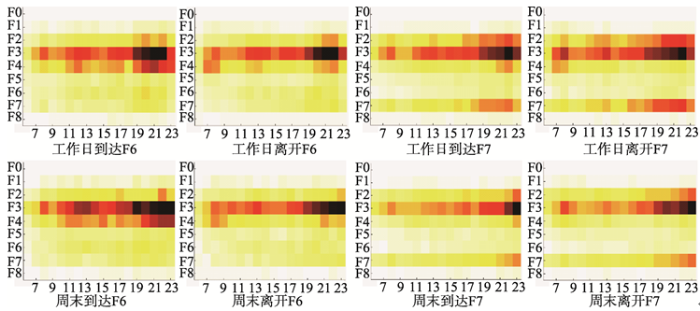
另外,利用Matlab(2014a)对浮动车的起讫点进行计算,得到从早上6:00开始到晚上24:00结束的时间段内,工作日和周末到达以及离开某种功能区的热点图.横坐标表示一天内时间变化,纵坐标代表不同的功能区,颜色越深表示出现的频次越高,反之亦然(图5,图6,图7).
 显示原图|下载原图ZIP|生成PPT
图5工作日和周末到达与离开功能区域F1,F2
-->Fig. 5Weekday and weekend arrival/departure regions of F1 and F2
-->
 显示原图|下载原图ZIP|生成PPT
图6工作日和周末到达与离开区域F3,F4
-->Fig. 6Weekday and weekend arrival/departure regions of F3 and F4
-->
 显示原图|下载原图ZIP|生成PPT
图7工作日和周末到达与离开区域F6,F7
-->Fig. 7Weekday and weekend arrival/departure regions of F6 and F7
-->
(3)经验标注.对于一个长久居住在一个城市中的经验者,他们非常清楚地知道城市的地标建筑和最能体现城市特色的区域,例如,区域中包含的琶洲国际会展中心,大家肯定会认同这个区域是一个会展区.在实验中完成聚类,得到城市功能区后,有经验的人们可以帮助我们更好地标注,识别功能区,可以得到更详细,准确的城市功能分区结果.
4.3 识别结果
利用以上城市功能区的识别方法,结合POI密度排序(表2),周末/工作日每个小时的流量特征(图4)以及工作日/周末的到达/离开每个功能区的热点图(图5,图6,图7)的数据,发现F1~F5功能覆盖齐全,进出人流量持续较大,说明F1~F5建设比较完善,从而得出其为成熟建成区;相应地,F0,F6~F7为欠发达或正待开发地区.而F8因其功能区域内部的POI数目和GPS数据过少,无法正确地识别功能区的类别,因此,本文未对F8区域进行识别.下面对聚类所得结果进行功能识别:(1)花卉园林[F0].这个功能区大都由栽培花卉园林的种植地,花卉园林的公司,湿地公园以及其他景区(例如,宗祠)组成.从F0的FD值可以看出(表2),园艺销售,林场生产在这个功能区中占据较高比例.所以,本文把F0归为以花卉园林生产为主要特色的欠发达区域.虽然其地方偏僻,但仍有少量人前往,同时城中村中的居住人口相对拥挤,这也导致这个功能区具有早晚高峰出行量较多的现象.
(2)成熟专业批发区[F1].这个功能区包含了广州市具有特色的批发市场和销售市场,例如,广州国际轻纺城即专业布匹及辅料批发市场,特别地,这个功能区中还包括了作为汽车销售,建材销售的赛马场.但围绕批发区含有居民居住以及生活的各种完善的配套设施,这个功能区属于城市建设,规划比较早的区域,其本身有多种功能(表2,图5),但区域中的居民仍然有对外活动以及出行的需求,所以,其对外活动相对较多.
(3)风景名胜地[F2].这个功能区与F1有相似之处,都是比较成熟的城市规划建成区(表2).同时,这个功能区有很多风景名胜和地标建筑,例如,广州塔,海心沙,奥林匹克体育中心,世界大观,华南植物园等,进出口交易中心(广交会展馆).这个区域工作日相对F1而言,早上基本没有出行高峰期,周末10:00-14:00之间却有较高的到达峰值(图4a,4b),这与表2中会展中心,旅游业等POI类别排序比较靠前的结果相一致.
(4)成熟居住,文化区[F3].这个功能区不仅具有大量成熟,高级的居住区并且还含有广州市传统文化景区,例如,白云公园,烈士陵园等,同时还有中山大学的南校区,北校区以及一些综合性医院和大量生活服务设施.文化教育在POI密度排序中的比值较大(表2);工作日的早上7:00-10:00是居民出行的高峰期,晚上22:00是居民搭乘出租车回到住宿的高峰期;周末的早上的10:00-13:00是居民出行的高峰期,而23:00是居民回程的峰值(图4a,4b).
(5)成熟商业娱乐区[F4].该功能区具有以大厦,写字楼,批发销售市场,餐饮以及购物等为主的兴趣点数据分布特征,同时其中包含较多的居民区分布.广州典型商业购物,娱乐地,例如北京路和上下九也在其中.北京路是由大量大型商场构成,上下九主要是由服务业组成.这也说明,这个功能区以服务业为主.同时,通过具有流量特征的图4以及图6,可以看出该功能区工作日下班时段(20:00-23:00)会出现到达流量高蜂,说明很多居民在该功能区内的区域中活动,不仅表现在功能区中区域内部大量的活动,且含有功能区外的居民希望进入这一地区参与活动,其功能区主要以商业(CBD),开发区为主.
(6)科教文化区[F5].这个功能区包含大量的科研机构和教育学校等POI信息(例如华南师范大学,华南理工大学,华南农业大学,暨南大学等).这个功能区中的区域人口流动表现在:周末前往F3区域,而在工作日前往F4的人流较多.由于大学生的活动时间相对比较自由,所以其出行存在任意性.
(7)交通连接区[F6].这个功能区中的区域是广州重点区域及交通热点,用于连接市区内外的其他区域,所以包含一些娱乐生活设施,但更主要的还是与居住相关的设施(表2).此外,全时间段有一定量前往其他区域的车流量且呈均匀分布(图7).
(8)待开发工业区[F7].此功能区中的区域位于广州北部郊外,是功能非常局限的待开发区域,由于这些区域正处于建设,发展阶段,所以其物流运输的占比相对较大(表2).同时,这个区域因其房价成本相对低廉,也包含一些布匹和服装等生产工厂.此郊区以产业为主,前往F1,F2功能区的人流要少于更具吸引力,更成熟的F3,F4区域(图6).
(9)未识别区域[F8].因其功能区中区域内部的POI数目和GPS数据过少,导致OPTICS聚类未能识别出功能区.所以,本文未对这个功能区中的区域进行分析.
5 精度验证
为了检验DMR模型应用于城市功能区识别的效果,参考百度地图的地理信息,将研究得到的广州市功能区域划分结果与广州市2007年的城镇用地现状图,居民日常出行特征对比分析.综合考虑广州市商住以及居住高度混合的用地现状与研究结果对比分析,DMR模型能对广州市主要的功能区有效地进行识别,具有一定的准确度.其中,若干典型地区的对比结果如表3所示.Tab. 3
表3
表3识别结果与现状的对照分析
Tab. 3The comparisons between recognized results and realities
| 对照区域 | 中国进出口商品交易会展馆(广交会展馆) |
|---|---|
| 对照图 | |
| 识别结果 | 识别图中A区域(深红色)为文化区与现状图A区域相一致 |
| 对照区域 | 五山区是高校(老教学区)云集地,包含华南理工,华南农业,华南师范,暨南大学等均在此有校区,是广州市的科教文化区 |
| 对照图 | |
| 识别结果 | B区域在百度地图中为科教区与识别图中的B区域(粉色)相互对应 |
| 对照区域 | 亚洲单体建筑面积最大的现代化纺织品批发市场----广州国际轻纺城 |
| 对照图 | |
| 识别结果 | 百度地图中的F区域即用红色圈标出的区域和识别图中的F区域相一致 |
新窗口打开
本文使用的调查问卷包括了3种预设类型的社区,每种类别的社区体现出与本文研究中识别的城市功能区有相类似的空间分布特征和居民行为规律.特别地,以越秀区的旧城社区(洪庆坊社区,三眼井社区)为例,体现出居民的分布以及出行活动特征符合本文判定的城市功能区的类别.
在城市功能区中的F1功能区中与洪庆坊社区和三眼井社区位置重合的区域具有城市建设,规划比较早的区域结论(表2,图5).而在调查问卷中,越秀区的旧城社区体现出具备各类社会功能,就业机会充裕,机关,单位大院型用地的复合程度并不高的特征;而功能区F1也具有较为完善齐全的生活配套和公共服务设施.同时,F1功能区中与两个社区相对应的区域(表2),在上午和下午的工作时段维持活跃度高值,午间时分出现一个活跃度谷值;下班(18:30)后进入活动低活跃期并渐次收敛,至晚上23:00后才能基本恢复平静,与图4a规律类似.
总体而言,调查问卷发放区域与本文划分的不同类别的功能区中重合的部分,都具有相类似的居民日常出行的时空特征.旧城区的居民以上午7:00开始活动,至晚上23:00后才基本恢复平静(图5,图6,图7).特别地,外来人口集中的城市商业集聚区的居民,一天活动开始的时间相对更早;下班后活动密度稍有下降但仍保持一定水平,没有出现急剧回落的情况.
6 结论与讨论
结合文本分类思想和传统城市功能分区的理念,基于人们日常移动行为的大数据,运用潜在语义的主题模型(LDA模型和DMR模型)开展城市功能分区研究,在传统方法的基础上拓展了通过居民行为探究城市空间结构的研究思路,为城市研究提供一种新的方法和途径,为发展和验证城市理论提供了一种重要的分析手段.以广州市为例,采用连续一周的浮动车GPS数据以及29类POI数据,建立潜在的狄利克雷模型(LDA)以及狄利克雷多项式回归模型(DMR),得到研究区域属于不同功能的概率;其次,通过OPTICS聚类方法对不同模型的结果进行聚类;然后,利用POI类别密度,居民出行特征等对分区结果进行识别;最后,利用土地利用现状图,百度地图及问卷调查验证其功能分区识别结果.
研究发现,广州市不同类型的功能区呈现出不同的功能特征,如:专业批发区主要以批发市场和销售市场为主,尤其以轻纺城为代表;风景名胜地主要以广州市的风景区为主,包括广州塔,海心沙,华南植物园等地标性建筑物和景区;商业娱乐区主要以大厦,写字楼为主,餐饮,购物其次,同时具有服装生产和运输业发达的特点.而各个行政区也具有不同的功能特征,例如,白云区以白云山的风景区为主,辅以轻工业以及交通要道功能区;天河区主要以商业娱乐区为主,居住休闲等设施完善的生活区为辅;越秀区,总体上以居住区和商业区为主导,其它类型功能区围绕其展开的特点.该结果采用百度地图,现状图以及调查问卷对识别结果进行验证,与广州市的实际情况基本符合.
由于本文选择浮动车GPS数据和兴趣点数据作为主要的数据源,尽管反映出的客观规律值得借鉴,但是仅仅以出租车GPS数据代表人们的日常出行行为存在一定的偏差,今后拟结合公交数据,地铁数据等公共交通数据开展进一步研究;同时会进一步研究同一类别中不同等级兴趣点对结果可能造成的影响.此外,使用地理空间大数据进行功能分区的研究存在一些不足[31],例如活动频率与人口密度密切相关,频率的特征既可能是规律性的也存在特殊事件引起的噪音等,这里并未做过细的区分,在后续研究中将结合大数据和人口统计数据等多源数据进行深入分析和研究.
The authors have declared that no competing interests exist.
参考文献 原文顺序
文献年度倒序
文中引用次数倒序
被引期刊影响因子
| [1] | |
| [2] | . <h2 class="secHeading" id="section_abstract">Abstract</h2><p id="">The morphology of a city affects its ecological and socioeconomic functions, and thus how a city is spatially structured has important bearings on urban sustainability. The paper analyzes the spatial pattern of Beijing in relation to its urban functions. Our results show that the 6 concentric ring-roads in Beijing provide a basic framework for the city's overall spatial pattern, and also give its apparent resemblance to the classic concentric zone theory. The paper identifies 5 concentric zones for Beijing based on a suite of urban functions. However, there are significant differences between the urban spatial pattern of Beijing and that depicted in the classic concentric zone theory. The study sheds new light on the urban morphology of one of the major Chinese cities, and provides needed information for developing plans to diffuse urban functions in Beijing.</p> |
| [3] | . . |
| [4] | . . |
| [5] | . 本文通过探讨聚类分析的模式相似性测度,计算方法和步骤,结合土地利用的实际,提出了分类指标,并给出了土地利用聚类分析的计算方法和步骤。 . 本文通过探讨聚类分析的模式相似性测度,计算方法和步骤,结合土地利用的实际,提出了分类指标,并给出了土地利用聚类分析的计算方法和步骤。 |
| [6] | . 城市功能分区是指运用有关模型和方法,使城市空间形成明确的功能单元和有序的空间结构,空间聚类是城市功能分区的一种常用方法。基于自组织映射神经网络,该文提出了一种组合式的城市功能区聚类方法,根据位置-属性一体化思想,综合考虑了影响城市功能分区的位置数据和属性信息,对城市功能区进行空间聚类计算。该方法挖掘了空间位置数据和属性信息中隐含的空间聚集信息,保证了城市功能分区结果的可靠性。实例分析表明,该方法的聚类结果可以为城市功能分区提供准确、可靠的依据。 <BR><BR> . 城市功能分区是指运用有关模型和方法,使城市空间形成明确的功能单元和有序的空间结构,空间聚类是城市功能分区的一种常用方法。基于自组织映射神经网络,该文提出了一种组合式的城市功能区聚类方法,根据位置-属性一体化思想,综合考虑了影响城市功能分区的位置数据和属性信息,对城市功能区进行空间聚类计算。该方法挖掘了空间位置数据和属性信息中隐含的空间聚集信息,保证了城市功能分区结果的可靠性。实例分析表明,该方法的聚类结果可以为城市功能分区提供准确、可靠的依据。 <BR><BR> |
| [7] | . 以知识为基础、以计算机与信息技术为依托、技术与制度创新驱动、兼跨第二与第三产业并以服务业居重、高度外向而趋于全球化的当代"新经济"的兴起,正从诸多方面影响和改变着城市。本文以西安市为实证分析案例,依据对"新经济"内在禀赋特性的认识,从城市"产业区"格局重构、城市办公楼宇设施增长、高新技术产业区的CBD化、产业与居住功能分区的模糊化、城市经济与社会空间的极化等方面对城市"新经济"发展的空间影响效应进行了分析,并就其对于城市规划与决策的启示予以探讨。 . 以知识为基础、以计算机与信息技术为依托、技术与制度创新驱动、兼跨第二与第三产业并以服务业居重、高度外向而趋于全球化的当代"新经济"的兴起,正从诸多方面影响和改变着城市。本文以西安市为实证分析案例,依据对"新经济"内在禀赋特性的认识,从城市"产业区"格局重构、城市办公楼宇设施增长、高新技术产业区的CBD化、产业与居住功能分区的模糊化、城市经济与社会空间的极化等方面对城市"新经济"发展的空间影响效应进行了分析,并就其对于城市规划与决策的启示予以探讨。 |
| [8] | . <p>从阐释开发区“特区”运作机制、“新经济”型产业结构、配套住宅开发策略等特有开发模式及内在结构特性入手,以西安市为实证案例,以翔实的调研数据为支撑,剖析了开发区建设发展与城市经济—社会空间极化分异之关联及其典型过程与效应;并通过开发区与非开发区、新城与老城、新经济区与旧产业区之间在投资强度、发展速度、软硬环境、形象面貌、经济活力与潜力、人口成分与素质等诸多方面分异对比日益鲜明的一系列事实,论证了开发区建设发展已成为强化凸显当代中国城市经济—社会空间极化演变的机制之一。研究结果有助于更深入全面地认识评估“开发区”——这一机制独特、存在广泛、极富改革开放新时期特色的城市发展模式之影响与绩效。</p> . <p>从阐释开发区“特区”运作机制、“新经济”型产业结构、配套住宅开发策略等特有开发模式及内在结构特性入手,以西安市为实证案例,以翔实的调研数据为支撑,剖析了开发区建设发展与城市经济—社会空间极化分异之关联及其典型过程与效应;并通过开发区与非开发区、新城与老城、新经济区与旧产业区之间在投资强度、发展速度、软硬环境、形象面貌、经济活力与潜力、人口成分与素质等诸多方面分异对比日益鲜明的一系列事实,论证了开发区建设发展已成为强化凸显当代中国城市经济—社会空间极化演变的机制之一。研究结果有助于更深入全面地认识评估“开发区”——这一机制独特、存在广泛、极富改革开放新时期特色的城市发展模式之影响与绩效。</p> |
| [9] | . <p>基于西安市第二次基本单位普查数据库等资料,对以高新技术密集制造业、新技术密集公共服务业、生产者商务服务业三大产业组群为主体的“新经济”在典型中国城市发展的空间特征及其机制予以解析。结果显示:“新经济”增长与发展格局受“路径依赖”及“新区位创生”双重效应影响,“地理靠近”依然是“新经济”活动获取有利区位条件的主要策略;两个国家级开发区、老城商业中心区、以及大学/科研/文教单位密集区是西安“新经济”生长发展主要区段;其中,高新技术产业开发区因其特有运作机制而成为城市新经济体系的组织中枢与增长核心。</p> . <p>基于西安市第二次基本单位普查数据库等资料,对以高新技术密集制造业、新技术密集公共服务业、生产者商务服务业三大产业组群为主体的“新经济”在典型中国城市发展的空间特征及其机制予以解析。结果显示:“新经济”增长与发展格局受“路径依赖”及“新区位创生”双重效应影响,“地理靠近”依然是“新经济”活动获取有利区位条件的主要策略;两个国家级开发区、老城商业中心区、以及大学/科研/文教单位密集区是西安“新经济”生长发展主要区段;其中,高新技术产业开发区因其特有运作机制而成为城市新经济体系的组织中枢与增长核心。</p> |
| [10] | . 作为空间数据挖掘的一种重要手段,空间聚类目前已在许多领域得到了应用,它是城市功能分区中 的关键性步骤。根据空间一属性一体化的概念模型,把影响城市功能分区的空间坐标、空间关系和属性特征纳入到统一的空间计算模型,分别运用K-平均算法、神 经网络方法,对城市功能分区进行空间聚类计算,充分挖掘空间坐标和空间关系数据中隐含的空间聚集信息。实例分析表明,基于神经网络的空间聚类结果可以为城 市功能分区提供准确、可靠的依据。 . 作为空间数据挖掘的一种重要手段,空间聚类目前已在许多领域得到了应用,它是城市功能分区中 的关键性步骤。根据空间一属性一体化的概念模型,把影响城市功能分区的空间坐标、空间关系和属性特征纳入到统一的空间计算模型,分别运用K-平均算法、神 经网络方法,对城市功能分区进行空间聚类计算,充分挖掘空间坐标和空间关系数据中隐含的空间聚集信息。实例分析表明,基于神经网络的空间聚类结果可以为城 市功能分区提供准确、可靠的依据。 |
| [11] | . 有效的功能分区是城市系统健康有序发展的保障。本文构建评价指标体系, 采用系统 聚类分析方法, 在功能分区视角下将西安市九个辖区分为核心区、雁塔区、未央区、长安区、 灞桥区及临潼-阎良区六个功能区域。中心商务区主导下核心区商贸流通业发达, 高新技术 产业开发区与曲江文化产业示范区主导下雁塔区技术经济与文化产业特色鲜明, 经济技术开 发区主导下未央区工业经济特征明显, 郭杜教育科技产业开发区与国家民用航天产业基地强 化长安区科教文化发展方向, 浐灞生态区彰显灞桥区生态经济发展特色, 生态农业区、阎良 飞机城加快临潼、阎良两区传统农业发展转型。功能分区及发展空间分异是城市化与经济发 展、历史基础与路径依赖、规模经济与集聚效应、本底化与特色化等基础因子以及新经济与 开发区建设、宏观调控与政策导向等新型因子综合驱动的结果, 基础因子起缓慢影响与逐渐 推进的辅助作用, 新型因子起突变影响与直接推动的主导作用。研究有助于科学认识城市, 合理组织城市, 提供实践参考。 . 有效的功能分区是城市系统健康有序发展的保障。本文构建评价指标体系, 采用系统 聚类分析方法, 在功能分区视角下将西安市九个辖区分为核心区、雁塔区、未央区、长安区、 灞桥区及临潼-阎良区六个功能区域。中心商务区主导下核心区商贸流通业发达, 高新技术 产业开发区与曲江文化产业示范区主导下雁塔区技术经济与文化产业特色鲜明, 经济技术开 发区主导下未央区工业经济特征明显, 郭杜教育科技产业开发区与国家民用航天产业基地强 化长安区科教文化发展方向, 浐灞生态区彰显灞桥区生态经济发展特色, 生态农业区、阎良 飞机城加快临潼、阎良两区传统农业发展转型。功能分区及发展空间分异是城市化与经济发 展、历史基础与路径依赖、规模经济与集聚效应、本底化与特色化等基础因子以及新经济与 开发区建设、宏观调控与政策导向等新型因子综合驱动的结果, 基础因子起缓慢影响与逐渐 推进的辅助作用, 新型因子起突变影响与直接推动的主导作用。研究有助于科学认识城市, 合理组织城市, 提供实践参考。 |
| [12] | 阐述了城市土地利用功能区的基本概念、分区的基本原则和各个功能 区的特性,简述模糊聚类分析方法的基本思想和特征,详述了运用模糊聚类进行城市功能区划分的基本流程和具体步骤,重点是指标的选取和相似系数的确定.以大 同市新荣区为例对模糊聚类在城市土地利用功能分区上的应用进行实例研究,并对聚类出来的结果进行了客观的分析,分析了所研究内容的应用前景和作用. 阐述了城市土地利用功能区的基本概念、分区的基本原则和各个功能 区的特性,简述模糊聚类分析方法的基本思想和特征,详述了运用模糊聚类进行城市功能区划分的基本流程和具体步骤,重点是指标的选取和相似系数的确定.以大 同市新荣区为例对模糊聚类在城市土地利用功能分区上的应用进行实例研究,并对聚类出来的结果进行了客观的分析,分析了所研究内容的应用前景和作用. |
| [13] | . |
| [14] | . ABSTRACT Rapid tranit systems are the most important public transportation service modes in many large cities around the world. Hence, its service reliability is of high importance for government and transit agencies. Despite taking all the necessary precautions, disruptions cannot be entirely prevented but what transit agencies can do is to prepare to respond to failure in a timely and effective manner. To this end, information about daily travel demand patterns are crucial to develop efficient failure response strategies. To the extent of urban computing, smart card data offers us the opportunity to investigate and understand the demand pattern of passengers and service level from transit operators. In this present study, we present a methodology to analyze smart card data collected in Singapore, to describe dynamic demand characteristics of one case mass rapid transit (MRT) service. The smart card reader registers passengers when they enter and leave an MRT station. Between tapping in and out of MRT stations, passengers are either walking to and fro the platform as they alight and board on the trains or they are traveling in the train. To reveal the effective position of the passengers, a regression model based on the observations from the fastest passengers for each origin destination pair has been developed. By applying this model to all other observations, the model allows us to divide passengers in the MRT system into two groups, passengers on the trains and passengers waiting in the stations. The estimation model provides the spatio-temporal density of passengers. From the density plots, trains' trajectories can be identified and passengers can be assigned to single trains according to the estimated location. Thus, with this model, the location of a certain train and the number of onboard passengers can be estimated, which can further enable transit agencies to improve their response to service disruptions. Since the respective final destination can also be derived from the data set, one can develop effective failure response scenarios such as the planning of contingency buses that bring passengers directly to their final destinations and thus relieves the bridging buses that are typically made available in such situations. |
| [15] | Cities are complex systems. They contain different functional areas originally defined by planning and then reshaped by actual needs and use by the inhabitants. Estimating the functions of urban space is of significant importance for detecting urban problems, evaluating planning strategies, and supporting policy making. In light of the potential of data mining and spatial analysis techniques for urban analysis, this paper proposes a method to infer urban functions at the building level using transportation data obtained from surveys and smart card systems. Specifically, we establish a two-step framework making use of the spatial relationships between trips, stops, and buildings. Firstly, information about the travel purposes for daily activities is deduced using passengers鈥 mobility patterns based on a probabilistic Bayesian model. Secondly, building functions are inferred by linking daily activities to the buildings surrounding the stops based on spatial statistics. We demonstrate the proposed method using large-scale public transportation data from two areas of Singapore. Our method is applied to identify building functions at building level. The result is verified with master plan, street view, and investigated data, and limitations are identified. Our work shows that the presented method is applicable in practice with a good accuracy. In a broader context, it shows the effectiveness of applying integrated techniques to combine multi-source data in order to make insights about social activities and complex urban space. |
| [16] | . City-scale human mobility analysis is an important problem in pervasive computing. In this paper, with qualitative and quantitative analysis, we establish and confirm the relationship between the get-on/off characteristics of taxi passengers and the social function of city regions. We find that get-on/off amount in a region can depict the social activity dynamics in that area, i.e. the temporal variation of get-on/off amount can characterize the social function of a region. The experimental results on a large-scale real-world taxi dataset suggest that three typical regional categories can be recognized even using a very simple classification method. |
| [17] | . Studying the social dynamics of a city on a large scale has traditionally been a challenging endeavor, requiring long hours of observation and interviews, usual |
| [18] | Since the economic reforms of 1979 the physical representation of socialist ideology and state power imposed on Beijing during the Mao era has been transformed by ideological, economic, and social changes. Focusing on the rapid transformation of the urban landscape after 1979, this article examines urban-planning strategy and the effect of changes in industry, housing, commerce, and transportation on urban form. Traditional Chinese urban form and socialist urban structure continue to shape the city, despite rapid change that is bringing Beijing closer in form to cities in other developing countries. The data presented in this article were collected during fieldwork in 1992, 1993, and 1994 as part of a study of recent urban planning and development in Beijing, Shanghai, Xiamen, and Guangzhou.TRADITIONAL BEIJINGBeijing is a venerable city steeped in the grandest of northern and imperial traditions. It has served as the national capital for much of the time since the founding of the Liao dynasty in the tenth century A.D. It has been a major regional political center from as early as the Warring States period (453-221 B.C.). City form in 1949 retained many patterns dating to the Ming dynasty (1368-1644) (Hou 1983). The street network and all monumental architecture were aligned with the cardinal directions to conform with Chinese geomancy, and massive crenellated walls bounded most of the site. The stone-faced walls enclosed two adjoining areas: a square imperial city on the north, which contained the walled palace complex as well as the homes and temples of the city's political elites; and a rectangular area on the south, which contained the commercial and common residential districts. Between the few monumental axis roads that traversed the city, residential neighborhoods of courtyard houses were threaded by hutongs - narrow alleyways separating the high, blank walls of the courtyards. The imperial palace, a few monumental structures such as temples and the bell-and-drum towers, and hundreds of hutongs and old neighborhoods still survive.Pre-1949 Beijing had several distinctive districts that serve similar functions today. Two of these districts - the imperial city and the Qianmen-Dazhalan market - date to the Ming dynasty. Two late-nineteenth-century districts also survive: the Wangfujing Street shopping area east of the palace complex, which served as the commercial district for the foreign community, and the university district on the northwest, which developed around the Harvard-Yenching Institute.Traditional Beijing, like most Chinese cities, was characterized by a high degree of neighborhood specialization. Members of craft guilds plied their trades as groups in specific neighborhoods. Other neighborhoods specialized in activities ranging from the academic nurturing of the next generation of bureaucrats to the provision of services for foreign legations. Present-day street names often recall past functions.SOCIALIST BEIJINGDuring the 1950s, 1960s, and 1970s, Mao Zedong's socialism reshaped the city. New development was structured around large walled work-unit compounds, where people lived as small communities centered on the workplace. The compounds consisted of three-to-five-story blocklike buildings that accommodated varied enterprises such as housing, production facilities, dining halls, and infirmaries. In the work-unit-based city, neighborhoods were relatively undifferentiated by function (Pannell 1980). Chinese cities in the 1949-1978 era were planned on the assumption that most residents would rarely need to travel beyond their compounds. There were no private cars and few taxis. Wide monumental streets that ran between the high compound walls were traversed primarily by buses, trucks, and bicycles, but traffic was sparse.Although the Maoist urban structure was realized in newly developed areas, preexisting structures - specifically the complex maze of courtyard housing and winding hutongs - constrained development in the old districts. 鈥 |
| [19] | . ABSTRACT This paper explores the use of textual and event-based citizen-generated data from services such as Twitter and Foursquare to study urban dynamics. It applies a probabilistic topic model to obtain a decomposition of the stream of digital traces into a set of urban topics related to various activities of the citizens in a course of the week. Due to the combined use of implicit textual and movement data, we obtain seman-tically rich modalities of the urban dynamics and overcome the drawbacks of several previous attempts. Other impor-tant advantages of our method includes its flexibility and robustness with respect to the varying quality and volume of the incoming data. We describe an implementation archi-tecture of the system, the main outputs of the analysis, and the derived exploratory visualizations. Finally, we discuss the implications of our methodology for enriching location-based services with real-time context. |
| [20] | ABSTRACT Human-generated textual data streams from services such as Twitter increasingly become geo-referenced. The spatial resolution of their coverage improves quickly, making them a promising instrument for sensing various aspects of evolution and dynamics of social systems. This work explores spacetime structures of the topical content of short textual messages in a stream available from Twitter in Ireland. It uses a streaming Latent Dirichlet Allocation topic model trained with an incremental variational Bayes method. The posterior probabilities of the discovered topics are post-processed with a spatial kernel density and subjected to comparative analysis. The identified prevailing topics are often found to be spatially contiguous. We apply Markov-modulated non-homogeneous Poisson processes to quantify a proportion of novelty in the observed abnormal patterns. A combined use of these techniques allows for real-time analysis of the temporal evolution and spatial variability of population's response to various stimuli such as large scale sportive, political or cultural events. |
| [21] | . This paper studies the problem of discovering and comparing geographical topics from GPS-associated documents. GPSassociated documents become popular with the pervasiveness of location-acquisition technologies. For example, in Flickr, the geo-tagged photos are associated with tags and GPS locations. In Twitter, the locations of the tweets can be identified by the GPS locations from smart phones. Many interesting concepts, including cultures, scenes, and product sales, correspond to specialized geographical distributions. In this paper, we are interested in two questions: (1) how to discover different topics of interests that are coherent in geographical regions? (2) how to compare several topics across different geographical locations? To answer these questions, this paper proposes and compares three ways of modeling geographical topics: location-driven model, text-driven model, and a novel joint model called LGTA (Latent Geographical Topic Analysis) that combines location and text. To make a fair comparison, we collect several representative datasets from Flickr website including Landscape, Activity, Manhattan, National park, Festival, Car, and Food. The results show that the first two methods work in some datasets but fail in others. LGTA works well in all these datasets at not only finding regions of interests but also providing effective comparisons of the topics across different locations. The results confirm our hypothesis that the geographical distributions can help modeling topics, while topics provide important cues to group different geographical regions. |
| [22] | . Most of the existing literature focuses on estimating traffic or explaining trip lengths from land use. This research attempts to reveal intraurban land use variations from traffic patterns. Using a seven-day taxi trajectory data set collected in Shanghai, we investigate the temporal variations of both pick-ups and drop-offs, and their association with different land use features. Based on the balance between the numbers of drop-offs and pick-ups and its distinctive temporal patterns, the study area is classified into six traffic ‘source-sink’ areas. These areas are closely associated with various land use types (commercial, industrial, residential, institutional and recreational) as well as land use intensity. The study shows that human mobility data from location aware devices provide us an opportunity to derive urban land use information in a timely fashion, and help urban planners and policy makers in mitigating traffic, planning for public services and resources, and other purposes. |
| [23] | . Fertl, W.H. and Martin, J.R., 1987. Well logging technology for highly deviated and horizontal wellbores. J. Pet. Sci. Eng., 1: 83-90. With the Dresser Atlas pipe-conveyed logging system for highly deviated wells, i.e., the Slant-hole Express, the logging instruments are guided to the bottom of the borehole through the protection of the drillpipe. A wireline guide placed at the end of the drillstring assembly, facilitates the re-entry of the logging instruments into the drillstring after completion of the open-hole logging run. The significant difference in the Slant-hole Express operation and conventional through-drillpipe pump-down operations is in the use of a sidedoor wireline entry-sub properly placed within the drillstring. Casing depth and placement of the sub, which should stay within the protective casing during the logging operation, then defines the length of the open-hole logging run per trip in the borehole. A significant advantage of the Slant-hole Express system is that no special "wet" electrical cable connector is required for mating to the logging instrumentation. In order to overcome downhole problems due to friction of logging instruments, insufficient weight, rigidity of long instrument assemblies, and the possibility of the bull plug sticking at small obstructions in highly deviated wellbores, a number of mechanical devices are available. These include sinker bars, swivels, knuckle joints, side-and-through-rollers, and nose guides. In the horizontal portion of a borehole, the use of coiled tubing has proven successful in "pushing" the logging instrumentation toward the bottom (end) of the borehole. The basic concepts, considerations, observations, and field experiences with this technology are discussed and illustrated in this paper. |
| [24] | . |
| [25] | . 公交数据库里潜含着反映公交运 营状况的客流信息,对其进行分析可以为公交线网优化和交通管理提供依据。以北京市为例,在VC++2005开发平台上,利用SQL Server数据库和ArcSDE开发出基于GIS的公交IC卡数据处理及分析系统,不仅能够实现GIS的一般功能,还改进了公交/地铁换乘处理标准,实 现全网断面客流以及全网速度的显示。 . 公交数据库里潜含着反映公交运 营状况的客流信息,对其进行分析可以为公交线网优化和交通管理提供依据。以北京市为例,在VC++2005开发平台上,利用SQL Server数据库和ArcSDE开发出基于GIS的公交IC卡数据处理及分析系统,不仅能够实现GIS的一般功能,还改进了公交/地铁换乘处理标准,实 现全网断面客流以及全网速度的显示。 |
| [26] | . 为了从广泛使用的智能卡付费系 统获取公交客流信息,提出了一种利用公交调度信息和智能卡刷卡信息推断乘客上车站点的方法.对同一辆车的连续2次刷卡进行朴素贝叶斯分类,区分是否是在同 一个站刷卡;利用极大似然估计、动态规划和二次规划方法估计出各路段的行程时间;运用坐标下降法从不准确的初始参数出发,交替估计行程时间和行程时间的参 数,从而推断出每次刷卡的上车站点.实验结果验证了新方法的正确性和有效性,证明了该方法误差较小,收敛较快. . 为了从广泛使用的智能卡付费系 统获取公交客流信息,提出了一种利用公交调度信息和智能卡刷卡信息推断乘客上车站点的方法.对同一辆车的连续2次刷卡进行朴素贝叶斯分类,区分是否是在同 一个站刷卡;利用极大似然估计、动态规划和二次规划方法估计出各路段的行程时间;运用坐标下降法从不准确的初始参数出发,交替估计行程时间和行程时间的参 数,从而推断出每次刷卡的上车站点.实验结果验证了新方法的正确性和有效性,证明了该方法误差较小,收敛较快. |
| [27] | . 基于位置服务(Location Based Service, LBS) 技术为研究城市系统的时空动态规律提供了新的视角, 已往多基于移动通讯(GSM)、全球定位系统(GPS)、社会化网络(SNS) 和无线宽带热点(Wi-Fi) 数据开展研究, 但少有研究利用公交IC 卡刷卡数据进行城市系统分析。普遍存在的LBS数据虽然具有丰富的时间和空间信息, 但缺乏社会维度信息, 使其应用范围受到一定限制。本文基于2008 年北京市连续一周的公交IC 卡(Smart Card Data, SCD) 刷卡数据, 结合2005 年居民出行调查、地块级别的土地利用图, 识别公交持卡人的居住地、就业地和通勤出行, 并将识别结果在公交站点和交通分析小区(TAZ) 尺度上汇总:① 将识别的通勤出行分别从通勤时间和距离角度, 与居民出行调查数据和其他已有北京相关研究进行对比, 显示较好的吻合性;② 对来自3 大典型居住区和去往6 大典型办公区的通勤出行进行可视化并对比分析;③ 对全市基于公交的通勤出行进行可视化, 并识别主要交通流方向。本研究初步提出了从传统的居民出行调查和城市GIS 数据建立规则, 用于SCD数据挖掘的方法, 具有较好的可靠性。 . 基于位置服务(Location Based Service, LBS) 技术为研究城市系统的时空动态规律提供了新的视角, 已往多基于移动通讯(GSM)、全球定位系统(GPS)、社会化网络(SNS) 和无线宽带热点(Wi-Fi) 数据开展研究, 但少有研究利用公交IC 卡刷卡数据进行城市系统分析。普遍存在的LBS数据虽然具有丰富的时间和空间信息, 但缺乏社会维度信息, 使其应用范围受到一定限制。本文基于2008 年北京市连续一周的公交IC 卡(Smart Card Data, SCD) 刷卡数据, 结合2005 年居民出行调查、地块级别的土地利用图, 识别公交持卡人的居住地、就业地和通勤出行, 并将识别结果在公交站点和交通分析小区(TAZ) 尺度上汇总:① 将识别的通勤出行分别从通勤时间和距离角度, 与居民出行调查数据和其他已有北京相关研究进行对比, 显示较好的吻合性;② 对来自3 大典型居住区和去往6 大典型办公区的通勤出行进行可视化并对比分析;③ 对全市基于公交的通勤出行进行可视化, 并识别主要交通流方向。本研究初步提出了从传统的居民出行调查和城市GIS 数据建立规则, 用于SCD数据挖掘的方法, 具有较好的可靠性。 |
| [28] | . 在历经了20余年的改革发展 后,成都市在基础设施建设、产业结构调整和生态环境保护等方面都取得了长足的进步,在政治经济文化发展的同时,城市的用地规模日益扩大,城市功能分区日趋 复杂,人地矛盾、功能与形态分区矛盾日渐凸现,城市功能分区已经成为制约城市发展的重要因素之一。为此开展成都市功能分区的研究也愈加重要,利用 Google Earth软件提供的在线浏览的高分辨率遥感图像,结合其特有的空间分析和查询功能,探讨成都市的功能区的分区及成因,并对城市功能分区的发展趋势做出预 测。 . 在历经了20余年的改革发展 后,成都市在基础设施建设、产业结构调整和生态环境保护等方面都取得了长足的进步,在政治经济文化发展的同时,城市的用地规模日益扩大,城市功能分区日趋 复杂,人地矛盾、功能与形态分区矛盾日渐凸现,城市功能分区已经成为制约城市发展的重要因素之一。为此开展成都市功能分区的研究也愈加重要,利用 Google Earth软件提供的在线浏览的高分辨率遥感图像,结合其特有的空间分析和查询功能,探讨成都市的功能区的分区及成因,并对城市功能分区的发展趋势做出预 测。 |
| [29] | [D]. . |
| [30] | . 了解居民公交出行乘车特征、掌握公交出行客流规律是公交规划和运 营决策的基础.为了研究不同时段居民公交乘车的分布特性,以北京市分段计价线路公交IC刷卡数据为依据,基于数据挖掘工具分析了居民公交出行乘车的距离特 性,并对乘车距离分布进行曲线拟合,结果表明:北京市居民公交乘车距离服从威布尔分布,在置信水平为95%的条件下,平方误差和小于0.01,拟合优度在 0.97以上. . 了解居民公交出行乘车特征、掌握公交出行客流规律是公交规划和运 营决策的基础.为了研究不同时段居民公交乘车的分布特性,以北京市分段计价线路公交IC刷卡数据为依据,基于数据挖掘工具分析了居民公交出行乘车的距离特 性,并对乘车距离分布进行曲线拟合,结果表明:北京市居民公交乘车距离服从威布尔分布,在置信水平为95%的条件下,平方误差和小于0.01,拟合优度在 0.97以上. |
| [31] | . The emergence of big data brings new opportunities for us to understand our socioeconomic environments. We use the term social sensing for such individual-level big geospatial data and the associated analysis methods. The word sensing suggests two natures of the data. First, they can be viewed as the analogue and complement of remote sensing, as big data can capture well socioeconomic features while conventional remote sensing data do not have such privilege. Second, in social sensing data, each individual plays the role of a sensor. This article conceptually bridges social sensing with remote sensing and points out the major issues when applying social sensing data and associated analytics. We also suggest that social sensing data contain rich information about spatial interactions and place semantics, which go beyond the scope of traditional remote sensing data. In the coming big data era, GIScientists should investigate theories in using social sensing data, such as data representativeness and quality, and develop new tools to deal with social sensing data. |
| [32] | . We describe latent Dirichlet allocation (LDA), a generative probabilistic model for collections of discrete data such as text corpora. LDA is a three-level hierarchical Bayesian model, in which each item of a collection is modeled as a finite mixture over an underlying set of topics. Each topic is, in turn, modeled as an infinite mixture over an underlying set of topic probabilities. In the context of text modeling, the topic probabilities provide an explicit representation of a document. We present efficient approximate inference techniques based on variational methods and an EM algorithm for empirical Bayes parameter estimation. We report results in document modeling, text classification, and collaborative filtering, comparing to a mixture of unigrams model and the probabilistic LSI model. 1. |
| [33] | . ABSTRACT Search algorithms incorporating some form of topic model have a long history in information retrieval. For example, cluster-based retrieval has been studied since the 60s and has re cently produced good results in the language model framework. An approach to building topic models based on a formal generative model of documents, Latent Dirichlet Allocation (LDA), is he avily cited in the machine learning literature, but its feasibilit y and effectiveness in information retrieval is mostly un known. In this paper, we study how to efficiently use LDA to impro ve ad-hoc retrieval. We propose an LDA-based document model within the language modeling framework, and evaluate it on several TREC collections. Gibbs sampling is employed to conduct approximate inference in LDA and the computational complexity is analyzed. We show that improvements over retrieval using cluster-based models can be obtained with reasonable efficiency. |
| [34] | . LDA(Latent Dirichlet Allocation)模型是近年来提出的一种能够提取文本隐含主题的非监督学习模型.通过在传统LDA模型中融入文本类别信息,文中提出了一种附加类别 标签的LDA模型(Labeled-LDA).基于该模型可以在各类别上协同计算隐含主题的分配量,从而克服了传统LDA模型用于分类时强制分配隐含主题 的缺陷.与传统LDA模型的实验对比表明:基于Labeled-LDA模型的文本分类新算法可以有效改进文本分类的性能,在复旦大学中文语料库上 micro_F1提高约5.7%,在英文语料库20newsgroup的comp子集上micro_F1提高约3%. . LDA(Latent Dirichlet Allocation)模型是近年来提出的一种能够提取文本隐含主题的非监督学习模型.通过在传统LDA模型中融入文本类别信息,文中提出了一种附加类别 标签的LDA模型(Labeled-LDA).基于该模型可以在各类别上协同计算隐含主题的分配量,从而克服了传统LDA模型用于分类时强制分配隐含主题 的缺陷.与传统LDA模型的实验对比表明:基于Labeled-LDA模型的文本分类新算法可以有效改进文本分类的性能,在复旦大学中文语料库上 micro_F1提高约5.7%,在英文语料库20newsgroup的comp子集上micro_F1提高约3%. |
| [35] | . This paper gives an overview of research on economic clusters and clustering and is motivated by the growing intellectual and political interest for the subject. Functional regions have the features that agglomeration of economic activities i.e. clusters, benefit from. Functional regions have low intra-regional transaction and transportation cost and has access to the local labour market. The features of spatial economic concentration were for a long time disregarded and it was first in the early 1990s that Krugman brought the subject into the stage light. The scientific interests of cluster and clustering phenomenon have after the “new” introduction rapidly increased in the last decade. Hence, the subject is being thought at various education levels. The importance of cluster and clustering has also been recognized at a national, regional and local level and cluster policies are becoming a major part of political thinking. These policies are however often based on a scarce analysis where no strict criterions are stated. |
| [36] | Although fully generative models have been successfully used to model the contents of text documents, they are often awkward to apply to combinations of text data and document metadata. In this paper we propose a Dirichlet-multinomial regression (DMR) topic model that includes a log-linear prior on document-topic distributions that is a function of observed features of the document, such as author, publication venue, references, and dates. We show that by selecting appropriate features, DMR topic models can meet or exceed the performance of several previously published topic models designed for specific data. |
| [37] |
