 , 李小苗
, 李小苗Extraction and analysis of Maxianshan planation surfaces in northeastern margin of the Tibetan Plateau
MAZhenhua, LIXiaomiao收稿日期:2015-11-8
修回日期:2015-12-6
网络出版日期:2016-03-25
版权声明:2016《地理学报》编辑部本文是开放获取期刊文献,在以下情况下可以自由使用:学术研究、学术交流、科研教学等,但不允许用于商业目的.
基金资助:
作者简介:
-->
展开
摘要
关键词:
Abstract
Keywords:
-->0
PDF (1010KB)元数据多维度评价相关文章收藏文章
本文引用格式导出EndNoteRisBibtex收藏本文-->
1 引言
夷平面是指由剥蚀和夷平作用所产生的,以截面形式横切过一切年龄上先于它的地层和构造的一种平缓地形[1],是地貌长期发展的终极产物经抬升破坏或埋藏的结果[2].夷平面在地貌演化和新构造运动研究中有着极其重要的作用[2-3],特别是青藏高原隆起过程研究中占有非常重要的地位[4-6].数字高程模型(Digital Elevation Models, DEM)的出现使夷平面研究由定性进入了定量--半定量化阶段[7-14].准确界定夷平面分布范围是开展夷平面定量--半定量研究的重要基础.****们从不同角度,利用不同方法对夷平面分布范围界定开展了大量研究,并取得了许多重要研究进展.目前主要有3种夷平面分布范围的提取方法:一是目视解译法,基于遥感影像或DEM数据,通过目视解译手动绘制夷平面的分布范围[15-17];二是地貌类型自动分类法,基于计算机图像处理技术,采取监督分类或者非监督分类的方法,自动划分地貌类型并提取夷平面分布范围[18];三是基于一定地貌因子指标,如高程,坡度,地势起伏度等,自动提取夷平面分布范围,其中高程和坡度组合应用最广[10-13, 19-25].对以上3种方法比较发现,基于高分辨率遥感影像的目视解译法具有最高的准确性,但是对于分布广泛的夷平面来说工作量大,效率最低;地貌类型自动分类法准确性最低,效率居中;地貌因子指标法效率最高,准确性略低于目视解译法.因此对于青藏高原地区广泛分布的夷平面最佳提取方法就是采用地貌因子指标法.但是,目前****在利用高程坡度指标提取夷平面的研究中,指标确定过程存在一定的随意性和主观性.为继续探讨如何准确提取夷平面,本文以青藏高原东北缘马衔山夷平面为研究对象,针对夷平面特殊的地貌几何形态,利用数理统计学上的均值变点分析法,首先确定山脊线和沟谷线的高程变点,进而确定高程指标,然后利用最小误差法确定坡度指标,最后提取了马衔山地区两级夷平面的分布范围并对其进行了分析研究.
2 区域概况
马衔山位于青藏高原东北缘,属祁连山东延陇中盆地中部的余脉(图1a),由两条北西西--南东东走向的山脉组成,北面为兴隆山(主峰海拔3276 m),南面为马衔山(主峰海拔3670 m).马衔山由四条与山脉走向一致的断裂所控制[26],山体由一套前寒武系马衔山群混合岩所组成,山麓为新生代红层和第四纪沉积物[27-28].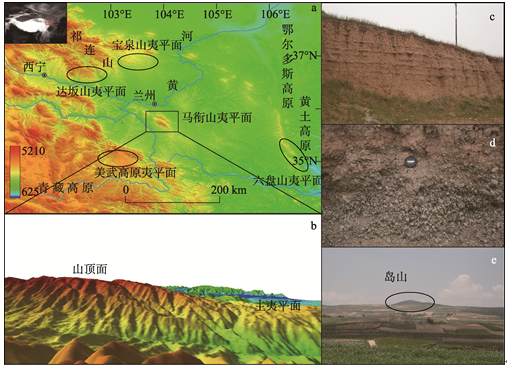 显示原图|下载原图ZIP|生成PPT
图1青藏高原东北缘地貌图与马衔山夷平面
-->Fig. 1Topographic map of the northeastern Tibetan Plateau and the Maxianshan planation surfaces
-->
马衔山较好的保存有两级夷平面(图1b).两级夷平面之间有明显的地形转折且之间没有断层和岩性差异,因此两级夷平面为不同时代的产物,分别对应于青藏高原内部的山顶面和主夷平面[28].山顶面上基岩裸露,第四系松散层不发育,发育有冻胀草丘,融冻泥流,雪蚀洼地等典型现代冰缘地貌,并曾在末次冰盛期发育有小型冰川.主夷平面以小水子一带保存最为完好,马衔山群混合岩组成的基岩面有明显的波状起伏,夷平面上普遍分布有厚度不等的风化壳,局部厚达3 m以上(图1d).基岩或风化壳上覆有红粘土层,其产状基本水平或随基岩呈波状起伏,最厚可达40 m左右.红粘土中有大量成层完好的钙质结核层,并保存有小哺乳动物化石,其岩性与黄土高原广泛分布的红粘土较为类似,推测其年代应为晚中新世--上新世(图1c).红粘土之上为更新世黄土地层,二者呈不整合接触,黄土层厚度可达30 m以上,黄土层底部呈青灰色和锈黄色,说明早期黄土堆积受到了潜育化作用,可能反应黄土堆积初期夷平面上的潮湿环境.此外,小水子夷平面西北部还保存有通常在湿热条件下形成的岛山,高出周围地形30 m左右,周围有风化碎屑(图1e).
马衔山夷平面南有以美武高原夷平面为代表的青藏高原夷平面[14, 18, 29],西有以达坂山为代表的祁连山夷平面[30-32],北有宝泉山夷平面,东有六盘山夷平面[33-35]以及其东北部保存完好的鄂尔多斯高原夷平面[32, 36](图1a).由小水子夷平面上红粘土的年代推断,小水子夷平面与青藏高原内部主夷平面和鄂尔多斯高原的唐县期夷平面为同时代产物.因此,马衔山夷平面的存在为证明这些夷平面曾为统一夷平面提供了重要证据.
马衔山夷平面与周围地形多以陡坡相接,在顺山体走向方向上表现为陡坡--主夷平面--陡坡--山顶面的地貌单元组合,在垂直于山体走向方向上表现为陡坡--主夷平面或山顶面的地貌单元组合.夷平面与周围地形反差大,有利于夷平面的识别与提取,是开展夷平面定量--半定量研究的理想地区.
3 数据及分析方法
3.1 数据资料
DEM数据是由美国航天局(NASA)与日本经济产业省(METI)共同推出的全球数字高程数据,其全称为先进星载热发射和反射辐射仪全球数字高程模型(Advanced Spaceborne Thermal Emission and Reflection Radiometer Global Digital Elevation Model,ASTER-GDEM).该数据是根据NASA新一代对地观测卫星Terra的结果制作而成,数据水平误差30 m左右,垂直误差20 m左右.对原始数据投影转换,拼接,裁剪获得研究区数据,经检查区内无数据孔洞,质量良好,完全能满足研究要求.3.2 研究方法
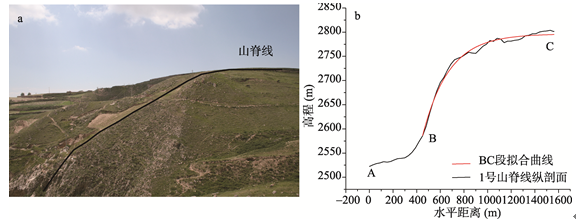
3.2.1 高程变点确定高程指标马衔山夷平面保存较好,周围地形多以陡坡方式与夷平面相接(图2a),陡坡与夷平面相接处即为夷平面边界,其高程即所求高程指标.进一步观察发现一条典型的山脊或沟谷线纵剖面(以1号山脊线纵剖面为例)是一条"S"型曲线(图2b),并且可以分为由缓变陡(AB段)和由陡变缓(BC段)的两部分,两部分的交点B为曲线斜率最大点即坡度最陡点.可以看出两段曲线都类似指数曲线,对其与夷平面相接的部分拟合发现拟合效果非常好:Y=–1609.85×exp(–x/221.16)+2796.50,拟合优度R2达到0.988.陈希孺指出指数模型均可转化为均值变点模型[37].
 显示原图|下载原图ZIP|生成PPT
图2马衔山山脊线纵剖面及其拟合曲线
-->Fig. 2Profile of a ridge of Maxianshan and its fitted curve
-->
一般地说,变点就是模型中的某个或某些量起突然变化之点[38].变点理论由Page于1954年提出,20世纪60年代以后由数理统计学家发展起来.变点理论已经广泛应用于各个学科,其中均值变点分析法在地学中已有较多的成功应用,如在水文学中用来进行径流量分期的研究[39-41],在地貌学中主要用来确定最佳统计单元[42-45].
本文中的变点就是地形坡度由陡变缓或者由缓变陡的地形转折点.观察发现,可以确定S型曲线中的两段曲线分别有且只有一个变点.对于有且只有一个变点的均值变点模型,最小方差法是确定变点位置最简单有效的方法,具体过程如下[46]:
(1)记剖面线高程数据为序列Ri.Ri为剖面线各点所对应的高程值;i为高程点序列号,由1到n,水平距离上每30 m取一个高程点.
(2)对序列Ri取对数,得到序列Xi.
(3)序列Xi以xi点为界分为两段,分别计算每段样本的算术平均值
式中:Si和S为均值变点分析法中间计算值;
(4)计算S与Si的差值,并确定最大值,最大值所在的点即为变点.由于夷平面本身地形的起伏和后来的构造运动,使夷平面不可能绝对水平,因此,残留夷平面边界在不同位置高程是不一样的,即仅仅通过一个高程值来确定高程指标是不准确的.提取多条山脊线和沟谷线,通过计算每条线的变点确定夷平面不同位置的高程指标.由于沟谷为现代侵蚀地形,相比于山脊与夷平面原始地形的误差更大,因此,本文中沟谷线剖面变点仅作为确定夷平面范围的辅助参考点.
3.2.2 最小误差法确定坡度指标
变点位置即为夷平面分布的边界,但是由于适合求取变点的位置有限,变点是非连续的,因此需要用其他指标来表示夷平面的范围.夷平面最典型的特征就是地形平缓,所以小于某个坡度值的坡度分布范围就能够很好的反应夷平面的分布范围,关键是该坡度值的确定.如前文所述,该坡度值****一般根据主观判断来确定,具有一定的随意性和主观性,本文利用最小误差法为最佳坡度指标的确定提供了一个定量方法.
以变点位置为夷平面边界的真实位置,测量各变点到不同坡度边界的最小距离,该距离即为对应坡度边界与夷平面边界的误差.利用此误差的中数和均值来确定各坡度边界与夷平面边界的整体误差,最小整体误差所对应的坡度就是最佳坡度.
需要指出的是为了减少夷平面内微地形对提取结果完整性的影响,在求坡度面之前对DEM数据进行了平滑处理.研究中使用3×3空间均值滤波器对DEM数据平滑了5次,试验发现5次平滑以后结果基本稳定,达到了平滑目的.
4 结果与分析
4.1 高程指标的确定与分析
根据上述高程指标的确定方法,选取了69条典型山脊线剖面和59条典型沟谷线剖面共128条剖面线(图3),其拟合效果非常好,R2均值为0.957,每组数据均达到统计学要求.求得其变点高程和位置,具体结果见图3和表1及表2.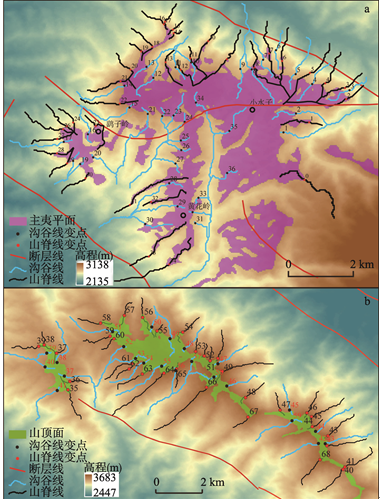 显示原图|下载原图ZIP|生成PPT
图3马衔山剖面线和变点位置
-->Fig. 3The location of profiles and change points of Maxianshan
-->
Tab. 1
表1
表1马衔山山脊线剖面变点
Tab. 1Change points of ridges of Maxianshan
| 编号 | 变点高程(m) | 编号 | 变点高程(m) | 编号 | 变点高程(m) | 编号 | 变点高程(m) |
|---|---|---|---|---|---|---|---|
| 0 | 2830 | 18 | 2771 | 36 | 3493 | 54 | 3534 |
| 1 | 2747 | 19 | 2778 | 37 | 3487 | 55 | 3567 |
| 2 | 2703 | 20 | 2804 | 38 | 3478 | 56 | 3501 |
| 3 | 2677 | 21 | 2840 | 39 | 3478 | 57 | 3511 |
| 4 | 2715 | 22 | 2825 | 40 | 3539 | 58 | 3513 |
| 5 | 2699 | 23 | 2648 | 41 | 3547 | 59 | 3548 |
| 6 | 2690 | 24 | 2648 | 42 | 3594 | 60 | 3549 |
| 7 | 2666 | 25 | 2651 | 43 | 3595 | 61 | 3543 |
| 8 | 2727 | 26 | 2664 | 44 | 3594 | 62 | 3508 |
| 9 | 2731 | 27 | 2621 | 45 | 3584 | 63 | 3547 |
| 10 | 2697 | 28 | 2635 | 46 | 3576 | 64 | 3601 |
| 11 | 2755 | 29 | 2651 | 47 | 3491 | 65 | 3601 |
| 12 | 2773 | 30 | 2618 | 48 | 3557 | 66 | 3622 |
| 13 | 2748 | 31 | 2596 | 49 | 3665 | 67 | 3585 |
| 14 | 2715 | 32 | 2647 | 50 | 3612 | 68 | 3587 |
| 15 | 2703 | 33 | 2601 | 51 | 3628 | ||
| 16 | 2691 | 34 | 2651 | 52 | 3593 | ||
| 17 | 2701 | 35 | 3482 | 53 | 3587 |
新窗口打开
Tab. 2
表2
表2马衔山沟谷线剖面变点
Tab. 2Change points of valleys of Maxianshan
| 编号 | 变点高程(m) | 编号 | 变点高程(m) | 编号 | 变点高程(m) | 编号 | 变点高程(m) |
|---|---|---|---|---|---|---|---|
| 1 | 2745 | 16 | 2640 | 31 | 2694 | 46 | 3588 |
| 2 | 2732 | 17 | 2629 | 32 | 2735 | 47 | 3599 |
| 3 | 2633 | 18 | 2638 | 33 | 2686 | 48 | 3564 |
| 4 | 2727 | 19 | 2624 | 34 | 2811 | 49 | 3530 |
| 5 | 2709 | 20 | 2637 | 35 | 2752 | 50 | 3531 |
| 6 | 2610 | 21 | 2783 | 36 | 2721 | 51 | 3512 |
| 7 | 2661 | 22 | 2775 | 37 | 3495 | 52 | 3539 |
| 8 | 2725 | 23 | 2758 | 38 | 3509 | 53 | 3545 |
| 9 | 2699 | 24 | 2765 | 39 | 3453 | 54 | 3560 |
| 10 | 2770 | 25 | 2748 | 40 | 3464 | 55 | 3595 |
| 11 | 2749 | 26 | 2723 | 41 | 3443 | 56 | 3588 |
| 12 | 2765 | 27 | 2688 | 42 | 3570 | 57 | 3559 |
| 13 | 2759 | 28 | 2694 | 43 | 3580 | 58 | 3634 |
| 14 | 2825 | 29 | 2701 | 44 | 3572 | 59 | 3537 |
| 15 | 2819 | 30 | 2581 | 45 | 3482 |
新窗口打开
由计算结果发现,从高程上来看山顶面的高程下限主要分布在3500~3600 m之间,共有39个变点,占总变点数的68.4%;主夷平面的高程下限主要分布在2680~2780 m之间,共有40个变点,占总变点数的56.3%.从空间分布上来看山顶面的高程下限由马衔山主峰3600 m以上沿山脊方向向两侧逐渐降低到3500 m;主夷平面的高程下限分布可分为两个区域,位于夷平面西南部的鹞子岭和黄花岭部分主要在2600~2680 m,其他部分主要分布在2680~2780 m.
4.2 坡度指标的确定与分析
根据上述最佳坡度指标确定方法,测量不同坡度(7°~18°)分布图边界与各变点(两级夷平面标准点均为34个)的最小距离,即与夷平面边界的误差.统计不同坡度情况下误差的均值和中位数(表3).由于误差存在个别极端值,因此,中数值更能代表数据的整体情况,以中数为主,均值为辅判断整体数据的最小误差.Tab. 3
表3
表3马衔山各坡度边界与夷平面边界误差
Tab. 3Errors between slope borders and planation surfaces of Maxianshan
| 位置 | 坡度(°) | 7 | 8 | 9 | 10 | 11 | 12 | 13 | 14 | 15 | 16 | 17 | 18 |
|---|---|---|---|---|---|---|---|---|---|---|---|---|---|
| 山顶面 | 中数(m) | 59 | 53 | 47 | 48 | 38 | 30 | 30 | 51 | 50 | 73 | 75 | 106 |
| 均值(m) | 63 | 56 | 55 | 61 | 81 | 83 | 86 | 111 | 114 | 122 | 125 | 135 | |
| 主夷 平面 | 中数(m) | 91 | 68 | 65 | 58 | 52 | 40 | 47 | 51 | 45 | 49 | 49 | 86 |
| 均值(m) | 121 | 101 | 87 | 72 | 70 | 62 | 67 | 75 | 73 | 78.0 | 81 | 102 |
新窗口打开
对于山顶面而言最小中数所对应的坡度为12°和13°,而两者中12°的误差均值更小(表3),因此12°边界与山顶面边界的误差最小,即12°为提取山顶面的最佳坡度指标.对于主夷平面而言最小中数和均值所对应的坡度均为12°,因此12°边界与主夷平面边界的误差最小,即12°为提取主夷平面的最佳坡度指标.所以,马衔山地区提取山顶面和主夷平面两级夷平面的最佳坡度指标均为12°.前人在利用高程和坡度指标提取夷平面过程中,所利用的坡度指标最小为4°,最大为17°,大多在10°左右[10-13, 19-25],以前人所用坡度指标来看,12°也是一个比较适中的结果,侧面印证了该方法的有效性.
4.3 夷平面的提取与分析
根据马衔山夷平面的地形特点和上述坡度,高程指标的确定,本文最终确定了马衔山地区夷平面提取的4个指标:(1)区位指标:夷平面位于现代水系的上部,主要位于山顶面或现代水系的分水岭,利用该指标首先确定夷平面分布的大概位置;
(2)高程指标:夷平面边界在不同位置的高程是不一样的,不能确定单一指标,不同位置的变点高程就是该位置夷平面边界的高程指标.其中0号变点为主夷平面与其上一级地貌单元的界线位置,其他变点均为山顶面和主夷平面与其下一级地貌单元的界线位置;
(3)坡度指标:根据不同坡度边界与夷平面边界最小误差确定了两级夷平面的最佳统计坡度均为12°;
(4)面积指标:由于研究区范围较小,本文将0.1 km2作为夷平面的下限面积指标,并且当两夷平面斑块之间最小距离小于200 m时,视其为同一个斑块;
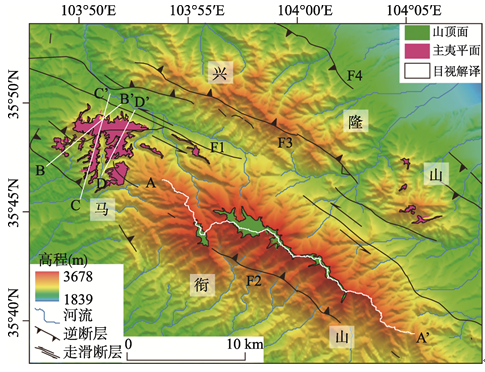
根据以上4个指标,利用ArcGIS10.0软件提取了马衔山地区的夷平面分布情况(图4).
为检验本文提取夷平面分布范围的可靠性,对提取结果与基于高分辨率遥感影像的目视解译结果进行比较.随着遥感技术的不断发展,米级,亚米级遥感影像的广泛应用,基于高分辨率遥感影像的目视解译结果经常被用来检验地貌线或地貌面提取结果精度[47-49].利用谷歌地球高分辨率影像资料(分辨率1.5 m),采用目视解译的方法手工绘制夷平面分布范围,并将其作为相对真值.指标法提取夷平面总面积为21.936 km2,目视解译夷平面总面积为21.317 km2,两者绝对面积偏差0.619 km2,相对误差为2.82 %.并且通过对比两者分布界线可以看出结果基本一致,但在局部细节上存在微小差异(图4).考虑到本文所用DEM数据分辨率仅为30 m,以上误差是在可信范围内的.再结合野外实际考察验证结果,可以确定本文的提取结果是可靠的.
 显示原图|下载原图ZIP|生成PPT
图4马衔山夷平面分布及剖面线位置(F1=马衔山北缘断裂,F2=马衔山南缘断裂,F3=兴隆山南缘断裂,F4=兴隆山北缘断裂)
-->Fig.4The distribution of Maxianshan planation surfaces and the location of profiles (F1 = Northern marginal fault of Maxianshan, F2 = Southern marginal fault of Maxianshan, F3 = Southern marginal fault of Xinglongshan, F4 = Northern marginal fault of Xinglongshan)
-->
对夷平面提取结果统计分析发现,山顶面全部分布在马衔山中部和东部的山脊地带,其中以主峰附近保存最为完整,主峰两侧呈带状分布,总面积6.41 km2,其高程主要分布在3470~3640 m,平均高程为3559 m;主夷平面在马衔山西段的小水子一带保存最为完整,在兴隆山东段有零星分布,总面积15.52 km2,其高程主要分布在2670~2870 m,平均高程为2771 m.两级夷平面的平均高差为788 m,可见在二级夷平面形成之前,马衔山就是高出周围地形至少788 m的山地.
4.4 夷平面的变形
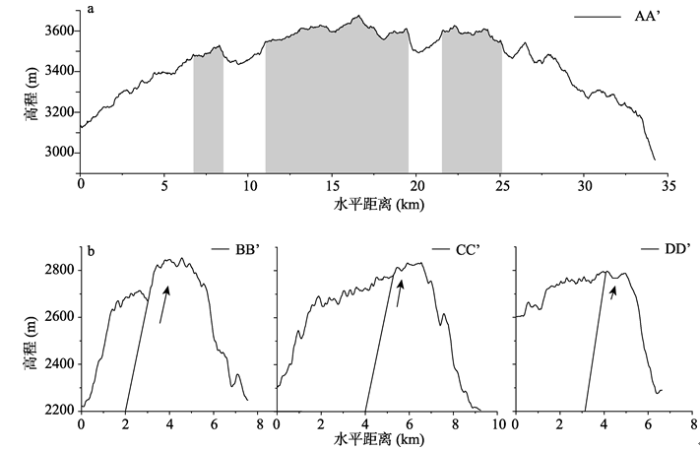
马衔山在大地构造上属于祁连山褶皱系的秦祁中间隆起带东南端部分,加里东构造运动形成了马衔山复式向斜和与其平行展布的断裂构造,奠定了马衔山山体的构造轮廓[27].中新世早期,在喜马拉雅运动作用下山顶面停止发育并解体,马衔山隆起[29, 50];喜马拉雅运动之后为一长期构造稳定时期,夷平作用持续进行,至中新世晚期,马衔山主夷平面与南北两侧的临夏盆地和兰州盆地已趋于平坦的统一的广阔地面,山顶面成为相对海拔大于788 m的山地,8 Ma BP左右在青藏运动序幕的作用下主夷平面解体,马衔山轻微隆升,并在3.6 Ma BP以后大幅度隆升,形成现代地貌格局[27, 50].马衔山晚新生代以来活跃的新构造运动,使马衔山和兴隆山南北缘分别发育了4条断裂:马衔山北缘断裂(F1),马衔山南缘断裂(F2),兴隆山南缘断裂(F3)和兴隆山北缘断裂(F4)(图4).其中,马衔山北缘断裂是规模最大,活动性最强的一条区域性活动断裂,另外3条是其伴生断裂,断裂早期具有挤压逆冲特性,马衔山和兴隆山以断块形式大幅度抬升,大约中更新世以来断裂活动以左旋走滑为主兼具倾滑运动分量[26, 51].晚新生代以来马衔山地区活跃的构造运动使两级夷平面均发生了变形.沿马衔山山脊做一条贯穿山顶面的剖面AA',从东至西做3条横切主夷平面的剖面BB',CC'和DD'(图4,图5).分析发现山顶面略呈弧形,中间达3600 m以上,两端降低至3500 m左右,这可能与后期的构造挤压作用和山体的不均匀抬升有关;由于主夷平面内部存在一条逆断层,夷平面被错断成南北两部分,且北高南低,垂直断距由西向东逐渐减小,西端可达100 m以上,东段不明显.
 显示原图|下载原图ZIP|生成PPT
图5马衔山夷平面剖面图(a. 阴影部分为山顶面位置;b. 主夷平面剖面)
-->Fig. 5Profiles of Maxianshan planation surfaces (a. Profile of the summit surface; b. Profiles of the main surface)
-->
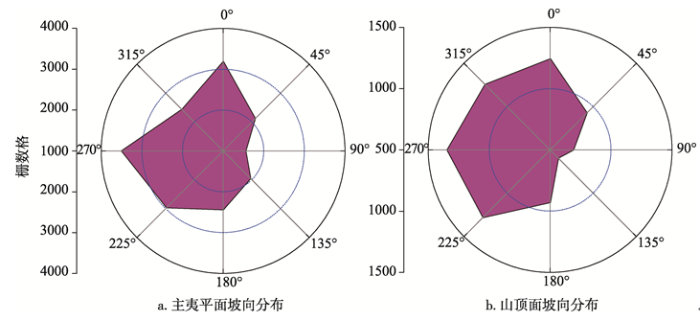
通过对夷平面坡向的分析,可以获得其总体倾斜趋势.提取两级夷平面坡向数据,并作坡向分布图(图6).可见两级夷平面坡向均集中于西南方向,夷平面具有总体向西南倾斜的趋势.该方向基本垂直于山体走向和控制断层走向,夷平面北侧的马衔山北缘断裂为区域内主断裂,而南侧的马衔山南缘断裂为次级断裂[51],所以,夷平面的总体倾斜趋势可能受夷平面南北两侧断裂控制.
 显示原图|下载原图ZIP|生成PPT
图6马衔山夷平面坡向分布
-->Fig. 6Aspect distribution of Maxianshan planation surfaces
-->
5 结论
青藏高原东北缘马衔山地区保存有主夷平面和山顶面两级夷平面,是晚新生代青藏高原大幅度隆升的重要证据.主夷平面上普遍分布风化壳,红粘土和黄土,并保存有小哺乳动物化石,这为夷平面年代测定和古环境恢复等研究提供了不可多得的材料.基于马衔山地区特殊的"S"型地貌几何形态,以均值变点法和最小误差法确定了最佳高程和坡度指标,然后提取了马衔山地区夷平面分布范围.研究表明,马衔山地区两级夷平面最佳坡度指标均为12°.12°是否可以成为所有地区夷平面的最佳坡度指标还需要在更多的地区展开试验.
两级夷平面在隆升抬起过程中的变形,主要受控于区内断裂.小水子主夷平面内部存在一条东西向逆断裂,使其南北两侧夷平面出现高差变形;两级夷平面整体向西南方向倾斜变形趋势,是由于山体南北两侧断裂差异活动造成.
The authors have declared that no competing interests exist.
参考文献 原文顺序
文献年度倒序
文中引用次数倒序
被引期刊影响因子
| [1] | |
| [2] | . 长期地貌演化研究表明,夷平面的形成有4种基本方式:准平原、山麓剥蚀平原、双层水平面和冻融剥夷平原。它们的形成都需要上千万年至数亿年的构造相对稳定时期。青藏高原上的层状地貌面可以划分为两级夷平面和一级剥蚀面。山顶面形成于渐新世至中新世早期;主夷平面是以双层水平面或山麓剥蚀平原形式发育的,大致形成于20~3.6 Ma B.P.期间,完成时的高度低于1000m;剥蚀面形成于3.6~1.7 Ma B.P.期间。 . 长期地貌演化研究表明,夷平面的形成有4种基本方式:准平原、山麓剥蚀平原、双层水平面和冻融剥夷平原。它们的形成都需要上千万年至数亿年的构造相对稳定时期。青藏高原上的层状地貌面可以划分为两级夷平面和一级剥蚀面。山顶面形成于渐新世至中新世早期;主夷平面是以双层水平面或山麓剥蚀平原形式发育的,大致形成于20~3.6 Ma B.P.期间,完成时的高度低于1000m;剥蚀面形成于3.6~1.7 Ma B.P.期间。 |
| [3] | . |
| [4] | 青藏地区在始新世晚期全部脱离 海浸成陆以后,曾被两度夷平或接近夷平.至上新世末,地面高度仅1,000米左右.上新世未一第四纪初的新构造运动为大幅度整体的断块上升,但在空间上有 差异性,在时间上有三个剧烈上升阶段,并且有明显的后期加速的趋势.自上新世末以来,青藏高原累计上升约3,500—4,000米。 青藏地区在始新世晚期全部脱离 海浸成陆以后,曾被两度夷平或接近夷平.至上新世末,地面高度仅1,000米左右.上新世未一第四纪初的新构造运动为大幅度整体的断块上升,但在空间上有 差异性,在时间上有三个剧烈上升阶段,并且有明显的后期加速的趋势.自上新世末以来,青藏高原累计上升约3,500—4,000米。 |
| [5] | . 当前学术界在青藏高原地面何时达到现代高度问题上存在着许多不同观点,概括起来主要有3种:14Ma前已达到高于现代的最大高度,8Ma前已达到或超过现代高度,距今3.4Ma来分阶中强烈上升并逐步达到现代高度,之所以出现如此大的意见分歧,除高原面积广阔,研究程度不深和覆盖面不够的原因外,不同研究者所使用研究方法和证据的差异也是重要因素,在分析了各种证据对高原地面上升的记录机理后,我们认为夷平面、河流附地, . 当前学术界在青藏高原地面何时达到现代高度问题上存在着许多不同观点,概括起来主要有3种:14Ma前已达到高于现代的最大高度,8Ma前已达到或超过现代高度,距今3.4Ma来分阶中强烈上升并逐步达到现代高度,之所以出现如此大的意见分歧,除高原面积广阔,研究程度不深和覆盖面不够的原因外,不同研究者所使用研究方法和证据的差异也是重要因素,在分析了各种证据对高原地面上升的记录机理后,我们认为夷平面、河流附地, |
| [6] | . <p>青藏高原主夷平面形成的上限年龄为3.6MaB.P.,临夏盆地新生代湖相沉积同时结束,青藏运动开始,分为A(3.6MaB.P.),B(2.6MaB.P.)和C(1.7MaB.P.)3幕,A幕现代亚洲季风形成,B幕黄土开始堆积,C幕黄河出现;昆黄运动(1.2~0.6MaB.P.)使黄河干流切入青藏高原,大面积山地进入冰冻圈,可能导致中更新世之气候转型;共和运动造成黄河切穿龙羊峡,青海湖孤立,高原达到现代高度.中国三大自然区是高原隆升驱动大气环流改变而导致的中国最高层次的景观分异.本文讨论了8MaB.P.的有限高度隆升及亚洲干旱化的问题,亚洲夏季风22MaB.P.已经开始,是高原隆升及其它因素共同作用的结果,为亚洲古季风阶段.3.6MaB.P.才是现代亚洲季风真正开始的时期,可能北半球进入冰期也与此有密切关系.</p> . <p>青藏高原主夷平面形成的上限年龄为3.6MaB.P.,临夏盆地新生代湖相沉积同时结束,青藏运动开始,分为A(3.6MaB.P.),B(2.6MaB.P.)和C(1.7MaB.P.)3幕,A幕现代亚洲季风形成,B幕黄土开始堆积,C幕黄河出现;昆黄运动(1.2~0.6MaB.P.)使黄河干流切入青藏高原,大面积山地进入冰冻圈,可能导致中更新世之气候转型;共和运动造成黄河切穿龙羊峡,青海湖孤立,高原达到现代高度.中国三大自然区是高原隆升驱动大气环流改变而导致的中国最高层次的景观分异.本文讨论了8MaB.P.的有限高度隆升及亚洲干旱化的问题,亚洲夏季风22MaB.P.已经开始,是高原隆升及其它因素共同作用的结果,为亚洲古季风阶段.3.6MaB.P.才是现代亚洲季风真正开始的时期,可能北半球进入冰期也与此有密切关系.</p> |
| [7] | . Measurement of the rate of tectonically driven surface uplift is crucial to a complete understanding of mountain building dynamics. The lack of a suitable rock record typically prevents determination of this quantity, but the unusual geology of Papua New Guinea's Finisterre mountains makes measurement of this rate possible. The tectonic surface uplift rate at the Finisterre range is 0.8-2.1 mmyr, approximately that expected to arise from crustal thickening. |
| [8] | . A 3873-km large rectangular area of the Precambrian basement in south-western Sweden has been investigated regarding gross morphology of palaeosurfaces. GIS and digital elevation data were used to construct maps of relative and absolute relief and E-W trending height profiles. Three different palaeosurfaces were recognised and delimited; the very even sub-Cambrian peneplain in the east at an intermediate altitudinal position, an uplifted and broken part of the sub-Cambrian peneplain in the centre at the highest present elevation, and in the western coastal areas a joint-aligned valley landscape with high relative relief, probably an exhumed Mesozoic etch-surface. Phanerozoic faulting has dissected the different palaeosurfaces into tectonic blocks, which are shown from trend surface analysis to be tilted in different directions and to different degrees, characteristic and decisive for the morphological development. |
| [9] | . |
| [10] | . International audience ; Glacial landscapes are characterized by dramatic local relief, but they also commonly exhibit high-elevation, lowrelief surfaces. These surfaces have been attributed to glacial headward erosion and periglacial processes in Alpine settings. However, the timing and processes responsible for their formation in northern high-latitude regions remain elusive. Here, we infer the topographic evolution of western Scandinavia during the Plio-Quaternary glaciations (0-2.8 Ma) by linking onshore erosion to offshore sedimentation. We estimate the rate of fjord erosion from geophysical relief and compare that with the erosion reflected by offshore sedimentation. We find that the sediments generated by fjord erosion (65-100 103 km3) over the entire western Scandinavia during the Plio-Quaternary glaciations accounts for only 35鈥55% of the equivalent bedrock erosion deduced from total sediment volume deposited off the coast of Norway. This large mismatch implies that during this period, significant erosion (300-400 m) must have also taken place away from the fjords at high elevation and thus indicates a bimodal distribution of glacial erosion. Furthermore, comparing the distribution of the high-elevation, low-relief surfaces with estimates of the long-term glacier equilibrium line altitude supports the idea that effective erosion in extensively glaciated areas limits topographic height, a process known as the glacial buzzsaw. We therefore conclude that glacial and periglacial processes have a substantial impact on the formation of low-relief surfaces observed in glaciated mountain belts and high-latitude continental margins. |
| [11] | . Abstract Top of page Abstract 1.Introduction 2.Geomorphology of the Pyrenees 3.Morphological Evolution of the Southern Pyrenees During the Cenozoic 4.How Did the High-Elevation, Low-Relief Erosional Surfaces Develop?: A High-Elevation Peneplanation Model 5.When Does the Dissection of the High-Elevation, Low-Relief Surfaces Begin? 6.Discussion 7.Conclusion Acknowledgments References Supporting Information [1] Peneplanation of mountain ranges is generally considered the result of long-term erosional processes that smooth relief and lower elevation near sea level. Therefore peneplain remnants at high elevation in mountain ranges are used to infer posttectonic surface uplift. Such an interpretation has been proposed for the Pyrenees where high-elevation, low-relief erosional surfaces rose up to more than 2000 m. Because the Pyrenean foreland basins are filled with very thick continental deposits, which have buried the early jagged landscape, we challenge this hypothesis by pointing out that relief applanation does not necessarily require elevation lowering. We propose an alternative interpretation in which piedmont aggradation of detrital sediment that comes from erosion of the high chain induces the rise of the base level of the range, therefore reducing strongly the erosive efficiency of the drainage system and resulting in the progressive smoothing of the relief. Such a process allows a high-elevation, low-relief erosional surface to develop at the scale of the range. In the Pyrenees, occurrence of high-elevation, low-relief erosional surface remnants does not imply a posttectonic uplift, but is instead due to the dissection of the initial Miocene high-elevation, low-relief surface by the recent drainage system, the erosive activity of which has been enhanced by global climate change from the late Pliocene onward. |
| [12] | . Remnants of a high plateau have been identified on Nuussuaq and Disko, central West Greenland. We interpret the plateau as an erosion surface (the summit erosion surface) formed mainly by a fluvial ... |
| [13] | . |
| [14] | . <p>以甘南美武高原太子山地区典型夷平面为例,利用遥感与计算机技术,对夷平面三维数字地形模型的生成、显示与定量分析方法进行了探索,为夷平面显示的直观性、准确性和定量化研究提供一种新的途径。并利用这一方法,对美武高原典型残余夷平面的分级、坡度、坡度变化率、相对高差等反映地貌形态的数量特征进行了计算、统计与分析,第一次提出了该地区残余夷平面的准确数值特征,为进一步深入研究打下了坚实的基础。</p> . <p>以甘南美武高原太子山地区典型夷平面为例,利用遥感与计算机技术,对夷平面三维数字地形模型的生成、显示与定量分析方法进行了探索,为夷平面显示的直观性、准确性和定量化研究提供一种新的途径。并利用这一方法,对美武高原典型残余夷平面的分级、坡度、坡度变化率、相对高差等反映地貌形态的数量特征进行了计算、统计与分析,第一次提出了该地区残余夷平面的准确数值特征,为进一步深入研究打下了坚实的基础。</p> |
| [15] | . Canyon incision into mountain topography is commonly used as a proxy for surface uplift driven by tectonic or geodynamic processes, but climatic changes can also instigate incision. The ~1250-kilometer (km)-long eastern margin of the Andean Plateau hosts a series of 1.5- to 2.5-km-deep canyons that cross major deformation zones. Using (U-Th)/He thermochronology, we document a transition from Miocene faulting to Pliocene canyon incision across the northeastern plateau margin. Regionally, widespread Pliocene incision into the eastern plateau margin is concurrent with a shift in global climate from early Pliocene warmth to late Pliocene cooling. Enhanced moisture transport onto the Andean Plateau driven by sea surface temperature changes during cooling is the likely pacemaker for canyon incision. |
| [16] | . Low-relief bedrock surfaces that occur at high altitude are a common feature of Cenozoic mountain belts and have often been used to infer a significant amount of rock uplift after their generation at low elevation. The timescale over which such surfaces can be preserved at high elevation and the rate at which they are modified by weathering and erosion are poorly known. Here we use cosmogenic 10 Be and 21 Ne to quantify the landscape evolution of a bedrock peneplain in southern Tibet that occurs at an altitude of ~5300m. The peneplain is developed in Cretaceous granitoids and Jurassic metasediments of the northern Lhasa block (90°E, 31°N) and originally had a minimum extent of ~150km east–west and ~75km north–south. It has been dissected by small rivers that generated a few hundred meters of relief and formed additional bedrock surfaces of limited extent at lower elevation. Local denudation rates for the peneplain and the lower bedrock surfaces – based on 10 Be concentrations in grus samples and amalgamated quartz clasts – cluster between 5 and 11mMa 611 (mean=8.1mMa 611 ) and are thought to be representative for the long-term rate of downwearing of these surfaces. Samples from bedrock outcrops and bedrock blocks yield more variable rates (3–20mMa 611 ), which partly overestimate the long-term lowering rate, presumably due to block tilting and bedrock inhomogeneity. Spatially averaged 10 Be denudation rates for small river catchments range from 9 to 16mMa 611 (mean=11.8mMa 611 ) and are only slightly higher than the local denudation rates. Hence, the incision and widening of valleys proceeds at low rates, which demonstrates that the landscape of the peneplain region is remarkably stable. The combined 21 Ne and 10 Be data in a subset of the samples suggest that the bedrock surfaces have experienced a simple exposure history without periods of burial. Thus, our data do not provide any evidence for extended periods of shielding by ice during past glaciations, which is consistent with the absence of erratic boulders and moraines in the peneplain region. |
| [17] | . Abstract<br/>Planation surfaces (PS) play a major role in reconstruction of the evolutionary history of landforms in local areas. Thus, objective and consistent mapping of planation surfaces from remotely sensed data (e.g., satellite imagery, digital elevation models (DEMs)) is paramount for interpreting the geomorphological evolution. Due to the lack of dated sedimentary covers and the difficulties of comprehensive field work, the number and age of planation surfaces in the Southwest Hubei (湖北) Province of China are still controversial. In order to map the PS in the study area, four data visualization techniques including ETM+ false color composite, grey-scale DEM, shaded relief model (SRM) and painted relief model (PRM) were examined. It is found that the PRM is the most optimal technique for planation surface mapping. The study area was successfully mapped by visual interpretation of a PRM derived from ASTER GDEM. The mapped PS was divided into five classes in terms of elevation according to previous studies, varying from 1 700–2 000 (PS1), 1 300–1 500 (PS2), 1 000–1 200 (PS3), 800–900 (PS4) to 500–600 (PS5) m. The results were partially compared with the published works. It is revealed that this method of mapping enjoys a higher accuracy and can reduce the time and effort required in the traditional mapping to a large extent. The results also demonstrated that the PRM is an effective tool for geomorphological feature mapping with considerable accuracy. The preliminary results can serve to facilitate locating representative samples for the planation surfaces dating, thus to determine the ages of PS in the study areas.<br/> |
| [18] | . 夷平面是当代地貌学研究的一个重要课题之一,对于重建一个地区的 地貌演化的历史具有重要的意义.文中利用遥感与地理信息系统技术,建立了位于兰州以南、青藏高原东北部边缘的美武高原数字高程模型,并与陆地卫星影像结合 起来进行集成分析,论述了美武高原三维地貌影像图的信息特点,提取了若干区段的地形剖面,进而在分析了高原夷平面地貌参数体系的基础上运用遥感图像监督分 类技术自动提取出高原夷平面的具体分布区域,揭示了此项技术对于夷平面分析的巨大潜力. . 夷平面是当代地貌学研究的一个重要课题之一,对于重建一个地区的 地貌演化的历史具有重要的意义.文中利用遥感与地理信息系统技术,建立了位于兰州以南、青藏高原东北部边缘的美武高原数字高程模型,并与陆地卫星影像结合 起来进行集成分析,论述了美武高原三维地貌影像图的信息特点,提取了若干区段的地形剖面,进而在分析了高原夷平面地貌参数体系的基础上运用遥感图像监督分 类技术自动提取出高原夷平面的具体分布区域,揭示了此项技术对于夷平面分析的巨大潜力. |
| [19] | . . |
| [20] | . The northwest Himalaya shows strongly contrasting relief. Deeply incised mountain ranges that are characterized by extremely rapid exhumation and some of the highest peaks in the world are in contrast with high-elevation, low-relief areas such as the Deosai plateau in northern Pakistan, which lies at an altitude of 4,000m. The origin and evolution of such plateau regions at the convergence of the most active continental collision in the world remain elusive. Here we report low-temperature thermochronology data from the Deosai plateau and use thermal history modelling to show that the plateau has undergone continuous slow denudation at rates below 250mMyrfor the past 35Myr at least. This finding suggests tectonic and morphologic stability of the plateau since at least Eocene times, only 15-20Myr after the onset of the India-Asia collision. Our work contradicts the hypothesis that widespread low-relief surfaces in the northwest Himalaya result from efficient kilometre-scale glacial erosion during Quaternary times. We show that similarly stable surfaces exist throughout the entire northwest Himalaya and share common morphologic characteristics and denudation histories, which are comparable to those of the western Tibetan plateau. Our results suggest that these surfaces are preserved remnants of an Eocene southwestern Tibetan plateau that was more extensive than today. |
| [21] | . |
| [22] | . [1] Field work and topography analysis show that remnant, local areas of a low-relief landscape or erosion surfaces are geographically continuous across the southeastern Tibetan Plateau margin. We correlate these remnant surfaces as a paleolandscape that formed at low elevation. Remnants of this paleolandscape are preserved because incision of the fluvial system has been largely limited to major rivers and principal tributaries and has not yet progressed throughout the entire fluvial network. The incomplete adjustment of the fluvial system signals initiation of rapid bedrock incision into a developing plateau margin, and erosional denudation is concentrated in the major river channels. This interpretation contradicts earlier notions that low-gradient, regional topography is the product of regional elevation reduction by intense landscape dissection due to the presence of several large southeast flowing rivers. The modern altitude of the reconstructed paleolandscape (or “relict landscape”) constrains the vertical displacement of the plateau surface in response to crustal thickening and subsequent erosion during the lateral growth of the Tibetan Plateau. Regional preservation of the relict landscape is consistent with minor surface disruption by late Cenozoic thrust faults and folds and supports a model of distributed lower crustal thickening. Because significant erosion is limited to narrow river gorges, an increase in the plateau elevation due to isostatic rebound is minor. Therefore we propose that the modern elevation of the relict landscape reflects isostatically compensated thickening of the lower crust. |
| [23] | . Extensive tracts of low-gradient topography in steep mountain ranges, either forming rangetop plateaus or terraced pediments on range flanks, are widely distributed in mountain belts around the world. Before the advent of plate tectonics, such populations of planar landforms were interpreted as vestiges of a post-orogenic raised peneplain, i.e., a low-gradient land surface resulting from the decay, during long intervals of base-level stability, of a previous mountain range that was subsequently raised once again to great elevations—thus forming a new mountain range. This two-stage model has been challenged by theories that advocate continuity in tectonic processes and more gradual changes in base level, and thus expect a more immediate and proportionate response of geomorphic systems. Here we present a global survey of erosion surfaces in mountain ranges and put existing theories and empirical evidence into a broad perspective calling for further research into the rates and regimes of long-term mountain evolution. The resulting library of case studies provides opportunities for comparative analysis and helps to classify the landform mosaics that are likely to arise from the interplay between (i) crustal regimes, which at convergent plate margins need be neither uniform nor steady at all times; (ii) radiation-driven and gravity-driven geomorphic regimes, which are mainly determined by crustal boundary conditions and climate; and (iii) paleogeography, through which clues about base-level changes can be obtained. We examine intracratonic and plate-margin settings, with examples from thin-skinned fold belts, thick-skinned fold belts, island-arc and other subduction-related settings, and bivergent collisional orogens. Results reveal that the existence of erosion surfaces is not a simple function of geodynamic setting. Although some erosion surfaces are pre-orogenic, evidence about their predominantly post-orogenic age is supported by apatite fission-track and helium rock-cooling signatures, stratigraphic age-bracketing, stream channel gradient patterns, and other direct or indirect dating criteria. It follows that many portions of mountain belts undergo unsteady, nonuniform post-orogenic landscape evolution trajectories, with intermittent opportunities for relief reduction. The resulting erosion surfaces remain preserved as signatures of transient landscape evolution regimes. We find that (i) occurrences of planar topography form populations of discrete, insular landscape units, only some of which could be interpreted as fragments of a fluvially dissected, and/or tectonically fragmented, regional peneplain. (ii) The post-orogenic time required for achieving advanced stages of relief reduction is variable, ranging from 3 to 70聽Ma. (iii) Partly depending on whether the adjacent sedimentary basins were over- or underfilled, some erosion surfaces may have been controlled by raised base levels and may thus have formed at high elevations; however, in many cases they were disconnected from marine base levels by rapid surface uplift, thus acquiring their elevated positions in recent time. In some cases, subcrustal processes such as asthenospheric anomalies, and/or lithospheric slab tear or breakoff, explain extremely rapid, regional post-orogenic uplift. (iv) Overall, the conditions for achieving surface preservation in steep and tectonically active terrain are predictable but also quite varied and contingent on context. |
| [24] | . Isolated, laterally extensive, gently sloping surfaces known as summit flats are present at high elevations in many Laramide ranges, and are particularly well developed in the Uinta Mountains of northeastern Utah. To investigate the spatial distribution of these surfaces, and to consider possible controls on this pattern, a map of summit flats in the Uintas was developed from digital elevation data. Summit flats were identified as unglaciated areas of the landscape above an elevation of 3400 m, having a slope of less than 0.3 m m , and an area greater than 5 脳 10 km . As defined, summit flats comprise 43% of the unglaciated land area above 3400 m in the Uintas, with the largest individual flat covering nearly 34 km . To quantitatively evaluate the distribution of summit flats in the Uintas, the area of summit flats was normalized to the total unglaciated area above 3400 m in 10-km-wide swaths oriented normal to the range axis. Values of percent summit flats obtained by this method decrease dramatically westward, from a high of more than 60% at the eastern end of the Uintas, to 0% at the western end. Given that individual summit flats can be diminished through lateral erosion by surrounding valley glaciers, and that the summit flats themselves were apparently never glaciated, this result suggests that glacial erosion has been more effective in the western Uintas over the course of the Quaternary. Focused glacial erosion at the upwind end of the range is consistent with the hypothesis that the proximity of Lake Bonneville enhanced precipitation over the western Uintas during the Last Glacial Maximum [Munroe, J.S., and, Mickelson, D.M., 2002. Last Glacial Maximum equilibrium-line altitudes and paleoclimate, northern Uinta Mountains, Utah, U.S.A. Journal of Glaciology, 48, 257-266]. |
| [25] | . Landscapes on Earth retain a record of the tectonic, environmental and climatic history under which they formed. Landscapes tend towards an equilibrium in which rivers attain a stable grade that balances the tectonic production of elevation and with hillslopes that attain a gradient steep enough to transport material to river channels. Equilibrium low-relief surfaces are typically found at low elevations, graded to sea level. However, there are many examples of high-elevation, low-relief surfaces, often referred to as relict landscapes, or as elevated peneplains. These do not grade to sea level and are typically interpreted as uplifted old landscapes, preserving former, more moderate tectonic conditions. Here we test this model of landscape evolution through digital topographic analysis of a set of purportedly relict landscapes on the southeastern margin of the Tibetan Plateau, one of the most geographically complex, climatically varied and biologically diverse regions of the world. We find that, in contrast to theory, the purported surfaces are not consistent with progressive establishment of a new, steeper, river grade, and therefore they cannot necessarily be interpreted as a remnant of an old, low relief surface. We propose an alternative model, supported by numerical experiments, in which tectonic deformation has disrupted the regional river network, leaving remnants of it isolated and starved of drainage area and thus unable to balance tectonic uplift. The implication is that the state of low relief with low erosion rate is developing in situ, rather than preserving past erosional conditions. |
| [26] | . |
| [27] | . . |
| [28] | . . |
| [29] | |
| [30] | |
| [31] | . 王德基同志长期在我校从事地理方面的教学和科研工作,做了许多有益的工作,是一位受迫害的正直的知识分子,现发表他二十多年前的学术遗稿《祁连山东段的古剥蚀面》一文,同时发表李吉均同志的后记。一方面是为了使作者在这方面的劳动成果不被埋没;另一方面也是对他的纪念。 . 王德基同志长期在我校从事地理方面的教学和科研工作,做了许多有益的工作,是一位受迫害的正直的知识分子,现发表他二十多年前的学术遗稿《祁连山东段的古剥蚀面》一文,同时发表李吉均同志的后记。一方面是为了使作者在这方面的劳动成果不被埋没;另一方面也是对他的纪念。 |
| [32] | . 台维斯的侵蚀循准平原的理论是100年来影响地貌学最深刻的一种学说。中国地地文期研究直接来源于台维斯的理论,虽然至今有全新面貌,仍然有许多工作要做,特别是夷平面研究对青藏高原隆升等有重大的理论和实际意义,本文以华北唐县期夷平面为例说明夷平面不同构造单元表现不同,同一夷平面是多成因的,原始高度是彼此接近的。可以用来研究新构造运动的幅度与类型。夷平面研究中核心问题之一是形成年代的确定。 . 台维斯的侵蚀循准平原的理论是100年来影响地貌学最深刻的一种学说。中国地地文期研究直接来源于台维斯的理论,虽然至今有全新面貌,仍然有许多工作要做,特别是夷平面研究对青藏高原隆升等有重大的理论和实际意义,本文以华北唐县期夷平面为例说明夷平面不同构造单元表现不同,同一夷平面是多成因的,原始高度是彼此接近的。可以用来研究新构造运动的幅度与类型。夷平面研究中核心问题之一是形成年代的确定。 |
| [33] | |
| [34] | . 通过对六盘山地区山麓剥蚀面上 的红层和陇东盆地的红黏土剖面古地磁测年及地貌地层学研究,发现红层或红黏土均形成于约8.1 MaBP,指示了晚白垩世以来形成的夷平面在此时被断裂错开,发育终止,六盘山开始隆升;在约5.2 MaBP时再次小规模隆升,堆积相应的细砾沉积,并随后剥蚀形成山麓剥蚀面;到约3.8 MaBP,六盘山大规模加速隆起,河流急剧下切,河湖相沉积结束,典型风成红黏土沉积出现.六盘山的隆起过程可较好地与青藏高原及周边山地的隆起过程相对 比,它应是青藏高原隆升的响应. . 通过对六盘山地区山麓剥蚀面上 的红层和陇东盆地的红黏土剖面古地磁测年及地貌地层学研究,发现红层或红黏土均形成于约8.1 MaBP,指示了晚白垩世以来形成的夷平面在此时被断裂错开,发育终止,六盘山开始隆升;在约5.2 MaBP时再次小规模隆升,堆积相应的细砾沉积,并随后剥蚀形成山麓剥蚀面;到约3.8 MaBP,六盘山大规模加速隆起,河流急剧下切,河湖相沉积结束,典型风成红黏土沉积出现.六盘山的隆起过程可较好地与青藏高原及周边山地的隆起过程相对 比,它应是青藏高原隆升的响应. |
| [35] | . <p>黄土高原地区黄土之下的红粘土的年代和形成可为六盘山隆起、鄂尔多斯夷平面解 体以及青藏高原隆升等构造事件提供重要证据。六盘山东麓厚达303m的朝那黄土-红粘土剖面的磁性年代地层学表明:朝那红粘土开始堆积于8.1MaB.P.,是目前黄土高原上发现的最老的红粘土。8.1MaB.P.前后一次强烈构造运动使得鄂尔多斯夷平面解体,相对下沉地区接受红粘土沉积,六盘山地区开始隆起,这可能与青藏高原强烈的构造抬升事件有关。</p> . <p>黄土高原地区黄土之下的红粘土的年代和形成可为六盘山隆起、鄂尔多斯夷平面解 体以及青藏高原隆升等构造事件提供重要证据。六盘山东麓厚达303m的朝那黄土-红粘土剖面的磁性年代地层学表明:朝那红粘土开始堆积于8.1MaB.P.,是目前黄土高原上发现的最老的红粘土。8.1MaB.P.前后一次强烈构造运动使得鄂尔多斯夷平面解体,相对下沉地区接受红粘土沉积,六盘山地区开始隆起,这可能与青藏高原强烈的构造抬升事件有关。</p> |
| [36] | 357: |
| [37] | . 本 篇主要结合一个重要的变点问题──概率变点问题,来介绍几个常用的方法:极大似然法,累计记数法和Bayes法。 一、极大似然法. 这与熟知的极大似然估计法相似,即通过求似然函数(密度或概率之积)极大值去估计有关参数.此处变点本身是一个参数,且似然函数对它的依赖关系很复杂, . 本 篇主要结合一个重要的变点问题──概率变点问题,来介绍几个常用的方法:极大似然法,累计记数法和Bayes法。 一、极大似然法. 这与熟知的极大似然估计法相似,即通过求似然函数(密度或概率之积)极大值去估计有关参数.此处变点本身是一个参数,且似然函数对它的依赖关系很复杂, |
| [38] | . (I) 问题提法 一、内容概要 一般地说,变点就是“模型中的某个或某些量起突然变化之点”.这种突然变化往往反映事物的某种质的变化,在自然界、社会及各种领域中很常见且具有重要性, 虽则,从统计学发展的角度看,变点统计分析这个课题还不能说已发展得很充分成熟了(它迄今只有三 . (I) 问题提法 一、内容概要 一般地说,变点就是“模型中的某个或某些量起突然变化之点”.这种突然变化往往反映事物的某种质的变化,在自然界、社会及各种领域中很常见且具有重要性, 虽则,从统计学发展的角度看,变点统计分析这个课题还不能说已发展得很充分成熟了(它迄今只有三 |
| [39] | 介绍了变点分析理论,结合三峡 水库汛期的分期,阐述了均值变点、概率变点的理论与分析方法。采用宜昌站1882~2001年实测日流量资料,用均值变点分析方法对汛期每日最大洪峰构成 的时间序列进行分期;同时选择一定的阈值,在假定发生概率服从二项分布的条件下,应用概率变点分析方法进行分期,最后给出了三峡水库汛期的分期方式。经比 较表明,变点分析理论应用于汛期分期中,能反映来水的基本规律,具有一定的应用价值;但从理论上以及防洪的角度来讲,概率变点分析方法较均值变点方法更适 于水库汛期的分期计算。 . 介绍了变点分析理论,结合三峡 水库汛期的分期,阐述了均值变点、概率变点的理论与分析方法。采用宜昌站1882~2001年实测日流量资料,用均值变点分析方法对汛期每日最大洪峰构成 的时间序列进行分期;同时选择一定的阈值,在假定发生概率服从二项分布的条件下,应用概率变点分析方法进行分期,最后给出了三峡水库汛期的分期方式。经比 较表明,变点分析理论应用于汛期分期中,能反映来水的基本规律,具有一定的应用价值;但从理论上以及防洪的角度来讲,概率变点分析方法较均值变点方法更适 于水库汛期的分期计算。 |
| [40] | . 运用最大似然比和西沃兹信息标准的变点识别方法,对广东省主要江河1956-1999年的年径流量、汛期径流量、枯水期径流量和最小月径流量的年序列,进行均值变点和方差变点识别,得出径流量特征值存在变点的序列类型、时间位置、空间分布及时序变点前后的特征值变化状况,结合广东省降雨量序列变点识别、水利工程设施建设等气候和人类活动影响因素的分析,以揭示广东省河川径流量时空变异特征及主要成因.结果表明:广东省河川年径流量和汛期径流量序列的一致性较好,而枯水期径流量和最小月径流量序列的特征值变点具有普遍性,年均值明显增加,年际离散程度增大.枯水期径流量序列均值变点的典型时间位置为1973年和1980-1981年,分布于西江支流贺江、东江、粤东沿海螺河,由水库等蓄水工程的径流调节作用而形成;方差变点的典型时间位置为1981年,主要分布于北江、韩江、粤西鉴江、珠江三角洲的增江及网河区顶部干流水道,与特丰年1982年的枯水期大量降水有关.最小月径流序列主要为均值变点,不同河流的变点时间位置有较大差异,但多集中在1972-1973年,分布于西江支流、东江、韩江及粤东沿海河流、珠江三角洲的增江.珠江三角洲顶部的北江干流水道的径流量变异尤其典型,四种径流量序列均存在均值变点和方差变点,典型时间位置为1980-1981年和1992-1993年,是由网河区剧烈的人类活动改变了河道分流比所导致. . 运用最大似然比和西沃兹信息标准的变点识别方法,对广东省主要江河1956-1999年的年径流量、汛期径流量、枯水期径流量和最小月径流量的年序列,进行均值变点和方差变点识别,得出径流量特征值存在变点的序列类型、时间位置、空间分布及时序变点前后的特征值变化状况,结合广东省降雨量序列变点识别、水利工程设施建设等气候和人类活动影响因素的分析,以揭示广东省河川径流量时空变异特征及主要成因.结果表明:广东省河川年径流量和汛期径流量序列的一致性较好,而枯水期径流量和最小月径流量序列的特征值变点具有普遍性,年均值明显增加,年际离散程度增大.枯水期径流量序列均值变点的典型时间位置为1973年和1980-1981年,分布于西江支流贺江、东江、粤东沿海螺河,由水库等蓄水工程的径流调节作用而形成;方差变点的典型时间位置为1981年,主要分布于北江、韩江、粤西鉴江、珠江三角洲的增江及网河区顶部干流水道,与特丰年1982年的枯水期大量降水有关.最小月径流序列主要为均值变点,不同河流的变点时间位置有较大差异,但多集中在1972-1973年,分布于西江支流、东江、韩江及粤东沿海河流、珠江三角洲的增江.珠江三角洲顶部的北江干流水道的径流量变异尤其典型,四种径流量序列均存在均值变点和方差变点,典型时间位置为1980-1981年和1992-1993年,是由网河区剧烈的人类活动改变了河道分流比所导致. |
| [41] | . 基于变点原理,运用最大似然比和西沃兹信息标准方法,对广东省4种径流量序列进行均值变点和方差变点的识别,研究存在变点的河川径流量序列、时间位置、空间分布及变点后的特征值变化状况,以揭示广东省河川径流量时空变异特点。结果发现:广东省河川年径流量和汛期径流量序列的一致性较好,而枯期径流量和最小月径流量序列的特征值变点具有普遍性,年均值明显增加,年际离散程度增大,时间位置主要为1972—1973年和1981年两个时间段。枯期径流量序列均值变点的典型地区主要为东江流域,方差变点的典型地区主要为北江流域、韩江流域、粤西地区和珠江三角洲;最小月径流序列主要为均值变点,典型地区有东江流域、韩江流域;而北江入珠江三角洲的河川径流量变异尤其典型,4种径流序列均存在均值变点和方差变点。 . 基于变点原理,运用最大似然比和西沃兹信息标准方法,对广东省4种径流量序列进行均值变点和方差变点的识别,研究存在变点的河川径流量序列、时间位置、空间分布及变点后的特征值变化状况,以揭示广东省河川径流量时空变异特点。结果发现:广东省河川年径流量和汛期径流量序列的一致性较好,而枯期径流量和最小月径流量序列的特征值变点具有普遍性,年均值明显增加,年际离散程度增大,时间位置主要为1972—1973年和1981年两个时间段。枯期径流量序列均值变点的典型地区主要为东江流域,方差变点的典型地区主要为北江流域、韩江流域、粤西地区和珠江三角洲;最小月径流序列主要为均值变点,典型地区有东江流域、韩江流域;而北江入珠江三角洲的河川径流量变异尤其典型,4种径流序列均存在均值变点和方差变点。 |
| [42] | . 在以新疆1:250000 DEM数据为基础,通过认真分析新疆基本地貌特征,在GIS系统的支持下,利用邻域分析方法,选取 2×2,3×3,4×4,…,21×21,25×25,30×30等22个邻域分析窗口,运用均值变点分析法对其进行了最佳统计单元的计算,结果8×8的 网格大小(2.56 km~2)可作为曲线大小的拐点,即为曲线由陡变缓的阈值.从而得出基于1:250000 DEM的新疆地势起伏度计算的最佳统计单元为8×8的网格大小(2.56 km~2),并完成了新疆地势起伏度分级图的绘制. . 在以新疆1:250000 DEM数据为基础,通过认真分析新疆基本地貌特征,在GIS系统的支持下,利用邻域分析方法,选取 2×2,3×3,4×4,…,21×21,25×25,30×30等22个邻域分析窗口,运用均值变点分析法对其进行了最佳统计单元的计算,结果8×8的 网格大小(2.56 km~2)可作为曲线大小的拐点,即为曲线由陡变缓的阈值.从而得出基于1:250000 DEM的新疆地势起伏度计算的最佳统计单元为8×8的网格大小(2.56 km~2),并完成了新疆地势起伏度分级图的绘制. |
| [43] | . 以青藏高原区域大尺度SRTM3-DEM为数据源,运用GIS的窗口递增分析法依次计算2×2、3×3、4×4、5×5、…、32×32窗口下的地势起伏度,然后采用均值变点法科学的分析平均地势起伏度的最佳统计面积并进行分级分析,得出实验区最佳分析窗口面积为1.17km2,地势起伏度可分出八级,其中小起伏山地分布最广。高原边缘的地势起伏度普遍较大主要是由于构造运动与河流朔源侵蚀作用强烈;而高原内部地势较为平缓,冰川、冻土作用下的侵蚀搬运可能对地势起伏的影响更大。 . 以青藏高原区域大尺度SRTM3-DEM为数据源,运用GIS的窗口递增分析法依次计算2×2、3×3、4×4、5×5、…、32×32窗口下的地势起伏度,然后采用均值变点法科学的分析平均地势起伏度的最佳统计面积并进行分级分析,得出实验区最佳分析窗口面积为1.17km2,地势起伏度可分出八级,其中小起伏山地分布最广。高原边缘的地势起伏度普遍较大主要是由于构造运动与河流朔源侵蚀作用强烈;而高原内部地势较为平缓,冰川、冻土作用下的侵蚀搬运可能对地势起伏的影响更大。 |
| [44] | . 利用DEM数据提取河流地貌参 数在地貌学和水文学研究中具有重要意义,其中集水面积阈值的准确确定是关键环节,然而,目前对集水面积阈值的确定存在随意性和主观性.为了探讨如何确定提 取河网的最佳集水面积阈值,本文以青藏高原东缘杂谷脑河流域为例,基于SRTM-DEM数据,在利用ArcGIS水文分析模块计算不同集水面积阈值条件下 河网密度参数的基础上,通过均值变点分析法获取河网密度值变化的拐点,并计算最佳集水面积阈值.研究表明:随着集水面积阈值的改变,河网密度逐渐降低,利 用均值变点分析法所确定的最佳集水面积阈值为8.1 km2,该结果与1∶50万水系图相比,主干上吻合,支流上更具真实性.该方法可以较好地确定最佳集水面积阈值,可为其它地区水系提取提供参考. . 利用DEM数据提取河流地貌参 数在地貌学和水文学研究中具有重要意义,其中集水面积阈值的准确确定是关键环节,然而,目前对集水面积阈值的确定存在随意性和主观性.为了探讨如何确定提 取河网的最佳集水面积阈值,本文以青藏高原东缘杂谷脑河流域为例,基于SRTM-DEM数据,在利用ArcGIS水文分析模块计算不同集水面积阈值条件下 河网密度参数的基础上,通过均值变点分析法获取河网密度值变化的拐点,并计算最佳集水面积阈值.研究表明:随着集水面积阈值的改变,河网密度逐渐降低,利 用均值变点分析法所确定的最佳集水面积阈值为8.1 km2,该结果与1∶50万水系图相比,主干上吻合,支流上更具真实性.该方法可以较好地确定最佳集水面积阈值,可为其它地区水系提取提供参考. |
| [45] | . <p>山地类型的界定是科学认知山地规律的基础,对山地科学的发展有着基础性的意义。山地科学研究的出发点与落脚点,是为了促进山区区域在各方面的可持续发展,所以在山地类型界定的研究结果基础上对山区类型进行划分,是山区可持续发展的基本科学依据。采用GIS技术并结合DEM数据,对四川省的山地类型进行界定,同时对山区的类型进行划分。在山地类型界定涉及到的地形起伏度计算中,对均值变点法的应用结果进行了讨论与改进,得到地形起伏度最佳统计单元为9.92 km<sup>2</sup>。将四川省山地类型界定为丘陵、低山、中低山、中山、次高山、高山、极高山;将山区划分为纯丘陵县、半山区县、准山区县、显山区县、整山区县,并对山区发展的政策方向提出了一定的建议。</p> . <p>山地类型的界定是科学认知山地规律的基础,对山地科学的发展有着基础性的意义。山地科学研究的出发点与落脚点,是为了促进山区区域在各方面的可持续发展,所以在山地类型界定的研究结果基础上对山区类型进行划分,是山区可持续发展的基本科学依据。采用GIS技术并结合DEM数据,对四川省的山地类型进行界定,同时对山区的类型进行划分。在山地类型界定涉及到的地形起伏度计算中,对均值变点法的应用结果进行了讨论与改进,得到地形起伏度最佳统计单元为9.92 km<sup>2</sup>。将四川省山地类型界定为丘陵、低山、中低山、中山、次高山、高山、极高山;将山区划分为纯丘陵县、半山区县、准山区县、显山区县、整山区县,并对山区发展的政策方向提出了一定的建议。</p> |
| [46] | |
| [47] | . . |
| [48] | . 在分析黄土地貌沟沿线形态特征的基础上,提出了基于规则格网DEM,通过引入边缘检测算子提取并连接沟沿线候选点,并借助形态学方法滤除细碎线段,最终生成沟沿线的方法。黄土丘陵沟壑区的实验结果显示,Sobel、Roberts、Prewitt梯度算子检测得到的沟沿线封闭性较差,线段较零碎,与实际沟沿线不符,不适用于沟沿线的自动提取;而LOG算子提取的线段连续、精度高,是理想的沟沿线检测算子,能够实现黄土地貌沟沿线较准确、有效的自动提取。 . 在分析黄土地貌沟沿线形态特征的基础上,提出了基于规则格网DEM,通过引入边缘检测算子提取并连接沟沿线候选点,并借助形态学方法滤除细碎线段,最终生成沟沿线的方法。黄土丘陵沟壑区的实验结果显示,Sobel、Roberts、Prewitt梯度算子检测得到的沟沿线封闭性较差,线段较零碎,与实际沟沿线不符,不适用于沟沿线的自动提取;而LOG算子提取的线段连续、精度高,是理想的沟沿线检测算子,能够实现黄土地貌沟沿线较准确、有效的自动提取。 |
| [49] | . 提出了一种利用坡面汇流改进的 Snake模型实现黄土地貌沟沿线栅格点自动连接的新方法。该方法基于高分辨率DEM数据,利用正负地形边界处坡度转折特征,识别沟沿线点,进而用坡面汇 流方向场改进了Snake模型中的梯度矢量流场,指引分水线缓冲曲线向沟沿线点蠕移,达到有序连接沟沿线点从而实现正、负地形的自动分割的目的。对比实验 结果表明,该方法所识别的黄土沟沿线较好地逼近真实的地形特征。 . 提出了一种利用坡面汇流改进的 Snake模型实现黄土地貌沟沿线栅格点自动连接的新方法。该方法基于高分辨率DEM数据,利用正负地形边界处坡度转折特征,识别沟沿线点,进而用坡面汇 流方向场改进了Snake模型中的梯度矢量流场,指引分水线缓冲曲线向沟沿线点蠕移,达到有序连接沟沿线点从而实现正、负地形的自动分割的目的。对比实验 结果表明,该方法所识别的黄土沟沿线较好地逼近真实的地形特征。 |
| [50] | . 依据近30年来取得的地质、地 貌、地层、古生物等方面的资料,对"青藏运动主幕"进行讨论.青藏高原目前的主体是中新世-上新世漫长的侵蚀作用形成的、被抬升的主夷平面,这个主夷平面 在高原内部切过以中生界和古近系为主的变形岩系,向高原周边展布.3.6 Ma前后,高原内外发生强烈的构造运动开始隆升,形成大幅度的地形反差,启动了一个旺盛的磨拉石堆积时期,主夷平面开始解体.至今高原内部仍保持着完整的 准平原状态,山顶面和主夷平面之间的物质传输仍为主要的陆面过程.在高原边缘地带,河流强劲侵蚀,但目前尚未切入到腹地,各大江河最老阶地砾石层的年龄集 中于1.7~1.9 Ma.按照源于高原的各条江河现在的侵蚀能力估算,假使高原不再抬升,大约需要8.6 Ma高原就将被再次夷平.但考虑地貌循环后期阶段侵蚀会大幅减缓,8.6 Ma则足以使主夷平面消失殆尽,而进入老年、至少壮年期.表明高原面不可能于14 Ma甚至35 Ma前已达到目前的高度并维持至今.古生物资料表明,上新世早期柴达木盆地还生活着大象、长颈鹿、犀牛动物群和红土风化壳、植物群落一致显示湿热低地环 境.亚洲中部变干、黄土堆积也与青藏高原上新世晚期以来隆起密切相关. . 依据近30年来取得的地质、地 貌、地层、古生物等方面的资料,对"青藏运动主幕"进行讨论.青藏高原目前的主体是中新世-上新世漫长的侵蚀作用形成的、被抬升的主夷平面,这个主夷平面 在高原内部切过以中生界和古近系为主的变形岩系,向高原周边展布.3.6 Ma前后,高原内外发生强烈的构造运动开始隆升,形成大幅度的地形反差,启动了一个旺盛的磨拉石堆积时期,主夷平面开始解体.至今高原内部仍保持着完整的 准平原状态,山顶面和主夷平面之间的物质传输仍为主要的陆面过程.在高原边缘地带,河流强劲侵蚀,但目前尚未切入到腹地,各大江河最老阶地砾石层的年龄集 中于1.7~1.9 Ma.按照源于高原的各条江河现在的侵蚀能力估算,假使高原不再抬升,大约需要8.6 Ma高原就将被再次夷平.但考虑地貌循环后期阶段侵蚀会大幅减缓,8.6 Ma则足以使主夷平面消失殆尽,而进入老年、至少壮年期.表明高原面不可能于14 Ma甚至35 Ma前已达到目前的高度并维持至今.古生物资料表明,上新世早期柴达木盆地还生活着大象、长颈鹿、犀牛动物群和红土风化壳、植物群落一致显示湿热低地环 境.亚洲中部变干、黄土堆积也与青藏高原上新世晚期以来隆起密切相关. |
| [51] | . 详细考察获得了兰州马衔山-兴隆山活动断裂系4条断裂的几何细结 构、新活动性等定量资料.其中马衔山北缘断裂为一条规模大、活动性强的全新世逆左旋走滑断裂,而马衔山南缘断裂、兴隆山南缘断裂和兴隆山北缘断裂等其它3 条断裂均为其伴生的逆断裂,为晚更新世活动断裂.它们在深部均可以归并到马衔山北缘断裂这一主走滑断裂带上,是兰州地区重要的控震断裂,影响和制约着本区 的地震活动. . 详细考察获得了兰州马衔山-兴隆山活动断裂系4条断裂的几何细结 构、新活动性等定量资料.其中马衔山北缘断裂为一条规模大、活动性强的全新世逆左旋走滑断裂,而马衔山南缘断裂、兴隆山南缘断裂和兴隆山北缘断裂等其它3 条断裂均为其伴生的逆断裂,为晚更新世活动断裂.它们在深部均可以归并到马衔山北缘断裂这一主走滑断裂带上,是兰州地区重要的控震断裂,影响和制约着本区 的地震活动. |
