 , 王先彦, 王胜利
The neotectonic activity of Wanchuan catchment reflected by geomorphic indices
DAIYan, WANGXianyan, WANGShengli通讯作者:
收稿日期:2015-11-12
修回日期:2015-12-27
网络出版日期:2016-03-25
版权声明:2016《地理学报》编辑部本文是开放获取期刊文献,在以下情况下可以自由使用:学术研究、学术交流、科研教学等,但不允许用于商业目的.
基金资助:
作者简介:
-->
展开
摘要
关键词:
Abstract
Keywords:
-->0
PDF (1091KB)元数据多维度评价相关文章收藏文章
本文引用格式导出EndNoteRisBibtex收藏本文-->
1 引言
利用现代地表形态可反演近地表的构造活动过程,如何从现有的地貌形态中提取相关的构造活动信息是构造地貌研究的核心问题.现代3S技术的发展尤其是高分辨率数字高程模型(DEM)的出现,为构造地貌的定量化研究提供了新的契机.地貌形态指数是对由内力作用形成地貌的外在形态特征定量化的表达,它可以作为一个基本的勘查工具来识别正在经历快速构造变形的区域,将这些形态指数的结果综合起来分析,可以评估研究区域新构造活动状况,从而很好地揭示隐含在构造地貌中的构造活动信息[1].很多年轻的构造活动会很好地保留在现代地形当中,因此,地貌形态指数被广泛地运用到评估新构造活动研究中[2-6].构造活动对流域的地形和地貌的发展会产生控制和扰动作用,通过对扰动性质的研究,可以得到关于原始构造活动的方向及大小的信息[7-8].因此,对河流及其流域盆地形态的定量研究是了解构造活动与地表过程耦合作用的重要途径.宛川河流域位于兰州东部地区,该区域位于青藏高原东北缘,新构造活动活跃.为了更好地理解该区域的新构造活动特征,对该区域DEM高程数据进行处理,利用TecDEM及ArcGIS10.0提取河流纵剖面裂点及计算地貌形态指数,对其地表形态进行量化表达与分析.本文将选取山前曲折度(SMF),河谷宽高比(VF),流域盆地的不对称性(AF)等定量地貌形态指数,结合河流裂点的识别,分析宛川河流域一带的区域新构造活动特征.
2 研究区概况
宛川河为黄河的一级支流,其主体流经兰州东部的榆中盆地,全长75 km,流域面积为1801 km2.宛川河发源于兴隆山与马衔山之间的深切河谷中,流向东北,而后又转向西北,经桑园峡流入黄河(图1).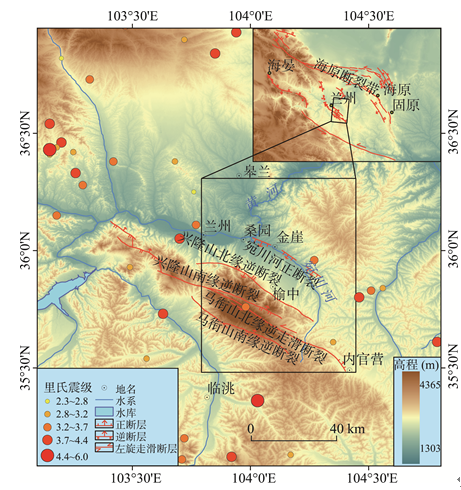 显示原图|下载原图ZIP|生成PPT
图1宛川河流域构造概况和近30年地震的分布(地震数据引自《中国地震信息网》)
-->Fig. 1Tectonic map of Wanchuan valley and the distribution of the earthquakes in recent 30 years (The seismic data from China Seismic Information)
-->
宛川河流经的榆中盆地属于民和盆地浅凹的一部分,是一个较为独立的,边缘由断裂控制的中,新生代陆内盆地.榆中盆地整体呈向东敞开,构造形态整体表现为走向北西,向东宽缓撒开的帚型复式褶皱构造,盆地地表大部分被第四系松散沉积物所覆盖[9].
研究区处在祁连山地震带与南北地震带的复合部位.位于研究区南部的马衔山--兴隆山为北西西向左旋逆走滑活动断裂系,由马衔山北缘左旋逆走滑断裂,兴隆山北缘逆断裂,兴隆山南缘逆断裂,马衔山南缘逆断裂组成(图1).
马衔山北缘断裂是兰州东部地区规模最大,新活动性最强的断裂,晚第四纪以来,其构造变形以走滑运动为主,其余3条为其伴生的1组逆冲断裂带[10].兴隆山和马衔山都是基岩山地,马衔山为前震旦系混合岩,花岗岩,片麻岩,变质岩构成的复背斜断块中高山,兴隆山为震旦系变质火山岩,变质砂岩,千枚岩和硅质灰岩构成的复向斜断块中山[11].另外,推测有位于宛川河北部的断裂,为兰州市区金城关断裂的东延部分,性质为半隐伏断裂[12].宛川河北部及东北部地区沉积不同厚度的风成黄土,是以变质岩为基底的黄土梁,峁地形[13].
3 数据来源与研究方法
3.1 数据来源
研究数据主要采用的是ASTER DEM(30 m分辨率),利用TecDEM[14-15]提取研究区的河网水系.拼接而成的DEM覆盖研究区面积为5400 km2.共提取54条河流及沟谷,利用TecDEM河流纵剖面,盆地分析功能,对每条河流纵剖面识别裂点及生成流域不对称性(AF)矢量图;山前曲折度(SMF)及河谷宽高比(VF)计算,成图则是借助于ArcGIS10.0平台完成.研究区地质构造图是通过对一系列地质图矢量化及叠加,修改后得到需要的地质概况图.3.2 河流纵剖面裂点提取及地貌形态指数计算原理,方法
3.2.1 河流纵剖面裂点提取在河流地貌研究中,河流纵剖面形态对流域内构造活动的响应极为敏感[16].在河流纵剖面上,裂点的发育是瞬态不均衡地貌系统最为典型的特征之一[17].在均衡条件下,河流纵剖面为平滑下凹形态;一旦河流发育受到扰动,如构造活动,河流系统就会处于瞬态的不平衡状态[18],在河流纵剖面上就会出现上凸的异常部位,即裂点[19-20].因此,河流裂点的分布及发育特征可以反映流域内断裂的活动情况.
河流裂点的提取有多种方法,主要有纵剖面高程陡降法[21],点坡度法[22],DS图识别法[19]及S-A双对数法[23-24]等.本文使用的是河流纵剖面高程陡降法,即目视解译法,通过纵剖面高程值陡降点判断裂点.在TecDEM功能界面中,直接利用Knickpoints Selection功能对提取出来的沟谷纵剖面识别裂点.
3.2.2 山前曲折度(SMF)
山前曲折度SMF(Mountain Front Sinuosity)描述的是山前缘的形态,反映过去及现在沿着山前缘发生的构造活动[5].SMF是对山前地貌形态定量化表达,这个指数常常被用作研究区域地质构造活动[25-29],并且也反映了山前缘的断裂活动与河流水系侵蚀之间的平衡关系[2].断层活动活跃的地区,往往会形成一系列的断层崖和断层三角面,山前缘的形态比较顺直.如果区域内构造活动稳定,由侵蚀活动占主导,则形成不规则的山前缘面[30].SMF的计算公式如下:
式中:SMF为山前曲折度;Lmf为沿着山前缘的实际距离;Ls为山前的直线距离.沿着山麓与谷底的相交处,测量Lmf的大小,为了测量的准确性,Ls的大小没有使用同一值.山前缘的形态越顺直,SMF的值越接近于1,表明区域的构造活动越活跃.如果侵蚀活动比较强烈,SMF的值大于2,表明区域构造稳定[2].构造活动活跃的山前缘曲折度值在1.0~1.4之间,较活跃及不活跃的山前缘曲折度值分别为1.4~3.0和> 3.0[31].
3.2.3 河谷宽高比(VF)
河谷宽高比VF(Valley Floor Height-to-Width Ratio)指数被用来定量描述河谷的横剖面形态,进而指示区域隆升状况[1].如果区域构造活动强烈,河流下切侵蚀,河谷形态呈深而窄的V形.若河道侵蚀基准面趋于稳定且构造活动不活跃,河谷将发生侧向侵蚀,谷底拓宽,形成宽而浅的河谷.VF值间接指示了河流的下切侵蚀速率,反映了区域的隆起速率.VF值的算法公式如下:
式中:VF为河谷宽高比;Vfw为谷底宽度;Eld,Erd分别为河谷两侧谷肩高程;Esc为谷底高程.若VF值低(< 1),河谷为"V"形,表明区域存在快速隆升,河流下切侵蚀强烈[2];若VF值高,河谷较宽,表明构造活动不强烈,河流向下侵蚀速率小.断裂活动发生后,地形对其的响应会不断向上游传递,因此,将分析的河谷横剖面选定在靠近断层线附近[2].一般选取距离断层向上游500~1000 m处计算VF的值[32].
3.2.4 流域盆地非对称性指数(AF)
流域盆地非对称性指数AF(the drainage basin asymmetry factor)由Cox[33]提出,通过盆地横向地形的对称性来研究河道迁移原因.尽管AF指数并没有为区域掀斜提供直接的证据,但是它只靠地形图就能快速识别构造区域可能存在的掀斜要素.因此对于构造活动隐蔽的区域,如表面断层极少出露或没有出露,AF指数有助于估测近期发生的构造活动.AF计算公式如下:
式中:AF为流域盆地非对称性指数;Da为盆地中线到河流主干的距离;Dd为盆地中线到盆地边界的距离.AF指数的计算借助于TecDEM半自动化完成,流域盆地中线采用距离曲率方法得到[15].提取流域盆地设定的Strahler等级为3,手动依次提取盆地中线及主河流,采用距离为2 km的等间距进行计算.Strahler等级为3及2 km的等距离间隔都是为了可以获得比较合理的盆地分布图及非对称性矢量图,本文共计算了研究区29个小流域盆地的AF值.
4 计算结果
4.1 裂点的分布
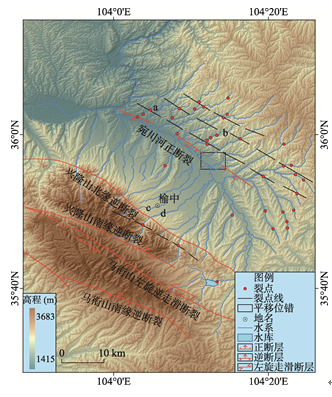
通过TecDEM程序界面对52条河(沟)谷纵剖面进行了裂点的识别,提取出了多个裂点.宛川河南部支流谷地纵剖面多为下凹,平滑的曲线(图2c),较少的沟谷有个别裂点发育(图2d);而宛川河北部支流纵剖面往往发育多个裂点(图2a,图2b). 显示原图|下载原图ZIP|生成PPT
图2宛川河北部支流(a,b)和南部支流(c,d)的典型河(沟)纵剖面图(K-裂点;a,b,c,d支流位置见
-->Fig. 2Longitudinal river profiles of the branches in the north (a, b) and south (c, d) of Wanchuan valley (K-Knickpoints; The locations of the river a,b,c,d are also shown in
-->
裂点主要集中分布于宛川河的北侧,南侧靠近兴隆山附近分布较少(图3).宛川河北侧的沟谷裂点沿着宛川河断裂依次向后排列分布,裂点多且密集;南部的裂点主要分布于兴隆山断层线以南,且分布于河流中上游区域.
 显示原图|下载原图ZIP|生成PPT
图3宛川河流域裂点分布(a,b,c,d为
-->Fig. 3Knickpoints distribution of Wanchuan Valley (a,b,c,d in
-->
4.2 山前曲折度(SMF)
沿着同一基准面(山麓与谷底的交界面),在宛川河南部的兴隆山前缘测量了6处山前缘的曲折度,在宛川河北测量了8处,结果如表1所示.Tab. 1
表1
表1兴隆山北与宛川河北SMF和VF值
Tab. 1The values of the mountain front sinuosity index and the valley floor height-to-width radio index in the Xinglong Mountain and the north of Wanchuan Valley
| 兴隆山北 | 宛川河北 | ||
|---|---|---|---|
| SMF | VF | SMF | VF |
| 1.83 | 0.55 | 1.03 | 0.36 |
| 1.86 | 1.97 | 1.08 | 0.38 |
| 2.10 | 1.90 | 1.09 | 0.44 |
| 2.21 | 2.11 | 1.09 | 0.47 |
| 2.60 | 4.18 | 1.13 | 0.51 |
| 2.88 | 5.09 | 1.14 | 0.54 |
| 7.71 | 1.17 | 0.59 | |
| 8.46 | 1.18 | 0.65 | |
| 11.86 | 0.65 | ||
| 13.00 | 0.81 | ||
| 0.88 | |||
| 1.06 | |||
| 1.05 | |||
| 2.34 | |||
新窗口打开
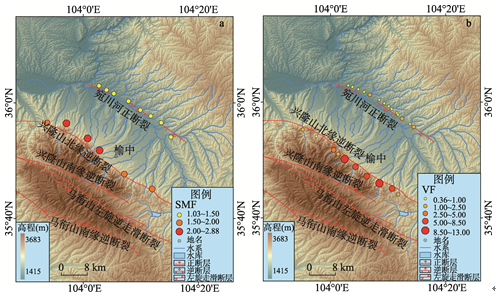
兴隆山北前缘SMF在1.83~2.88,均值为2.25;宛川河北SMF值为1.03~1.18,均值为1.11.两处的SMF值均小于3.0,兴隆山北SMF值要大于宛川河北(图4a).
 显示原图|下载原图ZIP|生成PPT
图4宛川河流域SMF(a)和VF(b)形态指数分布
-->Fig. 4The distribution of mountain front sinuosity index and valley floor height-to-width radio index
-->
4.3 河谷宽高比(VF)
为了确保选定的河谷横剖面均靠近断层线附近,借助ArcGIS10.0平台,首先对宛川河北断裂及兴隆山北缘断裂线作其缓冲区,范围为1 km,在缓冲区边缘提取沟谷剖面,宛川河北提取14处沟谷横剖面,兴隆山北侧提取10处.根据计算公式(2)计算其VF值.南部兴隆山的VF值在0.55~13,均值为5.68;宛川河北部的VF值范围在0.36~2.34,平均值为0.77(表1).宛川河河北VF值要远远小于兴隆山北侧的VF值,且约79%左右的VF < 1的区域分布在宛川河北(图4b),说明宛川河北有强烈的新构造活动.4.4 流域盆地非对称性(AF)
通过TecDEM半自动化的程序计算了研究区29个小流域盆地的AF值,得到AF矢量分布(图5). 显示原图|下载原图ZIP|生成PPT
图5宛川河流域AF矢量分布
-->Fig. 5The distribution of the drainage basin asymmetry factor
-->
宛川河南北两侧AF指向都呈一定的规律性.在南部兴隆山附近的AF指数分布分为两个部分,以1桑园峡为界,在其左侧AF指向为北西西向,右侧的AF指向大致为北东东向.宛川河北部的AF指向除2,3处异常外,其余指向均为东南向.
5 结果分析与讨论
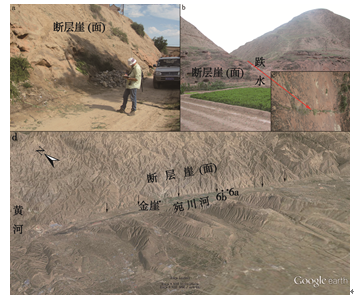
河谷裂点主要与断层和岩性有关,而宛川河北部及东北部地区主要地层为变质岩基底和其上覆的不同厚度的风成黄土[13],区域岩性均一,因此其裂点的形成主要与构造活动有关.南部裂点以兴隆山北缘断层线为界,兴隆山主要是以变质岩为主,岩性基本一致[11],因此位于山体上的裂点也主要受构造控制;榆中盆地基底为前寒武系变质岩,盆地中沉积厚层的第四纪冲洪积卵砾石(最大厚度达300 m)[34],因而盆地内形成的裂点可能与冲积扇堆积体有关.另外兴隆山东部一裂点位于水库边缘,可能与水库有关,指示水库出口.断裂活动发生后,穿过断层支流的纵剖面受到扰动,出现裂点,之后河流纵剖面通过不断向均衡状态调整而持续向上游迁移,裂点会平行后退,尽管不同支流流域面积大小不一致,但裂点的纵向迁移速度相近,最后会出现在相近的高度,近似与断层走向平行分布[23].,宛川河流域北部裂点分布尽管很密集,但是在宛川河断裂东北方向的裂点近水平方向呈现一定的规律性,裂点的展布基本与断层线平行,且同一展布线上裂点大致分布在一定的高度(图3).此外在宛川河断裂东南也分布有数个与断层线并不平行分布的裂点.南部位于兴隆山南缘断层线以北地区的裂点连线,同样近似于断层线平行展布.这两个区域裂点连线与断层总体呈近平行分布的特征,也证实了这些裂点与切割了支流的边界断裂的断层活动相关.位于平行边界断层的同一直线上海拔高度相近的裂点,应该形成于同一次断裂活动中,并且以大致相同的纵向溯源侵蚀速度不断后退[23-24].相比与兴隆山断层以南裂点分布在一条与断层平行的直线上,宛川河断裂东北方向裂点分布总体上表现出的多条近平行的不同海拔的线状分布,可能表明宛川河断裂存在多期新构造活动,导致多期裂点在断层的下盘(上升盘)形成,并向上游溯源侵蚀,最后分布在不同的高度.而在一些支流(如图2和图3中的支流b)在相近的与断层平行的裂点连线间,存在相比于其它支流更多的裂点,可能是由于河道的崩塌形成,也有可能是DEM数据精度较低形成的误差导致,需要进一步调查和分析.而宛川河断裂东南方向散布的与断层面并不平行的裂点与宛川河断裂的下盘抬升可能没有关系.SMF及VF分别是对山前形态,河谷横剖面形态定量化,其值大小能指示研究区构造活动状况.SMF值在1.0~1.4之间表明构造活动非常活跃,构造活动活跃或不活跃的SMF值分别为1.4~3.0和> 3.0[31].测量得到的SMF值均在3.0以下,说明研究区的断层活动活跃.宛川河北SMF均值为1.11,说明断层活动性强.野外观察到宛川河北部山前断层崖出露明显,整个山前缘近乎呈平直的延伸(图6d).如图6a和图6b宋家窑断裂是宛川河断裂的一部分,线性顺直的断层陡崖发育;断层面(崖)走向为东南--北西向,向南西倾,倾角为约80°;断层性质为正断层,断层面为第三纪红色砂岩组成,断层下盘被错断抬升于地表之上,被约50 m黄土覆盖,上盘被第四纪松散堆积埋藏于地表之下.断层下盘第三纪红色碎屑岩沉积层面上紧临断层崖处发育多组东南--北西向平行于断层崖的裂缝(图6c).
 显示原图|下载原图ZIP|生成PPT
图6宛川河北断层活动形成的断层崖和地表裂缝(a. 宋家窑村(金崖镇东,金崖镇位置见
-->Fig. 6Photos showing the fault scarp and fracture (a. Fault facet at Songjiayao village (east of Gaoya, see location in
-->
此外,穿过断层崖近西北--东南方向多条支沟在沟尾形成跌水和裂点.如图6c中部的支沟,其坡度约为10°,沟尾位于断层崖,形成跌水,该支沟向北延伸3 m和12 m分别形成两个裂点(图6c).这些特征显示了宛川河断裂的正断层性质的活动特征.兴隆山北侧SMF均值为2.25,说明地表侵蚀程度高,山前表现为被侵蚀后的不规则形态.兴隆山北侧河流沟谷水系相对宛川河北部而言河流裂点并不发育,且其地表侵蚀程度更高,表明引起地形特征变化的最后一次断裂活动发生时间年代较久.宛川河支流沟谷断层线向上游1 km处的VF均值为0.77,远远小于兴隆山北缘断层线均值5.68,且宛川河北部支流VF值普遍小于1,也表明宛川河北存在影响侵蚀基准面的活动构造,导致穿过宛川河边界断层支流沟谷强烈下切侵蚀,河谷呈"V"形.一些断层活动往往造成区域范围内的发震活动,地震资料记录表明马衔山北缘断裂带在1125年发生7级地震,宛川河在406年曾发生6级地震[12].近30年以来,研究区也发生过多次小型地震(图1).这与SMF,VF值指示的这两条断层存在新构造活动的认识一致.
图5中1处桑园峡AF的分布在两侧呈现相反的方向,表明该处可能存在褶皱隆起.该区域的构造变形机制分析表明,马衔山北缘逆断裂的走滑运动控制及影响该区域的构造变形[10].在其东端由于断裂的张扭作用形成内官营拉分盆地,西部则因断层弯曲产生褶皱和冲断作用,包括桑园峡隆起[35].1处右侧的AF指向大致为北东东向,揭示了该区域可能存在北东东向掀斜断块运动.宛川河在中下游流向为北西西向,其河道的迁移极有可能是受到该掀斜断块的影响.在区域北东东向构造应力场作用下,形成了北西西向挤压逆冲山(马衔山--兴隆山)[36],因此位于1处右侧AF的指向指示了该区域的构造应力场方向.宛川河北部的AF指向为东南向,指示该处可能也存在该方向的掀斜逆冲断块,此处有可能受到海原大型左旋走滑断层的影响.宛川河北2,3处AF指向异常,2处为相向分布,3处为相反分布,推测3处可能存在褶皱隆升,2处可能为一断陷盆地.2处两侧可能是断层边界,发生逆冲掀斜运动;宛川河北断裂东南部散布的裂点也可能与推测的逆冲掀斜运动有关;还需要更多的野外调查工作来证实.宛川河在2处之前的流向为向北方向,经过此处后河流的流向发生了偏转,有可能为该处断块掀斜逆冲运动,形成了北陡南缓的地形,导致河流流向由北改向西北.前面的研究确认了宛川河断裂的存在,同时发现该处存在多期断裂活动,而宛川河东端支流沟谷的平移位错(如图3中黑色矩形框中穿过断层支流的东西向位错),可能指示宛川河断裂的东端存在走滑运动.由此推测2,3处的异常可能是由走滑运动形成的,即断裂的张扭与弯曲作用形成了2处的断陷与3处的褶皱隆起.
6 结论
通过对河流纵剖面,山前缘形态,河谷横剖面以及盆地地形等地貌特征的定量计算和分析,讨论了研究区新构造活动的特征,获得以下认识:(1)裂点反映了研究区存在多期构造活动,将裂点的分布与野外观察到的断层崖(面)相结合,发现前人推测的宛川河北断裂存在活动性.
(2)SMF及VF值揭示宛川河流域存在区域构造抬升运动,且宛川河北部新构造活动可能比南部马衔山--兴隆山一带活跃的事实.
(3)AF矢量图清楚地显示了区域的构造应力场方向,识别出了掀斜逆冲断块及褶皱隆起.断块的掀斜逆冲是河流改向的原因,同时发现宛川河北断裂也存在走滑活动.
The authors have declared that no competing interests exist.
参考文献 原文顺序
文献年度倒序
文中引用次数倒序
被引期刊影响因子
| [1] | . |
| [2] | . This paper focuses on the northern Upper Rhine Graben (URG), which experienced low tectonic deformation and multiple climate changes during Quaternary times. Recently, human modifications have been high. The paper presents the results of a study into the effects of fault activity on the landscape evolution of the area. The study aims to detect active faults and to determine the last phase of tectonic activity. Information on the long-term tectonic activity is gained from the geological record (drainage system, sediment distributions, fluvial terraces, fault mapping). Previous studies are reviewed and supplemented with new data on tectonic activity. The compilation of all data is presented as a series of paleogeographic maps from Late Miocene to present. It is demonstrated that differential uplift of the western margin of the northern URG had significant impact on the drainage system, the formation of fluvial terraces and the landscape of the western graben shoulder. In a second part of the paper, the imprint of tectonics on the present-day landscape is investigated at the regional scale in order to determine the location of fault scarps and tectonically influenced parts of the drainage system. This study uses an integrated analysis of topography, drainage patterns and fault network. The comparison of features suggests a structural control by numerous NNE- and NNW-oriented intra-graben faults on the flow directions of streams in the Rhine Valley. Several scarps in the Rhine Valley are identified and interpreted to result from intra-graben faulting activity, which in turn controlled fluvial dissection. The third part of the paper presents quantitative measurements of the present-day landscape shape. Calculations of geomorphic indices are used to determine the balance between erosional and tectonic processes and to identify active fault segments. The mountain-front sinuosity and valley shape indices measured along the border faults and in the footwall area are used to determine the level of activity of the faults. Stream profiles of the western and eastern catchments of the River Rhine are investigated for gradient changes at the crossing of the border faults. The combined interpretation of geomorphic indices points to active border fault segments on both sides of the graben. Based on the integration of all results it is concluded that the tectonic morphology identified for the northern URG formed in response to long-term, low level tectonic processes. Due to a significant decrease in erosional and depositional activity during the last 15,000years, the tectonic morphology has probably been preserved until present. |
| [3] | . 河流地貌形态定量研究是了解构造活动与地表过程耦合作用的重要途径之一。霍山山脉位于山西地堑系中部,介于临汾盆地和太原盆地之间,以发育霍山山前断裂带和1303年洪洞<em>M</em><sub>S</sub>8级地震而著名,通过分析跨断裂带及周边的48条河流的纵剖面形态、SL参数、Hack剖面、面积高程积分曲线以及HI值等,得到以下认识:1)跨断裂带的河流,其纵剖面在断层两侧的形态具明显差异,反映其受断层活动控制,而其他河流,除极少部分在上游存在局部陡变外,纵剖面为近似下凹的指数曲线形态显示近均衡状态; 2)河流的HI值及积分曲线显示了霍山地区新生代以来整体处于强抬升弱侵蚀状态,即所有河流均处于壮年或幼年期; 3)48条河流一致上凸的Hack剖面也表明霍山地区新生代以来处于强烈的构造抬升阶段,跨断裂带的Hack剖面形态以陡变下降而区别与其他河流的近似圆弧形; 4)跨断裂带河流的 SL/K 参数在断层附近出现异常高值,反映了 SL/K 参数与断层垂直差异运动的相关性,周边其他河流的 SL/K 参数反映了没有差异运动的准均衡状态,局部的异常高值可能对应不同基岩的抗风化能力差异。河流地貌定量参数与构造环境存在显著的相关性,河流地貌定量参数特征揭示霍山山前断裂带在新生代以来的强烈垂向运动特征。 . 河流地貌形态定量研究是了解构造活动与地表过程耦合作用的重要途径之一。霍山山脉位于山西地堑系中部,介于临汾盆地和太原盆地之间,以发育霍山山前断裂带和1303年洪洞<em>M</em><sub>S</sub>8级地震而著名,通过分析跨断裂带及周边的48条河流的纵剖面形态、SL参数、Hack剖面、面积高程积分曲线以及HI值等,得到以下认识:1)跨断裂带的河流,其纵剖面在断层两侧的形态具明显差异,反映其受断层活动控制,而其他河流,除极少部分在上游存在局部陡变外,纵剖面为近似下凹的指数曲线形态显示近均衡状态; 2)河流的HI值及积分曲线显示了霍山地区新生代以来整体处于强抬升弱侵蚀状态,即所有河流均处于壮年或幼年期; 3)48条河流一致上凸的Hack剖面也表明霍山地区新生代以来处于强烈的构造抬升阶段,跨断裂带的Hack剖面形态以陡变下降而区别与其他河流的近似圆弧形; 4)跨断裂带河流的 SL/K 参数在断层附近出现异常高值,反映了 SL/K 参数与断层垂直差异运动的相关性,周边其他河流的 SL/K 参数反映了没有差异运动的准均衡状态,局部的异常高值可能对应不同基岩的抗风化能力差异。河流地貌定量参数与构造环境存在显著的相关性,河流地貌定量参数特征揭示霍山山前断裂带在新生代以来的强烈垂向运动特征。 |
| [4] | . 祁连山脉位于青藏高原东北缘,在北西-南东方向上绵延600多公里,而榆木山就位于活跃的还在生长的祁连山脉山前地带。榆木山是在祁连山北缘隐伏逆冲断层上盘发育的背斜,此东北向断层还未在第四纪地表出露。榆木山地块内部断裂新生代以来活动强烈,且由南往北逐次变新且强度规模逐渐减弱。本文提取榆木山地区的河长坡降指标(SL),测高分析曲线(HI)与流域不对称性(AF)地貌指数,发现榆木山南坡与北坡存在明显的不同。SL的变化主要反映榆木山构造活动的变化信息,与岩性和气候因素关系不大,且SLk分析显示其Z-score异常与断层分布有较强的相关性,Z-score异常值分布于距断层线250m范围以内; AF相反分布于榆木山背斜两翼,此背斜的形成与祁连山北缘隐伏逆冲断层有关;面积高度曲线与HI值在榆木山南、北坡存在差异,北坡在地貌侵蚀阶段上相对南坡较 . 祁连山脉位于青藏高原东北缘,在北西-南东方向上绵延600多公里,而榆木山就位于活跃的还在生长的祁连山脉山前地带。榆木山是在祁连山北缘隐伏逆冲断层上盘发育的背斜,此东北向断层还未在第四纪地表出露。榆木山地块内部断裂新生代以来活动强烈,且由南往北逐次变新且强度规模逐渐减弱。本文提取榆木山地区的河长坡降指标(SL),测高分析曲线(HI)与流域不对称性(AF)地貌指数,发现榆木山南坡与北坡存在明显的不同。SL的变化主要反映榆木山构造活动的变化信息,与岩性和气候因素关系不大,且SLk分析显示其Z-score异常与断层分布有较强的相关性,Z-score异常值分布于距断层线250m范围以内; AF相反分布于榆木山背斜两翼,此背斜的形成与祁连山北缘隐伏逆冲断层有关;面积高度曲线与HI值在榆木山南、北坡存在差异,北坡在地貌侵蚀阶段上相对南坡较 |
| [5] | . The Karewa Basin nestled between the Pir Panjal Range and the Great Himalayan Range, in Northwest India, has been studied to understand its tectono-geomorphic evolution on the basis of geomorphic indices and morphotectonic parameters supported by the field evidences. Satellite data, topographic maps and digital elevation model (DEM) were used to extract various parameters at various spatial scales. Four watersheds, representative of the entire Karewa Basin, were chosen for detailed studies on the basis of the researchable evidence of the complete sequence of the stratigraphic record and the preservation of geomorphic landscapes. The integrated analysis of the geomorphic and morphometric data provides evidence of the relative variations in the tectonic activity among the watersheds. Geomorphic indices suggest a relatively high degree of tectonic activity along the Pir Panjal side of the Karewa Basin. This variation in the relative degree of tectonic activity is consistent with the field evidence, fault/lineament locations and the landscape geometry of the Karewa Basin. Based on the results from this study, it is suggested that Late Quaternary climate changes, tectonic uplift and erosion of the Pir Panjal Range and changing geometry of the Karewa Lake have played a key role in the evolution of the geomorphic landscape of the Kashmir Valley. |
| [6] | . This work applies recent advances in tectonic geomorphology in order to understand the geomorphic evolution of the Jamaican restraining bend located along the Caribbean-Gon芒ve-North American plate boundary. We propose a classification of landscapes according to their erosional stages. The approach is mainly based on the combination of two DEM-based geomorphic indices: the hypsometric integral which highlights elevated surfaces, and the surface roughness which increases when the relief is incised by the drainage network. River longitudinal profiles were also analyzed as the drainage network responds quickly to base-level change triggered by external forcing such as tectonics. Anomalies in river profiles (knickpoints and convex segments) were mapped using stream length-gradient (SL) and normalized steepness (k) indices. The results provide new insights for understanding the complex evolution of the Jamaican restraining bend. Three main morphotectonic regions were identified in Jamaica: (1) the Blue Mountain-Wagwater unit located at the eastern tip of the island, (2) the Jamaican highlands plateau which covers most of the northern and central areas and (3) the tilted block province located along the southern part of Jamaica. Each region has a specific morphological signature which marks a different stage in the Late Miocene to present evolution of the Jamaican restraining bend. The evolution of the bend is mainly associated with the western propagation of major E-trending strike-slip faults and NW-trending thrusts. In the western and central parts of Jamaica the present-day motion between the Caribbean plate and the Gon芒ve microplate is broadly distributed along several structures, while in the easternmost part of the island this motion seems to be almost completely accommodated along the Blue Mountain range and the Plantain-Garden Fault. |
| [7] | . ABSTRACT Object-based classification is a promising technique for image classification. Unlike pixel-based methods, which only use the measured radiometric values, the object-based techniques can also use shape and context information of scene textures. These extra degrees of freedom provided by the objects allow the automatic identification of geological structures. In this article, we present an evaluation of object-based classification in the context of extraction of geological faults. Digital elevation models and radar data of an area near Lake Magadi (Kenya) have been processed. We then determine the statistics of the fault populations. The fractal dimensions of fault dimensions are similar to fractal dimensions directly measured on remote sensing images of the study area using power spectra (PSD) and variograms. These methods allow unbiased statistics of faults and help us to understand the evolution of the fault systems in extensional domains. Furthermore, the direct analysis of image texture is a good indicator of the fault statistics and allows us to classify the intensity and type of deformation. We propose that extensional fault networks can be modeled by iterative function system (IFS). |
| [8] | . The Main Ethiopian Rift (MER) is magmatically segmented and seismically active. The magmatic segments are arranged en echelon (e.g. Ebinger, C.J., Casey, M., 2001. Continental breakup in magmatic provinces: An Ethiopian example. Geology Society of America Bulletin, vol. 12, pp. 527-530). Furthermore they are about 50 km long and up to 20 km wide, orientated about N10掳-20掳E, and are therefore oblique to the main direction of Mid-Miocene border faults (N35掳E). In this paper we propose that these segments not only represent magmatic but also tectonic segmentation. We use the association of the high spectral resolution of Landsat data (principal component analysis and classifications) and the very high spatial resolution of digitized aerial photographs to characterize and quantify the deformation along the rift. Additionally, several digital elevation models of metric resolution have been produced at different locations along the segments in order to quantify and describe the faulting. We define 4 tecto-magmatic segments (Gedemsa, Bosetti, Kone and Fantale), 40-70 km, 10-15 wide, arranged en echelon and N10掳-20掳E orientated. Each tecto-magmatic segment (TMS) is separated by 2-18 km wide domains exhibiting minor deformation. Furthermore, the TMS overlap in a N-S direction and show similar symmetrical deformation patterns. Within an individual segment deformation varies from its centre, where it is essentially magmatic, to its tips, where brittle deformation is predominant. The largest volumes of recent basalt are erupted in the centres and nearby. In contrast, recent magma injections are absent in the tip domains. It seems probable that dikes connect laterally to, and are fed by, the magmatic centres. Dikes are sub-parallel to the segment axis and therefore orientated normal to the recent extension direction. Within the TMS, aligned cones, atypical fault geometries, en echelon fault segments, and atypical displacement-length ratios all suggest that faulting is dike-induced. Along axis propagation of the TMS generate interactions between younger (Quaternary) intra-rift faults and older (Mid-Miocene) border faults. Thus, at the deformed tips, cross-cutting and long curved faults are produced. The fault interactions in the MER confirm that the border faults have been inactive during the recent stage of rifting. We discuss the implications of oblique rifting with moderate obliquity ( 伪 = 27掳, angle between the extension direction and the trend perpendicular to the rift) at slow extension rates on active rifting processes associated with intermediate continental crust. The tecto-magmatic segmentation mirrors crustal segmentation beneath the rift axis, as indicated from 3-D-tomography (Daly, E., Keir, D., Ebinger, C., Stuart, G., Ayele, A., Waltham, D., 2007. Crustal structure of the northern Main Ethiopian Rift from a tomographic inversion of local earthquakes. Geophysical Journal International, in press; Keranen, K., Klemperer, S.L., Gloaguen, R., EAGLE Working Group, 2004. Three-dimensional seismic imaging of a protoridge axis in the Main Ethiopian rift. Geology 32 (11), 949-952). These long and narrow zones (40-70 km long and 10-15 km wide), where deformation is generated principally by diking and is associated with magmatic centres, have similarities with along-axis segmentation at mid ocean ridges. Consequently, deformation distribution and type in the MER can be considered the outcome of a transition between continental and active oceanic rifting. |
| [9] | 榆中盆地是一个较为独立的、边缘由断裂构造控制的中、新生代陆内盆地,基底为前寒武系变质岩,盆内含煤地层为中侏罗统阿干镇组,为河流相沉积体系;含煤地 层及煤层赋存主要受断裂构造控制,控煤构造样式主要有逆冲叠瓦型、背斜-断裂组合、半地堑型。通过对榆中盆地的地质条件进行研究,结合以往的找煤成果,该 区找煤方向主要应以逆冲断层的上盘和正断层的下盘为主,推断在盆地的东南缘和羊寨拗陷为煤炭资源的有利地段,也是今后进行煤田地质勘探的重点区域。 榆中盆地是一个较为独立的、边缘由断裂构造控制的中、新生代陆内盆地,基底为前寒武系变质岩,盆内含煤地层为中侏罗统阿干镇组,为河流相沉积体系;含煤地 层及煤层赋存主要受断裂构造控制,控煤构造样式主要有逆冲叠瓦型、背斜-断裂组合、半地堑型。通过对榆中盆地的地质条件进行研究,结合以往的找煤成果,该 区找煤方向主要应以逆冲断层的上盘和正断层的下盘为主,推断在盆地的东南缘和羊寨拗陷为煤炭资源的有利地段,也是今后进行煤田地质勘探的重点区域。 |
| [10] | . 详细考察获得了兰州马衔山-兴隆山活动断裂系4条断裂的几何细结 构、新活动性等定量资料.其中马衔山北缘断裂为一条规模大、活动性强的全新世逆左旋走滑断裂,而马衔山南缘断裂、兴隆山南缘断裂和兴隆山北缘断裂等其它3 条断裂均为其伴生的逆断裂,为晚更新世活动断裂.它们在深部均可以归并到马衔山北缘断裂这一主走滑断裂带上,是兰州地区重要的控震断裂,影响和制约着本区 的地震活动. . 详细考察获得了兰州马衔山-兴隆山活动断裂系4条断裂的几何细结 构、新活动性等定量资料.其中马衔山北缘断裂为一条规模大、活动性强的全新世逆左旋走滑断裂,而马衔山南缘断裂、兴隆山南缘断裂和兴隆山北缘断裂等其它3 条断裂均为其伴生的逆断裂,为晚更新世活动断裂.它们在深部均可以归并到马衔山北缘断裂这一主走滑断裂带上,是兰州地区重要的控震断裂,影响和制约着本区 的地震活动. |
| [11] | . . |
| [12] | 兰州地区发育了NWW向和NNW向2组主导性活动构造带.大致以河口为界,东部地区主要为 NWW向的马衔山-兴隆山左旋逆走滑活动断裂系,其新活动明显,是区内的主要控震断裂,1125年兰州7级地震就发生在其中的马衔山北缘断裂带的西端.河 口以西为拉脊山北缘断裂和庄浪河断裂等1组NNW向的弧形逆冲断褶带,变形方式以断裂扩展褶皱为主,其新活动可能导致了138年金城-陇西63/4级地 震、1440年永登61/4级地震和1995年永登5.8级地震的发生.兰州市区所在的兰州盆地则夹持在上述2组活动构造之间,其内同样发育了NWW向和 NNW向的次级断裂,如刘家堡断裂、金城关断裂、雷坛河断裂及深沟桥断裂等,其上具有孕育和发生中强震的构造条件. 兰州地区发育了NWW向和NNW向2组主导性活动构造带.大致以河口为界,东部地区主要为 NWW向的马衔山-兴隆山左旋逆走滑活动断裂系,其新活动明显,是区内的主要控震断裂,1125年兰州7级地震就发生在其中的马衔山北缘断裂带的西端.河 口以西为拉脊山北缘断裂和庄浪河断裂等1组NNW向的弧形逆冲断褶带,变形方式以断裂扩展褶皱为主,其新活动可能导致了138年金城-陇西63/4级地 震、1440年永登61/4级地震和1995年永登5.8级地震的发生.兰州市区所在的兰州盆地则夹持在上述2组活动构造之间,其内同样发育了NWW向和 NNW向的次级断裂,如刘家堡断裂、金城关断裂、雷坛河断裂及深沟桥断裂等,其上具有孕育和发生中强震的构造条件. |
| [13] | . 宛川河是黄河一条小规模支流,在榆中盆地中发育了至少四级堆积阶地。以"古土壤断代法"为基础,结合OSL测年和14C测年,较准确的确定了宛川河四级阶地形成的年代为330、130、50和10 ka。区域构造表明榆中盆地相对下陷,地面抬升不是引起河流下切的主要原因,同时阶地位相说明作为宛川河侵蚀基准面的黄河对宛川河下切影响只限于距河口不远的一小段距离。每级阶地面上都堆积一层古土壤指示宛川河下切于古土壤开始发育时期,对应于气候由冷干向暖湿转换的时期,河流下切的主要原因是气候变化。 . 宛川河是黄河一条小规模支流,在榆中盆地中发育了至少四级堆积阶地。以"古土壤断代法"为基础,结合OSL测年和14C测年,较准确的确定了宛川河四级阶地形成的年代为330、130、50和10 ka。区域构造表明榆中盆地相对下陷,地面抬升不是引起河流下切的主要原因,同时阶地位相说明作为宛川河侵蚀基准面的黄河对宛川河下切影响只限于距河口不远的一小段距离。每级阶地面上都堆积一层古土壤指示宛川河下切于古土壤开始发育时期,对应于气候由冷干向暖湿转换的时期,河流下切的主要原因是气候变化。 |
| [14] | . We present TecDEM, a software shell implemented in MATLAB that applies tectonic geomorphologic tasks to digital elevation models (DEMs). The first part of this paper series describes drainage partitioning schemes and stream profile analysis. The graphical user interface of TecDEM provides several options: determining flow directions, stream vectorization, watershed delineation, Strahler order labeling, stream profile generation, knickpoints selection, Concavity, Steepness and Hack indices calculations. The knickpoints along selected streams as well as stream profile analysis, and Hack index per stream profile are computed using a semi-automatic method. TecDEM was used to extract and investigate the stream profiles in the Kaghan Valley (Northern Pakistan). Our interpretations of the TecDEM results correlate well with previous tectonic evolution models for this region. TecDEM is designed to assist geoscientists in applying complex tectonic geomorphology tasks to global DEM data. |
| [15] | . We present the analytical capability of TecDEM, a MATLAB toolbox used in conjunction with Global DEMs for the extraction of tectonic geomorphologic information. TecDEM includes a suite of algorithms to analyze topography, extracted drainage networks and sub-basins. The aim of part 2 of this paper series is the generation of morphometric maps for surface dynamics and basin analysis. TecDEM therefore allows the extraction of parameters such as isobase, incision, drainage density and surface roughness maps. We also provide tools for basin asymmetry and hypsometric analysis. These are efficient graphical user interfaces (GUIs) for mapping drainage deviation from basin mid-line and basin hypsometry. A morphotectonic interpretation of the Kaghan Valley (Northern Pakistan) is performed with TecDEM and the findings indicate a high correlation between surface dynamics and basin analysis parameters with neotectonic features in the study area. |
| [16] | . Repeat geodetic surveys show uplift of the Monroe and Wiggins anticlines in Louisiana and Mississippi. There are deformed Quaternary terraces, which indicate long-term deformation in the valleys of the alluvial rivers that cross these structures, and there are floodplain and channel convexities that provide evidence of modern deformation. In addition, the channels show significant variations of morphology (sinuosity, gradient, and depth) and behavior appropriate to reaches of increased and decreased valley slope. These alluvial rivers are adjusting to modern deformation and their adjustment confirms two geodetic leveling anomalies. |
| [17] | . ABSTRACT Bedrock rivers set much of the relief structure of active orogens and dictate rates and patterns of denudation. Quantitative understanding of the role of climate-driven denudation in the evolution of unglaciated orogens depends first and foremost on knowledge of fluvial erosion processes and the factors that control incision rate. The results of intense research in the past decade are reviewed here, with the aim of highlighting remaining unknowns and suggesting fruitful avenues for further research. This review considers in turn (a) the occurrence and morphology of bedrock channels and their relation to tectonic setting; (b) the physical processes of fluvial incision into rock; and (c) models of river incision, their implications, and the field and laboratory data needed to test, refine, and extend them. |
| [18] | . Not Available |
| [19] | . |
| [20] | . If knickpoints transmit signals of base level fall in river networks, then improvements in our understanding of their retreat rate and basin wide distribution helps constrain the transient response following perturbation. Many studies of knickpoint retreat focus on the response of trunk streams to base level fall. Here we examine the response of an entire fluvial network, as recorded by 236 active knickpoints distributed within the Waipaoa River on the North Island of New Zealand. Base level fall within the Waipaoa catchment initiated 18,000years ago in response to a climatically triggered and tectonically exacerbated pulse of incision. Using observations from field work, aerial photo analysis and a digital elevation model (DEM), we study the knickpoint positions within the network. We find that 6570% of the knickpoints are located at drainage areas between 1×10 5 m 2 and 1×10 6 m 2 and more than half are <1km upstream of a large change in drainage area. For the knickpoints <1km upstream of large tributary junctions, we find that the retreat distances were well correlated with the tributaries' drainage areas. In order to determine how a pulse of incision distributes itself throughout a fluvial network, we develop two simple, end-member models and compare their behavior to the observed knickpoint distribution in the Waipaoa. In the first model, we propose that a knickpoint initiated at the basin outlet retreats upstream and distributes the signal throughout the network at a rate that is a power law function of drainage area. In the second model, we propose that knickpoints form near a threshold drainage area, below which channels cannot incise with the same efficiency as possible in downstream reaches. Though neither model addresses the along-stream variability in substrate or knickpoint form, the misfit between the modeled and the observed knickpoints' along-stream positions are surprisingly low (<1km; 651.25% of the total stream length) for knickpoints with drainage areas <1×10 6 m 2 . Large misfits (up to 3.5km) are observed for knickpoints with present-day drainage areas greater than 1×10 6 m 2 . The large, single step in channel elevation that characterizes knickpoints presently observed in tributaries of the Waipaoa River may not characterize the base level fall signal that propagated through the trunk streams. Evidence for progressive (rather than instantaneous) incision in the trunk streams, the knickpoints’ vicinities to tributary junctions and the equivalent success of the two-end member models lead us to conclude that the present positions of the 236 observed knickpoints are largely a consequence of thresholds in channel incision at low drainage areas. |
| [21] | <p>以不同尺度DEM数据提取裂点及其效应存在较大差异。本文以1:1 万DEM为基础数据, 通过小波分析生成多尺度DEM数据。以庐山地区16 条河流为例, 实现了多尺度DEM数据的河流裂点提取, 探讨了河流裂点的变化规律, 并构建了裂点个数的尺度预测模型。实验结果表明:(1)采用河道纵剖面与点坡降相结合的方法可快速准确地判断裂点; (2)在庐山地区, 1:1 万DEM数据可准确判断高差不小于5 m的裂点, 对于高差小于5 m的裂点由于DEM表达精度和数据误差, 而无法准确判定; (3)DEM尺度对裂点提取影响显著, 裂点个数随着DEM分辨率降低逐渐减少, 符合幂函数递减规律; (4)通过与ASTER GDEM和SRTM DEM对比验证, 本文所构建的裂点个数与DEM尺度的拟合模型具有一定的预测精度。</p> . <p>以不同尺度DEM数据提取裂点及其效应存在较大差异。本文以1:1 万DEM为基础数据, 通过小波分析生成多尺度DEM数据。以庐山地区16 条河流为例, 实现了多尺度DEM数据的河流裂点提取, 探讨了河流裂点的变化规律, 并构建了裂点个数的尺度预测模型。实验结果表明:(1)采用河道纵剖面与点坡降相结合的方法可快速准确地判断裂点; (2)在庐山地区, 1:1 万DEM数据可准确判断高差不小于5 m的裂点, 对于高差小于5 m的裂点由于DEM表达精度和数据误差, 而无法准确判定; (3)DEM尺度对裂点提取影响显著, 裂点个数随着DEM分辨率降低逐渐减少, 符合幂函数递减规律; (4)通过与ASTER GDEM和SRTM DEM对比验证, 本文所构建的裂点个数与DEM尺度的拟合模型具有一定的预测精度。</p> |
| [22] | . Stream gradients of mountain bedrock rivers in central Japan were examined using GIS and 50-m digital elevation models to discuss the distribution of knickzones. The gradients are classified into local and trend types based on the measurement lengths. The transition rate from the local to trend gradients, i.e. the decreasing rate of gradient with increasing measurement length, is then obtained as the indicator of relative steepness of a river segment, which permits the objective identification of fluvial knickzones. The identified knickzones occur widely in the study area, and indicate that the knickzone is one of the common landforms in Japanese mountain rivers. The knickzones are more abundant in steep upstream reaches of the rivers subjected to active erosion and rapid rock uplift. This suggests a hydraulic origin of the knickzones, which is similar to step-pool morphology but on a much larger scale. Some knickzones in piedmont areas can be, on the other hand, consistent with tectonic faulting at the mountain foot. Although some influences of volcanic activities on the formation of knickzones are observed, regional lithology seems to exert a relatively weak influence on the abundance of knickzones. Knickzones are more consistent with other local mechanisms of fluvial erosion, including reach-scale processes. |
| [23] | . Initiation and recession of the knickpoints are significant boundary condition for processes of fluvial system.The distribution and recession rates of knickpoints contain information that provides a fundamental understanding of geomorphic processes.In the Yalu River-Wangtian'e volcanic region of northeastern China,broadly distributed flat lava terrain provides an ideal site to study the recession of fluvial knickpoints because knickpoints and waterfalls are well preserved here.Here we describe the distribution of knickpoints in the Yalu River-Wangtian'e volcanic region by combining DEM analysis and numerical modeling.Furthermore,we present a knickpoint celerity model,derived from stream-power incision model,to relate knickpoint recession rate to drainage area.We calibrate important empirical coefficients with our knickpoint celerity model;the best fit erosion coefficient (K) is 1.32脳10 8,and the best fit drainage area exponent (m) is 0.69.Error analysis indicates a close correspondence between synthetic and real knickpoints.Finally,we show that knickpoint recession rates in the Yalu River-Wangtian'e volcanic region are 锝1-10 mm/a during the early stages of transient incision,and that the present rates are 锝1-6 mm/a.Our recession rate results are in good agreement with previous findings from the Aso Volcano and volcanoes near Boso Peninsula (Japan),which have a similar geologic history to the Yalu River-Wangtian'e volcanic region.Our present effort provides new insight into landscape evolution in the Yalu River-Wangtian'e volcanic region in northeastern China. |
| [24] | . One of the challenges facing Earth Scientists is to determine the extent to which geomorphic features can be used to extract tectonic signals from landscapes. Here, we quantitatively analyse the long profiles of rivers that drain southwards across the South Atlas Fault (SAF), a thrust fault that forms the southern margin of the High Atlas Mountains in Morocco, to derive new data on the Late Cenozoic activity of this fault system. River long profiles were extracted for 32 major rivers flowing southwards into the Ouarzazate Basin. Of these, eleven exhibit concave-up river profiles with a mean concavity of 0.64 and normalized steepness indices in the range 47.5鈥219.0m 0.9 . By contrast, 21 rivers exhibit at least one knickpoint upstream of the thrust front. Knickpoint height varies from 100 to 1300m, with calculated incision at the range bounding fault ranging from 80 to 900m, despite the drainage areas upstream of the knickpoint ranging over several orders of magnitude. In map view, knickpoint locations generally plot along sub-parallel lines and there are no obvious relationships with lithological units for knickpoints exhibiting slope-break morphology. Channel reaches below slope-break knickpoints have higher mean concavities (0.76) than above the knickpoint indicative. This observation combined with a lithological or river-capture origin for the knickpoints having been ruled out suggests that an increase in uplift rate along a planar fault zone during the Plio-Quaternary caused the initiation of the transient response (i.e., knickpoint formation) to a change in base-level observed in the river profiles. This uplift event can be correlated to the convective removal of the lithospheric root to the Atlas Mountains resulting in the anomalously high topography at the present day. |
| [25] | . Pacific coastal mountain/piedmont landforms of Costa Rica extend across the tectonic boundary between the forearc and magnetic arc region of an active convergent margin. This plate boundary became segmented circa 1 million years ago when the aseismic Cocos Ridge impinged upon the Middle America Trench offshore from the southernmost coastal area of Costa Rica. Morphometric analyses of 100 mountain fronts and numerous river long-profiles, radiometric dating, and field studies were conducted in two study areas located arcward from the plate boundary where oceanic lithosphere of the Cocos plate is being subducted beneath the Caribbean plate (region I) and the partially subducted aseismic ridge is uplifting the plate margin by isostatic and collisional processes (region II). Values of tectonic geomorphic parameters [mountain front sinuosity ( S ), percent dissected facets ( F fd ), river concavity ( K )] are not only different statistically in regions I and II but are also different in the areas experiencing isostatic and collisional responses to the subducting aseismic ridge. In the area experiencing collisional responses, mountain fronts, developed along NE-dipping imbricate thrust and high-angle reverse faults, step upward and inland from the coast; morphometric data along with the divergence of river-terrace profiles from the coast piedmont inland toward the mountains indicates higher uplift rates along interior-range mountain fronts. Isostatic uplift in the outer forearc area in region II produces a distinctly different morphologic and neotectonic style characterized by regional uplift distributed across a number of blocks bounded by normal faults. Geomorphic analyses indicate a general southward trend of increasing tectonic uplift from region I into region II where the highest frequency of mountain fronts with low values of S and F fd , as well as rivers with the highest values of K , occur over the crest of the subducted ridge. Field and historical seismic data for these regional trends include: (1) fault scarps displacing late Quaternary fluvial terraces and colluvial soils in areas of collisional responses; (2) Holocene-latest Pleistocene marine sediments uplifted tens of meters along normal faults in areas of isostatic response of region II; and (3) more frequent shallow, high-magnitude earthquakes in region II. This study indicates that spatial variations in the plate tectonic framework can be detected by regional morphometric analyses using techniques applied in extensional and compressional terranes of arid and semiarid regions but not previously applied to forearc systems along convergent plate boundaries in tropical areas. |
| [26] | . |
| [27] | |
| [28] | . The Lo River fault near Tam Dao, North Vietnam, is a young, right-lateral, normal fault which has been active throughout the Quaternary. Rates of dextral slip range between 1 and 2 mm/yr whereas rates of uplift can be estimated roughly at 0.1-1 mm/yr. The drainage deflection and arrangement of shutter ridges suggest 1.5-2.0 km of dextral offset during the past 1-2 millions of years (m. y.), and the height of the youngest faceted spurs averages at 170 m. Analysis of morphometric parametres of the mountain front at Tam Dao indicates that this segment shows properties typical for nearly rectilinear, young normal scarps that belong to class I or II of relative tectonic activity and that are capable of generating strong earthquakes in the future. |
| [29] | . Tectonic activity of SE Spain is evaluated through the application of a general morphometric analysis over 17 different mountain fronts. The selected fronts are distributed along the two most prominent crustal-scale structures of the Mediterranean sector of Spain: The Eastern Betic Shear Zone (EBSZ) and the Valencia Trough. Geomorphic indexes used in this study are Mountain-front sinuosity index (Smf) and Valley floor/width ratio (Vf). This work is largely based on the Smf/Vf regression analysis of the studied fronts together with previous available data from SW USA. The development of mountain fronts in both different lithologies and tectonic contexts enabled characteristic morphometric signatures for different activity scenarios (tectonic activity classes) to be obtained. This study thus indicates that variations of mountain front geomorphology triggered by different styles of faulting can be detected by morphometric analysis. It is demonstrated that discrete uplift rates of 0.15-0.08 m/ka are sufficient to keep relatively low Smf values down to 1.4 in Active fronts (Class 1). Taking into account the reported uplift rates and preliminary palaeoseismic data for some of the Class 1 studied fronts, recurrence periods for surface rupture events can be theoretically bracketed for SE Spain. Recurrence periods for Class 1 fronts could theoretically range between 10,000 and 12,500 years for maximum slip conditions, and 1750 and 2600 years for minimum slip conditions. Inactive fronts (Class 3) develop under uplift rates down to 0.03 m/ka, and tested recurrence intervals for rupture events range between 25,000 and 50,000 years. Class 2 fronts of intermediate characteristics and activity display uplift rates between 0.07 and 0.03 m/ka. |
| [30] | . In this study Remote sensing and GIS analysis techniques are used in order to determine geological and morphometric properties of Yenicaga basin area. SRTM and drainage networks of the area are used for determine the morphometric properties of Yenicaga basin located on North Anatolian Fault Zone (NAFZ). Inorder to determine tectonic activity of Yenicaga basin area five different morphometric indices including Mountain Front Sinuosity (Smf), Valley Floor Width To Height Ratio (Vf), Stream Length Gradient Index (Sl), Hypsometric Curve And Integral (HI), Drainage Basin Asymmetry are applied to study area. Generated results are verified by 1/25000 scale faults maps of the area. In the Yenicaga catchment area SL index is calculated for 72 location selected on 15 river channels. According to generated results SL values changes between 11,12 to 1780,24. Smf values computed for nineteen fronts. According to generated results; the most active mountain fronts associated with active faults of the area. Vf values range between 0,29 to 17,74 in the area. Deep and narrow valleys show low Vf values <1.0, these valleys can be classified as “V” shaped valleys and Vf values between 1 and 1,5 are indicate moderately active regions and Vf values greater than 1,0 can be classified as “U” shaped valleys. These areas subject to major lateral erosion due to right lateral motion of NAFZ. According to generated results, in the study area the HI values change between 0,106 and 0,787. High values of the hypsometric integral indicate deep incision and rugged relief. Intermediate low values of the integral are associated with more evenly dissected drainage basins. Asymmetry factor significantly greater than 50 suggesting tectonic tilt. Keywords: GIS, Geomorphology, Morphometric Indices, NAFZ, Yenicaga Basin |
| [31] | . Polymers of two donor-acceptor systems, 3-cyano,3′-hydroxybithiophene 1 and 4-dicyanomethylene-4H-cyclopenta[2,1-b:3,4-b′],3, 4-ethylenedioxythiophene (CDM-EDOT) 2, were analyzed with density functional theory. As predicted by perturbation theory, interactions between donors and acceptors with very different energy levels are greatly reduced compared to those between fragments with similar energy levels. This leads to localized states and bands with little dispersion. For poly-1 these localized states lie below the valence band and above the conduction band. For 2 localized unoccupied levels lie within the band gap. These acceptor levels account for the high electron affinity of poly-2 and allow for self-doping. Self doping explains the increased intrinsic conductivity of poly-2, the localized nature of the low lying MOs rationalizes the low mobility of n-type carriers in poly-2. |
| [32] | . Until recently, NW Iberia was assumed to be tectonically quiescent (stable). However, a combination of tectono-morphological analyses demonstrates that neotectonic movements do occur, which are in agreement with recent findings by other workers. We use a DEM-based tectono-geomorphic approach in combination with field work to assess the presence and nature of neotectonics in the Lower Mi帽o catchment in NW Iberia. The area is characterized by clearly developed lineaments, coinciding with Paleozoic and Mesozoic faults and fractures and remnants of a peneplain stepping down towards the coast. Longitudinal river profiles show knick points where lithological control can be excluded. Valley shapes show that some valleys have recently been rejuvenated. Systematic asymmetry tendencies of river catchments indicate tilting of fault-bounded blocks. Finally, at several locations faulted terrace deposits of the Mi帽o River have been found.The types of motions that can clearly be evidenced by our analyses are normal faulting and tilting of fault-bounded blocks. Little clear evidence exists for strike-slip faulting, whereas reverse faulting has not been found in this study. A striking morphological feature of the study area is the presence of small fault-bounded basins, along the course of the river Mi帽o. The tectonic movements take place along inherited, Paleozoic and Mesozoic faults, which apparently act as weakness zones. The reactivation of these faults under the present-day stress-conditions is probably the reason for the complicated pattern and style of present-day tectonic motions that we find. The small basins are particularly difficult to explain. They could result from the interaction of partially, obliquely reactivated strike-slip faults (step-over) and normal faults. |
| [33] | . |
| [34] | |
| [35] | . 走滑造山带是大陆山链主要类型 之一,走滑断层按卷入深度可分为转换断层、平移断层、变换断层和捩断层等。压缩弯曲和伸展弯曲可以形成走滑挤压带和走滑伸展带等。走滑挤压作用常形成走滑 造山带及正花状构造,并在造山带两侧或一侧可以形成走滑挤压盆地;走滑伸展作用可以形成走滑盆岭构造及负花状构造,并在走滑带形成拉分盆地或楔形裂陷。印 度板块的楔入及西伯利亚板块的阻滞在中国大陆中形成滑移线场,并在中国东部及中西部广大地区发育走滑造山带与走滑盆地的耦合,同时调节中国大陆中、西部的 收缩与中国大陆东部的滑逸或蠕散,因此在中西部以发育走滑造山带及走滑-挠曲盆地为主,而在东部以发育走滑盆岭带及拉分盆地为主。 . 走滑造山带是大陆山链主要类型 之一,走滑断层按卷入深度可分为转换断层、平移断层、变换断层和捩断层等。压缩弯曲和伸展弯曲可以形成走滑挤压带和走滑伸展带等。走滑挤压作用常形成走滑 造山带及正花状构造,并在造山带两侧或一侧可以形成走滑挤压盆地;走滑伸展作用可以形成走滑盆岭构造及负花状构造,并在走滑带形成拉分盆地或楔形裂陷。印 度板块的楔入及西伯利亚板块的阻滞在中国大陆中形成滑移线场,并在中国东部及中西部广大地区发育走滑造山带与走滑盆地的耦合,同时调节中国大陆中、西部的 收缩与中国大陆东部的滑逸或蠕散,因此在中西部以发育走滑造山带及走滑-挠曲盆地为主,而在东部以发育走滑盆岭带及拉分盆地为主。 |
| [36] | 本文在讨论兰州地区主要构造形迹的基础上,推断了该区应力场特征,并用统计分析的方法,通过绘制褶皱轴向和断裂走向玫瑰图,计算出研究区新构造应力场主压应力方向具有;N35~0→55~0→75~0 E 的变化规律. 本文在讨论兰州地区主要构造形迹的基础上,推断了该区应力场特征,并用统计分析的方法,通过绘制褶皱轴向和断裂走向玫瑰图,计算出研究区新构造应力场主压应力方向具有;N35~0→55~0→75~0 E 的变化规律. |
