黄瀚蛟3,
何宇1,
陈文宽1,,
1.四川农业大学管理学院 成都 611130
2.赫尔辛基大学农业与林业学院 赫尔辛基 00014
3.西北农林科技大学林学院 杨凌 712100
基金项目:国家自然科学基金项目(71704127)和四川省社会科学研究“十三五”规划项目(SC18TJ018)资助
详细信息
作者简介:吴昊玥, 主要研究方向为农业碳排放。E-mail: wuhaoyue@sicau.stu.edu.cn
通讯作者:陈文宽, 主要研究方向为资源配置与可持续利用。E-mail: 11454@sicau.edu.cn
中图分类号:F323计量
文章访问数:202
HTML全文浏览量:51
PDF下载量:81
被引次数:0
出版历程
收稿日期:2021-04-05
录用日期:2021-06-03
网络出版日期:2021-07-26
刊出日期:2021-10-01
Measurement, spatial spillover and influencing factors of agricultural carbon emissions efficiency in China
WU Haoyue1, 2,,HUANG Hanjiao3,
HE Yu1,
CHEN Wenkuan1,,
1. College of Management, Sichuan Agricultural University, Chengdu 611130, China
2. Faculty of Agriculture and Forestry, University of Helsinki, Helsinki 00014, Finlan
3. College of Forestry, Northwest A&F University, Yangling 712100, China
Funds:This study was supported by the National Natural Science Foundation of China (71704127) and Sichuan Provincial Social Science Research “13th Five-Year Plan” Project (SC18TJ018)
More Information
Corresponding author:E-mail: 11454@sicau.edu.cn
摘要
HTML全文
图
参考文献
相关文章
施引文献
资源附件
访问统计
摘要
摘要:准确测度农业碳排放效率并分析关键影响因素, 可为加快实现农业减排增效提供理论参考。已有研究未将碳排放与其他要素的共同作用进行分离, 研究实质为碳排放约束下的农业生产效率, 而非农业碳排放效率。为完善既有测算思路, 本文在农业全要素框架下搭建碳排放效率的理论模型, 基于GB-US-SBM模型测算2000—2019年间中国30省(市、自治区)的农业碳排放松弛量, 根据碳排放松弛量与实际值计算农业碳排放效率。在此基础上, 从产业、要素、环境3个方面出发, 采用空间杜宾模型探讨农业碳排放效率的影响因素与溢出效应。结果表明: 研究期内中国农业碳排放效率均值为0.778, 具有较大减排潜力。省级层面上, 仅内蒙古和青海两地的农业碳排放效率达1.000, 其余地区均存在不同规模的减排空间; 根据总量与效率的双重特征, 将30省(市、自治区)分为高排高效区、低排高效区、高排低效区和低排低效区。中国农业碳排放效率全局Moran’s I显著大于0 (P<0.01), 说明效率整体存在空间自相关性。空间杜宾模型结果显示, 农业碳排放效率具有显著的正向溢出效应, 表明邻近地区间的效率呈良性互动的演进特征。就直接效应而言, 本省的农业产业结构、农业投资强度、财政支农力度和受灾程度对本省农业碳排放效率存在负向影响, 有效灌溉率和城镇化率则表现为正向作用。从溢出效应来看, 邻近地区的受灾程度将负向影响本省农业碳排放效率, 而城镇化率则呈积极影响。研究结果可为我国分区域、分类别推进低碳农业发展提供理论依据。
关键词:农业碳排放效率/
全局参比/
GB-US-SBM模型/
空间杜宾模型/
空间溢出
Abstract:The efficiency of agricultural carbon emissions is a bridge between crop production and emission reduction, acting as a critical indicator of the potential for emission mitigation in agricultural production. In previous estimations, the outcomes yield the input-output efficiency of agriculture under the carbon emission constraint, rather than the efficiency of agricultural carbon emission, due to failing to separate the contribution of carbon emissions from other factors. To optimize the existing idea and understand the efficiency more precisely, a theoretical framework and a corresponding equation were developed for analysis in this study. In agricultural production, given the input factors, the efficiency of agricultural carbon emissions under the prerequisite of no desirable output was defined as the ratio of the minimum possible emissions to the actual emissons. On this basis, the GB-US-SBM model was employed to calculate the slack of emissions in 30 Chinese provinces from 2000 to 2019, reflecting the distance between the actual emission and production frontier. Then, the efficiency was estimated based on the slacks and actual emissions. Finally, the influencing factors and spillover effects of agriculural carbon emissions efficiency were explored using the spatial Durbin model. Results showed that: (1) From 2000 to 2019, the average agricultural carbon emissions efficiency was 0.778 in China, indicating considerable potential for emission reduction. At the provincial level, only Inner Mongolia and Qinghai had an efficiency of 1.000, while the rest of the provinces had different spaces for emission mitigation. (2) According to the emissions quantity and efficiency, the 30 provinces were divided into four groups. The five provinces, Henan, Hebei, Shandong, Heilongjiang, and Guangxi, belonged to a group of high emissions with high efficiency. The group of low emissions with high efficiency accounted for the majority, including 12 provinces, such as Inner Mongolia and Gansu. The group with high emissions and low efficiency covered seven provinces, such as Hunan and Hubei. Six provinces, including Zhejiang and Fujian, were classified as low emissions with low efficiency. (3) The global Moran’s index was significantly greater than 0, with a P-value under 0.01, verifying that there was a positive spatial autocorrelation in the provinces. The spatial econometric regression showed that efficiency had a significant positive spatial spillover effect, suggesting that an interactive evolution existed among close provinces. Specifically, four factors—industry structure, investment intensity, financial support for agriculture, and the degree of disaster, harmed the agricultural carbon emissions efficiency directly. By contrast, the irrigation effectiveness and urbanization indicated significant positive effects. In terms of spillover effects, the intensity of a disaster in a province negatively affected the efficiency of agricultural carbon emissions in neighboring provinces, while the urbanization rate exhibited a positive effect. Hence, it was essential to pay attention to the key factors that influence efficiency. Making full use of spillover effects could also help in achieving regional agricultural low-carbon transition. Additionally, local solutions should be addressed, owing to the regional characteristics of efficiency. This study results could provide a theoretical basis for the development of low-carbon agriculture in China.
Key words:Agricultural carbon emissions efficiency/
Global benchmark/
GB-US-SBM/
Spatial Durbin model/
Spatial spillover
HTML全文
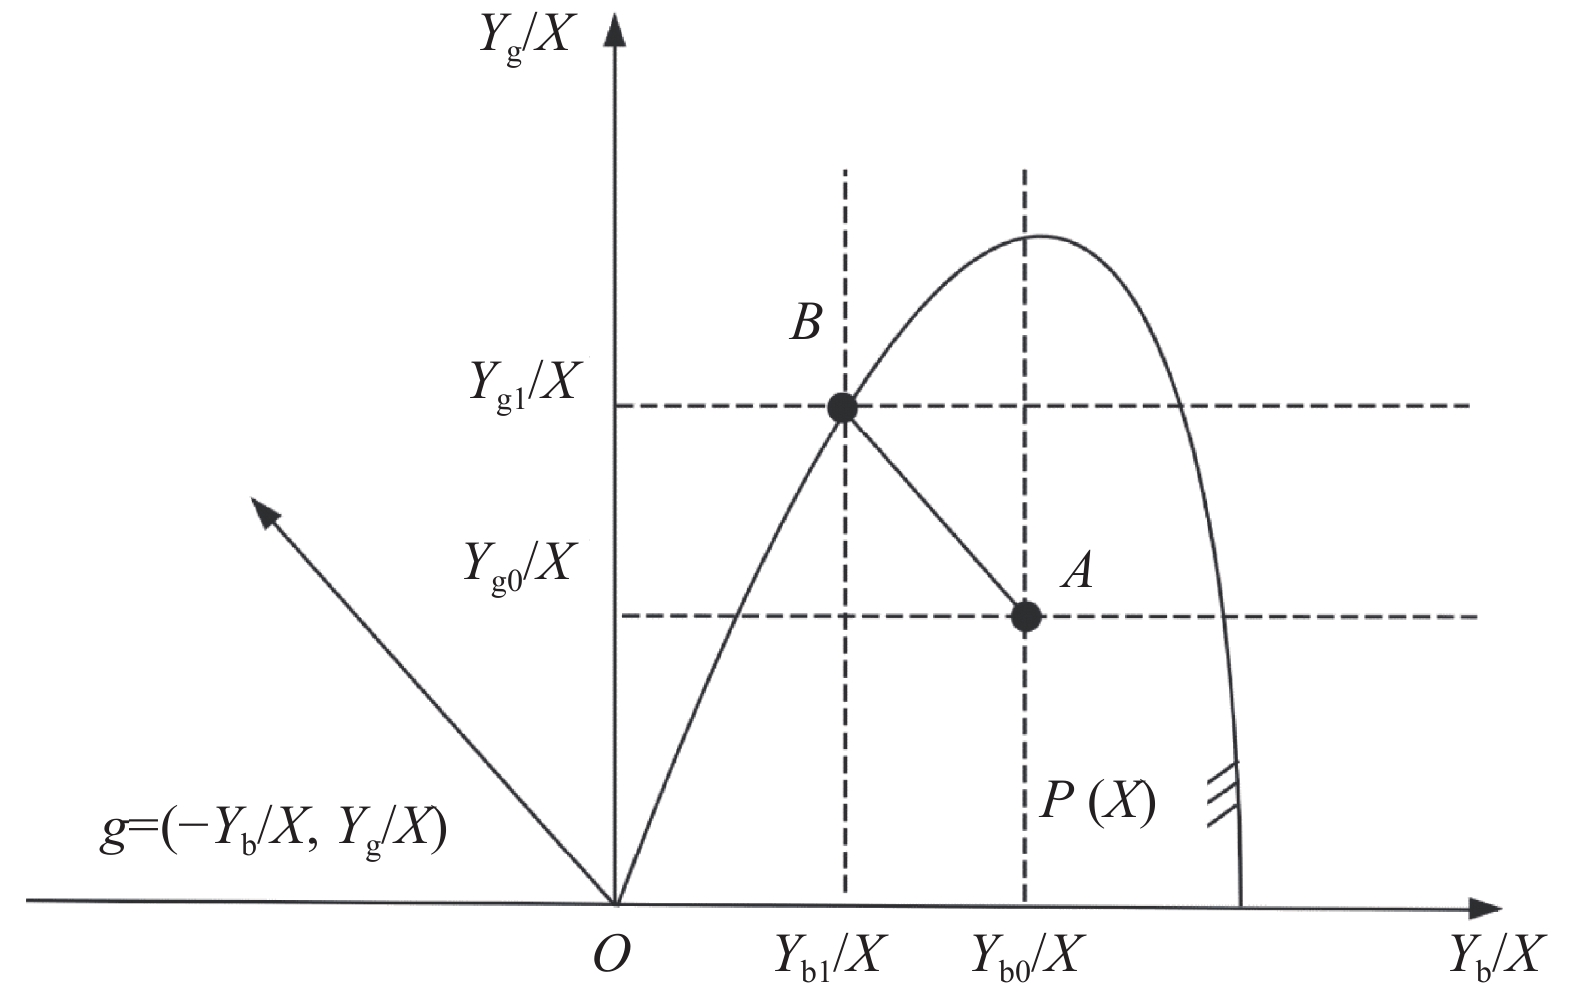
图1基于非期望产出思想的农业碳排放效率理论模型
X: 投入; P(X): 生产可能性的集合; Yg: 期望产出; Yb: 非期望产出; g=(?Yb/X, Yg/X): 预期产出方向; A(Yb0/X, Yg0/X): 某一时刻的产出决策点; B(Yb1/X, Yg1/X): A在生产前沿上的投影点。X is the input; P(X) is the production possibilities set; Yg is the desirable output; Yb is the undesirable output; g=(?Yb/X, Yg/X) denotes the expected output direction; A(Yb0/X, Yg0/X) is the decision point of output; B(Yb1/X, Yg1/X) is the projection point of point A on the production frontier.
Figure1.Theoretical model of agricultural carbon emissions efficiency under the perspective of undesirable output
 下载: 全尺寸图片幻灯片
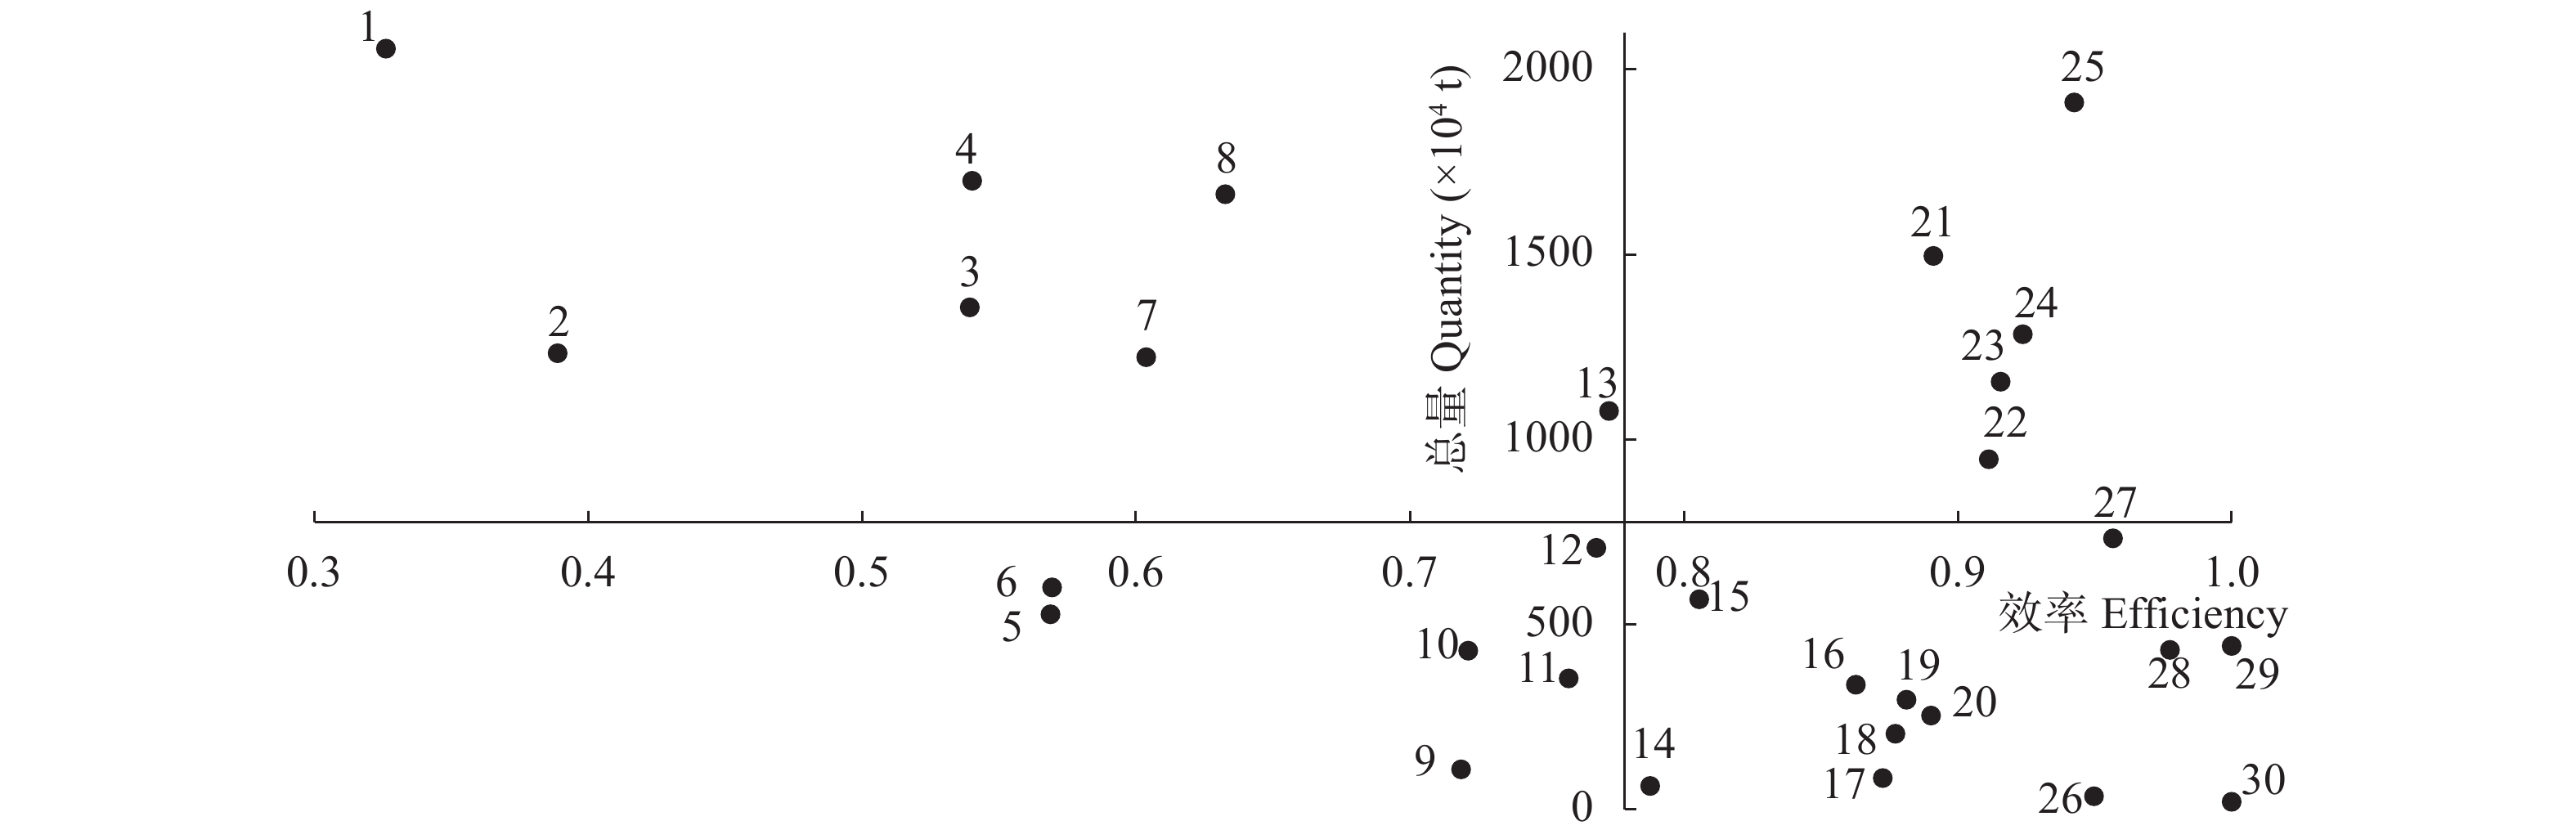
图2基于农业碳排放总量与效率双重维度的省域类别划分
1: 湖南; 2: 江西; 3: 湖北; 4: 安徽; 5: 福建; 6: 浙江; 7: 广东; 8: 江苏; 9: 宁夏; 10: 陕西; 11: 山西; 12: 云南; 13: 四川; 14: 天津; 15: 辽宁; 16: 重庆; 17: 上海; 18: 海南; 19: 贵州; 20: 甘肃; 21: 山东; 22: 河北; 23: 广西; 24: 黑龙江; 25: 河南; 26: 北京; 27: 吉林; 28: 新疆; 29: 内蒙古; 30: 青海。1: Hunan; 2: Jiangxi; 3: Hubei; 4: Anhui; 5: Fujian; 6: Zhejiang; 7: Guangdong; 8: Jiangsu; 9: Ningxia; 10: Shaanxi; 11: Shanxi; 12: Yunnan; 13: Sichuan; 14: Tianjin; 15: Liaoning; 16: Chongqing; 17: Shanghai; 18: Hainan; 19: Guizhou; 20: Gansu; 21: Shandong; 22: Hebei; 23: Guangxi; 24: Heilongjiang; 25: Henan; 26: Beijing; 27: Jilin; 28: Xinjiang; 29: Inner Mongolia; 30: Qinghai.
Figure2.Classification of the 30 provinces (cities, autonomous regions) of China based on the dual dimension of quantity and efficiency of agricultural carbon emissions
下载: 全尺寸图片幻灯片表1全要素框架下的农业生产投入产出指标体系
Table1.Input-output indicators of agricultural production under the total-factor framework
| 指标类型 Type of indicator | 具体指标 Specific indicators | 单位 Unit | ||
| 投入 Inputs | 劳动力 Labor | 农业从业人数 Quantity of agricultural employees | persons | |
| 土地 Land | 耕地面积 Cropland area | hm2 | ||
| 机械 Machine | 农业机械总动力 Total power of agricultural machinery | kW | ||
| 灌溉 Irrigation | 农业灌溉用水总量 Total water used for irrigation | m3 | ||
| 肥料 Fertilizer | 化肥施用量 Total fertilizer application | t | ||
| 产出 Output | 期望 Desirable | 经济产出 Economic output | 农业总产值 Total agricultural output | CNY |
| 生态产出 Ecologic output | 农业碳吸收量 Agricultural carbon sequestration | t | ||
| 非期望 Undesirable | 环境代价 Environmental cost | 农业碳排放量 Agricultural carbon emissions | t | |
下载: 导出CSV表2农业碳排放效率影响因素变量说明及描述性统计分析
Table2.Description and statistical analysis of factors influencing the efficiency of agricultural carbon emissions
| 变量 Variable | 符号 Symbol | 计算方法 Calculation | 均值 Mean | 标准差 Standard deviation | 最小值 Minimum | 最大值 Maximum | |
| 产业 Industry | 农业产业结构 Agro-industrial structure | ind | 农业总产值/农林牧渔总产值 Total agricultural output value / total agricultural, forestry, livestock husbandry and fishery output value | 0.524 | 0.086 | 0.339 | 0.740 |
| 作物种植结构 Crop structure | cro | 粮食种植面积/作物播种面积 Grain sown area / crop sown area | 0.659 | 0.130 | 0.354 | 0.971 | |
| 产业集聚程度 Degree of industrial agglomeration | agg | 参考文献[32] Reference [32] | 1.191 | 0.635 | 0.043 | 4.209 | |
| 要素 Factor | 耕地规模化程度 Scale of cropland | lan | 耕地面积/农业从业人数 Cropland area/quantity of agricultural employees (hm2?capita?1) | 0.499 | 0.386 | 0.104 | 2.812 |
| 农业投资强度 Agricultural investment intensity | cap | 农业固定资产投资/耕地面积 Investment in agricultural fixed assets / cropland area (104 ¥?hm?2) | 0.241 | 0.414 | 0.001 | 3.618 | |
| 农技人员密度 Density of agricultural technicians | tec | 农业技术人员/耕地面积 Agricultural technicians / cropland area (persons?hm?2) | 0.008 | 0.004 | 0.002 | 0.025 | |
| 有效灌溉率 Effective irrigation rate | irr | 有效灌溉面积/耕地面积 Effective irrigated area / cropland area | 0.561 | 0.227 | 0.203 | 1.000 | |
| 环境 Environment | 农业受灾程度 Extent of agricultural disaster | dis | 受灾面积/农作物播种面积 Agricultural disaster area / crop sown area | 0.238 | 0.162 | 0.002 | 0.936 |
| 城镇化率 Urbanization rate | 常住人口城镇化率 Urbanization rate of resident population | 0.448 | 0.273 | 0.100 | 0.901 | ||
| 财政支农力度 Financial support for agriculture | fis | 农林水务支出/财政总支出 Agricultural financial expenditure / total financial expenditure | 0.089 | 0.041 | 0.012 | 0.190 | |
下载: 导出CSV表32000—2019年中国30省(市、自治区)主要年份农业碳排放效率
Table3.Efficiencies of agricultural carbon emissions of 30 provinces (cities, autonomous regions) in China in major years of 2000 to 2019
| 省(市) Province (city, autonomous region) | 2000 | 2005 | 2010 | 2015 | 2019 | 年均增长率 Annual growth rate (%) | 均值 Mean |
| 湖南 Hunan | 0.323 | 0.312 | 0.315 | 0.324 | 0.346 | 0.37 | 0.326 |
| 江西 Jiangxi | 0.432 | 0.346 | 0.338 | 0.360 | 1.000 | 4.52 | 0.389 |
| 湖北 Hubei | 0.623 | 0.473 | 0.533 | 0.560 | 0.519 | ?0.95 | 0.539 |
| 安徽 Anhui | 0.496 | 0.538 | 0.567 | 0.570 | 0.507 | 0.11 | 0.540 |
| 福建 Fujian | 0.457 | 0.488 | 0.562 | 0.624 | 0.814 | 3.08 | 0.569 |
| 浙江 Zhejiang | 0.448 | 0.382 | 0.476 | 0.584 | 1.000 | 4.32 | 0.569 |
| 广东 Guangdong | 0.498 | 0.538 | 0.553 | 0.632 | 1.000 | 3.74 | 0.604 |
| 江苏 Jiangsu | 0.476 | 0.490 | 0.519 | 0.792 | 1.000 | 3.98 | 0.633 |
| 宁夏 Ningxia | 0.719 | 0.715 | 0.704 | 0.712 | 0.733 | 0.11 | 0.719 |
| 陕西 Shaanxi | 0.744 | 0.771 | 0.740 | 0.626 | 0.868 | 0.81 | 0.721 |
| 山西 Shanxi | 0.742 | 0.755 | 0.727 | 0.747 | 0.799 | 0.39 | 0.758 |
| 云南 Yunnan | 0.776 | 0.737 | 0.706 | 0.729 | 0.838 | 0.40 | 0.768 |
| 四川 Sichuan | 1.000 | 0.751 | 0.724 | 0.742 | 0.811 | ?1.10 | 0.773 |
| 天津 Tianjin | 0.707 | 0.777 | 0.701 | 0.748 | 1.000 | 1.84 | 0.788 |
| 辽宁 Liaoning | 0.644 | 0.798 | 0.711 | 0.831 | 1.000 | 2.34 | 0.805 |
| 重庆 Chongqing | 1.000 | 0.975 | 0.886 | 0.751 | 1.000 | 0.00 | 0.863 |
| 上海 Shanghai | 0.696 | 0.923 | 1.000 | 0.788 | 0.848 | 1.04 | 0.873 |
| 海南 Hainan | 0.834 | 0.748 | 0.685 | 0.829 | 1.000 | 0.96 | 0.877 |
| 贵州 Guizhou | 1.000 | 0.947 | 0.789 | 0.828 | 0.959 | ?0.22 | 0.881 |
| 甘肃 Gansu | 0.996 | 0.969 | 0.850 | 0.797 | 1.000 | 0.02 | 0.890 |
| 山东 Shandong | 0.958 | 0.827 | 0.852 | 0.916 | 1.000 | 0.23 | 0.891 |
| 河北 Hebei | 0.927 | 0.795 | 0.880 | 0.933 | 1.000 | 0.40 | 0.911 |
| 广西 Guangxi | 0.625 | 1.000 | 0.887 | 0.907 | 1.000 | 2.50 | 0.915 |
| 黑龙江 Heilongjiang | 0.828 | 0.880 | 0.920 | 1.000 | 1.000 | 1.00 | 0.924 |
| 河南 Henan | 0.937 | 0.958 | 0.924 | 0.933 | 1.000 | 0.34 | 0.942 |
| 北京 Beijing | 0.898 | 0.875 | 0.977 | 1.000 | 1.000 | 0.57 | 0.950 |
| 吉林 Jilin | 0.840 | 1.000 | 0.901 | 0.970 | 1.000 | 0.92 | 0.957 |
| 新疆 Xinjiang | 1.000 | 0.936 | 0.965 | 1.000 | 1.000 | 0.00 | 0.977 |
| 内蒙古 Inner Mongolia | 1.000 | 1.000 | 1.000 | 1.000 | 1.000 | 0.00 | 1.000 |
| 青海 Qinghai | 1.000 | 1.000 | 1.000 | 1.000 | 1.000 | 0.00 | 1.000 |
| 全国 Nationalwide | 0.754 | 0.757 | 0.746 | 0.774 | 0.901 | 0.94 | 0.778 |
下载: 导出CSV表42000—2019年中国农业碳排放效率Moran’s I测算结果
Table4.Moran’s I of agricultural carbon emissions efficiency in China from 2000 to 2019
| 年份 Year | Moran’s I | z | P | 年份 Year | Moran’s I | z | P | |
| 2000 | 0.359 | 4.069 | 0.000 | 2010 | 0.225 | 2.710 | 0.003 | |
| 2001 | 0.337 | 3.859 | 0.000 | 2011 | 0.272 | 3.211 | 0.001 | |
| 2002 | 0.393 | 4.459 | 0.000 | 2012 | 0.245 | 2.952 | 0.002 | |
| 2003 | 0.406 | 4.584 | 0.000 | 2013 | 0.259 | 3.067 | 0.001 | |
| 2004 | 0.315 | 3.648 | 0.000 | 2014 | 0.200 | 2.456 | 0.007 | |
| 2005 | 0.304 | 3.524 | 0.000 | 2015 | 0.290 | 3.425 | 0.000 | |
| 2006 | 0.298 | 3.454 | 0.000 | 2016 | 0.322 | 3.737 | 0.000 | |
| 2007 | 0.225 | 2.699 | 0.003 | 2017 | 0.303 | 3.561 | 0.000 | |
| 2008 | 0.213 | 2.566 | 0.005 | 2018 | 0.257 | 3.146 | 0.001 | |
| 2009 | 0.189 | 2.322 | 0.010 | 2019 | 0.041 | 0.842 | 0.200 |
下载: 导出CSV表5农业碳排放效率影响因素的空间计量模型估计结果
Table5.Estimation of influencing factors of the agricultural carbon emissions efficiency based on spatial econometric model
| 变量 Variable | SDM (W0) | SDM (W1) | SDM (W2) | |||||
| 系数 Coefficient | z-statistics | 系数 Coefficient | z-statistics | 系数 Coefficient | z-statistics | |||
| Ind | ?0.986*** | ?3.06 | ?0.718** | ?2.14 | ?1.385*** | ?2.97 | ||
| cro | ?0.237 | ?1.15 | ?0.212 | ?1.03 | ?0.126 | ?0.65 | ||
| agg | ?0.006 | ?0.27 | 0.016 | 0.78 | 0.001 | 0.05 | ||
| ln(lan) | 0.113 | 1.53 | 0.019 | 1.00 | 0.003 | 0.16 | ||
| ln(cap) | ?0.049*** | ?2.92 | ?0.015 | ?0.47 | ?0.084 | ?0.65 | ||
| ln(tec) | ?0.037 | ?1.01 | ?0.040 | ?1.02 | ?0.025 | ?0.64 | ||
| irr | 0.297** | 2.09 | 0.268** | 2.06 | 0.248* | 1.80 | ||
| dis | ?0.070** | ?2.14 | ?0.082*** | ?2.66 | ?0.066** | ?2.13 | ||
| urb | 0.113* | 1.77 | 0.109* | 1.78 | 0.067 | 1.09 | ||
| fis | ?0.753*** | ?3.01 | ?0.393 | ?1.50 | ?0.840*** | ?3.52 | ||
| W×ind | 0.460* | 1.92 | 0.368* | 1.83 | 0.341 | 1.33 | ||
| W×cro | 0.783* | 1.80 | 0.626* | 1.64 | 1.055 | 1.42 | ||
| W×agg | ?0.022 | ?0.39 | ?0.048 | ?1.07 | ?0.122 | ?0.80 | ||
| W×ln(lan) | 0.040 | 0.93 | ?0.038* | ?1.77 | ?0.055** | ?2.28 | ||
| W×ln(cap) | 0.010 | 0.58 | 0.111 | 1.46 | 0.113 | 1.52 | ||
| W×ln(tec) | 0.087 | 0.94 | 0.018 | 0.33 | ?0.048 | ?0.24 | ||
| W×irr | ?0.257 | ?1.52 | ?0.178 | ?1.45 | ?0.370 | ?1.14 | ||
| W×dis | ?0.079 | ?1.63 | ?0.018 | ?0.41 | ?0.220** | ?2.38 | ||
| W×urb | 0.234* | 1.77 | 0.173* | 1.75 | 0.419** | 2.26 | ||
| W×fis | 0.503 | 1.55 | ?0.082 | ?0.30 | 0.617 | 1.52 | ||
| ρ | 0.185** | 2.10 | 0.254*** | 4.44 | 0.320*** | 3.22 | ||
| Hausman | 33.65*** | 32.32*** | 37.25*** | |||||
| Wald-lag | 63.28*** | 56.00*** | 43.71*** | |||||
| Wald-err | 58.88*** | 48.91*** | 40.04*** | |||||
| LR-lag | 60.24*** | 53.51*** | 42.50*** | |||||
| LR-err | 58.41*** | 49.07*** | 41.04*** | |||||
| R2 | 0.2592 | 0.2530 | 0.2449 | |||||
| Log-pseudolikelihood | 692.7242 | 697.6138 | 690.8701 | |||||
| observations | 600 | 600 | 600 | |||||
| *、**和***分别表示估计系数通过P<10%、P<5%和P<1%显著性水平下的z检验。各变量的意义见表2。*, ** and *** indicate that the estimated coefficients pass the z-test at P<10%, P<5%, and P<1% levels of significance, respectively. The meaning of each variable is shown in the table 2. | ||||||||
下载: 导出CSV表6农业碳排放效率影响因素的总效应、直接效应及溢出效应
Table6.Total, direct and spillover effects of influencing factors of agricultural carbon emissions efficiency
| 变量 Variable | 总效应 Total effect | 直接效应 Direct effect | 溢出效应 Spillover effect | |||||
| 系数 Coefficient | z-statistics | 系数 Coefficient | z-statistics | 系数 Coefficient | z-statistics | |||
| ind | ?0.656** | ?2.25 | ?1.093*** | ?3.06 | 0.437* | 1.83 | ||
| cro | 0.749 | 1.47 | ?0.219 | ?1.12 | 0.969* | 1.73 | ||
| agg | ?0.035 | ?0.48 | ?0.005 | ?0.24 | ?0.030 | ?0.43 | ||
| ln(lan) | 0.188* | 1.68 | 0.116* | 1.68 | 0.072 | 1.29 | ||
| ln(cap) | ?0.049** | ?2.54 | ?0.058*** | ?3.07 | 0.008 | 0.52 | ||
| ln(tec) | 0.065 | 0.49 | ?0.032 | ?0.83 | 0.096 | 0.85 | ||
| irr | 0.094 | 0.34 | 0.290** | 2.11 | ?0.196 | ?0.85 | ||
| dis | ?0.188*** | ?2.95 | ?0.075** | ?2.38 | ?0.113** | ?1.96 | ||
| urb | 0.441*** | 2.94 | 0.127** | 2.03 | 0.314** | 2.08 | ||
| fis | ?0.334 | ?0.95 | ?0.738*** | ?2.99 | 0.404 | 1.15 | ||
| *、**和***分别表示估计系数通过P<10%、P<5%和P<1%显著性水平下的z检验。各变量的意义见表2。*, ** and *** indicate that the estimated coefficients pass the z-test at P<10%, P<5%, and P<1% levels of significance, respectively. The meaning of each variable is shown in the table 2. | ||||||||
下载: 导出CSV参考文献
| [1] | JIA G S, SHEVLIAKOVA E, ARTAXO P, et al. Land-climate interactions [R/OL]. IPCC special report on climate change and land. [2019-09-16]. https://www.ipcc.ch/srccl/chapter/chapter-2/. |
| [2] | 李涛, 傅强. 中国省际碳排放效率研究[J]. 统计研究, 2011, 28(7): 62?71 doi: 10.3969/j.issn.1002-4565.2011.07.008 LI T, FU Q. Study on China’s carbon dioxide emissions efficiency[J]. Statistical Research, 2011, 28(7): 62?71 doi: 10.3969/j.issn.1002-4565.2011.07.008 |
| [3] | ZHOU P, ANG B W, HAN J Y. Total factor carbon emission performance: a Malmquist index analysis[J]. Energy Economics, 2010, 32(1): 194?201 doi: 10.1016/j.eneco.2009.10.003 |
| [4] | 王群伟, 周鹏, 周德群. 我国二氧化碳排放绩效的动态变化、区域差异及影响因素[J]. 中国工业经济, 2010, (1): 45?54 WANG Q W, ZHOU P, ZHOU D Q. Research on dynamic carbon dioxide emissions performance, regional disparity and affecting factors in China[J]. China Industrial Economics, 2010, (1): 45?54 |
| [5] | CAO H J, LI H C, CHENG H Q, et al. A carbon efficiency approach for life-cycle carbon emission characteristics of machine tools[J]. Journal of Cleaner Production, 2012, 37: 19?28 doi: 10.1016/j.jclepro.2012.06.004 |
| [6] | LIN B Q, DU K R. Energy and CO2 emissions performance in China’s regional economies: Do market-oriented reforms matter?[J]. Energy Policy, 2015, 78: 113?124 doi: 10.1016/j.enpol.2014.12.025 |
| [7] | 王少剑, 高爽, 黄永源, 等. 基于超效率SBM模型的中国城市碳排放绩效时空演变格局及预测[J]. 地理学报, 2020, 75(6): 1316?1330 doi: 10.11821/dlxb202006016 WANG S J, GAO S, HUANG Y Y, et al. Spatio-temporal evolution and trend prediction of urban carbon emission performance in China based on super-efficiency SBM model[J]. Acta Geographica Sinica, 2020, 75(6): 1316?1330 doi: 10.11821/dlxb202006016 |
| [8] | 张伟, 朱启贵, 李汉文. 能源使用、碳排放与我国全要素碳减排效率[J]. 经济研究, 2013, 48(10): 138?150 ZHANG W, ZHU Q G, LI H W. Energy use, carbon emission and China’s total factor carbon emission reduction efficiency[J]. Economic Research Journal, 2013, 48(10): 138?150 |
| [9] | 刘婕, 魏玮. 城镇化率、要素禀赋对全要素碳减排效率的影响[J]. 中国人口·资源与环境, 2014, 24(8): 42?48 doi: 10.3969/j.issn.1002-2104.2014.08.006 LIU J, WEI W. Impact of urbanization level and endowment disparity on carbon reduction efficiency[J]. China Population, Resources and Environment, 2014, 24(8): 42?48 doi: 10.3969/j.issn.1002-2104.2014.08.006 |
| [10] | 吴贤荣, 张俊飚, 田云, 等. 中国省域农业碳排放: 测算、效率变动及影响因素研究?基于DEA-Malmquist指数分解方法与Tobit模型运用[J]. 资源科学, 2014, 36(1): 129?138 WU X R, ZHANG J B, TIAN Y, et al. Provincial agricultural carbon emissions in China: calculation, performance change and influencing factors[J]. Resources Science, 2014, 36(1): 129?138 |
| [11] | LIN B Q, FEI R L. Regional differences of CO2 emissions performance in China’s agricultural sector: a Malmquist index approach[J]. European Journal of Agronomy, 2015, 70: 33?40 doi: 10.1016/j.eja.2015.06.009 |
| [12] | 高鸣, 宋洪远. 中国农业碳排放绩效的空间收敛与分异?基于Malmquist-luenberger指数与空间计量的实证分析[J]. 经济地理, 2015, 35(4): 142?148, 185 GAO M, SONG H Y. Dynamic changes and spatial agglomeration analysis of the Chinese agricultural carbon emissions performance[J]. Economic Geography, 2015, 35(4): 142?148, 185 |
| [13] | 田云, 王梦晨. 湖北省农业碳排放效率时空差异及影响因素[J]. 中国农业科学, 2020, 53(24): 5063?5072 doi: 10.3864/j.issn.0578-1752.2020.24.009 TIAN Y, WANG M C. Research on spatial and temporal difference of agricultural carbon emission efficiency and its influencing factors in Hubei Province[J]. Scientia Agricultura Sinica, 2020, 53(24): 5063?5072 doi: 10.3864/j.issn.0578-1752.2020.24.009 |
| [14] | 吴昊玥, 何艳秋, 陈柔. 中国农业碳排放绩效评价及随机性收敛研究?基于SBM-Undesirable模型与面板单位根检验[J]. 中国生态农业学报, 2017, 25(9): 1381?1391 WU H Y, HE Y Q, CHEN R. Assessment of agricultural carbon emission performance and stochastic convergence in China using SBM-Undesirable model and panel unit root test[J]. Chinese Journal of Eco-Agriculture, 2017, 25(9): 1381?1391 |
| [15] | 李波, 王春妤, 张俊飚. 中国农业净碳汇效率动态演进与空间溢出效应[J]. 中国人口·资源与环境, 2019, 29(12): 68?76 LI B, WANG C Y, ZHANG J B. Dynamic evolution and spatial spillover of China’s agricultural net carbon sink[J]. China Population, Resources and Environment, 2019, 29(12): 68?76 |
| [16] | QIN Q D, YAN H M, LIU J, et al. China’s agricultural GHG emission efficiency: regional disparity and spatial dynamic evolution[J]. Environmental Geochemistry and Health, 2020: 1?17 |
| [17] | WANG R, FENG Y. Research on China’s agricultural carbon emission efficiency evaluation and regional differentiation based on DEA and Theil models[J]. International Journal of Environmental Science and Technology, 2020, 18(6): 1?12 |
| [18] | ANSELIN L. The scope of spatial econometrics[M]//Spatial Econometrics: Methods and Models. Dordrecht: Springer Netherlands, 1988: 7–15 |
| [19] | F?RE R, GROSSKOPF S, LOVELL C A K, et al. Multilateral productivity comparisons when some outputs are undesirable: a nonparametric approach[J]. The Review of Economics and Statistics, 1989, 71(1): 90?98 doi: 10.2307/1928055 |
| [20] | ZHOU P, ANG B W, WANG H. Energy and CO2 emission performance in electricity generation: a non-radial directional distance function approach[J]. European Journal of Operational Research, 2012, 221(3): 625?635 doi: 10.1016/j.ejor.2012.04.022 |
| [21] | PASTOR J T, LOVELL C A K. A global Malmquist productivity index[J]. Economics Letters, 2005, 88(2): 266?271 doi: 10.1016/j.econlet.2005.02.013 |
| [22] | TONE K. Dealing with undesirable outputs in DEA: A slacks based measure (SBM) approach[R]. Tokyo: GRIPS Research Report Series, 2003 |
| [23] | HUANG J H, YANG X G, CHENG G, et al. A comprehensive eco-efficiency model and dynamics of regional eco-efficiency in China[J]. Journal of Cleaner Production, 2014, 67: 228?238 doi: 10.1016/j.jclepro.2013.12.003 |
| [24] | 全良, 张敏, 赵凤. 中国工业绿色全要素生产率及其影响因素研究?基于全局SBM方向性距离函数及SYS-GMM模型[J]. 生态经济, 2019, 35(4): 39?46 QUAN L, ZHANG M, ZHAO F. Research on China’s industrial green total factor productivity and its influencing factors: Based on Global SBM directional distance function and SYS-GMM model[J]. Ecological Economy, 2019, 35(4): 39?46 |
| [25] | HU J L, WANG S C, YEH F Y. Total-factor water efficiency of regions in China[J]. Resources Policy, 2006, 31(4): 217?230 doi: 10.1016/j.resourpol.2007.02.001 |
| [26] | 刘华军, 孙淑惠, 李超. 环境约束下中国化肥利用效率的空间差异及分布动态演进[J]. 农业经济问题, 2019, 40(8): 65?75 LIU H J, SUN S H, LI C. Regional difference and dynamic evolution of fertilizer use efficiency in China under environmental constraints[J]. Issues in Agricultural Economy, 2019, 40(8): 65?75 |
| [27] | 李谷成. 中国农业的绿色生产率革命: 1978—2008年[J]. 经济学: 季刊, 2014, 13(2): 537?558 LI G C. The green productivity revolution of agriculture in China from 1978 to 2008[J]. China Economic Quarterly, 2014, 13(2): 537?558 |
| [28] | IPCC. Climate Change 2013: The Physical Science Basis. Contribution of Working Group I to the Fifth Assessment Report of the Intergovernmental Panel on Climate Change[R]. Cambridge, UK: Cambridge University Press, 2013 |
| [29] | 闵继胜, 胡浩. 中国农业生产温室气体排放量的测算[J]. 中国人口·资源与环境, 2012, 22(7): 21?27 doi: 10.3969/j.issn.1002-2104.2012.07.004 MIN J S, HU H. Calculation of greenhouse gases emission from agricultural production in China[J]. China Population, Resources and Environment, 2012, 22(7): 21?27 doi: 10.3969/j.issn.1002-2104.2012.07.004 |
| [30] | 程琳琳. 中国农业碳生产率时空分异: 机理与实证[D]. 武汉: 华中农业大学, 2018: 49–56 CHENG L L. Spatial and temporal differentiation of China’s agricultural carbon productivity: mechanism and demonstraion[D]. Wuhan: Huazhong Agricultural University, 2018: 49–56 |
| [31] | 田云, 张俊飚. 中国农业生产净碳效应分异研究[J]. 自然资源学报, 2013, 28(8): 1298?1309 doi: 10.11849/zrzyxb.2013.08.003 TIAN Y, ZHANG J B. Regional differentiation research on net carbon effect of agricultural production in China[J]. Journal of Natural Resources, 2013, 28(8): 1298?1309 doi: 10.11849/zrzyxb.2013.08.003 |
| [32] | 程琳琳, 张俊飚, 何可. 农业产业集聚对碳效率的影响研究: 机理、空间效应与分群差异[J]. 中国农业大学学报, 2018, 23(9): 218?230 doi: 10.11841/j.issn.1007-4333.2018.09.24 CHENG L L, ZHANG J B, HE K. Different spatial impacts of agricultural industrial agglomerations on carbon efficiency: Mechanism, spatial effects and groups differences[J]. Journal of China Agricultural University, 2018, 23(9): 218?230 doi: 10.11841/j.issn.1007-4333.2018.09.24 |
