钱拴3,,,
黄强4,
吴国明1,
孟成真1
1.河北省气象科学研究所 石家庄 050021
2.河北省气象与生态环境重点实验室 石家庄 050021
3.国家气象中心 北京 100081
4.安新县气象局 安新 071600
基金项目:中国气象局2018年生态文明建设气象保障服务示范项目资助
详细信息
作者简介:赵春雷, 主要从事应用气象与3S技术研究。E-mail:z920604@163.com
通讯作者:钱拴, 主要从事国家级农业与生态气象研究和服务工作。E-mail:qians@cma.gov.cn
中图分类号:P339计量
文章访问数:482
HTML全文浏览量:4
PDF下载量:390
被引次数:0
出版历程
收稿日期:2018-08-30
录用日期:2019-02-21
刊出日期:2019-08-01
Prediction of minimum water level in Baiyangdian Lake based on precipitation
ZHAO Chunlei1, 2,,QIAN Shuan3,,,
HUANG Qiang4,
WU Guoming1,
MENG Chengzhen1
1. Hebei Institute of Meteorological Sciences, Shijiazhuang 050021, China
2. Key Laboratory of Meteorology and Ecological Environment of Hebei, Shijiazhuang 050021, China
3. National Meteorological Center, Beijing 100081, China
4. Anxin Meteorological Station of Hebei, Anxin 071600, China
Funds:This study was supported by the Demonstration Project of Ecological Civilization Construction of Meteorological Support Service of China Meteorological Administration in 2018
More Information
Corresponding author:QIAN Shuan, E-mail: qians@cma.gov.cn
摘要
HTML全文
图
参考文献
相关文章
施引文献
资源附件
访问统计
摘要
摘要:为了每年能够提前预测未来10月份至翌年4月份的白洋淀最低水位,指导水资源管理和防灾减灾,利用白洋淀区域多个气象站点雨季不同时段的平均降水量和白洋淀水位资料,采取历史资料回归和机器学习方法,对白洋淀水位随区域降水量的变化规律进行了分析,研究建立了一种利用当年雨季平均降水量和当年雨季前水位预测当年雨季后至翌年雨季前白洋淀最低水位的方法。通过建立最低水位预测模型对已有的数据进行验证,发现所建的模型模拟和预测的结果误差在5%以下,精度较高。根据2018年5月白洋淀水位和白洋淀区域2018年7-8月、7-9月平均降水量预测的2018年10月至2019年4月白洋淀的最低水位分别为8.52 m和8.38 m,根据最新监测的2018年10月至2019年2月20日的最低水位实况,预测误差在4%以下,预测精度较高。因此,所建模型能够提前3~7个月动态预测白洋淀即将出现的最低水位,可为提高雄安新区区域水资源综合管理水平、统筹分配区域水资源、合理安排补水等提供科学依据。
关键词:白洋淀/
降水量/
最低水位/
水位预测/
雄安新区
Abstract:The planning outline of Xiong'an New Area clearly states that the proportion of blue-green space in the Xiong'an New Area will be stable at 70% in the future. Baiyangdian Lake is the largest wetland and water body in the Xiong'an New Area. Understanding and predicting changes in this water body is of great significance to ensure the production of domestic water and ecological security of the Xiong'an New Area. In order to predict the lowest water level of Baiyangdian Lake from October to April of the next year, and to guide water resources management and disaster prevention and mitigation of the Xiong'an New Area, a historical data regression method and a machine learning method were used to analyze the water level variation in the Baiyangdian Lake with different regional precipitation. It was found that the lowest water level of Baiyangdian Lake from October to April was highly correlated with both the mean precipitation in the current rainy season and the water level in May of that year. Based on this result, a method was established to predict the lowest water level in Baiyangdian Lake from the current rainy season until the next rainy season by using the precipitation data in the current rainy season and the water level before the current rainy season. According to the precipitation and water level data in Baiyangdian Lake from 2001 to 2017, the prediction model for the lowest water level was established. Furthermore, gradient descent algorithm was adopted for machine learning and training. After model verification, the lowest water level prediction model was developed based on the average rainfall from July to August/July to September and the water level in May as the prediction factors. The model was verified using the collected data; the fit of the model was acceptable as the simulated and predicted result errors were both below 5%. According to the Baiyangdian Lake water level in May 2018 and the average precipitation data of July to August/July to September 2018, the lowest water level of Baiyangdian Lake from October 2018 to April 2019 would be between 8.52 m and 8.38 m, which was higher than the lowest ecological water level of Baiyangdian Lake. According to the latest minimum water level from October 2018 to February 20, 2019, the model predicted result errors were below 4%. Thus, our model can predict the lowest water level of Baiyangdian Lake 3-7 months in advance, which provides a significant scientific basis to improve the comprehensive management and the rational allocation of water resources in the Xiong'an New Area.
Key words:Baiyangdian/
Precipitation/
Lowest water level/
Water level prediction/
Xiong'an New Area
HTML全文

图1白洋淀区域气象监测站点分布图
Figure1.Location of Baiyangdian Lake and distribution of region meteorological observation stations
 下载: 全尺寸图片幻灯片
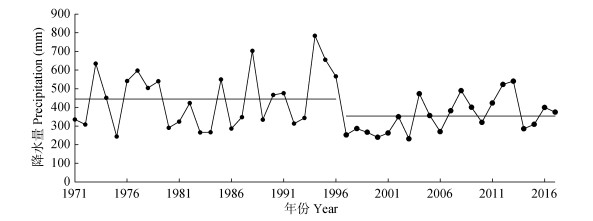
图21971—2017年白洋淀区域雨季平均降水量
Figure2.Average precipitation during the rainy season in the area of Baiyangdian Lake from 1971 to 2017
下载: 全尺寸图片幻灯片表12001—2017年白洋淀区域雨季不同时间的降水量及水位
Table1.Average precipitation during different periods of rainy season and water level in Baiyangdian Lake from 2001 to 2017
| 年份 Year | 5月份水位 Water level in May (m) | 10月份至翌年4月最低水位 Lowest water level from October to April of next year (m) | 雨季不同时段降水量Precipitation during different periods of rainy season (mm) | |||||
| 6—7月 June-July | 6—8月 June-August | 6—9月 June-September | 7—8月 July-August | 7—9月 July-September | 8—9月 August-September | |||
| 2001 | 6.39 | 5.96 | 178.84 | 255.99 | 262.36 | 186.82 | 193.19 | 83.52 |
| 2002 | 6.05 | 5.70 | 210.12 | 278.47 | 349.55 | 164.41 | 235.49 | 139.43 |
| 2003 | 6.21 | 5.73 | 114.91 | 171.59 | 231.68 | 131.68 | 191.77 | 116.77 |
| 2004 | 6.98 | 7.39 | 323.82 | 399.49 | 472.86 | 261.80 | 335.17 | 149.04 |
| 2005 | 7.24 | 6.97 | 218.17 | 323.29 | 356.02 | 279.83 | 312.56 | 137.85 |
| 2006 | 6.82 | 6.40 | 184.65 | 266.08 | 269.52 | 203.92 | 207.36 | 84.87 |
| 2007 | 6.57 | 6.31 | 207.34 | 306.50 | 381.39 | 234.55 | 309.44 | 174.05 |
| 2008 | 7.09 | 7.41 | 266.59 | 386.67 | 489.85 | 252.21 | 355.39 | 223.26 |
| 2009 | 7.15 | 7.14 | 228.23 | 354.32 | 400.01 | 262.63 | 308.32 | 171.78 |
| 2010 | 7.08 | 6.71 | 88.18 | 235.83 | 319.99 | 196.58 | 280.74 | 231.81 |
| 2011 | 6.92 | 6.95 | 245.51 | 366.98 | 423.48 | 323.90 | 380.40 | 177.97 |
| 2012 | 7.47 | 8.23 | 341.68 | 429.92 | 522.63 | 338.87 | 431.58 | 180.95 |
| 2013 | 8.39 | 8.25 | 331.52 | 445.46 | 540.79 | 318.13 | 413.46 | 209.27 |
| 2014 | 8.29 | 7.91 | 136.75 | 221.16 | 285.10 | 177.08 | 241.02 | 148.35 |
| 2015 | 7.81 | 7.78 | 157.68 | 223.52 | 308.75 | 205.68 | 290.91 | 151.07 |
| 2016 | 8.09 | 8.39 | 335.31 | 379.15 | 399.76 | 325.38 | 345.99 | 64.45 |
| 2017 | 8.12 | 7.91 | 209.70 | 367.31 | 374.16 | 294.99 | 301.84 | 164.46 |
下载: 导出CSV表2白洋淀区域雨季不同时段降水量和5月份水位与10月份至翌年4月份最低水位相关性
Table2.Correlation between precipitation in different period, water level in May and the lowest water level from October to April in Baiyangdian Lake area
| 不同时段平均降水量Average precipitation during different periods (mm) | 5月份水位 Water level in May (m) | ||||||
| 6—7月 June-July | 6—8月 June-August | 6—9月 June-September | 7—8月 July-August | 7—9月 Jul-September | 8—9月 August-September | ||
| 相关系数R Correlation coefficient | 0.567* | 0.601* | 0.595* | 0.704** | 0.706** | 0.229 | 0.924** |
| *、**分别表示通过0.05、0.01的显著性检验。* and ** mean significant correlation at 0.05 and 0.01 levels, respectively. | |||||||
下载: 导出CSV表3不同因子组合得到的白洋淀水位预测模型
Table3.Water level prediction models of Baiyangdian Lake from different combinations of factors
| 模型 Model | 因子Factor | 模型 Model | 迭代次数 Iteration | |
| x1 | x2 | |||
| 模型1 Model 1 | 7—8月平均降水量 Average precipitation from July to August | 5月水位 Water level in May | F(x1, x2)=0.005x1+0.977x2-1.104 | 6 |
| 模型2 Model 2 | 7—9月平均降水量 Average precipitation from July to September | 5月水位 Water level in May | F(x1, x2)=0.005x1+1.107x2-1.853 | 4 |
下载: 导出CSV表42001—2017年白洋淀当年10月份至翌年4月份最低水位模拟值及模拟精度
Table4.Simulated lowest water level of Baiyangdian Lake during October of current year to April of next year and simulation errors from 2001 to 2017
| 年份(当年/翌年) Year (current year/next year) | 模型1 Model 1 | 模型2 Model 2 | |||||||
| 模拟值 Simulated value (m) | 测定值 Actual value (m) | 绝对误差(绝对值) Relative error (absolute value) | 相对误差 Absolute error (%) | 模拟值 Simulated value (m) | 测定值 Actual value (m) | 绝对误差(绝对值) Relative error (absolute value) | 相对误差 Absolute error (%) | ||
| 2001/2002 | 6.10 | 5.96 | 0.14 | 2.35 | 6.08 | 5.96 | 0.12 | 2.01 | |
| 2002/2003 | 5.69 | 5.70 | 0.01 | 0.18 | 5.70 | 5.70 | 0.00 | 0.00 | |
| 2003/2004 | 5.70 | 5.73 | 0.03 | 0.52 | 5.66 | 5.73 | 0.07 | 1.22 | |
| 2004/2005 | 6.98 | 7.39 | 0.41 | 5.55 | 7.05 | 7.39 | 0.34 | 4.60 | |
| 2005/2006 | 7.30 | 6.97 | 0.33 | 4.73 | 7.20 | 6.97 | 0.23 | 3.30 | |
| 2006/2007 | 6.58 | 6.40 | 0.18 | 2.81 | 6.48 | 6.40 | 0.08 | 1.25 | |
| 2007/2008 | 6.47 | 6.31 | 0.16 | 2.54 | 6.54 | 6.31 | 0.23 | 3.65 | |
| 2008/2009 | 7.04 | 7.41 | 0.37 | 4.99 | 7.25 | 7.41 | 0.16 | 2.16 | |
| 2009/2010 | 7.14 | 7.14 | 0.00 | 0.00 | 7.19 | 7.14 | 0.05 | 0.70 | |
| 2010/2011 | 6.80 | 6.71 | 0.09 | 1.34 | 6.90 | 6.71 | 0.19 | 2.83 | |
| 2011/2012 | 7.18 | 6.95 | 0.23 | 3.31 | 7.19 | 6.95 | 0.24 | 3.45 | |
| 2012/2013 | 7.76 | 8.23 | 0.47 | 5.71 | 7.95 | 8.23 | 0.28 | 3.40 | |
| 2013/2014 | 8.54 | 8.25 | 0.29 | 3.52 | 8.76 | 8.25 | 0.51 | 6.18 | |
| 2014/2015 | 7.86 | 7.91 | 0.05 | 0.63 | 7.88 | 7.91 | 0.03 | 0.38 | |
| 2015/2016 | 7.52 | 7.78 | 0.26 | 3.34 | 7.65 | 7.78 | 0.13 | 1.67 | |
| 2016/2017 | 8.29 | 8.39 | 0.10 | 1.19 | 8.16 | 8.39 | 0.23 | 2.74 | |
| 2017/2018 | 8.19 | 7.91 | 0.28 | 3.54 | 7.99 | 7.91 | 0.08 | 1.01 | |
| 平均误差 Average error | 0.20 | 2.72 | 0.17 | 2.39 | |||||
下载: 导出CSV参考文献
| [1] | 李祥, 寿绍文, 白艳辉, 等. 1960-2013年白洋淀湿地气候变化特征分析[J].气象与环境学报, 2016, 32(1):75-83 http://d.old.wanfangdata.com.cn/Periodical/lnqx201601011 LI X, SHOU S W, BAI Y H, et al. Characteristics of climate change from 1960 to 2013 in Baiyangdian wetland[J]. Journal of Meteorology and Environment, 2016, 32(1):75-83 http://d.old.wanfangdata.com.cn/Periodical/lnqx201601011 |
| [2] | 刘茂峰, 高彦春, 甘国靖.白洋淀流域年径流变化趋势及气象影响因子分析[J].资源科学, 2011, 33(8):1438-1445 http://d.old.wanfangdata.com.cn/Periodical/zykx201108004 LIU M F, GAO Y C, GAN G J. Long-term trends in annual runoff and the impact of meteorological factors in the Baiyangdian Watershed[J]. Resources Science, 2011, 33(8):1438-1445 http://d.old.wanfangdata.com.cn/Periodical/zykx201108004 |
| [3] | 孙秀博, 李清泉, 魏敏. 1960-2009年中国年降水量的年际及年代际变化特征[J].气象, 2012, 38(12):1464-1472 http://www.cnki.com.cn/Article/CJFDTotal-QXXX201212004.htm SUN X B, LI Q Q, WEI M. Analysis on interannual and interdecadal variability of annual rainfall over China during 1960-2009[J]. Meteorological Monthly, 2012, 38(12):1464-1472 http://www.cnki.com.cn/Article/CJFDTotal-QXXX201212004.htm |
| [4] | PAN F F, LIAO J J, LI X W, et al. Application of the inundation area-lake level rating curves constructed from the SRTM DEM to retrieving lake levels from satellite measured inundation areas[J]. Computers & Geosciences, 2013, 52:168-176 http://www.wanfangdata.com.cn/details/detail.do?_type=perio&id=6c434938f592e6edcfe46ff1dc567c37 |
| [5] | PAN F F, WANG C, XI X H. Constructing river stage-discharge rating curves using remotely sensed river cross-sectional inundation areas and river bathymetry[J]. Journal of Hydrology, 2016, 540:670-687 doi: 10.1016/j.jhydrol.2016.06.024 |
| [6] | PAN F F, NICHOLS J. Remote sensing of river stage using the cross-sectional inundation area-river stage relationship (IARSR) constructed from digital elevation model data[J]. Hydrological Processes, 2013, 27(25):3596-3606 doi: 10.1002/hyp.9469 |
| [7] | 吕彩霞, 牛存稳, 贾仰文.气候变化和人类活动对白洋淀入淀水量影响分析[C]//中国水利学会水资源专业委员会2009学术年会论文集.大连: 中国水利学会, 2009 LYU C X, NIU C W, JIA Y W. Assessing the impacts of climate variability and human activities on reservoir inflow of Baiyangdian Lake[C]//Chinese Hydraulic Engineering Society Member Academic Conference in 2009. Dalian: Chinese Hydraulic Engineering Society, 2009 |
| [8] | 韩美清, 王路光, 王靖飞, 等.基于GIS的白洋淀流域生态环境评价[J].中国生态农业学报, 2007, 15(3):169-171 http://www.ecoagri.ac.cn/zgstny/ch/reader/view_abstract.aspx?file_no=2007343&flag=1 HAN M Q, WANG L G, WANG J F, et al. Eco-environmental evaluation of Baiyangdian Watershed using GIS[J]. Chinese Journal of Eco-Agriculture, 2007, 15(3):169-171 http://www.ecoagri.ac.cn/zgstny/ch/reader/view_abstract.aspx?file_no=2007343&flag=1 |
| [9] | 胡珊珊, 郑红星, 刘昌明, 等.气候变化和人类活动对白洋淀上游水源区径流的影响[J].地理学报, 2012, 67(1):62-70 http://d.old.wanfangdata.com.cn/Periodical/dlxb201201007 HU S S, ZHENG H X, LIU C M, et al. Assessing the impacts of climate variability and human activities on streamflow in the water source area of Baiyangdian Lake[J]. Acta Geographica Sinica, 2012, 67(1):62-70 http://d.old.wanfangdata.com.cn/Periodical/dlxb201201007 |
| [10] | 高彦春, 王金凤, 封志明.白洋淀流域气温、降水和径流变化特征及其相互响应关系[J].中国生态农业学报, 2017, 25(4):467-477 http://www.ecoagri.ac.cn/zgstny/ch/reader/view_abstract.aspx?file_no=20170401&flag=1 GAO Y C, WANG J F, FENG Z M. Variation trend and response relationship of temperature, precipitation and runoff in Baiyangdian Lake Basin[J]. Chinese Journal of Eco-Agriculture, 2017, 25(4):467-477 http://www.ecoagri.ac.cn/zgstny/ch/reader/view_abstract.aspx?file_no=20170401&flag=1 |
| [11] | 赵翔, 崔保山, 杨志峰.白洋淀最低生态水位研究[J].生态学报, 2005, 25(5):1033-1040 doi: 10.3321/j.issn:1000-0933.2005.05.014 ZHAO X, CUI B S, YANG Z F. A study of the lowest ecological water level of Baiyangdian Lake[J]. Acta Ecologica Sinica, 2005, 25(5):1033-1040 doi: 10.3321/j.issn:1000-0933.2005.05.014 |
| [12] | 赵志轩.白洋淀湿地生态水文过程耦合作用机制及综合调控研究[D].天津: 天津大学, 2012 http://cdmd.cnki.com.cn/Article/CDMD-10056-1013004945.htm ZHAO Z X. Coupling mechanism of eco-hydrological processes and integrated regulation in Baiyangdian Wetland[D]. Tianjin: Tianjin University, 2012 http://cdmd.cnki.com.cn/Article/CDMD-10056-1013004945.htm |
| [13] | 张素珍.白洋淀湿地生态功能评价及保护对策[J].石家庄师范专科学校学报, 2003, 5(3):40-41 doi: 10.3969/j.issn.1673-1972.2003.03.015 ZHANG S Z. Evaluation and protection measures of ecological functions of Baiyangdian Lake marsh[J]. Journal of Shijiazhuang Teachers College, 2003, 5(3):40-41 doi: 10.3969/j.issn.1673-1972.2003.03.015 |
| [14] | WU C L, CHAU K W, LI Y S. River stage prediction based on a distributed support vector regression[J]. Journal of Hydrology, 2008, 358(1/2):96-111 http://www.wanfangdata.com.cn/details/detail.do?_type=perio&id=7c2fa3935e61a2da811f5e87795983c3 |
| [15] | 黄政, 肖艳.一种基于相似性搜索的水位预测方法[J].计算机与现代化, 2015, (11):17-21 doi: 10.3969/j.issn.1006-2475.2015.11.004 HUANG Z, XIAO Y. Method of predicting water level based on similarity search[J]. Computer and Modernization, 2015, (11):17-21 doi: 10.3969/j.issn.1006-2475.2015.11.004 |
| [16] | DONG S, CHI K, ZHANG Q Y, et al. The application of a grey Markov model to forecasting annual maximum water levels at hydrological stations[J]. Journal of Ocean University of China, 2012, 11(1):13-17 doi: 10.1007/s11802-012-1850-9 |
| [17] | BARZILAI J, BORWEIN J M. Two-point step size gradient methods[J]. IMA Journal of Numerical Analysis, 1988, 8(1):141-148 doi: 10.1093/imanum/8.1.141 |
