唐常源1, 2,
李杏2,,,
李锐2,
曹英杰2
1.中山大学地理科学与规划学院 广州 510275
2.中山大学环境科学与工程学院 广州 510006
基金项目: 广东省基础与应用基础研究专项资金项目2017A030310563
广州市科技计划项目201510010300
国家自然科学基金青年科学基金项目41501512
详细信息
作者简介:常伊梅林, 主要研究方向为土壤重金属污染和土壤氮循环。E-mail:changyimeilin@qq.com
通讯作者:李杏, 主要研究方向为小流域氮循环, 流域地表水、地下水地球化学研究。E-mail:lxbaboon@163.com
中图分类号:X53计量
文章访问数:954
HTML全文浏览量:13
PDF下载量:691
被引次数:0
出版历程
收稿日期:2018-06-19
录用日期:2018-09-12
刊出日期:2019-01-01
Production and release mechanism of N2O in agricultural soils irrigated with acid mine drainage
CHANG Yimeilin1,,TANG Changyuan1, 2,
LI Xing2,,,
LI Rui2,
CAO Yingjie2
1. School of Geography and Planning, Sun Yat-sen University, Guangzhou 510275, China
2. School of Environmental Science and Engineering, Sun Yat-sen University, Guangzhou 510006, China
Funds: the Natural Science Foundation of Guangdong Province, China2017A030310563
the Science and Technology Program of Guangzhou, China201510010300
the National Natural Science Foundation of China41501512
More Information
Corresponding author:LI Xing, E-mail:lxbaboon@163.com
摘要
HTML全文
图
参考文献
相关文章
施引文献
资源附件
访问统计
摘要
摘要:农田系统是温室气体N2O的主要排放源,目前对酸性矿山废水(acid mine drainage,AMD)灌溉影响下,农田土壤剖面N2O的来源识别、转换机制及其控制因子缺乏深入研究。本文选择广东省大宝山矿区下游沿岸水稻田和甘蔗田两种典型农田,针对酸性矿山废水灌溉区(上坝村)和天然来水灌溉区(连心村),对土壤理化性质、重金属含量及包气带N2O浓度、同位素特征值进行了测定,定量计算了硝化和反硝化作用对土壤中N2O的贡献比和N2O转化为N2的还原比,评价了其相关影响因素。结果表明:在AMD影响下,灌区农田土壤剖面N2O浓度均高于同种作物类型天然来水区土壤,同种灌溉处理下甘蔗田土壤N2O浓度高于水稻田。甘蔗田表层土壤(0~30 cm)反硝化作用对N2O产生量的贡献比高于硝化作用,约71.29% N2O由反硝化作用产生。AMD灌区甘蔗田土壤剖面中N2O还原成N2的比例随深度增加逐渐减小,在N2O浓度峰值处仅有15.54% N2O被还原成为N2,而天然来水区N2O还原成N2的平均比率高达49.80%。这表明较弱的土壤N2O还原能力导致较高浓度的N2O残留在土壤中。相关性分析表明,AMD灌溉通过改变上坝村土壤的pH、重金属含量、含水率从而改变了土壤N2O的来源途径及还原能力。组合同位素特征值溯源法有效地揭示了农田土壤N2O的来源和AMD灌区土壤的潜在生态风险,为日后的治理修复工作提供了科学依据。
关键词:同位素特征值/
N2O/
酸性矿山废水灌溉/
硝化作用/
反硝化作用/
红壤区
Abstract:Acid mine drainage (AMD) is mostly untreated or not up to standard level before directly drained into rivers for irrigation, causing severe pollution of agriculture eco-environments. Metal pollution had been widely reported in extensive fields including the red soil region in South China. As we have known, N2O emitted from agricultural systems was one of the important causes of global greenhouse effects. However, there has been poor knowledge of potential changes in N2O evolution in polluted fields. In this study, four agricultural soil profiles from sugarcane and paddy fields were used to track the changes in N2O emission and sources of heavy metal polluted soils irrigated with AMD (Shangba Village, Wengyuan County, Guangdong Province) and then compared with unpolluted soils irrigated with natural water (Lianxin Village, Wengyuan County, Guangdong Province). The physical/chemical parameters and contents of heavy metals in the soils, N2O concentration and stable nitrogen and oxygen isotope compositions were analyzed to determine the contribution of nitrification and denitrification of N2O and the reduction ratio of N2O. Our results showed that there was slightly higher N2O concentration of the same crop in AMD irrigated area than in unpolluted soil irrigated with natural water, and higher soil N2O concentration in sugarcane fields than in rice fields. The production of N2O from denitrification was 71.29%, which was higher than that from nitrification in surface soil (0-30 cm) in sugarcane fields in areas irrigated with AMD. N2O reduction ratio in the soil profile in AMD irrigation area decreased gradually with increasing depth. There was only 15.54% N2O reduction to N2 at the peak of N2O concentration. However, the average ratio of N2O reduction to N2 in sugarcane fields irrigated with natural water was as high as 49.80%. Limited N2O reduction led to high levels of N2O residues in the soil. Studies showed that AMD irrigation changed the production and release of N2O by changing pH, heavy metal content and moisture content of agricultural soils. N2O production and reduction studies carried out using combined nitrogen and oxygen isotope compositions clarified potential risks of irrigated agricultural soils with AMD. This provided the scientific basis for future restoration works in polluted soils.
Key words:Isotopic signature/
Nitrous oxide/
Acid mine drainage irrigation/
Nitrification/
Denitrification/
Red soil region
HTML全文
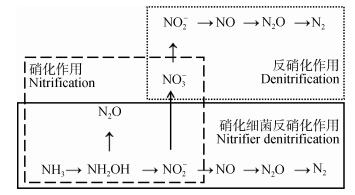
图1土壤微生物产生N2O的过程[6]
Figure1.Microbial sources of N2O in soil[6]
 下载: 全尺寸图片幻灯片
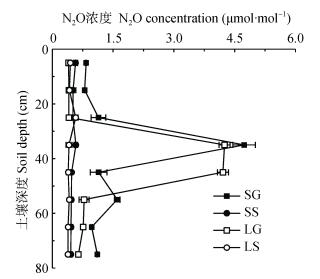
图2酸性矿山废水灌区、天然来水区不同作物田土壤包气带N2O浓度垂向分布特征
SG:酸性矿山废水灌溉区甘蔗田; SS:酸性矿山废水灌溉区水稻田; LG:天然来水灌溉区甘蔗田; LS:天然来水灌溉区水稻田。
Figure2.Vertical distribution of N2O concentrations in different crop fields irrigated with acid mine drainage and natural water
SG: sugarcane field in acid mine drainage irrigated area; SS: paddy field in acid mine drainage irrigated area; LG: sugarcane field in natural water irrigated area; LS: paddy field in natural water irrigated area.
下载: 全尺寸图片幻灯片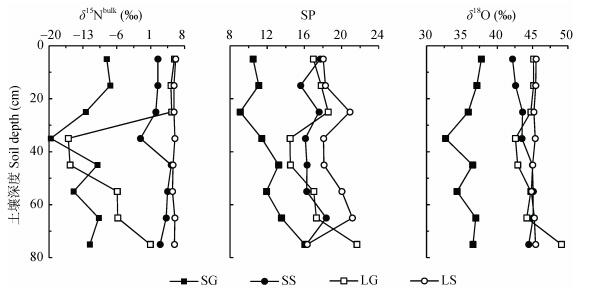
图3酸性矿山废水灌区、天然来水区不同作物田包气带土壤N2O同位素特征值垂向分布特征
SG:酸性矿山废水灌溉区甘蔗田; SS:酸性矿山废水灌溉区水稻田; LG:天然来水灌溉区甘蔗田; LS:天然来水灌溉区水稻田。SP: 15N的位嗜值。
Figure3.Vertical distribution of isotope characteristic values of N2O in the aeration zones of different crop fields irrigated with acid mine drainage and natural water
SG: sugarcane field in acid mine drainage irrigated area; SS: paddy field in acid mine drainage irrigated area; LG: sugarcane field in natural water irrigated area; LS: paddy field in natural water irrigated area. SP: site preference of 15N.
下载: 全尺寸图片幻灯片
图4酸性矿山废水灌区、天然来水区不同作物田土壤SP-δ18O模型分析的N2O产生和消耗途径
SG:酸性矿山废水灌溉区甘蔗田; SS:酸性矿山废水灌溉区水稻田; LG:天然来水灌溉区甘蔗田; LS:天然来水灌溉区水稻田。SP: 15N的位嗜值。均值混合线:由端元值(SP=-3.90, δ18O=21.00)、(SP=34.80, δ18O=43.60)确定; 还原线:斜率为0.35。
Figure4.N2O production and consumption pathways analyzed by the model of SP-δ18O of soils of different crop fields irrigated with acid mine drainage and natural water
SG: sugarcane field in acid mine drainage irrigated area; SS: paddy field in acid mine drainage irrigated area; LG: sugarcane field in natural water irrigated area; LS: paddy field in natural water irrigated area. Mixing line is determined by the end-member value (SP=-3.90, δ18O=21.00), (SP=34.80, δ18O=43.60). Reduction line is with slope of 0.35. SP: site preference of 15N.
下载: 全尺寸图片幻灯片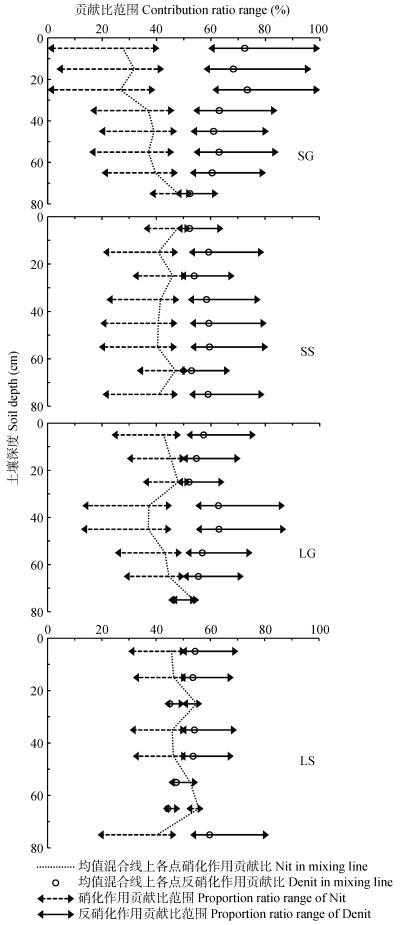
图5酸性矿山废水灌区、天然来水区不同作物田土壤硝化/反硝化作用对土壤气体N2O的贡献比范围
SG:酸性矿山废水灌溉区甘蔗田; SS:酸性矿山废水灌溉区水稻田; LG:天然来水灌溉区甘蔗田; LS:天然来水灌溉区水稻田。Nit:硝化作用; Denit:反硝化作用。
Figure5.Contribution ratio ranges of nitrification/denitrification to N2O in soils of different crop fields irrigated with acid mine drainage and natural water
SG: sugarcane field in acid mine drainage irrigated area; SS: paddy field in acid mine drainage irrigated area; LG: sugarcane field in natural water irrigated area; LS: paddy field in natural water irrigated area. Nit: nitrification; Denit: denitrification.
下载: 全尺寸图片幻灯片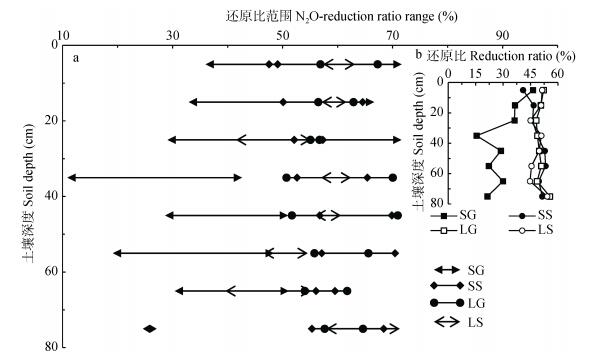
图6酸性矿山废水灌区、天然来水区不同作物田土壤N2O还原成N2的比例范围(a)和均值混合线上各点N2O还原成N2的比例(b)
SG:酸性矿山废水灌溉区甘蔗田; SS:酸性矿山废水灌溉区水稻田; LG:天然来水灌溉区甘蔗田; LS:天然来水灌溉区水稻田。
Figure6.N2O-reduction ratio range (a) and N2O-reduction ratio in the mixing line (b) of soils of different crop fields irrigated with acid mine drainage and natural water
SG: sugarcane field in acid mine drainage irrigated area; SS: paddy field in acid mine drainage irrigated area; LG: sugarcane field in natural water irrigated area; LS: paddy field in natural water irrigated area.
下载: 全尺寸图片幻灯片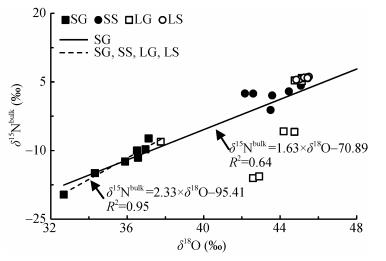
图7酸性矿山废水灌区、天然来水区不同作物田不同深度土壤气体N2O同位素特征值δ15Nbulk与δ18O线性回归分析
SG:酸性矿山废水灌溉区甘蔗田; SS:酸性矿山废水灌溉区水稻田; LG:天然来水灌溉区甘蔗田; LS:天然来水灌溉区水稻田。
Figure7.Linear regressions for δ15Nbulk and δ18O of N2O in soil air in different depths of different crop fields irrigated with acid mine drainage and natural water
SG: sugarcane field in acid mine drainage irrigated area; SS: paddy field in acid mine drainage irrigated area; LG: sugarcane field in natural water irrigated area; LS: paddy field in natural water irrigated area.
下载: 全尺寸图片幻灯片表1供试土壤含水率、化学性质及其重金属含量
Table1.Moisture contents, chemical characters and contents of heavy metals in the tested soils
| 处理 Treatment | 土壤深度 Soil depth (cm) | 含水率 Moisture content (%) | pH | CEC (cmol·kg-1) | 全碳 Total carbon (g·kg-1) | 全氮 Total nitrogen (g·kg-1) | 硝态氮 NO3- (mg·kg-1) | 氨态氮 NH4+ (mg·kg-1) | Cu (mg·kg-1) | Zn (mg·kg-1) | Pb (mg·kg-1) | Cd (mg·kg-1) |
| SG | 0~30 | 17.50±1.93abc | 3.92±0.08a | 9.69±0.55a | 12.94±8.13c | 1.41±0.64abcd | 47.21±0.75a | 2.33±0.22f | 332.02±45.86c | 297.96±15.61de | 271.54±23.65e | 0.88±0.06abc |
| 30~50 | 17.72±1.59abc | 4.29±0.19b | 11.32±2.11ab | 4.86±0.01ab | 0.83±0.03ab | 17.39±0.30b | 0.85±0.07bc | 315.92±68.27c | 366.23±73.84ef | 241.26±7.74df | 1.27±0.04bc | |
| 50~80 | 14.47±4.56a | 4.66±0.07c | 14.14±1.21b | 4.15±0.52a | 0.84±0.15ab | 12.40±0.41c | 1.36±0.30e | 173.62±29.02b | 395.89±70.11f | 227.05±57.18df | 1.70±0.40c | |
| SS | 0~30 | 22.37±4.53bcd | 4.28±0.24b | 9.52±0.98a | 11.53±5.08bc | 1.45±0.35bcd | 4.28±0.63d | 1.31±0.47de | 303.83±44.95c | 309.90±90.03de | 249.49±41.62df | 0.57±0.49ab |
| 30~50 | 17.15±0.62abc | 4.12±0.04ab | 9.45±0.73a | 5.22±1.16ab | 0.79±0.18ab | 1.16±0.25e | 0.98±0.26cde | 396.83±30.34d | 304.39±35.54de | 238.93±32.88df | 1.04±0.04bc | |
| 50~80 | 15.30±2.68ab | 4.26±0.06b | 9.74±0.98a | 3.81±0.09a | 0.70±0.12a | 0.85±0.02e | 0.90±0.03bcd | 317.04±15.97c | 275.92±3.97cd | 209.55±25.75d | 0.94±0.97abc | |
| LG | 0~30 | 21.65±3.05bcd | 4.42±0.23bc | 18.08±3.17c | 8.32±0.72abc | 1.03±0.06abc | 15.21±0.24f | 2.63±0.41f | 36.88±3.12a | 172.51±30.25ab | 68.25±18.13a | 0.15±0.01a |
| 30~50 | 27.56±0.19d | 5.13±0.31d | 22.89±0.60d | 7.74±0.21abc | 1.05±0.10abc | 5.84±1.08g | 0.57±0.09abc | 37.58±3.11a | 155.95±22.08ab | 47.79±4.72ab | 0.14±0.02a | |
| 50~80 | 26.13±0.77d | 5.61±0.08e | 23.34±0.09d | 7.59±1.15abc | 1.31±0.40abcd | 3.03±0.26h | 0.72±0.15abc | 40.67±1.73a | 120.32±12.76a | 53.80±14.95a | 0.10±0.06a | |
| LS | 0~30 | 27.25±5.26d | 5.86±0.18e | 17.33±1.73c | 19.43±4.70d | 1.98±0.30d | 9.12±1.00i | 2.30±0.26f | 39.13±3.75a | 212.00±14.05bc | 136.98±10.72c | — |
| 30~50 | 21.87±0.68bcd | 6.46±0.01f | 18.74±0.36c | 10.42±1.37abc | 1.63±0.31cd | 2.87±0.81h | 0.38±0.04a | 36.54±1.08a | 169.75±6.36ab | 138.11±9.74c | — | |
| 50~80 | 24.14±5.25cd | 6.48±0.04f | 20.37±2.07cd | 9.80±0.69abc | 1.39±0.47abcd | 4.59±0.28d | 0.50±0.07ab | 32.65±5.50a | 152.00±20.90ab | 117.22±26.82bc | — | |
| SG:酸性矿山废水灌溉区甘蔗田; SS:酸性矿山废水灌溉区水稻田; LG:天然来水灌溉区甘蔗田; LS:天然来水灌溉区水稻田。同列不同小写字母表示0.05水平差异显著。SG: sugarcane field in acid mine drainage irrigated area; SS: paddy field in acid mine drainage irrigated area; LG: sugarcane field in natural water irrigated area; LS: paddy field in natural water irrigated area. Data with different lowercase letters in the same column are significantly different at 0.05 level. | ||||||||||||
下载: 导出CSV表2土壤反硝化作用贡献比(Denit)、还原比(Fr)及N2O浓度(cN2O)与理化性质及重金属浓度的相关性分析
Table2.Correlation coefficients of contribution ratio of denitrification to N2O (Denit), N2O-reducation ratio (Fr), N2O concentration (cN2O) with heavy metal and physio-chemical properties of soil
| 含水率 Moisture content | pH | CEC | 全碳 Total carbon | 全氮 Total nitrogen | 硝态氮 NO3- | Cu | Zn | Pb | Cd | Denit | Fr | |
| Denit | -0.31 | -0.60** | -0.41* | -0.10 | -0.20 | -0.23 | 0.51** | 0.40* | 0.43* | 0.33 | 1.00 | -0.28 |
| Fr | 0.48** | 0.31 | 0.34 | 0.28 | 0.34 | 0.44* | -0.33 | -0.65** | -0.49** | -0.67** | -0.28 | 1.00 |
| cN2O | 0.04 | -0.14 | 0.12 | -0.21 | -0.26 | -0.11 | 0.04 | 0.04 | -0.10 | 0.14 | 0.38* | -0.40* |
| **和*分别表示0.01和0.05水平(双尾)相关性显著。** and * indicate significant correlation at 0.01 and 0.05 levels (2-tailed), respectively. | ||||||||||||
下载: 导出CSV参考文献
| [1] | RAVISHANKARA A R, DANIEL J S, PORTMANN R W. Nitrous oxide (N2O):The dominant ozone-depleting substance emitted in the 21st Century[J]. Science, 2009, 326(5949):123-125 doi: 10.1126/science.1176985 |
| [2] | STOCKER T F, QIN D, PLATTNER G K, et al. Climate Change 2013:The Physical Science Basis. Contribution of Working Group Ⅰ to the Fifth Assessment Report of the Intergovernmental Panel on Climate Change[M]. Cambridge:Cambridge University Press, 2013 |
| [3] | AKIYAMA H, YAN X Y, YAGI K. Estimations of emission factors for fertilizer-induced direct N2O emissions from agricultural soils in Japan:Summary of available data[J]. Soil Science and Plant Nutrition, 2006, 52(6):774-787 doi: 10.1111/j.1747-0765.2006.00097.x |
| [4] | ROCHETTE P. No-till only increases N2O emissions in poorly-aerated soils[J]. Soil and Tillage Research, 2008, 101(1/2):97-100 http://www.sciencedirect.com/science/article/pii/S016719870800113X |
| [5] | BASCHE A D, MIGUEZ F E, KASPAR T C, et al. Do cover crops increase or decrease nitrous oxide emissions? A meta-analysis[J]. Journal of Soil and Water Conservation, 2014, 69(6):471-482 doi: 10.2489/jswc.69.6.471 |
| [6] | BAGGS E M. A review of stable isotope techniques for N2O source partitioning in soils:Recent progress, remaining challenges and future considerations[J]. Rapid Communications in Mass Spectrometry, 2008, 22(11):1664-1672 doi: 10.1002/(ISSN)1097-0231 |
| [7] | CAI Y J, DING W X, ZHANG X L, et al. Contribution of heterotrophic nitrification to nitrous oxide production in a long-term N-fertilized arable black soil[J]. Communications in Soil Science and Plant Analysis, 2010, 41(19):2264-2278 doi: 10.1080/00103624.2010.507833 |
| [8] | PARK S, PéREZ T, BOERING K A, et al. Can N2O stable isotopes and isotopomers be useful tools to characterize sources and microbial pathways of N2O production and consumption in tropical soils?[J]. Global Biogeochemical Cycles, 2011, 25(1):GB1001 doi: 10.1029/2009GB003615/full |
| [9] | TOYODA S, YANO M, NISHIMURA S I, et al. Characterization and production and consumption processes of N2O emitted from temperate agricultural soils determined via isotopomer ratio analysis[J]. Global Biogeochemical Cycles, 2011, 25(2):GB2008 http://www.wanfangdata.com.cn/details/detail.do?_type=perio&id=80f72114efc64b9173471a0f8221b479 |
| [10] | ZOU Y, HIRONO Y, YANAI Y, et al. Isotopomer analysis of nitrous oxide accumulated in soil cultivated with tea (Camellia sinensis) in Shizuoka, central Japan[J]. Soil Biology and Biochemistry, 2014, 77:276-291 doi: 10.1016/j.soilbio.2014.06.016 |
| [11] | B??TH E. Effects of heavy metals in soil on microbial processes and populations (a review)[J]. Water, Air, and Soil Pollution, 1989, 47(3/4):335-379 http://femsle.oxfordjournals.org/lookup/external-ref?access_num=10.1007/BF00279331&link_type=DOI |
| [12] | VáSQUEZ-MURRIETA M S, CRUZ-MONDRAGóN C, TRUJILLO-TAPIA N, et al. Nitrous oxide production of heavy metal contaminated soil[J]. Soil Biology and Biochemistry, 2006, 38(5):931-940 doi: 10.1016/j.soilbio.2005.08.007 |
| [13] | Cole J J, Caraco N F. Emissions of nitrous oxide (N2O) from a tidal, freshwater river, the Hudson River, New York[J]. Environmental Science & Technology, 2001, 35(6):991-996 http://www.ncbi.nlm.nih.gov/pubmed/11347946 |
| [14] | 张素玲. pH变化对土壤中N2O释放的影响[D].扬州: 扬州大学, 2001 Zhang S L. Effect of pH change on N2O release in soil[D]. Yangzhou: Yangzhou University, 2001 |
| [15] | 刘庆.大宝山矿周边污染土壤重金属与微生物剖面分布的研究[D].广州: 华南农业大学, 2008 http://www.wanfangdata.com.cn/details/detail.do?_type=degree&id=Y1277581 LIU Q. Study on the profile distribution of heavy metals and microbial biomass in contaminated soils near Dabaoshan Area[D]. Guangzhou: South China Agricultural University, 2008 http://www.wanfangdata.com.cn/details/detail.do?_type=degree&id=Y1277581 |
| [16] | LIU Y, LIU Y Z, DING Y J, et al. Abundance, composition and activity of ammonia oxidizer and denitrifier communities in metal polluted rice paddies from South China[J]. PLoS One, 2014, 9(7):e102000 doi: 10.1371/journal.pone.0102000 |
| [17] | ZHOU T, PAN G X, LI L Q, et al. Changes in greenhouse gas evolution in heavy metal polluted paddy soils with rice straw return:A laboratory incubation study[J]. European Journal of Soil Biology, 2014, 63:1-6 doi: 10.1016/j.ejsobi.2014.03.008 |
| [18] | 李爽, 李晓敏, 李芳柏. Fe(Ⅱ)对反硝化过程及其功能微生物群落的影响[J].中国环境科学, 2018, 38(1):263-274 doi: 10.3969/j.issn.1000-6923.2018.01.030 LI S, LI X M, LI F B. Effect of Fe(Ⅱ) on denitrification and associated functional microbial communities[J]. China Environmental Science, 2018, 38(1):263-274 doi: 10.3969/j.issn.1000-6923.2018.01.030 |
| [19] | 鲍士旦.土壤农化分析[M].第3版.北京:中国农业出版社, 2000 BAO S D. Soil and Agricultural Chemistry Analysis[M]. 3rd ed. Beijing:China Agricultural Press, 2000 |
| [20] | YAMAMOTO A, AKIYAMA H, NAKAJIMA Y, et al. Estimate of bacterial and fungal N2O production processes after crop residue input and fertilizer application to an agricultural field by 15N isotopomer analysis[J]. Soil Biology and Biochemistry, 2017, 108:9-16 doi: 10.1016/j.soilbio.2017.01.015 |
| [21] | TOYODA S, YOSHIDA N. Determination of nitrogen isotopomers of nitrous oxide on a modified isotope ratio mass spectrometer[J]. Analytical Chemistry, 1999, 71(20):4711-4718 doi: 10.1021/ac9904563 |
| [22] | MARIOTTI A, GERMON J C, HUBERT P, et al. Experimental determination of nitrogen kinetic isotope fractionation:Some principles; illustration for the denitrification and nitrification processes[J]. Plant and Soil, 1981, 62(3):413-430 doi: 10.1007/BF02374138 |
| [23] | YUNG Y L, MILLER C E. Isotopic fractionation of stratospheric nitrous oxide[J]. Science, 1997, 278(5344):1778-1780 doi: 10.1126/science.278.5344.1778 |
| [24] | FRAME C H, CASCIOTTI K L. Biogeochemical controls and isotopic signatures of nitrous oxide production by a marine ammonia-oxidizing bacterium[J]. Biogeosciences, 2010, 7(9):2695-2709 doi: 10.5194/bg-7-2695-2010 |
| [25] | HEIL J, WOLF B, BRüGGEMANN N, et al. Site-specific 15N isotopic signatures of abiotically produced N2O[J]. Geochimica et Cosmochimica Acta, 2014, 139:72-82 doi: 10.1016/j.gca.2014.04.037 |
| [26] | SUTKA R L, OSTROM N E, OSTROM P H, et al. Distinguishing nitrous oxide production from nitrification and denitrification on the basis of isotopomer abundances[J]. Applied and Environmental Microbiology, 2006, 72(1):638-644 doi: 10.1128/AEM.72.1.638-644.2006 |
| [27] | MAEDA K, SPOR A, EDEL-HERMANN V, et al. N2O production, a widespread trait in fungi[J]. Scientific Reports, 2015, 5:9697 doi: 10.1038/srep09697 |
| [28] | ROHE L, ANDERSON T H, BRAKER G, et al. Dual isotope and isotopomer signatures of nitrous oxide from fungal denitrification-A pure culture study[J]. Rapid Communications in Mass Spectrometry, 2014, 28(17):1893-1903 doi: 10.1002/rcm.6975 |
| [29] | SUTKA R L, ADAMS G C, OSTROM N E, et al. Isotopologue fractionation during N2O production by fungal denitrification[J]. Rapid Communications in Mass Spectrometry, 2008, 22(24):3989-3996 doi: 10.1002/rcm.v22:24 |
| [30] | TOYODA S, MUTOBE H, YAMAGISHI H, et al. Fractionation of N2O isotopomers during production by denitrifier[J]. Soil Biology and Biochemistry, 2005, 37(8):1535-1545 doi: 10.1016/j.soilbio.2005.01.009 |
| [31] | LEWICKA-SZCZEBAK D, DYCKMANS J, KAISER J, et al. Oxygen isotope fractionation during N2O production by soil denitrification[J]. Biogeosciences, 2016, 13(4):1129-1144 doi: 10.5194/bg-13-1129-2016 |
| [32] | LEWICKA-SZCZEBAK D, WELL R, K?STER J R, et al. Experimental determinations of isotopic fractionation factors associated with N2O production and reduction during denitrification in soils[J]. Geochimica et Cosmochimica Acta, 2014, 134:55-73 doi: 10.1016/j.gca.2014.03.010 |
| [33] | LEWICKA-SZCZEBAK D, AUGUSTIN J, GIESEMANN A, et al. Quantifying N2O reduction to N2 based on N2O isotopocules-validation with independent methods (helium incubation and 15N gas flux method)[J]. Biogeosciences, 2017, 14(3):711-732 doi: 10.5194/bg-14-711-2017 |
| [34] | DEPPE M, WELL R, GIESEMANN A, et al. Soil N2O fluxes and related processes in laboratory incubations simulating ammonium fertilizer depots[J]. Soil Biology and Biochemistry, 2017, 104:68-80 doi: 10.1016/j.soilbio.2016.10.005 |
| [35] | BOL R, TOYODA S, YAMULKI S, et al. Dual isotope and isotopomer ratios of N2O emitted from a temperate grassland soil after fertiliser application[J]. Rapid Communications in Mass Spectrometry, 2003, 17(22):2550-2556 doi: 10.1002/(ISSN)1097-0231 |
| [36] | HOLTGRIEVE G W, JEWETT P K, MATSON P A. Variations in soil N cycling and trace gas emissions in wet tropical forests[J]. Oecologia, 2006, 146(4):584-594 doi: 10.1007/s00442-005-0222-1 |
| [37] | MENYAILO O V, HUNGATE B A. Stable isotope discrimination during soil denitrification:Production and consumption of nitrous oxide[J]. Global Biogeochemical Cycles, 2006, 20(3):GB3025 http://www.bmj.com/lookup/external-ref?access_num=21421007&link_type=MED&atom=%2Fbmj%2F345%2Fbmj.e4727.atom |
| [38] | 林伟, 张薇, 李玉中, 等.有机肥与无机肥配施对菜地土壤N2O排放及其来源的影响[J].农业工程学报, 2016, 32(19):148-153 doi: 10.11975/j.issn.1002-6819.2016.19.021 LIN W, ZHANG W, LI Y Z, et al. Effects of combined application of manure and inorganic fertilizer on N2O emissions and sources in vegetable soils[J]. Transactions of the CSAE, 2016, 32(19):148-153 doi: 10.11975/j.issn.1002-6819.2016.19.021 |
| [39] | DIJKSTRA F A, AUGUSTINE D J, BREWER P, et al. Nitrogen cycling and water pulses in semiarid grasslands:Are microbial and plant processes temporally asynchronous?[J]. Oecologia, 2012, 170(3):799-808 doi: 10.1007/s00442-012-2336-6 |
| [40] | HARRISON-KIRK T, BEARE M H, MEENKEN E D, et al. Soil organic matter and texture affect responses to dry/wet cycles:Effects on carbon dioxide and nitrous oxide emissions[J]. Soil Biology and Biochemistry, 2013, 57:43-55 doi: 10.1016/j.soilbio.2012.10.008 |
| [41] | LIU X C, QI Y C, DONG Y S, et al. Response of soil N2O emissions to precipitation pulses under different nitrogen availabilities in a semiarid temperate steppe of Inner Mongolia, China[J]. Journal of Arid Land, 2014, 6(4):410-422 doi: 10.1007/s40333-013-0211-x |
| [42] | 丁军军, 张薇, 李玉中, 等.不同灌溉量对华北平原菜地N2O排放及其来源的影响[J].应用生态学报, 2017, 28(7):2269-2276 http://d.old.wanfangdata.com.cn/Periodical/yystxb201707024 DING J J, ZHANG W, LI Y Z, et al. Effects of soil water condition on N2O emission and its sources in vegetable farmland of North China Plain[J]. Chinese Journal of Applied Ecology, 2017, 28(7):2269-2276 http://d.old.wanfangdata.com.cn/Periodical/yystxb201707024 |
| [43] | BOUWMAN A F, DERWENT R G, DENTENER F J. Towards reliable global bottom-up estimates of temporal and spatial patterns of emissions of trace gases and aerosols from land-use related and natural sources[J]. Developments in Atmospheric Science, 1999, 24:3-26 doi: 10.1016/S0167-5117(98)80022-0 |
| [44] | HAYNES R J. Uptake and assimilation of mineral nitrogen by plants[M]//HAYNES R J. Mineral Nitrogen in the Plant-Soil System. Amsterdam: Elsevier Inc., 1986: 303-378 |
| [45] | HOLTAN-HARTWIG L, BECHMANN M, H?Y?S T R, et al. Heavy metals tolerance of soil denitrifying communities:N2O dynamics[J]. Soil Biology and Biochemistry, 2002, 34(8):1181-1190 doi: 10.1016/S0038-0717(02)00055-X |
