 ,*北京林业大学林学院, 北京 100083
Testing parameter sensitivities and uncertainty analysis of Biome-BGC model in simulating carbon and water fluxes in broadleaved-Korean pine forests
LI Xu-Hua, SUN Osbert Jianxin,*College of Forestry, Beijing Forestry University, Beijing 100083, China通讯作者:
编委: 李胜功
责任编辑: 李敏
收稿日期:2018-09-18修回日期:2018-12-6网络出版日期:2018-12-20
| 基金资助: |
Received:2018-09-18Revised:2018-12-6Online:2018-12-20
| Fund supported: |

摘要
关键词:
Abstract
Keywords:
PDF (1296KB)元数据多维度评价相关文章导出EndNote|Ris|Bibtex收藏本文
本文引用格式
李旭华, 孙建新. Biome-BGC模型模拟阔叶红松林碳水通量的参数敏感性检验和不确定性分析. 植物生态学报[J], 2018, 42(12): 1131-1144 doi:10.17521/cjpe.2018.0231
LI Xu-Hua.
近些年来, 生态过程模型的发展为研究者在长时间序列和区域、全球尺度上对陆地生态系统碳、水循环以及它们应对全球气候变化方面的研究提供了极大的便利(Thornton et al., 2002; Tian et al., 2010)。但是由于模型建立者在建立模型时对植被生理生态过程机制描述的简化, 以及受模型本身结构限制和模型参数估计时的合理性的影响, 使得生态系统过程模型的模拟结果存在很大的不确定性(康满春, 2016; 郑磊等, 2017)。因此, 在任何情况下敏感性分析是建模和应用的先决条件(Miao et al., 2004, 2011), 也是模型参数化过程的重要工具。通过敏感性分析能够定性或定量地确定模型中对模拟结果影响较大的参数, 从而有针对性地优化、校准对模型输出结果影响较大的参数, 能够在很大程度上减少模型校准的工作量, 提高模拟效率(徐崇刚等, 2004), 进而提高模型的适用性和准确性。虽然模型参数敏感性分析的重要性已被广泛认同, 但是目前很多关于模型的文献中并没有进行这一项分析, 主要是由于模型参数众多, 计算过程复杂且结果较难解释(Majkowski et al., 1981)。
模型参数敏感性分析包括局部敏感性分析和全局敏感性分析(徐崇刚等, 2004)。局部敏感性分析是基于因子变化法, 即通过一次只改变一个参数值而保持其他参数值不变来检验该参数发生变化对模型输出结果的影响程度, 操作相对简单且能够实现初步筛选敏感参数的目的, 但往往模型中多数参数间是存在线性或非线性关系的, 所以此方法具有一定的局限性和片面性。而全局敏感性分析可计算多个参数同时变化对模型输出结果的影响, 并考虑到参数之间的相互作用, 适用于模型参数较多的非线性模型(邢会敏等, 2017)。全局敏感性分析方法主要有定性全局敏感性分析(包括多元回归法、Morris法、傅里叶幅度灵敏度检验法(FAST))和定量全局敏感性分析(Sobol’法和傅里叶幅度灵敏度检验扩展法(EFAST))。其中, 在全局敏感性分析中以Sobol’法和EFAST最为常用, 二者都是基于方差分析的方法, 且能够量化各个输入参数对输出变量的一阶或多阶敏感性指数。近几年, 随着大量模型的应用, 全局敏感性分析方法已在水文模型(任启伟等, 2010; 李艳等, 2014)、作物模型(张静潇和苏伟, 2012; 谭君位, 2017)、生理生态模型(Miao et al., 2011; Zhang et al., 2012)等模型分析中被广泛应用。
生物地球化学循环模型(Biome-BGC)是一个典型的参数众多的生理生态过程模型, 它能够模拟不同植被类型的碳通量和水通量。目前关于该模型的敏感性分析已有一些报道, 多是采用局部敏感性分析的方法, 分析单个参数变化对模拟的年净初级生产力(NPP)的影响(White et al., 2000; Tatarinov & Cienciala, 2006; Kumar & Raghubanshi, 2012)。由于局部敏感性分析的局限性, 研究者们开始采用全局敏感性分析方法对Biome-BGC模型进行参数敏感性分析(Raj et al., 2014; 何丽鸿等, 2016; Yan et al., 2016), 这些研究都表明敏感性分析筛选出的敏感参数会随着不同物种、不同区域而变化, 所以针对特定研究区、特定植被类型运用Biome-BGC进行碳水通量的模拟时, 敏感性分析是模型参数本地化的必要过程。那么, 在这些众多的参数中, 哪些参数是必须要进行率定, 而哪些参数则是可以采用缺省值的? 此外, 以往对Biome-BGC模型参数敏感性分析的研究中, 主要集中于探讨参数变化对碳通量(包括总初级生产力(GPP)、NPP、净生态系统交换(NEE)等)输出的影响, 很少有关于模型参数变化如何影响模拟蒸散量(ET)的分析。
本文在已有研究的基础上, 以东北阔叶红松林为例, 采用全局敏感性分析方法EFAST, 分别探讨和分析阔叶树和红松的模拟NPP、ET对Biome- BGC模型参数变化的敏感性, 计算各个参数的一阶和全局敏感性指数, 进一步筛选对输出结果影响较大的敏感参数, 旨在为后续的模型参数优化和参数校准提供理论依据, 同时也进一步加深对过程模型的认识。
1 材料和方法
1.1 研究区域概况
本研究地点在吉林省抚松县露水河林业局(127.48°-128.03° E, 42.40°-42.82° N), 其位于长白山自然保护区西北麓, 总经营面积120 934 hm2。该区域属温带大陆性季风气候, 温度和降水季节变化显著, 降水集中在夏季, 年降水量为800-1 040 mm, 年平均气温4.5-7.8 ℃, 平均相对湿度为70%-75%。土壤类型为山地暗棕色森林土(王亮等, 2016), 海拔范围400-1 350 m, 地带性植被为阔叶红松林。自建局以来, 该区域主要以森林经营为主, 目前现存的森林中既有未被采伐且保存完好的原始林, 又有受不同强度采伐, 经过不同恢复时间而形成的各种次生林(于大炮等, 2015)。林区乔木层主要树种有红松(Pinus koraiensis)、云杉(Picea asperata)、臭冷杉(Abies nephrolepis)、水曲柳(Fraxinus mandschurica)、蒙古栎(Quercus mongolica)、紫椴(Tilia amurensis)、硕桦(Betula costata)、白桦(Betula platyphylla)和春榆(Ulmus davidiana var. japonica)等; 亚乔木层的树种有千金榆(Carpinus cordata)、色木槭(Acer mono)、青楷槭(Acer tegmentosum)、山槐(Albizia kalkora)、紫花槭(Acer pseudo-sieboldianum)、暴马丁香(Syringa reticulata)等; 灌木层主要有毛榛子(Corylus mandshurica)、簇毛槭(Acer barbinerve)、东北茶藨子(Ribes mandshuricum)、刺五加(Eleutherococcus senticosus)、卫矛(Euonymus alatus)、胡枝子(Lespedeza bicolor)、龙牙楤木(Aralia elata)、山梅花(Philadelphus incanus)(Qi et al., 2016)。1.2 模型简介及参数化
Biome-BGC模型是美国蒙大拿大学陆地动态数值模拟小组(Numerical Terradynamic Simulation Group, NTSG)研发的生理生态过程模型, 由Forest-BGC模型(Running & Coughlan, 1988)演变而来, 目前我们使用的是4.2版本(http://www.ntsg.umt. edu/project/biome-bgc.php), 它是以日为步长能够模拟不同尺度陆地生态系统碳、氮、水循环通量, 可以对7种不同植被类型进行模拟, 包括常绿针叶林(ENF)、落叶阔叶林(DBF)、落叶针叶林(DNF)、常绿阔叶林(EBF)、灌丛(Shrub)、C3草地以及C4草地。模型的运行需要3个文件: 分别是初始化文件(ini)、气象数据文件(metdata)和植被的生理生态参数文件(epc)。输出结果有生态系统碳通量(NPP、GPP、生态系统呼吸(Re)、净生态系统生产力(NEP))、水通量(冠层蒸腾(Tr)、土壤蒸发(Es)、ET)等相关信息。初始化文件主要包括经纬度、海拔、土壤质地、土壤有效深度等样地信息和其他状态变量的设定, 样地信息根据实际调查获取。由于研究区无气象站, 所以本文的气象驱动数据来源于中国气象科学数据共享服务网(http://data.cma.cn/data/cdcindex.html)发布的吉林省二道气象站的气象资料, 时间尺度为1958-2015年。对于不能直接从气象站获取的气象因子, 则根据日最高气温、日最低气温、日降水量, 利用小型山地气候模型(MTCLIM 4.3)估算得到。对于生理生态参数, 一部分通过实测获取; 另一部分则通过搜集已有文献数据得到; 个别不易获取且没有相关文献数据的参数采用模型缺省值。Biome-BGC模型没有针对阔叶红松林(针阔混交林)的生理生态参数, 借鉴已有研究的处理方法(Kang et al., 2006; Schmid et al., 2006), 采取对红松和阔叶树各自设定一套生理生态参数, 分别模拟红松和阔叶树的碳水通量, 然后根据二者比例进行加权平均的方法, 计算得到样地总的NPP和ET。
1.3 验证数据
使用树木年轮序列来验证模拟NPP在长时间序列上的可信度。首先, 在样地内进行每木检尺的基础上, 将样地内的优势树种分为不同径级, 每个径级选取4-5株标准木钻取树芯, 于标准木胸径处的两个垂直方向上分别钻取两个样芯。将钻取的树芯保存在塑料吸管中, 带回室内后将其固定在U形木槽中, 并在上层涂胶固定。待其自然风干, 用不同目数的砂纸逐次打磨, 直至用肉眼能够清晰地辨别树木年轮线。然后用测量精度为0.001 mm的LINTAB 6年轮观测仪(Rintech, Heidelberg, Germany)和TSAP软件(Frank Rinn, Germany)来测量每个树芯的年轮宽度, 所得结果通过COFECHA软件进行交叉定年检验, 在此剔除存在异常和难以交叉定年的样本序列。最后运用ARSTAN程序将交叉定好年的年轮序列做进一步的处理分析。经过反复尝试, 本文选用以2/3年龄作为步长的样条函数法去趋势, 同时对去趋势序列以双权重平均法合成标准表(STD), 进而用年轮宽度指数(RWI)对模型进行验证和分析。用于验证分析的空间分辨率为1 km的卫星遥感反演数据MOD17A3 NPP和MOD16A3 ET (http://www.ntsg.umt.edu/project/modis/), 来自于美国蒙大拿大学陆地动态数值模拟小组(Numerical Terradynamic Simulation Group, NTSG)。我们根据经纬度信息分别提取采样点2000-2014年的NPP和ET, 与本文模拟得到的2000-2014年的NPP和ET进行比较, 通过方差分析来检验二者之间是否存在显著差异。
1.4 参数值的建立
本文主要针对模型的生理生态参数进行敏感性分析。首先根据实际情况选出要进行敏感性分析的参数, 对于用来表征植被类型或光合特征等标记性参数和固定组合比例的参数不进行敏感性分析。本文设定火灾死亡率均为0, 故也不参与敏感性分析。最终分别选出31个参数和30个参数参与对红松和阔叶树的NPP和ET的敏感性分析。其次确定各个参数的取值范围, 由于Biome-BGC模型没有给出每个参数的具体取值范围, 所以本文根据White等(2000)提出的模型参数平均值的置信区间为20%, 将模型参数的取值范围设定为(x - Δx, x + Δx), 其中x为参数基准值, Δx = 0.2x, 采用均匀分布, 且参数间相互独立。生理生态参数的基准值即为上述经过本地参数化的值(表1), 各参数的取值范围见表2。Table 1
表1
表1红松(PK)和阔叶树(DB)生理生态参数本地化
Table 1
| 参数 Parameter | 符号 Symbol | 红松基 准值 Basic value of Korean pine | 阔叶树 基准值 Basic value of broadleaf species | 单位 Unit | 来源 Source |
|---|---|---|---|---|---|
| 转移生长占生长季的比例 Transfer growth period | Tt | 0.3 | 0.2 | - | Biome-BGC V4.2 |
| 凋落过程占生长季的比例 Litterfall period | LFG | 0.3 | 0.2 | - | Biome-BGC V4.2 |
| 叶片与细根周转率 Annual leaf and fine root turnover fraction | LFRT | 0.32 | 1.0 | a-1 | Liu et al., 2014 |
| 活立木周转率 Annual live wood turnover fraction | LWT | 0.7 | 0.7 | a-1 | Biome-BGC V4.2 |
| 整株植物死亡率 Annual whole-plant mortality fraction | WPM | 0.009 0 | 0.021 3 | a-1 | Sang & Li, 1998 |
| 火灾死亡率 Annual fire mortality fraction | FM | 0 | 0 | a-1 | Set by us |
| 细根与叶片碳分配比 New fine root C: leaf C | FRC:LC | 1.2 | 0.9 | - | Yao et al., 1986; Mei, 2006 |
| 新茎与新叶碳分配比 New stem C: leaf C | SC:LC | 1.4 | 2.4 | - | Li, 1984 |
| 活立木与所有木质组织碳分配比 New live wood C: total wood C | LWC:TWC | 0.379 | 0.1 | - | Wu et al., 2017 |
| 粗根与新茎碳分配比 New coarse root C: stem C | CRC:SC | 0.29 | 0.23 | - | White et al., 2000 |
| 当前生长比例 Current growth proportion | CGP | 0.5 | 0.5 | - | Biome-BGC V4.2 |
| 叶片碳氮比 C:N of leaves | C:Nleaf | 34.30 | 17.55 | kg·kg-1 | Measured by us |
| 叶片凋落物碳氮比 C:N of falling leaf litter | C:Nlitter | 96.5 | 41.1 | kg·kg-1 | Li et al., 2008; Mao et al., 2016; Li et al., 2017 |
| 细根碳氮比 C:N of ?ne roots | C:Nfr | 56.4 | 47.4 | kg·kg-1 | Liang et al., 2018 |
| 活立木碳氮比 C:N of live wood | C:Nlw | 97.4 | 97.05 | kg·kg-1 | Wu et al., 2017 |
| 死立木碳氮比 C:N of dead wood | C:Ndw | 398 | 212 | kg·kg-1 | Zhang & Wang, 2010 |
| 叶片凋落物易分解物质所占比 Leaf litter labile proportion | Llab | 0.45 | 0.53 | - | Jiang, 2013 |
| 叶片凋落物纤维素所占比 Leaf litter cellulose proportion | Lcel | 0.25 | 0.22 | - | Jiang, 2013 |
| 叶片凋落物木质素所占比 Leaf litter lignin proportion | Llig | 0.30 | 0.25 | - | Jiang, 2013 |
| 细根中易分解物质所占比 Fine root labile proportion | FRlab | 0.34 | 0.30 | - | Biome-BGC V4.2 |
| 细根中纤维素所占比 Fine root cellulose proportion | FRcel | 0.44 | 0.45 | - | Biome-BGC V4.2 |
| 细根中木质素所占比 Fine root lignin proportion | FRlig | 0.22 | 0.25 | - | Biome-BGC V4.2 |
| 死立木中纤维素所占比 Dead wood cellulose proportion | DWcel | 0.73 | 0.76 | - | Zhu, 2013 |
| 死立木中木质素所占比 Dead wood lignin proportion | DWlig | 0.27 | 0.24 | - | Zhu, 2013 |
| 冠层截留系数 Water interception coef?cient | Wint | 0.045 | 0.033 | LAI-1·d-1 | Wu et al., 2017 |
| 冠层消光系数 Light extinction coef?cient | k | 0.50 | 0.58 | - | Zhou et al., 2008 |
| 所有叶面积与投影叶面积之比 Ratio of all sided to projected leaf area | LAIall:proj | 2.6 | 2.0 | - | White et al., 2000 |
| 冠层平均比叶面积 Average speci?c leaf area | SLA | 16.4 | 54.2 | m2·kg-1 | Measured by us |
| 阴叶与阳叶比叶面积比 Ratio of shade SLA : sunlit SLA | SLAshd:sun | 2 | 2 | - | White et al., 2000 |
| Rubisco酶中叶氮含量 Fraction of leaf N in Rubisco | FLNR | 0.080 | 0.075 | - | Su et al., 2015 |
| 最大气孔导度 Maximum stomatal conductance | Gsmax | 0.006 0 | 0.006 5 | m·s-1 | Su et al., 2015 |
| 表皮导度 Cuticular conductance | Gcut | 0.000 06 | 0.000 01 | m·s-1 | Su et al., 2015 |
| 边界层导度 Boundary layer conductance | Gbl | 0.09 | 0.01 | m·s-1 | White et al., 2000 |
| 气孔开始减小时叶片水势 Leaf water potential : start of gs reduction | LWPi | -0.65 | -0.34 | MPa | White et al., 2000 |
| 气孔停止减小时叶片水势 Leaf water potential : completion of gs reduction | LWPf | -2.5 | -2.2 | MPa | White et al., 2000 |
| 气孔开始减小时饱和水汽压差 Vapor pressure deficit : start of gs reduction | VPDi | 610 | 1 100 | Pa | White et al., 2000 |
| 气孔停止减小时饱和水汽压差 Vapor pressure deficit : completion of gs reduction | VPDf | 3 100 | 3 600 | Pa | White et al., 2000 |
新窗口打开|下载CSV
Table 2
表2
表2参与敏感性分析的红松和阔叶树生理生态参数的取值范围
Table 2
| 参数符号 Parameter symbol | 红松取值范围 Value range of Korean pine | 阔叶树取值范围 Value range of broadleaved species | 单位 Unit |
|---|---|---|---|
| LFRT | [0.256, 0.384] | a-1 | |
| LWT | [0.56, 0.84] | [0.56, 0.84] | a-1 |
| WPM | [0.0072, 0.0108] | [0.017, 0.0256] | a-1 |
| FRC:LC | [0.96, 1.44] | [0.72, 1.08] | - |
| SC:LC | [1.12, 1.68] | [1.92, 2.88] | - |
| LWC:TWC | [0.303, 0.455] | [0.08, 0.12] | - |
| CRC:SC | [0.232, 0.348] | [0.184, 0.276] | - |
| CGP | [0.4, 0.6] | [0.4, 0.6] | - |
| C:Nleaf | [27.44, 41.16] | [14.04, 21.06] | kg·kg-1 |
| C:Nlitter | [77.2, 115.8] | [32.88, 49.32] | kg·kg-1 |
| C:Nfr | [45.12, 67.68] | [37.92, 56.88] | kg·kg-1 |
| C:Nlw | [77.92, 116.88] | [77.64, 116.46] | kg·kg-1 |
| C:Ndw | [318.4, 477.6] | [169.6, 254.4] | kg·kg-1 |
| Lcel | [0.2, 0.3] | [0.176, 0.264] | - |
| Llig | [0.24, 0.36] | [0.2, 0.3] | - |
| FRcel | [0.352, 0.528] | [0.36, 0.54] | - |
| FRlig | [0.176, 0.264] | [0.2, 0.3] | - |
| DWlig | [0.216, 0.324] | [0.192, 0.288] | - |
| Wint | [0.036, 0.054] | [0.0264, 0.0396] | LAI-1·d-1 |
| k | [0.4, 0.6] | [0.464, 0.696] | - |
| LAIall:proj | [2.08, 3.12] | [1.6, 2.4] | - |
| SLA | [13.12, 19.68] | [43.36, 65.04] | m2·kg-1 |
| SLAshd:sun | [1.6, 2.4] | [1.6, 2.4] | - |
| FLNR | [0.064, 0.096] | [0.06, 0.09] | - |
| Gsmax | [0.0048, 0.0072] | [0.0052, 0.0078] | m·s-1 |
| Gcut | [0.000048, 0.000072] | [0.000008, 0.000012] | m·s-1 |
| Gbl | [0.072, 0.108] | [0.008, 0.012] | m·s-1 |
| LWPi | [-0.78, -0.52] | [-0.408, -0.272] | MPa |
| LWPf | [-3, -2] | [-2.64, -1.76] | MPa |
| VPDi | [488, 732] | [880, 1320] | Pa |
| VPDf | [2480, 3720] | [2880, 4320] | Pa |
新窗口打开|下载CSV
1.5 敏感性分析方法
本研究采用EFAST法对模型中的生理生态参数进行敏感性分析。EFAST是基于方差的定量敏感性分析方法, 它结合了FAST方法(Cukier et al., 1978)的计算高效和Sobol’法(Sobol, 1993)可计算总体敏感性两者的优点, 由傅里叶转换获得傅里叶级数的频谱, 通过该频谱曲线分别得到由每一个参数及参数的相互作用所引起的模型结果的方差(徐崇刚等, 2004)。具体计算原理为: 通过估算每个输入参数(Xi)的变化对输出结果Y的方差的贡献率得到敏感性, Y = f(X) = f(X1, X2 ,X3,…, Xn), Xi表示各个输入参数, 且都有相应的取值范围来表示参数取值的不确定性。模型输出结果的总方差可以表示为:${{V}_{Y}}=\underset{i}{\mathop \sum }\,{{V}_{i}}+\underset{i}{\mathop \sum }\,\underset{j>i}{\mathop \sum }\,{{V}_{ij}}+\underset{i}{\mathop \sum }\,\underset{j>i}{\mathop \sum }\,\underset{k>j}{\mathop \sum }\,{{V}_{ijk}}+\cdots +{{V}_{12\cdots n}}$
其中, VY是模型模拟结果的总方差, Vi是单个因子的方差, Vij-V12···n是参数之间交互作用的方差。参数Xi对模型输出结果总方差的直接贡献可用一阶敏感性指数表示: 即Si = Vi/VY, 而Xi的全局敏感性指数为参数的一阶敏感性以及该参数与其他参数相互作用的各阶敏感性指数之和(Saltelli, 2002; 何丽鸿等, 2016; 闫敏, 2016), 表示为: STi = Si + Sij + Sijk + ··· + S12…n。
文中借助敏感性和不确定性分析软件SimLab 2.2实现对Biome-BGC模型参数的敏感性分析。根据各个输入参数的分布范围, 利用Monte Carlo方法对各参数进行随机采样, 本研究设定每个参数的采样次数为130次(EFAST方法认为每个参数的采样次数大于65次的分析结果才有效), 所以在对红松和阔叶树进行模拟时, 生理生态参数的采样次数分别为4 030 (130 × 31)次和3 900 (130 × 30)次。根据生成的多组输入参数, 批量运行Biome-BGC模型, 模拟得到多组红松和阔叶树58年(1958-2015)的NPP和ET, 并计算NPP和ET的多年平均值, 进而输入到SimLab中通过EFAST模块进行敏感性分析。最终将敏感性指数分为3个等级, 大于0.2为高敏感性指数, 介于0.1到0.2之间为中敏感性指数, 小于0.1则不敏感(Tatarinov & Cienciala, 2006; Yan et al., 2016)。
1.6 通径分析
通径分析是一种多元统计分析方法, 它是在多元回归的基础上将自变量与因变量的简单相关系数分解为直接通径系数和间接通径系数。具体原理为:任一自变量xi与因变量y之间的简单相关系数r = xi与y之间的直接通径系数 + 所有xi与y的间接通径系数。其中, 直接通径系数即为多元线性回归方程中的标准化偏回归系数, 而任一自变量xi对y的间接通径系数 = 两因子间的相关系数(rij) × 直接通径系数(Pjy)。本文中通径分析是借助于统计分析软件SPSS 17.0来完成。2 结果和分析
2.1 Biome-BGC模型的验证
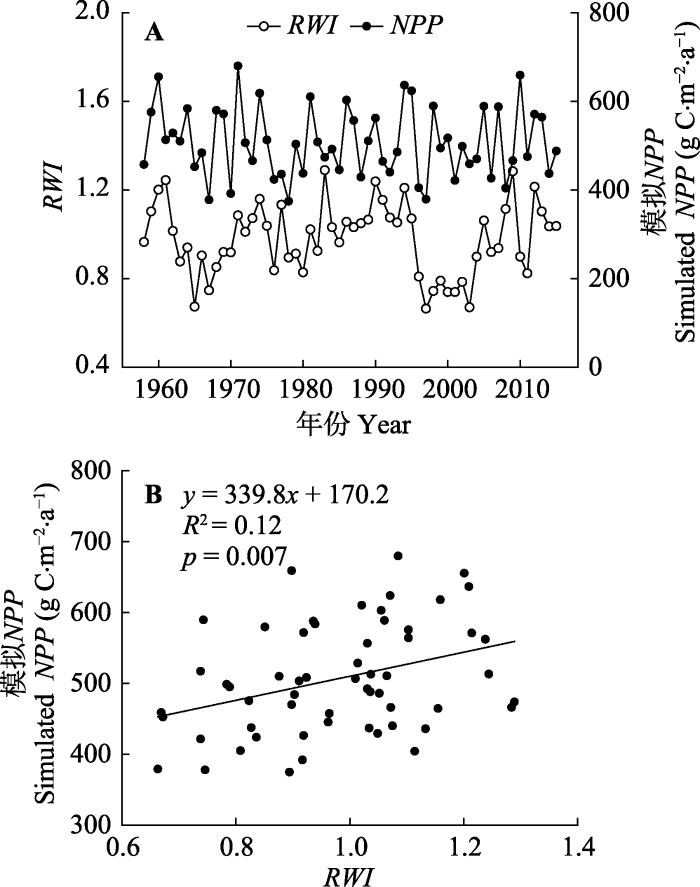
文中使用参数本地化后的Biome-BGC模型, 对研究区内的阔叶红松林进行了碳水通量的模拟。模拟结果显示, 1958-2015年研究样点阔叶红松林NPP的年平均值为507.9 g C·m-2·a-1, ET的年平均值为677.5 mm·a-1。通过模拟NPP与RWI序列之间的对比分析(图1), 结果显示模拟的阔叶红松林NPP与RWI在年际的波动趋势在总体时间序列上是相似的, 并且二者之间存在显著正相关关系(p < 0.05), 由此说明经过参数本地化后的Biome-BGC模型能够较好地模拟阔叶红松林NPP的时间动态。图1
 新窗口打开|下载原图ZIP|生成PPT
图11958-2015年间模型模拟净初级生产力(NPP)与年轮宽度指数(RWI)的对比分析。
Fig. 1Comparison of modeled net primary productivity (NPP) with tree-ring width index (RWI) during the period 1958-2015. A, Time series of modeled NPP and RWI. B, Correlations between modeled NPP and RWI.
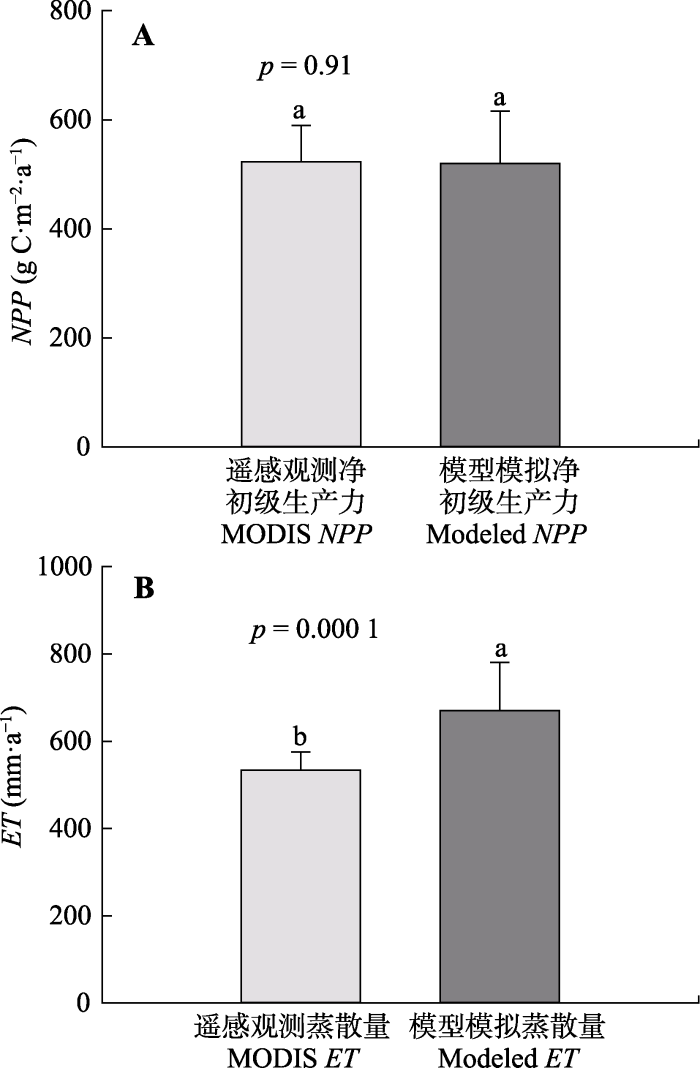
A, 模拟NPP与RWI的时间序列。B, 模拟NPP与RWI的相关性分析。模拟得到的2000-2014年阔叶红松林的年平均NPP为519.9 g C·m-2·a-1, 年平均ET为670.6 mm·a-1; 而提取到的2000-2014年遥感观测NPP和ET的年平均值分别为523.4 g C·m-2·a-1和533.7 mm·a-1 (图2)。通过方差分析进一步表明, 模拟NPP与遥感观测NPP之间无显著差异(p = 0.91), 二者的值十分接近。模拟ET与遥感观测ET则存在显著差异(p < 0.05), 模拟ET值要明显高于遥感观测ET, 但是二者在年际的变化呈显著正相关关系(r = 0.56; p = 0.03)。上述分析表明, Biome-BGC模型能够较好地模拟阔叶红松林的碳水通量。
图2
 新窗口打开|下载原图ZIP|生成PPT
图2模型模拟净初级生产力(NPP)和蒸散(ET)分别与MODIS NPP和MODIS ET的比较分析(平均值+标准误差)。A, NPP的比较。B, ET的比较。不同小写字母表示模拟值与遥感观测值间的差异显著(p < 0.05)。
Fig. 2Comparisons of modeled net primary productivity (NPP) and evapotranspiration (ET) with that of MODIS NPP and ET (mean + SD), respectively. A, NPP. B, ET. Different lowercase letters indicate significant difference between modeled values and MODIS values.
2.2 不确定性分析
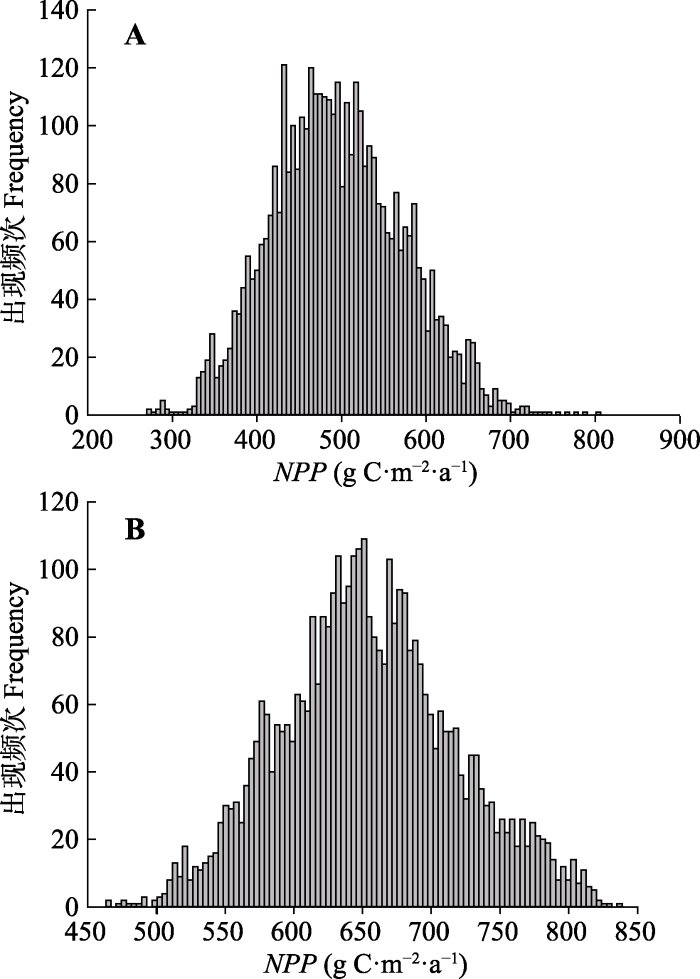
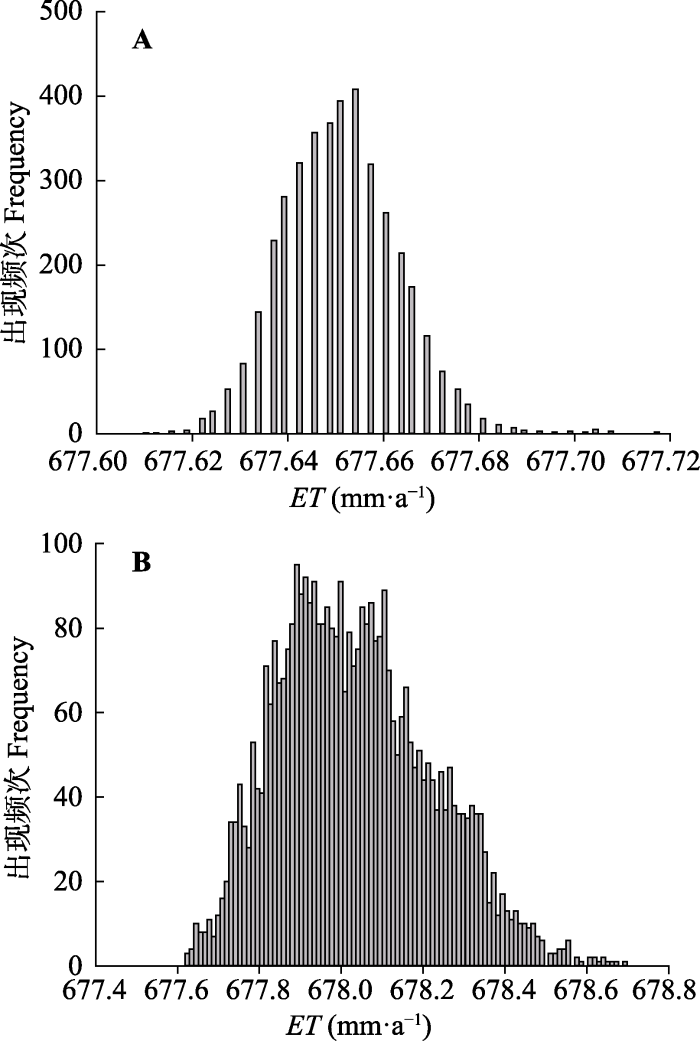
我们首先对模拟结果的不确定性进行了分析,通过柱状图和统计信息来表示。从统计信息可知, 模拟NPP的不确定性(变异系数CV)要远高于ET, 且红松的模拟NPP不确定性高于阔叶树(表3)。其中, 红松和阔叶树NPP年平均值的变化范围分别为272.7-803.9 g C·m-2·a-1和468.1-841.8 g C·m-2·a-1。红松ET年平均值的变化幅度很小, 只有0.11 mm的变化, 而阔叶树ET年平均值的分布范围为677.6-678.7 mm·a-1, 二者模拟ET的不确定性都较小, 变异系数分别只有0.002%和0.030%。此外, 模型模拟得到的红松NPP低于阔叶树, 但二者的ET基本相同, 不同阔叶红松林样地总的NPP和ET则因样地内红松与阔叶树的比例不同而不同。Table 3
表3
表3模拟净初级生产力(NPP)和蒸散(ET)的不确定性分析的统计信息
Table 3
| 红松 Korean pine | 阔叶树 Broadleaved species | |||
|---|---|---|---|---|
| NPP (g C·m-2·a-1) | ET (mm·a-1) | NPP (g C·m-2·a-1) | ET (mm·a-1) | |
| 平均值 Mean | 498.4 | 677.6 | 656.1 | 678.0 |
| 标准差 SD | 76.9 | 0.013 | 63.5 | 0.19 |
| 变异系数 CV | 15.4 | 0.002 | 9.7 | 0.03 |
新窗口打开|下载CSV
2.3 红松生理生态参数敏感性分析
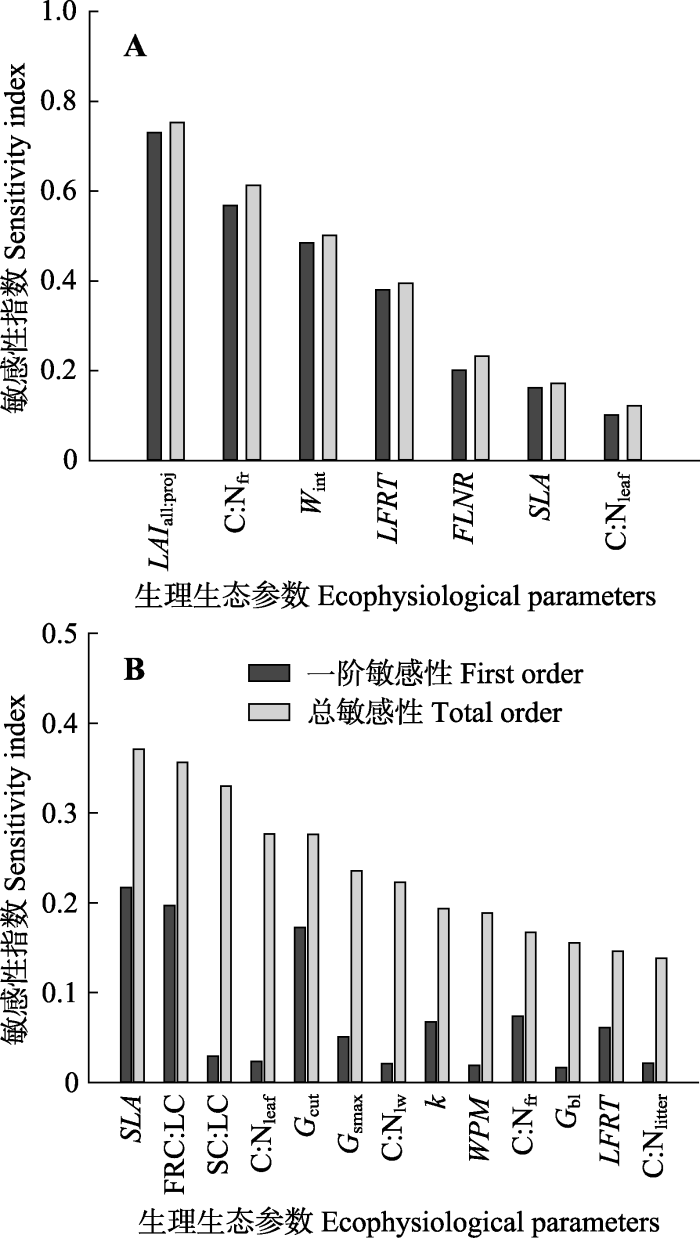
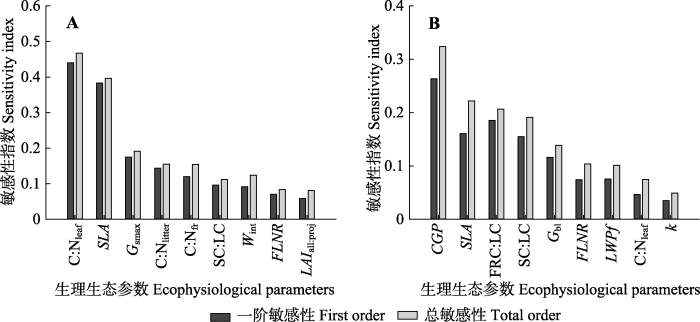
影响红松NPP的高敏感性参数分别是LAIall:proj、C:Nfr、Wint、LFRT、FLNR, 而SLA和C:Nleaf属于中敏感性参数(图5A)。其中, LAIall:proj的一阶敏感性和总敏感性指数都是最高, 达到0.7以上。在这些敏感参数中, 除LFRT外, 其他敏感参数的总敏感性与一阶敏感性的差异都很小, 说明了红松模拟NPP的变化主要是以参数的直接作用为主, 即单个参数的变化就会对模拟NPP产生很大影响; 而LFRT的总敏感性指数要明显高于一阶敏感性指数, 说明LFRT主要是通过与其他参数的交互作用间接影响红松NPP的输出结果。图3
 新窗口打开|下载原图ZIP|生成PPT
图3红松(A)和阔叶树(B)模拟净初级生产力(NPP)的不确定性分析。
Fig. 3Uncertainty analysis of modeled net primary productivity (NPP) of Korean pine (A) and broadleaved species (B).
图4
 新窗口打开|下载原图ZIP|生成PPT
图4红松(A)和阔叶树(B)模拟蒸散(ET)的不确定性分析。
Fig. 4Uncertainty analysis of modeled evapotranspiration (ET) of Korean pine (A) and broadleaved species (B).
图5
 新窗口打开|下载原图ZIP|生成PPT
图5红松生理生态参数对年净初级生产力(NPP)(A)和蒸散(ET)(B)的敏感性分析。生理生态参数符号同
Fig. 5Sensitivity analysis of the ecophysiological parameters of Korean pine to annual net primary productivity (NPP)(A) and evapotranspiration (ET)(B). See
从全局敏感性指数看, 影响红松ET模拟结果的高敏感参数依次为SLA、FRC:LC、SC:LC、C:Nleaf、Gcut、Gsmax和C:Nlw (图5B), 其中, SLA、FRC:LC和Gcut的一阶敏感性和总敏感性指数均较高, 其他参数的一阶敏感性指数均小于0.1, 而总敏感性指数却达到高敏感性或中敏感性水平, 说明这些参数主要是通过与其他参数的交互作用来影响红松ET值。
2.4 阔叶树生理生态参数敏感性分析
阔叶树模拟NPP对各植被参数的敏感性总体上都小于红松, 影响阔叶树模拟NPP的高敏感参数为C:Nleaf和SLA, 而Gsmax、C:Nlitter、C:Nfr均为中敏感性参数(图6A), 这些参数的一阶敏感性指数与总敏感性指数差异较小, 它们主要是通过直接作用影响阔叶树NPP的模拟结果。SC:LC和Wint虽然表现出中度敏感性, 但是其一阶敏感性指数为不敏感, 这二者通过与其他参数的相互作用增强了对模拟NPP的影响力。图6
 新窗口打开|下载原图ZIP|生成PPT
图6阔叶树生理生态参数对年净初级生产力(NPP)(A)和蒸散(ET)(B)的敏感性分析。生理生态参数符号同
Fig. 6Sensitivity analysis of the ecophysiological parameters of broadleaved trees to annual net primary productivity (NPP)(A) and evapotranspiration (ET)(B). See
与红松不同, 影响阔叶树ET的敏感参数由高到低分别是CGP、SLA、FRC:LC、SC:LC、Gbl, 且它们主要是通过直接作用来影响ET的模拟结果的; 而FLNR和LWPf的一阶敏感性指数为不敏感, 但总敏感性指数却表现出中敏感性。由此可知, 这两个参数单独变化时对阔叶树ET的影响较小, 但是与其他参数协同变化时, 就会对模拟ET产生影响。
2.5 通径分析
在筛选出敏感参数的基础上, 我们采用通径分析的方法进一步探讨各参数及其相互作用是如何影响输出结果的。分析结果表明: C:Nfr、LFRT、FLNR和C:Nleaf值的增加会使得红松NPP增加, 且LFRT对红松NPP的正向影响最大。而Wint、LAIall:proj和SLA对NPP的影响为负, 即这3个参数值的增加会使得红松NPP下降; 其中Wint与其他参数的间接负效应使得总效应增加, LAIall:proj和SLA与其他参数的间接正效应反而降低了对红松NPP的影响。在筛选出的对红松ET影响较大的敏感参数中, k、SLA、C:Nfr和C:Nlitter这4个参数对红松ET均表现为正向影响, 且与其他参数的间接交互作用增强了总效应。在正效应中, k的影响最大, WPM的影响最小。FRC:LC、 SC:LC、C:Nleaf、Gsmax以及Gbl与红松ET值呈负相关关系, 但SC:LC的负相关性是通过与其他参数的间接交互作用决定的, 而其他4个敏感参数均是由直接通径系数决定的。C:Nleaf、SLA、Gsmax、VPDi和Wint 5个参数对阔叶树NPP的影响为负效应(表5), 除C:Nleaf外, 其他4个敏感参数的间接效应均增强了其对阔叶树NPP的总效应, 且SLA的影响最大; C:Nlitter和SC:LC则表现为正效应, 即阔叶树NPP会随着这两个参数值的增加而增加。对阔叶树ET表现为正效应的参数有SLA、Gbl、FLNR, 其中SLA对阔叶树ET的正向影响最大, 并且这3个参数与其他参数间的交互作用均增强了它们对ET的总效应。CGP、FRC:LC、SC:LC和LWPf与阔叶树ET呈显著负相关关系, 这几个参数值的增加会使得阔叶树ET显著下降, 它们对阔叶树ET的直接效应和间接效应均为负。
Table 4
表4
表4各敏感参数对红松年净初级生产力(NPP)和蒸散(ET)影响的通径系数
Table 4
| 参数符号 Parameter symbol | NPP | 决定系数R2 Determination coefficient | 参数符号 Parameter symbol | ET | 决定系数R2 Determination coefficient | ||||
|---|---|---|---|---|---|---|---|---|---|
| 简单相关系数 Correlation coeffficient | 直接通径系数 Direct path coefficient | 间接通径系数 Indirect path coefficient | 简单相关系数Correlation coeffficient | 直接通径系数 Direct path coefficient | 间接通径系数Indirect path coefficient | ||||
| LAIall:proj | -0.459 | -0.474 | 0.015 | 0.901 | SLA | 0.210 | 0.168 | 0.041 | 0.481 |
| C:Nfr | 0.252 | 0.204 | 0.047 | FRC:LC | -0.113 | -0.117 | 0.004 | ||
| Wint | -0.513 | -0.476 | -0.038 | SC:LC | -0.051 | 0.029 | -0.080 | ||
| LFRT | 0.422 | 0.493 | -0.071 | C:Nleaf | -0.018 | -0.086 | 0.069 | ||
| FLNR | 0.117 | 0.065 | 0.052 | Gcut | 0.141 | 0.204 | -0.063 | ||
| SLA | -0.389 | -0.446 | 0.057 | Gsmax | -0.370 | -0.359 | -0.011 | ||
| C:Nleaf | 0.035 | -0.039 | 0.074 | k | 0.429 | 0.421 | 0.009 | ||
| WPM | 0.008 | -0.045 | 0.052 | ||||||
| C:Nfr | 0.308 | 0.229 | 0.078 | ||||||
| Gbl | -0.128 | -0.064 | -0.064 | ||||||
| C:Nlitter | 0.114 | 0.103 | 0.011 | ||||||
新窗口打开|下载CSV
Table 5
表5
表5各敏感参数对阔叶树年净初级生产力(NPP)和蒸散(ET)影响的通径系数
Table 5
| 参数符号 Parameter symbol | NPP | 决定系数R2 Determination coefficient | 参数符号 Parameter symbol | ET | 决定系数R2 Determination coefficient | ||||
|---|---|---|---|---|---|---|---|---|---|
| 简单相关系数 Correlation coeffficient | 直接通径系数 Direct path coefficient | 间接通径系数 Indirect path coefficient | 简单相关系数 Correlation coeffficient | 直接通径系数 Direct path coefficient | 间接通径系数 Indirect path coefficient | ||||
| C:Nleaf | -0.385 | -0.436 | 0.052 | 0.749 | CGP | -0.367 | -0.300 | -0.067 | 0.706 |
| SLA | -0.526 | -0.483 | -0.043 | SLA | 0.416 | 0.409 | 0.007 | ||
| Gsmax | -0.334 | -0.259 | -0.075 | FRC:LC | -0.288 | -0.202 | -0.086 | ||
| C:Nlitter | 0.362 | 0.306 | 0.055 | SC:LC | -0.409 | -0.321 | -0.087 | ||
| C:Nfr | -0.175 | -0.117 | -0.058 | Gbl | 0.388 | 0.329 | 0.059 | ||
| SC:LC | 0.215 | 0.195 | 0.020 | FLNR | 0.215 | 0.179 | 0.036 | ||
| Wint | -0.333 | -0.203 | -0.130 | LWPf | -0.271 | -0.257 | -0.014 | ||
新窗口打开|下载CSV
3 讨论
3.1 模型模拟结果的不确定性分析
模型模拟结果的不确定性来源于很多方面, 包括模型结构的不确定性、输入变量的不确定性以及模型参数的不确定性。模型结构的不确定性可能是因为对生态系统过程认识不足导致, 输入变量的不确定性可能是由于测量误差引起的, 而模型参数的不确定性则是由于对生态系统的观测数据不完善引起的(康满春, 2016)。本文的不确定性分析结果显示红松模拟NPP受参数不确定性的影响远高于阔叶树, 可能是因为红松实际的各参数取值范围较窄, 超出这个范围, 就会引起模拟结果的很大变化; 而此处的阔叶树则包括了所有落叶阔叶树种, 各参数的取值变化范围较大, 文中参数值在±20%范围内的波动对输出结果的影响较小。因此在分别对红松和阔叶树的生理生态参数设定时, 通过文献资料和样地实测, 尽可能地确定红松和各阔叶树种各参数值的分布范围, 从而取其平均值来进行设定。红松和阔叶树模拟ET的不确定性均很小, 说明ET受模型生理生态参数变化的影响较小, 虽然ET表现出对某几个参数变化的敏感性, 但是模型参数的不确定性不是影响红松和阔叶树ET产生变化的主要因子。此外, 参数间的交互作用也是模型模拟结果具有不确定性的重要因素。我们可以看到红松NPP的变异范围很大, 从273.6到806.2 g C·m-2·a-1, 由于Monte Carlo方法生成多组样本参数时, 各个参数是同时变化的, 在这些参数中, 虽然某一个参数的取值合理, 但是与其他参数形成的某些组合可能超出了红松生理参数的正常取值范围, 代表了一种不可持续的森林, 在模拟过程中的初始化阶段生态系统各变量无法达到平衡状态, 所以导致了模拟NPP值很低的情况。
3.2 碳通量的参数敏感性检验
本文分别对Biome-BGC在模拟红松和阔叶树碳、水通量时进行参数敏感性检验, 表明了不同植被类型的敏感参数不同。文中结果显示红松NPP对参数的敏感程度要高于阔叶树, 这可能与二者的光合特性差异较大有关(周春华等, 2008), 阔叶树的净光合速率较高, 林冠层参数的变化对潜在光合的影响没有红松明显。影响红松模拟NPP的敏感参数依次为LAIall:proj、C:Nfr、Wint、LFRT、FLNR、SLA和C:Nleaf。影响阔叶树NPP的敏感参数有C:Nleaf、SLA、Gsmax、C:Nlitter、C:Nfr、SC:LC以及Wint。早前的研究中, White等(2000)对美国地区不同植被进行模拟, 在采用局部敏感性分析方法对该模型的参数敏感性检验中指出, C:Nleaf、C:Nfr、LFRT、FRC:LC、SLA、Gsmax、LAIall:proj、FLNR以及Wint等参数是影响常绿针叶群落的敏感参数, 而落叶阔叶群落中除FRC:LC、LAIall:proj不敏感外, 其他敏感参数与常绿针叶群落相同。同样, Tatarinov和Cienciala (2006)分别对Fagus sylvatica和云杉的参数敏感性分析所得结果与之相近, 只是各自响应的最大敏感性参数不同。此外, 在印度干旱热带森林中, Kumar和Raghubanshi (2012)通过局部敏感性分析得到的影响干旱热带森林NPP的高敏感参数分别是k、SLA、SC:LC、Gsmax、C:Nfr、Wint和LAIall:proj。而Raj等(2014)运用Biome-BGC模型模拟花旗松(Pseudotsuga menziesii) NPP进行全局敏感性分析时发现高敏感参数依次为FLNR、FRC:LC、C:Nleaf、C:Nfr、LFRT和Wint。通过与已有研究对比, 本研究整体上Biome-BGC模型中影响生态系统碳通量的主要生理生态参数与其他研究是基本一致的, 说明了本研究结果的合理性与可靠性。
通过已有研究的综合分析, 我们发现无论采用定性的局部敏感性分析方法, 还是定量的全局敏感性分析方法, C:Nleaf、C:Nfr、SLA和Wint这4个参数在不同区域、不同物种、不同植被类型间对模拟结果均表现出高敏感参性。李一哲等(2018)的研究也体现了这一点, 并且这几个参数主要是通过直接效应影响模拟结果, 与其他参数间的交互作用较弱。由此说明这些具有共性的参数所表现出的高敏感性与研究地区和植被类型的关系较小, 主要是由于模型本身的结构所决定的。
那么这几个参数是如何影响模型模拟结果的呢? 具体来讲, 首先, 在Biome-BGC模型的光合作用模块中, C:Nleaf、FLNR和SLA这3个参数决定了最大羧化速率的大小, 而1,5-二磷酸羧核酮糖羧化/加氧酶(Rubisco酶)直接影响到植被固定大气CO2的第一步(羧化作用), 羧化速率为状态变量, 其本身具有较高的空间异质性且难以获取(Houborg et al., 2012), 由此也解释了FLNR对模拟NPP的影响很大。若羧化/加氧酶中的氮含量增加, 则会促进Rubisco酶活性, 进而增强光合作用, 对模拟NPP呈正效应。其次, C:Nleaf的增加会使得用于投资1,5-二磷酸羧化/ 加氧酶的氮量减少, 从而会限制光合作用, 降低NPP (White et al., 2000)。SLA升高, 叶面积指数相应增加, 但是光合能力并没有变化, 这样就会产生由于耗水量增加而导致的水分胁迫, 从而降低NPP。C:Nfr对NPP敏感性是由于它会影响根和茎的氮分配, 从而影响到根部呼吸通量(Raj et al., 2014); 因为细根与植物的呼吸速率有密切关系, 若C:Nfr增加, 则根部分配的氮量减少, 这样呼吸消耗量下降, 在光合能力不变的情况下, 使得NPP增加。而Wint决定了冠层的降水截留量, 控制着降水入渗到土壤的水量, 它的增加表示冠层更加预闭, 冠层截留量增加, 林内穿透雨减少, 会在一定程度上减少土壤水来源, 对地上植被造成水分胁迫, 从而降低NPP。
除了上述相同的敏感参数, 其他对植被NPP表现出敏感性的参数会随着研究对象和研究地区而变化。如本文中红松和阔叶树NPP对FRC:LC不敏感, 而在其他研究中FRC:LC则为敏感参数(Tatarinov & Cienciala, 2006; Raj et al., 2014), 一方面这可能是由物种生物学特性不同所决定的, 另一方面, 不同气候条件和生长环境下, 即使是同一物种或植被类型的敏感参数也会不同。再者, Gsmax也是一个重要参数, 因为气孔导度是连接植物与大气的纽带, Gsmax的增加对NPP的负效应也体现为水分胁迫, 高的气孔导度使得叶片吸收的潜在CO2浓度增加, 促进了光合作用, 但同时也加快了生长季初期土壤水分的消耗, 进而导致生长季后期气孔导度下调以避免更多的水分散失, 减小了光合作用。
3.3 水通量的参数敏感性检验
关于对水通量的参数敏感性检验的相关研究较少, 本文中影响红松和阔叶树ET的敏感参数有很大不同, 且它们对模拟ET的作用方式也不同。这可能与红松和阔叶树的生长习性不同有关。影响红松ET的敏感参数有多个, 但除SLA、FRC:LC和Gcut 3个参数外, 其余敏感参数的总敏感性指数远大于一阶敏感性指数, 这类参数是通过与其他参数的二阶或多阶交互作用来间接影响模拟结果, 若采取一次变化一个参数而保持其他参数不变的局部敏感性分析就无法得到准确的结果(张质明等, 2014)。所以在设定红松生理生态参数时要综合考虑参数间的相互作用, 只改变其中一个或几个参数可能会使得模拟蒸散的结果更加不准确。而阔叶树ET的敏感参数较红松的少, 且多以直接效应为主, 单个参数的变化就会引起ET的变化。康满春(2016)对Biome-BGC模型在模拟杨树人工林碳水通量时的参数敏感性分析表明, 无参数对蒸腾结果有显著影响, 而土壤蒸发则受到Wint、SC:LC、SLA和LFG 4个参数的影响, 表现出高敏感性。在本文中红松和阔叶树ET也表现出对SC:LC和SLA的高敏感性, 说明这两个参数可能是通过控制森林土壤蒸发来影响蒸散量的。森林蒸散包括植被蒸腾、冠层截留降雨的蒸发和土壤水分蒸发, 在模型中都是采用彭曼方程进行计算, 根据方程表达式, 蒸腾或蒸发速率受到气温、大气压、饱和蒸气压差(VPD)、入射辐射通量密度、水汽传输阻力和显热通量阻力等因子的共同影响, 其中入射辐射通量密度是通过SLAshd:sun、k、SLA以及叶片碳含量来计算得到的, 而对于叶片蒸发和土壤蒸发, 水汽传输阻力和显热通量阻力即为叶片边界层阻力; 对于蒸腾作用, 水汽传输阻力是由边界层导度、表皮导度和气孔导度构成的函数, 而显热通量阻力则是边界层阻力。在本文中, FRC:LC、SC:LC值的变化都会影响到叶片碳含量的计算, 进而会影响入射辐射通量密度, 但是红松ET对这二者表现出的敏感性是通过其他参数的间接交互作用体现的, 阔叶树ET则受这二者的直接影响较大。
4 结论
本文采用全局敏感性分析方法(EFAST)分析了Biome-BGC模型模拟阔叶红松林碳水通量时对生理生态参数的敏感性。得到的主要结论有:(1)模拟NPP的不确定性高于模拟ET, 且红松模拟结果的不确定性要高于阔叶树。阔叶树NPP和ET对生理生态参数的敏感性总体上都小于红松。
(2) C:Nleaf、C:Nfr、SLA和Wint是影响红松和阔叶树共同的敏感参数, 对模拟结果的影响与植被类型和研究地区的关系较小, 主要是由模型自身结构所决定的。所以在运用Biome-BGC模型模拟NPP时, 无论研究对象是什么, 这几个高敏感参数都是首先要根据实际情况进行参数本地化, 使得模拟结果更准确。
(3)影响红松和阔叶树模拟ET的敏感参数有很大不同。影响红松模拟ET的敏感参数的总敏感性指数远大于一阶敏感性指数, 主要受参数间的交互作用敏感性的影响, 而影响阔叶树模拟ET的敏感参数则主要是以直接效应为主。

参考文献 原文顺序
文献年度倒序
文中引用次数倒序
被引期刊影响因子
DOI:10.1016/0021-9991(78)90097-9URL [本文引用: 1]

Large sets of coupled, nonlinear equations arise in a number of disciplines in connection with computer-based models of physical, social, and economic processes. Solutions for such large systems of equations must be effected by means of digital computers using appropriately designed codes. This paper addresses itself to the critically important problem of how sensitive the solutions are to variations of, or inherent uncertainties in, the parameters of the equation set. We review here, and also present further developments of, our statistical method of sensitivity analysis. The sensitivity analysis presented here is nonlinear and thus permits one to study the effects of large deviations from the nominal parameter values. In addition, since all parameters are varied simultaneously, one can explore regions of parameter space where several parameters deviate simultaneously from their nominal values. We develop here the theory of our method of sensitivity analysis, then detail the method of implementation, and finally present examples of its use.
DOI:10.13287/j.1001-9332.201602.023URL [本文引用: 2]
基于植被生理生态过程的模型包含较多参数,合理的参数取值能够极大地提高模型的模拟能力.参数敏感性分析可以全面分析模型参数对模拟结果的影响程度,在筛选模型敏感参数过程中起到重要作用.本研究以模拟吉林省汪清林业局长白落叶松林净初级生产力(NPP)为例,分析了BIOME-BGC模型的参数敏感性.首先利用样地实测NPP数据与模拟值进行对比分析,检验模型对长白落叶松林NPP的模拟能力;然后利用Morris法和EFAST法筛选出BIOME-BGC模型中对长白落叶松林NPP影响较大的敏感参数.在此基础上,通过EFAST法对所有筛选出的参数进行定量的敏感性分析,计算了敏感参数的全局敏感性指数、一阶敏感性指数和二阶敏感性指数.结果表明:BIOME-BGC模型能够较好地模拟研究区内长白落叶松林NPP的变化趋势;Morris法可以在样本量较少的情况下实现对BIOME-BGC模型敏感参数的筛选,而EFAST法可以定量分析BIOME-BGC模型中单个参数以及不同参数之间交互作用对模拟结果的影响程度;BIOME-BGC模型中对长白落叶松林NPP影响较大的敏感参数为新生茎与叶片的碳分配比和叶片碳氮比,且二者之间的交互作用明显大于其他参数之间的交互作用.
[本文引用: 1]
[本文引用: 3]
[本文引用: 3]
[本文引用: 3]
[本文引用: 3]
DOI:10.1016/j.scitotenv.2005.11.014URL [本文引用: 1]
DOI:10.5194/isprsarchives-XXXVIII-8-W20-129-2011URL [本文引用: 2]
A process-based model BIOME-BGC was run for sensitivity analysis to see the effect of ecophysiological parameters on net primary production (NPP) of dry tropical forest of India. The sensitivity test reveals that the forest NPP was highly sensitive to the following ecophysiological parameters: Canopy light extinction coefficient (k), Canopy average specific leaf area (SLA), New stem C : New leaf C (SC:LC), Maximum stomatal conductance (g), C:N of fine roots (C:N), All-sided to projected leaf area ratio and Canopy water interception coefficient (W). Therefore, these parameters need more precision and attention during estimation and observation in the field studies.
URL [本文引用: 1]
正 在我国吉林省长白山地区,红松(Pinus koraiensis)常与阔叶树种混生在一起,形成地带性顶极群落。在红松阔叶林的采伐迹地或火烧迹地上通常形成大片的次生杨桦林。研究红松阔叶林及其 次生杨桦林的生物生产力,能为研究森林生态系统物质与能量的运转和养分循环提供基础资料;也能为开展"全树综合利用"提供科学依据;并有助于了解红松阔叶 林的演替规律,为合理地保护、管理和利用天然红松林、营造高产、稳产的人工红松林提供理论依据。本文中的生物生产力是指生物量和净第一性生产量(简称生产 量)。文内没有涉及凋落量和啃食量的测定,生产量测定的结果应略低于实际值。
URL [本文引用: 1]
正 在我国吉林省长白山地区,红松(Pinus koraiensis)常与阔叶树种混生在一起,形成地带性顶极群落。在红松阔叶林的采伐迹地或火烧迹地上通常形成大片的次生杨桦林。研究红松阔叶林及其 次生杨桦林的生物生产力,能为研究森林生态系统物质与能量的运转和养分循环提供基础资料;也能为开展"全树综合利用"提供科学依据;并有助于了解红松阔叶 林的演替规律,为合理地保护、管理和利用天然红松林、营造高产、稳产的人工红松林提供理论依据。本文中的生物生产力是指生物量和净第一性生产量(简称生产 量)。文内没有涉及凋落量和啃食量的测定,生产量测定的结果应略低于实际值。
URL [本文引用: 1]
采用分解袋法,研究了长白山次生针阔混交林内9种树种叶凋落物34个月的分解过程.结果表明:在次生针阔混交林中,不同树种叶凋落物的初始N和P浓度存在很大差异,叶凋落物分解速率(k)与初始N浓度和C/N显著相关.有机物剩余百分率与C剩余百分率呈显著的线性正相关关系,与N和P剩余百分率之间呈显著的二项式回归关系.N和P剩余百分率在初期阶段随有机物分解而增加,达到峰值后逐渐降低.随着有机物剩余百分率的下降,C/N和C/P均呈逐渐降低趋势,各种叶凋落物之间C/N和C/P的差异逐渐减小,分解末期分别趋近于23和350.随有机物剩余百分率的降低,N/P变化不明显,当有机物剩余百分率低于25%时,不同树种叶凋落物之间N/P差异显著下降.有机物剩余百分率可用来预测C、N和P的剩余百分率.
[本文引用: 1]
[本文引用: 1]
DOI:10.13292/j.1000-4890.201711.037URL [本文引用: 1]
凋落物分解过程中的养分释放对土壤质量、养分平衡和生产力的可持续维持发挥着重要作用。2015年5月,以辽东山区日本落叶松(Larix kaempferi)-红松(Pinus koraiensis)和日本落叶松-赤杨(Alnus japonica)人工混交林为研究对象,采用凋落物网袋法将落叶松分别与红松、赤杨叶片凋落物以75∶25、50∶50和25∶75比例混合,研究不同类型、不同比例的混合凋落物对其分解速率以及养分动态变化的影响。结果表明:在单一植物凋落物的分解过程中,赤杨叶片质量损失最高,分解最快;而红松叶片质量损失最低,分解最慢。凋落物混合分解对氮素释放的影响中,3种比例的落叶松与赤杨叶片的混合凋落物均表现出抑制作用,而落叶松与红松叶片混合凋落物(以25∶75比例混合)表现出促进作用。因此,落叶松在与红松、赤杨混合分解时产生了"非加和效应",并且其分解过程中氮和磷的养分释放状况受混合比例影响。
URL [本文引用: 1]
生态过程模型是当前研究陆地生态系统水循环、碳循环有力的工具,但此类模型参数众多,参数的合理取值对模型模拟结果有重要影响.以往研究对模型参数的敏感性以及参数的优化取值有诸多的分析和讨论,但有关参数最优取值的时空异质性关注较少.本文以BIOME-BGC模型为例,在常绿阔叶林、落叶阔叶林、C3草地3种植被类型下,通过构建敏感性判别指数,筛选出模型的敏感参数,并在每种植被类型下选取两个试验站点,使用模拟退火算法结合实测通量数据构建目标函数,获取各站点敏感参数逐月的最优取值,然后构建时间异质性判别指数、空间异质性判别指数和时空异质性判别指数对模型敏感参数最优取值的时空异质性进行定量分析.结果表明:BIOME-BGC模型在3种植被类型下遴选出的敏感参数大部分一致,少数有差异,但参数的敏感性强弱在不同植被类型下的表现不尽相同;BIOME-BGC模型敏感参数的最优取值,大都具有不同程度的时空异质性,但不同植被类型下,敏感参数最优取值的时空异质性表现各异;敏感参数中与植被生理、生态相关的参数,其时空异质性相对较小,而与环境、物候相关的参数,其时空异质性普遍较大;在3种植被类型下,模型敏感参数最优取值的时间异质性与空间异质性表现出显著的线性相关性;依据其最优取值的时空异质性,可对BIOME-BGC模型敏感参数进行类型划分,以便在实践应用中采取不同的参数率定策略.本研究结论有助于加深对生态过程模型参数特性及最优取值的理解,可为实践应用中模型参数的合理取值提供一种思路和参考.
DOI:10.1093/jpe/rtx008URL [本文引用: 1]
DOI:10.3724/SP.J.1258.2014.00079URL [本文引用: 1]
利用光学仪器法能够快速、高效地测定森林生态系统的叶面积指数(leaf area index,LAI)。然而,评估该方法测定针阔混交林LAI季节动态准确性的研究较少。该研究基于凋落物法测定了小兴安岭地区阔叶红松(Pinus koraiensis)林LAI的季节动态,其结果可代表真实的LAI。参考真实的LAI,对半球摄影法(digital hemispherical photography,DHP)和LAI-2000植物冠层分析仪测定的有效叶面积指数(effective LAI,Le)进行了评估。首先对DHP测定LAI过程中采用的不合理曝光模式(自动曝光)进行了系统校正。同时,测定了光学仪器法估测LAI的主要影响因素(包括木质比例(woody-to-total area ratio,α)、集聚指数(clumping index,E)和针簇比(needle-to-shoot area ratio,γE))的季节变化。结果表明:3种不同方法测定的LAI均表现为单峰型的季节变化,8月初达到峰值。从5月至11月,DHP测定的Le比真实的LAI低估50%–59%,平均低估55%;而LAI-2000植物冠层分析仪测定的Le比真实的LAI低估19%–35%,平均低估27%。DHP测定的Le经过自动曝光,α、E和γE校正后,精度明显提高,但仍比真实的LAI低估6%–15%,平均低估9%;相对而言,LAI-2000植物冠层分析仪测定的Le经过α、E和γE校正后,精度明显提高,各时期与真实的LAI的差异均小于9%。研究结果表明,考虑木质部和集聚效应对光学仪器法的影响后,DHP和LAI-2000植物冠层分析仪均能相对准确地测定针阔混交林LAI的季节动态,其中,DHP的测定精度高于85%,而LAI-2000植物冠层分析仪的测定精度高于91%。
DOI:10.1016/0304-3800(81)90057-0URL [本文引用: 1]
A procedure of extended sensitivity analysis for simulation models is developed which is applicable to the situation in which input uncertainties are specified in a multiplicative (rather than an additive) way. This type of specification usually occurs when error estimates are large relative to the parameter values. The input parameter errors are assumed to have log-normal distributions and the basis for this assumption is explained along with the advantages it provides. The new procedure, multiplicative sensitivity analysis, is developed for the purposes of internal model validation and identification of priorities for specific experimental and theoretical studies needed for a particular system being modelled. The applicability of the procedure in the very early stages of a research program is its main advantage and further expands the r么le of simulation models.
DOI:10.13332/j.1000-1522.20150139URL [本文引用: 1]
为探索氮添加对原始阔叶红松林凋落叶分解及养分动态的影响,以红松、枫桦、水曲柳及3个树种混合凋落叶为研究对象,采用凋落物袋法,进行了2年的分解试验。施N水平分别为N0(0 kg/(hm~2·a))、N1(30 kg/(hm~2·a))、N2(60 kg/(hm~2·a))和N3(120 kg/(hm~2·a))。结果表明:施N对混合凋落叶分解影响显著(P0.05)。凋落叶质量残留率与其基质N含量呈显著负相关,与碳含量及C/N比均为显著正相关。施N促进凋落叶N含量升高,凋落叶P含量受时间和N处理交互作用影响显著。施N促进水曲柳凋落叶N、P释放,抑制红松、枫桦和混合凋落叶N、P释放。N3处理抑制红松凋落叶C释放,促进水曲柳凋落叶C释放,N1处理促进水曲柳与混合凋落叶C释放。说明N处理能够调节养分释放模式,并对森林生态系统C及养分循环有显著调控作用。
[本文引用: 1]
[本文引用: 1]
DOI:10.1016/j.envsoft.2011.03.004URL [本文引用: 2]
A major challenge in modeling the carbon dynamics of vegetation communities is the proper parameterization and calibration of eco-physiological variables that are critical determinants of the ecosystem process-based model behavior. In this study, we improved and calibrated a biochemical process-based WxBGC model by using in situ AmeriFlux eddy covariance tower observations. We simulated carbon dynamics of fire-dominated forests at tower sites and upscaled the tower site-based simulations to regional scale for the New Jersey Pinelands using LANDSAT-ETM land cover and DAYMET climate data. The Extended Fourier Amplitude Sensitivity Test approach was used to assess the higher-order sensitivity of model to critical eco-physiological parameters. The model predictions of CO net ecosystem exchange (NEE) and gross ecosystem production (GEP) were in agreement with the eddy covariance measurements at the three tower sites in 2005. However, the model showed poor fit in 2006, grossly overestimating NEE and the ratio of ecosystem respiration to GEP because the model did not reflect the carbon loss caused by severe defoliation related to an outbreak of gypsy moths in that year. The model simulations indicated that wildfire reduced annual NEE in pine/scrub oak forest, while prescribed burning in oak/pine and pine/oak stands led to temporary increase in NEE for a period 1 2 years post burning. The uncertainty and sensitivity of the model carbon simulations were mainly attributable to the 2nd- and higher-order interactions between carbon allocation parameters, specific leaf area and fire mortality intensity.
DOI:10.2134/jeq2004.2217URLPMID:15537945 [本文引用: 1]
Abstract Model predictions are often seriously affected by uncertainties arising from many sources. Ignoring the uncertainty associated with model predictions may result in misleading interpretations when the model is used by a decision-maker for risk assessment. In this paper, an analysis of uncertainty was performed to estimate the uncertainty of model predictions and to screen out crucial variables using a Monte Carlo stochastic approach and a number of statistical methods, including ANOVA and stepwise multiple regression. The model studied was RICEWQ (Version 1.6.1), which was used to forecast pesticide fate in paddy fields. The results demonstrated that the paddy runoff concentration predicted by RICEWQ was in agreement with field measurements and the model can be applied to simulate pesticide fate at field scale. Model uncertainty was acceptable, runoff predictions conformed to a log-normal distribution with a short right tail, and predictions were reliable at field scale due to the narrow spread of uncertainty distribution. The main contribution of input variables to model uncertainty resulted from spatial (sediment-water partition coefficient and mixing depth to allow direct partitioning to bed) and management (time and rate of application) parameters, and weather conditions. Therefore, these crucial parameters should be carefully parameterized or precisely determined in each site-specific paddy field before the application of the model, since small errors of these parameters may induce large uncertainty of model outputs.
DOI:10.1007/s11769-015-0772-zURL [本文引用: 1]
The overall goal of this study was to understand carbon(C) stock dynamics in four different-aged Japanese larch(Larix kaempferi) plantations in Northeast China that were established after clear-cutting old-growth Korean pine deciduous forests. Four Japanese larch plantations which were at 10, 15, 21, and 35 years old and an old-growth Korean pine deciduous forest which was 300 years old in Northeast China were selected and sampled. We compared the C pools of biomass(tree, shrub and herb), litterfall(LF), and soil organic carbon(SOC) among them. The biomass C stock of larch plantation at 10, 15, 21, and 35 years old was 26.8, 37.9, 63.6, and 83.2 Mg/ha, respectively, while the biomass C stock of the old-growth Korean pine deciduous forest was 175.1 Mg/ha. The SOC stock of these larch plantations was 172.1, 169.7, 140.3, and 136.2 Mg/ha respectively, and SOC stock of 170.4 Mg/ha in the control of old-growth forest. The biomass C stock increased with stand age of larch plantations, whereas SOC stock decreased with age, and C stock of LF did not change significantly(P 0.05). The increase of biomass C offset the decline of SOC stock with age, making total carbon stock(TCS) of larch plantations stable from stand ages of 10 35 years. The TCS in larch plantations was much smaller than that in the old-growth forest, suggesting that the conversion of old-growth forests to young larch plantations releases substantial C into the atmosphere.
DOI:10.1016/j.ecolmodel.2014.08.012URL [本文引用: 4]
Parameterization and calibration of a process-based simulator (PBS) is a major challenge when simulating gross and net primary production (GPP and NPP). The large number of parameters makes the calibration computationally expensive and is complicated by the dependence of several parameters on other parameters. Calibration can be simplified by first identifying those parameters for which GPP and NPP are most sensitive. For an appropriate application of a PBS, a sensitivity analysis is an essential step. Sensitivity analysis based on local derivatives (i.e., one-at-a-time analysis) does not examine the PBS behaviour over the whole parameter space. This study therefore implements a variance-based sensitivity analysis (VBSA) addressing the full range of PBS input. A VBSA is also independent of non-linearity in a PBS. This paper performs a VBSA of the process-based simulator BIOME-BGC for GPP and NPP output in a Douglas-fir stand at the Speulderbos forest site, The Netherlands. The results show that GPP and NPP are highly sensitive to the following parameters: fraction of leaf nitrogen in Rubisco, the ratio of fine root carbon to leaf carbon, the ratio of carbon to nitrogen in leaf and fine root, the leaf and fine root turnover, the water interception coefficient and soil depth. GPP and NPP are particularly sensitive to the ratio of fine root carbon to leaf carbon that is responsible for leaf area index development. The study concludes that a VBSA analysis provides a reliable and useful approach for a sensitivity analysis of process-based simulators with a complicated structure in the parameters.
URL [本文引用: 1]
Sensitivity analysis is an efficient approach to diagnose model structure and identify the dominant parameters controlling model behavior. It is also a key step in modeling practice. The global sensitivity of parameters of the Xinanjing model is analyzed using Extend FAST method in the Liuxihe reservoir catchment. Results show that the sensitivity of four object functions perform is different. The sensitivity can be influenced by many factors, such as the initial condition and flood type. The results are compared with the scatter map generated by the GLUE uncertainty method. Both methods can get comparable sensitivity analysis results. The main effect sensitivity and interaction effect sensitivity calculated by Extend FAST also supply quantitative indices to help understand the uncertainty in hydrological model.
DOI:10.1016/0304-3800(88)90112-3URL [本文引用: 1]
DOI:10.1111/0272-4332.00040URLPMID:12088235 [本文引用: 1]
We review briefly some examples that would support an extended role for quantitative sensitivity analysis in the context of model-based analysis (Section 1). We then review what features a quantitative sensitivity analysis needs to have to play such a role (Section 2). The methods that meet these requirements are described in Section 3; an example is provided in Section 4. Some pointers to further research are set out in Section 5.
DOI:10.3321/j.issn:1000-0933.1998.01.006URL [本文引用: 1]
用林窗模型研究了小兴安岭南坡红松针阔混交林长期动态变化过程。通过有效性检验证明所得模型 能够合理地预测森林的组成、结构和动态。以经营数据估计模型的参数后,运行模型模拟12个树种600a的演替动态,结果表明次生裸地的森林在几个世纪后能 恢复到以红松为主的针叶树占优势群落,演替呈现为树种组成差别很大的3个阶段:第1个阶段为0到70a,这时阳性先锋树种在群落中占据优势,无论树种组 成、生物量,生产力,阳性树种
DOI:10.3321/j.issn:1000-0933.1998.01.006URL [本文引用: 1]
用林窗模型研究了小兴安岭南坡红松针阔混交林长期动态变化过程。通过有效性检验证明所得模型 能够合理地预测森林的组成、结构和动态。以经营数据估计模型的参数后,运行模型模拟12个树种600a的演替动态,结果表明次生裸地的森林在几个世纪后能 恢复到以红松为主的针叶树占优势群落,演替呈现为树种组成差别很大的3个阶段:第1个阶段为0到70a,这时阳性先锋树种在群落中占据优势,无论树种组 成、生物量,生产力,阳性树种
DOI:10.1007/s10113-006-0017-xURL [本文引用: 1]
http://link.springer.com/article/10.1007%2Fs10113-006-0017-x
[本文引用: 1]
DOI:10.1038/srep09115URLPMID:25766381 [本文引用: 3]
We combine the process-based ecosystem model (Biome-BGC) with climate change-scenarios based on both RegCM3 model outputs and historic observed trends to quantify differential effects of symmetric and asymmetric warming on ecosystem net primary productivity (NPP), heterotrophic respiration (Rh) and net ecosystem productivity (NEP) of six ecosystem types representing different climatic zones of northern China. Analysis of covariance shows that NPP is significant greater at most ecosystems under the various environmental change scenarios once temperature asymmetries are taken into consideration. However, these differences do not lead to significant differences in NEP, which indicates that asymmetry in climate change does not result in significant alterations of the overall carbon balance in the dominating forest or grassland ecosystems. Overall, NPP, Rh and NEP are regulated by highly interrelated effects of increases in temperature and atmospheric CO2 concentrations and precipitation changes, while the magnitude of these effects strongly varies across the six sites. Further studies underpinned by suitable experiments are nonetheless required to further improve the performance of ecosystem models and confirm the validity of these model predictions. This is crucial for a sound understanding of the mechanisms controlling the variability in asymmetric warming effects on ecosystem structure and functioning.
[本文引用: 1]
[本文引用: 1]
DOI:10.1016/j.foreco.2006.09.085URL [本文引用: 4]
DOI:10.1016/S0168-1923(02)00108-9URL [本文引用: 1]
The effects of disturbance history, climate, and changes in atmospheric carbon dioxide (CO 2) concentration and nitrogen deposition (N dep) on carbon and water fluxes in seven North American evergreen forests are assessed using a coupled water arbon itrogen model, canopy-scale flux observations, and descriptions of the vegetation type, management practices, and disturbance histories at each site. The effects of interannual climate variability, disturbance history, and vegetation ecophysiology on carbon and water fluxes and storage are integrated by the ecosystem process model Biome-BGC, with results compared to site biometric analyses and eddy covariance observations aggregated by month and year. Model results suggest that variation between sites in net ecosystem carbon exchange (NEE) is largely a function of disturbance history, with important secondary effects from site climate, vegetation ecophysiology, and changing atmospheric CO 2 and N dep. The timing and magnitude of fluxes following disturbance depend on disturbance type and intensity, and on post-harvest management treatments such as burning, fertilization and replanting. The modeled effects of increasing atmospheric CO 2 on NEE are generally limited by N availability, but are greatly increased following disturbance due to increased N mineralization and reduced plant N demand. Modeled rates of carbon sequestration over the past 200 years are driven by the rate of change in CO 2 concentration for old sites experiencing low rates of N dep. The model produced good estimates of between-site variation in leaf area index, with mixed performance for between- and within-site variation in evapotranspiration. There is a model bias toward smaller annual carbon sinks at five sites, with a seasonal model bias toward smaller warm-season sink strength at all sites. Various lines of reasoning are explored to help to explain these differences.
DOI:10.1016/j.foreco.2009.10.009URL [本文引用: 1]
The effects of global change on ecosystem productivity and water resources in the southern United States (SUS), a traditionally ‘water-rich’ region and the ‘timber basket’ of the country, are not well quantified. We carried out several simulation experiments to quantify ecosystem net primary productivity (NPP), evapotranspiration (ET) and water use efficiency (WUE) (i.e., NPP/ET) in the SUS by employing an integrated process-based ecosystem model (Dynamic Land Ecosystem Model, DLEM). The results indicated that the average ET in the SUS was 710 mm during 1895–2007. As a whole, the annual ET increased and decreased slightly during the first and second half of the study period, respectively. The mean regional total NPP was 1.18 Pg C/yr (525.2 g C/m 2/yr) during 1895–2007. NPP increased consistently from 1895 to 2007 with a rate of 2.5 Tg C/yr or 1.10 g C/m 2/yr, representing a 27% increase. The average WUE was about 0.71 g C/kg H 2O and increased about 25% from 1895 to 2007. The rather stable ET might explain the resulting increase in WUE. The average WUE of different biomes followed an order of: forest (0.93 g C/kg H 2O) > wetland (0.75 g C/kg H 2O) > grassland (0.58 g C/kg H 2O) > cropland (0.54 g C/kg H 2O) > shrubland (0.45 g C/kg H 2O). WUE of cropland increased the fastest (by 30%), followed by shrubland (17%) and grassland (9%), while WUE of forest and wetland changed little from the period of 1895–1950 to the period of 1951–2007. NPP, ET and WUE showed substantial inter-annual and spatial variability, which was induced by the non-uniform distribution patterns and change rates of environmental factors across the SUS. We concluded that an accurate projection of the regional impact of climate change on carbon and water resources must consider the spatial variability of ecosystem water use efficiency across biomes as well as the interactions among all stresses, especially land-use and land-cover change and climate.
URL [本文引用: 1]
基于长白山露水河林区2003年和2013年两次森林资源规划设计调查中固定样地资料,利用相对生长法,对长白山露水河林区各林分类型的乔木层生物量和生产力进行了研究,结果表明:长白山露水河林区各林分类型乔木层生物量平均为175.07t/hm^2,其中天然林平均乔木层生物量要高于人工林。天然林中针叶树种和慢阔类树种积累生物量的能力较强,而人工林中以人工红松林的乔木层生物量最高。半数以上林分类型随着林龄的增长,乔木层生物量逐步升高;其他林分类型变化趋势不一。长白山露水河林区各林分类型的乔木层生产力平均5.00t/(hm^2·a),总体看来,人工林的生产力比天然林高。人工林中乔木层生产力最高的是人工红松林,这与人为抚育有关,而天然林中以针叶混交林乔木层生产力最高。
DOI:10.1175/1087-3562(2000)0042.3.CO;2URL [本文引用: 12]
For the purpose of climate signal detection, we introduce a method for identifying significant episodes of large-scale oscillatory variability. The method is based on a multivariate wavelet algorithm that identifies coherent patterns of variation simultaneously within particular ranges of time and periodicity (or frequency) that may vary regionally in the timing and amplitude of the particular temperature oscillation. By using this methodology, an analysis is performed of the instrumental record of global temperatures spanning the past 140 years. The duration of an “episode” is chosen to correspond to 3–5 cycles at a specified oscillation period, which is useful for detecting signals associated with the global El Ni09o/Southern Oscillation (ENSO) phenomenon. To confirm the robustness of signals detected in the earliest, sparse data (only 111 5° longitude by 5° latitude grid points are available back to 1854), we performed multiple analyses overlapping in time, using increasingly dense subsets of the full (1570 grid point) temperature data. In every case, significant interannual episodes are centered in the 3–7 year period range corresponding to the conventional band of ENSO-related variance and describe intervals of quasi-oscillatory variability of decadal-scale duration. These episodes consist of a sequence of one or two warm and cold events with sea surface temperature fluctuations in the eastern tropical Pacific of amplitude ±0.6°–1.1°C. Each episode includes one or more historically prominent El Ni09o events. The signals are characterized as significant, however, by virtue of their global-scale pattern of temperature variations as well as their oscillatory pattern in time. The 1920–1940 interval of increasing global temperatures was bracketed by oscillatory episodes with unusual global patterns of expression relative to the recent ENSO episodes of the 1970s and 1980s. The episodes that preceded the 1920–1940 and 1975–present intervals of rapid warming were associated with globally averaged temperature fluctuations of > 0.4°C, the largest among those identified. In contrast, the episode that concludes the 1920–1940 temperature rise exhibits a global-mean fluctuation = 0.05°C, smallest among the observed episodes. These observations motivate speculation about the possible relationship between ENSO variability and global warming, in particular, the relationship between ENSO and the transient storage of heat in the tropical upper ocean layer, and the relationship between secular climate change and the amplitude of interannual ENSO events.
DOI:10.1093/jpe/rtw076URL [本文引用: 3]
Abstract Aims Process-based models are basic tools for predicting the response of forest carbon to future climate change. The models have commonly been tested for their predictions of spatial variation in forest productivity, but much less for their ability to predict temporal variation. Here we explored methods to test the models with tree-rings, using BIOME-BGC as an example. Methods We used net primary productivity (NPP) data and tree rings collected from five major forest types along the altitudinal gradient of Mt. Changbai, northeast China, to test local-parameterized BIOME-BGC model. We first test the model predictions of both spatial (Test 1) and temporal changes (Test 2) in productivity. Then we test if the model can detect the climatic factors limiting forest productivity during historical climate change, as revealed by dendroclimatic analyses (Test 3). Important Findings Our results showed that BIOME-BGC could well simulate NPP of five forest types on Mt. Changbai, with an r2 of 0.69 between modeled and observed NPP for 17 plots along the altitudinal gradient (Test 1). Meanwhile, modeled NPP and ring-width indices were correlated and showed similar temporal trends for each forest type (Test 2). While these tests suggest that the model predictions on spatial and temporal variation of NPP were acceptable, a further test that relate the correlations of modeled NPP with climate variables to the correlations of ring widths with climate (Test 3) showed that the model did not well identify the climatic factors limiting historical productivity dynamics for some forest types, and thus cannot reliably predict their future. Both dendrochronology and BIOME-BGC showed that forest types differed markedly in the climate factors limiting productivity because of differences in tree species and climate condition, and thus differed in responses to climate change. Our results showed that a successful prediction of spatial NPP patterns cannot assure that BIOME-BGC can well simulate historical NPP dynamics. Further, a correlation between modeled NPP and tree-ring series cannot assure that the limiting climatic factors for productivity have been correctly identified by the model. Our results suggest the necessity to test the temporal predictions of process-based models in a more robust way, and further integration of dendrochronology and biogeochemistry modeling may be helpful for this purpose.
DOI:10.3864/j.issn.0578-1752.2017.01.006URL [本文引用: 1]
[目的]敏感性分析是作物模型本地化过程中的重要环节,对作物模型的校正与应用有重要的意义.[方法]本研究以国家精准农业示范研究基地2012—2013、2013—2014和2014—2015年冬小麦试验为研究对象,采用全局敏感性分析方法扩展傅里叶幅度检验法(Extended Fourier Amplitude Sensitivity Test,EFAST)对AquaCrop模型42个作物参数进行敏感性分析,以评估模型在北京地区的敏感参数.[结果](1)对干生物量敏感作物参数是:水分和温度胁迫参数(生物量生产的最小生长度(stbio),引起冠层早衰的土壤水分消耗上限(psen))、生物量和产量参数(归一化水分生产力(wp))、蒸散参数(作物冠层形成后到衰老之前的作物系数(kcb))、作物冠层和物候发展参数(冠层生长系数(cgc),从播种到出苗时长(eme),最大冠层覆盖度(mcc),冠层衰老系数(cdc),从播种到成熟的时长(mat),产量形成过程中收获指数的建立长度(hilen)).其中stbio,kcb,wp和cgc 4个作物参数敏感性指数最大;(2)对冠层覆盖度最敏感的参数是:作物冠层和物候发展参数(cgc,mcc,每公顷株数(den),出苗率达到90%时的土壤覆盖度(ccs),mat和cdc)、根区发展参数(最大有效根深(rtx))、水分和温度胁迫参数(psen)、蒸散参数(kcb);(3)对产量最敏感的参数是作物冠层和物候发展参数(从播种到开花时长(flo),mat,cdc,hilen和从播种到开始衰老时长(sen))、水分和温度胁迫参数(psen)、生物量和产量参数(参考收获指数(hi)和wp)、蒸散参数(kcb).[结论]利用EFAST方法对AquaCrop模型中的作物参数进行一阶和全局敏感分析,最大干物量的敏感性分析结果以及干生物量随时间变化的敏感性分析结果显示,敏感性参数的选择上差异不大,但排序上存在较大的差异,最大干生物量的敏感性分析不能分析作物参数对干生物量在整个生育期的影响,结果不全面;冠层覆盖度随时间变化的一阶和全局敏感性分析结果显示,在敏感参数的选择和排序上均有较好的一致性,全局敏感性分析中作物参数的敏感性指数更高,对冠层覆盖度的影响表现得更明显.本研究结果用于AquaCrop模型本地化,可提高该模型在北京地区的模拟效率和模拟精度.
URL [本文引用: 3]
Sensitivity analysis is used to qualitatively or quantitatively apportion the variation of model output to different source of variation.It is a very useful tool in model parameterization and calibration,and has important ecological significance by identifying the governing factors for a certain ecological process simulated.There are two schools of sensitivity analysis, local sensitivity analysis and global sensitivity analysis.The former examines the local response of the output() by varying input parameters one at a time,holding other parameters to a central value; and the latter examines the global response (averaged over the variation of all the parameters) of model output() by exploring a finite (or even an infinite) region.Since it is very easy to conduct local sensitivity analysis,it is very popular in ecological models.However,local sensitivity analysis is not computationally effective,because it can only get the sensitivity of a single parameter at a time.It can not take into consideration the effect of interaction of different parameters.Additionally,the value of other parameters will affect the sensitivity of the parameter specified.In view of this,global sensitivity analysis is increasingly preferred to local sensitivity in recent years.However,for most of the ecological modeling study published in Chinese,only local sensitivity analysis is conducted.To provide a toolbox of alternative sensitivity analysis algorithms for ecological model development in future study,we reviewed the main methods of both local sensitivity analysis and global sensitivity analysis,including one at a time method,multivariate regression,Morris' method,Sobol's method,Fourier Amplitude Sensitivity Analysis,and Extended Fourier Amplitude Sensitivity Analysis.Based on the state-of-the-art research on sensitivity analysis,the sensitivity of the interaction between two or more than two model parameters,the sensitivity of common model parameters in a set of models,and the sensitivity analysis in spatially explicit landscape model simulation were identified as the key areas and difficulties of future study on sensitivity analysis in ecological modeling.
[本文引用: 3]
[本文引用: 3]
DOI:10.3390/rs8070567URL
URL [本文引用: 1]
正 辽宁东部山区人工红松林,大多数是通过次生林改造、人工栽植红松而发展起来的。这些人工红松林,一般地可划分为3种林型: 1.异龄复层阔叶红松林(简称林型Ⅰ) 2.同龄阔叶红松林(简称林型Ⅱ) 3.红松纯林(简称林型Ⅲ) 为了进一步探讨3种林型林地生产力的高低,我们于1974年设立了3种林型固定观察地,进行深入观察,10年的观测结果作以整理与分析。
URL [本文引用: 1]
正 辽宁东部山区人工红松林,大多数是通过次生林改造、人工栽植红松而发展起来的。这些人工红松林,一般地可划分为3种林型: 1.异龄复层阔叶红松林(简称林型Ⅰ) 2.同龄阔叶红松林(简称林型Ⅱ) 3.红松纯林(简称林型Ⅲ) 为了进一步探讨3种林型林地生产力的高低,我们于1974年设立了3种林型固定观察地,进行深入观察,10年的观测结果作以整理与分析。
DOI:10.5846/stxb201405201029URL [本文引用: 1]
20世纪末以来有两个重要的变化影响着东北温带阔叶红松林资源的可持续性,一是天然林资源保护工程(下称天保工程)的实施,另一个是红松不再作为用材树种被采伐。但森林采伐后的更新造林模式并没有显著改变。以长白山腹地-露水河林业局的阔叶红松林为研究对象,利用森林资源清查(二类)和作业设计调查(三类)资料,评估了这两个重要的变化对当前的森林资源的产生影响。结果表明,天保工程的实施调减了采伐量,间接提高了森林的公顷蓄积量,整体上促进了森林资源的恢复。目前,紫椴,蒙古栎,水曲柳和春榆等占商品材总生产量94.7%(蓄积量)。与此同时,可供采伐的这4个树种年生长量却小于采伐量,而林下补植红松,却忽视阔叶树更新的经营模式势必会逐渐增加红松在阔叶红松林中的比例,使目前商品材资源不足的情况更加恶化。总的来说,天保工程促进了公益林区森林资源的可持续性,但降低了用于木材生产的商品林的面积;红松不采伐增加了红松在商品林中的比例,降低了商品林中用材树种比例和商品材的可持续生产能力,从长期看,必然导致可采伐林木资源的枯竭。据此,建议应根据森林培育的目标,选择合适的森林更新恢复模式。
DOI:10.3969/j.issn.1005-3492.2014.08.016URL [本文引用: 2]
In order to effectively identify the key parameters of crop models and reduce the inapplicability of model simulation,the Extend Fourier Amplitude Sensitivity Test (EFAST) was used to analyze the global sensitivity of CERES-Wheat model parameters in Shangzhuang experimental station of China Agricultural University in Beijing.The sensitivity of crop,soil and field management parameters was analyzed.The results of the sensitivity analysis showed that standard kernel size under optimum conditions had the greatest impact on the simulation wheat yields among crop cultivar parameters while lamina area to weight ratio of phase 2 was the most significant one in crop ecotype parameters.For soil parameters,nitrogen mineralized factor was the most critical input.The amount of nitrogenous fertilizer,planting date,fertilization date and planting depth among all of field management parameters had the most significant influence on the simulation results.The research showed that the global sensitivity analysis based on EFAST had guiding significance for crop model correction and provided reference for parameter selection and crop model optimization.
DOI:10.1007/s10310-011-0305-2URL
The uncertainty in the predicted values of a process-based terrestrial ecosystem model is as important as the predicted values themselves. However, few studies integrate uncertainty analysis into their modeling of carbon dynamics. In this paper, we conducted a local sensitivity analysis of the model parameters of a process-based ecosystem model at the Chaibaishan broad-leaved Korean pine mixed forest site in 20030900092005. Sixteen parameters were found to affect the annual net ecosystem exchange of CO2 (NEE) in each of the three years. We combined a Monte Carlo uncertainty analysis with a standardized multiple regression method to distinguish the contributions of the parameters and the initial variables to the output variance. Our results showed that the uncertainties in the modeled annual gross primary production and ecosystem respiration were 50900098% of their mean values, while the uncertainty in the annual NEE was up to 2309000937% of the mean value in 20030900092005. Five parameters yielded about 92% of the uncertainty in the modeled annual net ecosystem exchange. Finally, we analyzed the sensitivity of the meteorological data and compared two types of meteorological data and their effects on the estimation of carbon fluxes. Overestimating the relative humidity at a spatial resolution of 10 km 0103 10 km had a larger effect on the annual gross primary production, ecosystem respiration, and net ecosystem exchange than underestimating precipitation. More attention should be paid to the accurate estimation of sensitive model parameters, driving meteorological data, and the responses of ecosystem processes to environmental variables in the context of global change.
DOI:10.3773/j.issn.1005-264x.2010.04.002URL [本文引用: 1]
采用长期定位跟踪实测方法,比较分析了我国东北温带森林4个水热状况不同的立地条件(红松(Pinus koraiensis)人工林、硬阔叶林、蒙古栎(Quercus mongolica)林和林外空旷地)下11个温带树种粗木质残体(CWD)分解初期3年中的碳氮动态及其影响因子。测定树种包括:白桦(Betula platyphylla)、山杨(Populus davidiana)、紫椴(Tilia amurensis)、胡桃楸(Juglans mandshurica)、蒙古栎、色木槭似cermono)、春榆(Ulmusjaponica)、红松、黄檗(砌ellodendronamurense)、兴安落叶松(Larixgmelinii)和水曲柳(Fraxnus mandshurica)。结果表明:在分解过程中,所有树种CWD的碳浓度没有明显变化(P〉0.05),但其干重、碳密度、氮浓度和氮密度均随分解进程不同程度地减小,碳氮比(C/N)则增大,而且树种间差异显著(P〈0.001)。针叶树种的CWD分解速率显著地低于阔叶树种,其中白桦的3年CWD干重损失率(65%)约为兴安落叶松(22%)的3倍。径级大的CWD分解较慢。CWD分解与碳氮释放均与CWD的初始N含量呈正相关,而与初始C/N呈负相关。4个立地条件下CWD的干重和碳氮含量的变化差异不显著,均表现出一致的变化趋势。该研究指出,在分解初期的前3年中,CWD基本上是一个碳源和氮源。
DOI:10.3969/j.issn.1000-6923.2014.05.049URL [本文引用: 1]
To quantitatively evaluate parameters influence and uncertainty of model, WASP model was reorganized by Simulink in this paper. Sensitivity of the parameters related to model output of DO, CBOD, NH3-N and NO3--N was studied based on Sobol method. In particular, sensitivity changes with temporal and spatial variations of input were discussed. Global sensitivity analysis of Sobol method canidentify the most sensitive parameters of the process simulation; The significant difference between the total sensitivity and first-order sensitivity index showed that some parameters (e.g. GP1, PNH3, anc, etc.) of the WASP model were strongly coupling, and“One variable at a time”method was inappropriate to evaluate the sensitivity of these parameters; Sensitivity index of WASP parameter changed with the temporal and spatial variation of boundary conditions, even for the same river; WASP model showed an obvious equifinality for different parameters, so the traditional methods such as the global optimization calibration, failed to simulate the mechanism process. Experiments were required as a verification for calibration of key parameters.
DOI:10.13292/j.1000-4890.201706.010URL [本文引用: 1]
数据同化为模型与遥感观测结合提供了一条有效的途径,通过在模型运行过程中融入遥感观测数据,调整模型运行轨迹从而降低模型误差,提高模拟精度。本文利用集合卡尔曼滤波(En KF)算法同化生长季中分辨率成像光谱仪(MODIS)叶面积指数(LAI)与Biome-BGC模型模拟的LAI模拟长白山阔叶红松林的水碳通量。同时,通过改进模拟的雪面升华与土壤温度计算方法的参数,旨在降低冬季生态呼吸的模拟误差。结果表明,相对于原始模型,数据同化与模型改进后使得生态系统总初级生产力(GPP)的模拟值与观测值之间的相关系数提高0.06,中心化均方根误差(RMSE)降低0.48 g C·m~(-2)·d~(-1);生态系统呼吸(RE)的相关系数提高0.02,中心化均方根误差降低0.20 g C·m~(-2)·d~(-1);净生态系统碳交换量(NEE)相关系数提高0.35,中心化均方根误差降低0.50 g C·m~(-2)·d~(-1)。同时,数据同化对蒸散发(ET)的模拟精度没有显著影响,改进的模型提高了其相关系数。基于En KF算法的数据同化提高了长白山阔叶红松林碳通量模拟精度,对于精确估算区域碳通量有着重要的意义。
URL [本文引用: 2]
PnET-Ⅱ(photosynthesis and evapotranspiration)模型是生态系统过程模型,运行过程中所需的参数较多,包括植被、土壤和气候参数等.本文估计了丰林自然保护区阔叶红松林中红松和阔叶树的总净初级生产力(NPP)和枝干NPP对PnET-Ⅱ模型参数变化的敏感程度.结果表明:PnET-Ⅱ模型的植被参数中,林冠参数变化对模拟结果影响较大,且红松总NPP对植被参数的敏感性大于阔叶树;红松和阔叶树NPP对土壤持水量变化敏感性较小,且红松NPP对土壤持水量的敏感性略小于阔叶树;在气候情景范围内,气温变化对红松和阔叶树NPP的影响最大,降水和光合有效辐射次之.不同气候情景对NPP模拟结果的影响不同.红松和阔叶树的总NPP和枝干NPP对各输入参数的敏感程度并不完全一致.
[本文引用: 2]
[本文引用: 2]
Nonlinear sensitivity analysis of multiparameter model systems
1
1978
... 本研究采用EFAST法对模型中的生理生态参数进行敏感性分析.EFAST是基于方差的定量敏感性分析方法, 它结合了FAST方法(
基于BIOME-BGC模型的长白落叶松林净初级生产力模拟参数敏感性
2
2016
... 生物地球化学循环模型(Biome-BGC)是一个典型的参数众多的生理生态过程模型, 它能够模拟不同植被类型的碳通量和水通量.目前关于该模型的敏感性分析已有一些报道, 多是采用局部敏感性分析的方法, 分析单个参数变化对模拟的年净初级生产力(NPP)的影响(
... 其中, VY是模型模拟结果的总方差, Vi是单个因子的方差, Vij-V12···n是参数之间交互作用的方差.参数Xi对模型输出结果总方差的直接贡献可用一阶敏感性指数表示: 即Si = Vi/VY, 而Xi的全局敏感性指数为参数的一阶敏感性以及该参数与其他参数相互作用的各阶敏感性指数之和(
Constraining Model Simulations of GPP Using Satellite Retrieved Leaf Chlorophyll. IEEE,
1
2012
... 那么这几个参数是如何影响模型模拟结果的呢? 具体来讲, 首先, 在Biome-BGC模型的光合作用模块中, C:Nleaf、FLNR和SLA这3个参数决定了最大羧化速率的大小, 而1,5-二磷酸羧核酮糖羧化/加氧酶(Rubisco酶)直接影响到植被固定大气CO2的第一步(羧化作用), 羧化速率为状态变量, 其本身具有较高的空间异质性且难以获取(
3
2013
... Parameterization for Korean pine (PK) and broadleaved species (DB) ecophysiological parameters
| 参数 Parameter | 符号 Symbol | 红松基 准值 Basic value of Korean pine | 阔叶树 基准值 Basic value of broadleaf species | 单位 Unit | 来源 Source |
|---|---|---|---|---|---|
| 转移生长占生长季的比例 Transfer growth period | Tt | 0.3 | 0.2 | - | Biome-BGC V4.2 |
| 凋落过程占生长季的比例 Litterfall period | LFG | 0.3 | 0.2 | - | Biome-BGC V4.2 |
| 叶片与细根周转率 Annual leaf and fine root turnover fraction | LFRT | 0.32 | 1.0 | a-1 | |
| 活立木周转率 Annual live wood turnover fraction | LWT | 0.7 | 0.7 | a-1 | Biome-BGC V4.2 |
| 整株植物死亡率 Annual whole-plant mortality fraction | WPM | 0.009 0 | 0.021 3 | a-1 | |
| 火灾死亡率 Annual fire mortality fraction | FM | 0 | 0 | a-1 | Set by us |
| 细根与叶片碳分配比 New fine root C: leaf C | FRC:LC | 1.2 | 0.9 | - | |
| 新茎与新叶碳分配比 New stem C: leaf C | SC:LC | 1.4 | 2.4 | - | |
| 活立木与所有木质组织碳分配比 New live wood C: total wood C | LWC:TWC | 0.379 | 0.1 | - | |
| 粗根与新茎碳分配比 New coarse root C: stem C | CRC:SC | 0.29 | 0.23 | - | |
| 当前生长比例 Current growth proportion | CGP | 0.5 | 0.5 | - | Biome-BGC V4.2 |
| 叶片碳氮比 C:N of leaves | C:Nleaf | 34.30 | 17.55 | kg·kg-1 | Measured by us |
| 叶片凋落物碳氮比 C:N of falling leaf litter | C:Nlitter | 96.5 | 41.1 | kg·kg-1 | |
| 细根碳氮比 C:N of ?ne roots | C:Nfr | 56.4 | 47.4 | kg·kg-1 | |
| 活立木碳氮比 C:N of live wood | C:Nlw | 97.4 | 97.05 | kg·kg-1 | |
| 死立木碳氮比 C:N of dead wood | C:Ndw | 398 | 212 | kg·kg-1 | |
| 叶片凋落物易分解物质所占比 Leaf litter labile proportion | Llab | 0.45 | 0.53 | - | |
| 叶片凋落物纤维素所占比 Leaf litter cellulose proportion | Lcel | 0.25 | 0.22 | - | |
| 叶片凋落物木质素所占比 Leaf litter lignin proportion | Llig | 0.30 | 0.25 | - | |
| 细根中易分解物质所占比 Fine root labile proportion | FRlab | 0.34 | 0.30 | - | Biome-BGC V4.2 |
| 细根中纤维素所占比 Fine root cellulose proportion | FRcel | 0.44 | 0.45 | - | Biome-BGC V4.2 |
| 细根中木质素所占比 Fine root lignin proportion | FRlig | 0.22 | 0.25 | - | Biome-BGC V4.2 |
| 死立木中纤维素所占比 Dead wood cellulose proportion | DWcel | 0.73 | 0.76 | - | |
| 死立木中木质素所占比 Dead wood lignin proportion | DWlig | 0.27 | 0.24 | - | |
| 冠层截留系数 Water interception coef?cient | Wint | 0.045 | 0.033 | LAI-1·d-1 | |
| 冠层消光系数 Light extinction coef?cient | k | 0.50 | 0.58 | - | |
| 所有叶面积与投影叶面积之比 Ratio of all sided to projected leaf area | LAIall:proj | 2.6 | 2.0 | - | |
| 冠层平均比叶面积 Average speci?c leaf area | SLA | 16.4 | 54.2 | m2·kg-1 | Measured by us |
| 阴叶与阳叶比叶面积比 Ratio of shade SLA : sunlit SLA | SLAshd:sun | 2 | 2 | - | |
| Rubisco酶中叶氮含量 Fraction of leaf N in Rubisco | FLNR | 0.080 | 0.075 | - | |
| 最大气孔导度 Maximum stomatal conductance | Gsmax | 0.006 0 | 0.006 5 | m·s-1 | |
| 表皮导度 Cuticular conductance | Gcut | 0.000 06 | 0.000 01 | m·s-1 | |
| 边界层导度 Boundary layer conductance | Gbl | 0.09 | 0.01 | m·s-1 | |
| 气孔开始减小时叶片水势 Leaf water potential : start of gs reduction | LWPi | -0.65 | -0.34 | MPa | |
| 气孔停止减小时叶片水势 Leaf water potential : completion of gs reduction | LWPf | -2.5 | -2.2 | MPa | |
| 气孔开始减小时饱和水汽压差 Vapor pressure deficit : start of gs reduction | VPDi | 610 | 1 100 | Pa | |
| 气孔停止减小时饱和水汽压差 Vapor pressure deficit : completion of gs reduction | VPDf | 3 100 | 3 600 | Pa |
...
Vapor pressure deficit : completion of gs reduction
...
Vapor pressure deficit : completion of gs reduction
3
2016
... 近些年来, 生态过程模型的发展为研究者在长时间序列和区域、全球尺度上对陆地生态系统碳、水循环以及它们应对全球气候变化方面的研究提供了极大的便利(
... 模型模拟结果的不确定性来源于很多方面, 包括模型结构的不确定性、输入变量的不确定性以及模型参数的不确定性.模型结构的不确定性可能是因为对生态系统过程认识不足导致, 输入变量的不确定性可能是由于测量误差引起的, 而模型参数的不确定性则是由于对生态系统的观测数据不完善引起的(
... 关于对水通量的参数敏感性检验的相关研究较少, 本文中影响红松和阔叶树ET的敏感参数有很大不同, 且它们对模拟ET的作用方式也不同.这可能与红松和阔叶树的生长习性不同有关.影响红松ET的敏感参数有多个, 但除SLA、FRC:LC和Gcut 3个参数外, 其余敏感参数的总敏感性指数远大于一阶敏感性指数, 这类参数是通过与其他参数的二阶或多阶交互作用来间接影响模拟结果, 若采取一次变化一个参数而保持其他参数不变的局部敏感性分析就无法得到准确的结果(
Simulating effects of fire disturbance and climate change on boreal forest productivity and evapotranspiration
1
2006
... 初始化文件主要包括经纬度、海拔、土壤质地、土壤有效深度等样地信息和其他状态变量的设定, 样地信息根据实际调查获取.由于研究区无气象站, 所以本文的气象驱动数据来源于中国气象科学数据共享服务网(http://data.cma.cn/data/cdcindex.html)发布的吉林省二道气象站的气象资料, 时间尺度为1958-2015年.对于不能直接从气象站获取的气象因子, 则根据日最高气温、日最低气温、日降水量, 利用小型山地气候模型(MTCLIM 4.3)估算得到.对于生理生态参数, 一部分通过实测获取; 另一部分则通过搜集已有文献数据得到; 个别不易获取且没有相关文献数据的参数采用模型缺省值.Biome-BGC模型没有针对阔叶红松林(针阔混交林)的生理生态参数, 借鉴已有研究的处理方法(
Sensitivity analysis of Biome-BGC model for dry tropical forests of Vindhyan highlands, India
2
2012
... 生物地球化学循环模型(Biome-BGC)是一个典型的参数众多的生理生态过程模型, 它能够模拟不同植被类型的碳通量和水通量.目前关于该模型的敏感性分析已有一些报道, 多是采用局部敏感性分析的方法, 分析单个参数变化对模拟的年净初级生产力(NPP)的影响(
... 影响红松模拟NPP的敏感参数依次为LAIall:proj、C:Nfr、Wint、LFRT、FLNR、SLA和C:Nleaf.影响阔叶树NPP的敏感参数有C:Nleaf、SLA、Gsmax、C:Nlitter、C:Nfr、SC:LC以及Wint.早前的研究中,
红松阔叶林及其次生杨桦林生物生产力的研究
1
1984
... Parameterization for Korean pine (PK) and broadleaved species (DB) ecophysiological parameters
| 参数 Parameter | 符号 Symbol | 红松基 准值 Basic value of Korean pine | 阔叶树 基准值 Basic value of broadleaf species | 单位 Unit | 来源 Source |
|---|---|---|---|---|---|
| 转移生长占生长季的比例 Transfer growth period | Tt | 0.3 | 0.2 | - | Biome-BGC V4.2 |
| 凋落过程占生长季的比例 Litterfall period | LFG | 0.3 | 0.2 | - | Biome-BGC V4.2 |
| 叶片与细根周转率 Annual leaf and fine root turnover fraction | LFRT | 0.32 | 1.0 | a-1 | |
| 活立木周转率 Annual live wood turnover fraction | LWT | 0.7 | 0.7 | a-1 | Biome-BGC V4.2 |
| 整株植物死亡率 Annual whole-plant mortality fraction | WPM | 0.009 0 | 0.021 3 | a-1 | |
| 火灾死亡率 Annual fire mortality fraction | FM | 0 | 0 | a-1 | Set by us |
| 细根与叶片碳分配比 New fine root C: leaf C | FRC:LC | 1.2 | 0.9 | - | |
| 新茎与新叶碳分配比 New stem C: leaf C | SC:LC | 1.4 | 2.4 | - | |
| 活立木与所有木质组织碳分配比 New live wood C: total wood C | LWC:TWC | 0.379 | 0.1 | - | |
| 粗根与新茎碳分配比 New coarse root C: stem C | CRC:SC | 0.29 | 0.23 | - | |
| 当前生长比例 Current growth proportion | CGP | 0.5 | 0.5 | - | Biome-BGC V4.2 |
| 叶片碳氮比 C:N of leaves | C:Nleaf | 34.30 | 17.55 | kg·kg-1 | Measured by us |
| 叶片凋落物碳氮比 C:N of falling leaf litter | C:Nlitter | 96.5 | 41.1 | kg·kg-1 | |
| 细根碳氮比 C:N of ?ne roots | C:Nfr | 56.4 | 47.4 | kg·kg-1 | |
| 活立木碳氮比 C:N of live wood | C:Nlw | 97.4 | 97.05 | kg·kg-1 | |
| 死立木碳氮比 C:N of dead wood | C:Ndw | 398 | 212 | kg·kg-1 | |
| 叶片凋落物易分解物质所占比 Leaf litter labile proportion | Llab | 0.45 | 0.53 | - | |
| 叶片凋落物纤维素所占比 Leaf litter cellulose proportion | Lcel | 0.25 | 0.22 | - | |
| 叶片凋落物木质素所占比 Leaf litter lignin proportion | Llig | 0.30 | 0.25 | - | |
| 细根中易分解物质所占比 Fine root labile proportion | FRlab | 0.34 | 0.30 | - | Biome-BGC V4.2 |
| 细根中纤维素所占比 Fine root cellulose proportion | FRcel | 0.44 | 0.45 | - | Biome-BGC V4.2 |
| 细根中木质素所占比 Fine root lignin proportion | FRlig | 0.22 | 0.25 | - | Biome-BGC V4.2 |
| 死立木中纤维素所占比 Dead wood cellulose proportion | DWcel | 0.73 | 0.76 | - | |
| 死立木中木质素所占比 Dead wood lignin proportion | DWlig | 0.27 | 0.24 | - | |
| 冠层截留系数 Water interception coef?cient | Wint | 0.045 | 0.033 | LAI-1·d-1 | |
| 冠层消光系数 Light extinction coef?cient | k | 0.50 | 0.58 | - | |
| 所有叶面积与投影叶面积之比 Ratio of all sided to projected leaf area | LAIall:proj | 2.6 | 2.0 | - | |
| 冠层平均比叶面积 Average speci?c leaf area | SLA | 16.4 | 54.2 | m2·kg-1 | Measured by us |
| 阴叶与阳叶比叶面积比 Ratio of shade SLA : sunlit SLA | SLAshd:sun | 2 | 2 | - | |
| Rubisco酶中叶氮含量 Fraction of leaf N in Rubisco | FLNR | 0.080 | 0.075 | - | |
| 最大气孔导度 Maximum stomatal conductance | Gsmax | 0.006 0 | 0.006 5 | m·s-1 | |
| 表皮导度 Cuticular conductance | Gcut | 0.000 06 | 0.000 01 | m·s-1 | |
| 边界层导度 Boundary layer conductance | Gbl | 0.09 | 0.01 | m·s-1 | |
| 气孔开始减小时叶片水势 Leaf water potential : start of gs reduction | LWPi | -0.65 | -0.34 | MPa | |
| 气孔停止减小时叶片水势 Leaf water potential : completion of gs reduction | LWPf | -2.5 | -2.2 | MPa | |
| 气孔开始减小时饱和水汽压差 Vapor pressure deficit : start of gs reduction | VPDi | 610 | 1 100 | Pa | |
| 气孔停止减小时饱和水汽压差 Vapor pressure deficit : completion of gs reduction | VPDf | 3 100 | 3 600 | Pa |
长白山次生针阔混交林叶凋落物中有机物分解与碳、氮和磷释放的关系
1
2008
... Parameterization for Korean pine (PK) and broadleaved species (DB) ecophysiological parameters
| 参数 Parameter | 符号 Symbol | 红松基 准值 Basic value of Korean pine | 阔叶树 基准值 Basic value of broadleaf species | 单位 Unit | 来源 Source |
|---|---|---|---|---|---|
| 转移生长占生长季的比例 Transfer growth period | Tt | 0.3 | 0.2 | - | Biome-BGC V4.2 |
| 凋落过程占生长季的比例 Litterfall period | LFG | 0.3 | 0.2 | - | Biome-BGC V4.2 |
| 叶片与细根周转率 Annual leaf and fine root turnover fraction | LFRT | 0.32 | 1.0 | a-1 | |
| 活立木周转率 Annual live wood turnover fraction | LWT | 0.7 | 0.7 | a-1 | Biome-BGC V4.2 |
| 整株植物死亡率 Annual whole-plant mortality fraction | WPM | 0.009 0 | 0.021 3 | a-1 | |
| 火灾死亡率 Annual fire mortality fraction | FM | 0 | 0 | a-1 | Set by us |
| 细根与叶片碳分配比 New fine root C: leaf C | FRC:LC | 1.2 | 0.9 | - | |
| 新茎与新叶碳分配比 New stem C: leaf C | SC:LC | 1.4 | 2.4 | - | |
| 活立木与所有木质组织碳分配比 New live wood C: total wood C | LWC:TWC | 0.379 | 0.1 | - | |
| 粗根与新茎碳分配比 New coarse root C: stem C | CRC:SC | 0.29 | 0.23 | - | |
| 当前生长比例 Current growth proportion | CGP | 0.5 | 0.5 | - | Biome-BGC V4.2 |
| 叶片碳氮比 C:N of leaves | C:Nleaf | 34.30 | 17.55 | kg·kg-1 | Measured by us |
| 叶片凋落物碳氮比 C:N of falling leaf litter | C:Nlitter | 96.5 | 41.1 | kg·kg-1 | |
| 细根碳氮比 C:N of ?ne roots | C:Nfr | 56.4 | 47.4 | kg·kg-1 | |
| 活立木碳氮比 C:N of live wood | C:Nlw | 97.4 | 97.05 | kg·kg-1 | |
| 死立木碳氮比 C:N of dead wood | C:Ndw | 398 | 212 | kg·kg-1 | |
| 叶片凋落物易分解物质所占比 Leaf litter labile proportion | Llab | 0.45 | 0.53 | - | |
| 叶片凋落物纤维素所占比 Leaf litter cellulose proportion | Lcel | 0.25 | 0.22 | - | |
| 叶片凋落物木质素所占比 Leaf litter lignin proportion | Llig | 0.30 | 0.25 | - | |
| 细根中易分解物质所占比 Fine root labile proportion | FRlab | 0.34 | 0.30 | - | Biome-BGC V4.2 |
| 细根中纤维素所占比 Fine root cellulose proportion | FRcel | 0.44 | 0.45 | - | Biome-BGC V4.2 |
| 细根中木质素所占比 Fine root lignin proportion | FRlig | 0.22 | 0.25 | - | Biome-BGC V4.2 |
| 死立木中纤维素所占比 Dead wood cellulose proportion | DWcel | 0.73 | 0.76 | - | |
| 死立木中木质素所占比 Dead wood lignin proportion | DWlig | 0.27 | 0.24 | - | |
| 冠层截留系数 Water interception coef?cient | Wint | 0.045 | 0.033 | LAI-1·d-1 | |
| 冠层消光系数 Light extinction coef?cient | k | 0.50 | 0.58 | - | |
| 所有叶面积与投影叶面积之比 Ratio of all sided to projected leaf area | LAIall:proj | 2.6 | 2.0 | - | |
| 冠层平均比叶面积 Average speci?c leaf area | SLA | 16.4 | 54.2 | m2·kg-1 | Measured by us |
| 阴叶与阳叶比叶面积比 Ratio of shade SLA : sunlit SLA | SLAshd:sun | 2 | 2 | - | |
| Rubisco酶中叶氮含量 Fraction of leaf N in Rubisco | FLNR | 0.080 | 0.075 | - | |
| 最大气孔导度 Maximum stomatal conductance | Gsmax | 0.006 0 | 0.006 5 | m·s-1 | |
| 表皮导度 Cuticular conductance | Gcut | 0.000 06 | 0.000 01 | m·s-1 | |
| 边界层导度 Boundary layer conductance | Gbl | 0.09 | 0.01 | m·s-1 | |
| 气孔开始减小时叶片水势 Leaf water potential : start of gs reduction | LWPi | -0.65 | -0.34 | MPa | |
| 气孔停止减小时叶片水势 Leaf water potential : completion of gs reduction | LWPf | -2.5 | -2.2 | MPa | |
| 气孔开始减小时饱和水汽压差 Vapor pressure deficit : start of gs reduction | VPDi | 610 | 1 100 | Pa | |
| 气孔停止减小时饱和水汽压差 Vapor pressure deficit : completion of gs reduction | VPDf | 3 100 | 3 600 | Pa |
基于EFAST方法的SEBS模型参数全局敏感性分析
1
2014
... 模型参数敏感性分析包括局部敏感性分析和全局敏感性分析(
基于EFAST方法的SEBS模型参数全局敏感性分析
1
2014
... 模型参数敏感性分析包括局部敏感性分析和全局敏感性分析(
辽东落叶松人工混交林凋落物混合分解特征
1
2017
... Parameterization for Korean pine (PK) and broadleaved species (DB) ecophysiological parameters
| 参数 Parameter | 符号 Symbol | 红松基 准值 Basic value of Korean pine | 阔叶树 基准值 Basic value of broadleaf species | 单位 Unit | 来源 Source |
|---|---|---|---|---|---|
| 转移生长占生长季的比例 Transfer growth period | Tt | 0.3 | 0.2 | - | Biome-BGC V4.2 |
| 凋落过程占生长季的比例 Litterfall period | LFG | 0.3 | 0.2 | - | Biome-BGC V4.2 |
| 叶片与细根周转率 Annual leaf and fine root turnover fraction | LFRT | 0.32 | 1.0 | a-1 | |
| 活立木周转率 Annual live wood turnover fraction | LWT | 0.7 | 0.7 | a-1 | Biome-BGC V4.2 |
| 整株植物死亡率 Annual whole-plant mortality fraction | WPM | 0.009 0 | 0.021 3 | a-1 | |
| 火灾死亡率 Annual fire mortality fraction | FM | 0 | 0 | a-1 | Set by us |
| 细根与叶片碳分配比 New fine root C: leaf C | FRC:LC | 1.2 | 0.9 | - | |
| 新茎与新叶碳分配比 New stem C: leaf C | SC:LC | 1.4 | 2.4 | - | |
| 活立木与所有木质组织碳分配比 New live wood C: total wood C | LWC:TWC | 0.379 | 0.1 | - | |
| 粗根与新茎碳分配比 New coarse root C: stem C | CRC:SC | 0.29 | 0.23 | - | |
| 当前生长比例 Current growth proportion | CGP | 0.5 | 0.5 | - | Biome-BGC V4.2 |
| 叶片碳氮比 C:N of leaves | C:Nleaf | 34.30 | 17.55 | kg·kg-1 | Measured by us |
| 叶片凋落物碳氮比 C:N of falling leaf litter | C:Nlitter | 96.5 | 41.1 | kg·kg-1 | |
| 细根碳氮比 C:N of ?ne roots | C:Nfr | 56.4 | 47.4 | kg·kg-1 | |
| 活立木碳氮比 C:N of live wood | C:Nlw | 97.4 | 97.05 | kg·kg-1 | |
| 死立木碳氮比 C:N of dead wood | C:Ndw | 398 | 212 | kg·kg-1 | |
| 叶片凋落物易分解物质所占比 Leaf litter labile proportion | Llab | 0.45 | 0.53 | - | |
| 叶片凋落物纤维素所占比 Leaf litter cellulose proportion | Lcel | 0.25 | 0.22 | - | |
| 叶片凋落物木质素所占比 Leaf litter lignin proportion | Llig | 0.30 | 0.25 | - | |
| 细根中易分解物质所占比 Fine root labile proportion | FRlab | 0.34 | 0.30 | - | Biome-BGC V4.2 |
| 细根中纤维素所占比 Fine root cellulose proportion | FRcel | 0.44 | 0.45 | - | Biome-BGC V4.2 |
| 细根中木质素所占比 Fine root lignin proportion | FRlig | 0.22 | 0.25 | - | Biome-BGC V4.2 |
| 死立木中纤维素所占比 Dead wood cellulose proportion | DWcel | 0.73 | 0.76 | - | |
| 死立木中木质素所占比 Dead wood lignin proportion | DWlig | 0.27 | 0.24 | - | |
| 冠层截留系数 Water interception coef?cient | Wint | 0.045 | 0.033 | LAI-1·d-1 | |
| 冠层消光系数 Light extinction coef?cient | k | 0.50 | 0.58 | - | |
| 所有叶面积与投影叶面积之比 Ratio of all sided to projected leaf area | LAIall:proj | 2.6 | 2.0 | - | |
| 冠层平均比叶面积 Average speci?c leaf area | SLA | 16.4 | 54.2 | m2·kg-1 | Measured by us |
| 阴叶与阳叶比叶面积比 Ratio of shade SLA : sunlit SLA | SLAshd:sun | 2 | 2 | - | |
| Rubisco酶中叶氮含量 Fraction of leaf N in Rubisco | FLNR | 0.080 | 0.075 | - | |
| 最大气孔导度 Maximum stomatal conductance | Gsmax | 0.006 0 | 0.006 5 | m·s-1 | |
| 表皮导度 Cuticular conductance | Gcut | 0.000 06 | 0.000 01 | m·s-1 | |
| 边界层导度 Boundary layer conductance | Gbl | 0.09 | 0.01 | m·s-1 | |
| 气孔开始减小时叶片水势 Leaf water potential : start of gs reduction | LWPi | -0.65 | -0.34 | MPa | |
| 气孔停止减小时叶片水势 Leaf water potential : completion of gs reduction | LWPf | -2.5 | -2.2 | MPa | |
| 气孔开始减小时饱和水汽压差 Vapor pressure deficit : start of gs reduction | VPDi | 610 | 1 100 | Pa | |
| 气孔停止减小时饱和水汽压差 Vapor pressure deficit : completion of gs reduction | VPDf | 3 100 | 3 600 | Pa |
生态过程模型敏感参数最优取值的时空异质性分析—以BIOME-BGC模型为例
1
2018
... 通过已有研究的综合分析, 我们发现无论采用定性的局部敏感性分析方法, 还是定量的全局敏感性分析方法, C:Nleaf、C:Nfr、SLA和Wint这4个参数在不同区域、不同物种、不同植被类型间对模拟结果均表现出高敏感参性.
生态过程模型敏感参数最优取值的时空异质性分析—以BIOME-BGC模型为例
1
2018
... 通过已有研究的综合分析, 我们发现无论采用定性的局部敏感性分析方法, 还是定量的全局敏感性分析方法, C:Nleaf、C:Nfr、SLA和Wint这4个参数在不同区域、不同物种、不同植被类型间对模拟结果均表现出高敏感参性.
Variation of carbon and nitrogen stoichiometry along a chronosequence of natural temperate forest in northeastern China
1
2018
... Parameterization for Korean pine (PK) and broadleaved species (DB) ecophysiological parameters
| 参数 Parameter | 符号 Symbol | 红松基 准值 Basic value of Korean pine | 阔叶树 基准值 Basic value of broadleaf species | 单位 Unit | 来源 Source |
|---|---|---|---|---|---|
| 转移生长占生长季的比例 Transfer growth period | Tt | 0.3 | 0.2 | - | Biome-BGC V4.2 |
| 凋落过程占生长季的比例 Litterfall period | LFG | 0.3 | 0.2 | - | Biome-BGC V4.2 |
| 叶片与细根周转率 Annual leaf and fine root turnover fraction | LFRT | 0.32 | 1.0 | a-1 | |
| 活立木周转率 Annual live wood turnover fraction | LWT | 0.7 | 0.7 | a-1 | Biome-BGC V4.2 |
| 整株植物死亡率 Annual whole-plant mortality fraction | WPM | 0.009 0 | 0.021 3 | a-1 | |
| 火灾死亡率 Annual fire mortality fraction | FM | 0 | 0 | a-1 | Set by us |
| 细根与叶片碳分配比 New fine root C: leaf C | FRC:LC | 1.2 | 0.9 | - | |
| 新茎与新叶碳分配比 New stem C: leaf C | SC:LC | 1.4 | 2.4 | - | |
| 活立木与所有木质组织碳分配比 New live wood C: total wood C | LWC:TWC | 0.379 | 0.1 | - | |
| 粗根与新茎碳分配比 New coarse root C: stem C | CRC:SC | 0.29 | 0.23 | - | |
| 当前生长比例 Current growth proportion | CGP | 0.5 | 0.5 | - | Biome-BGC V4.2 |
| 叶片碳氮比 C:N of leaves | C:Nleaf | 34.30 | 17.55 | kg·kg-1 | Measured by us |
| 叶片凋落物碳氮比 C:N of falling leaf litter | C:Nlitter | 96.5 | 41.1 | kg·kg-1 | |
| 细根碳氮比 C:N of ?ne roots | C:Nfr | 56.4 | 47.4 | kg·kg-1 | |
| 活立木碳氮比 C:N of live wood | C:Nlw | 97.4 | 97.05 | kg·kg-1 | |
| 死立木碳氮比 C:N of dead wood | C:Ndw | 398 | 212 | kg·kg-1 | |
| 叶片凋落物易分解物质所占比 Leaf litter labile proportion | Llab | 0.45 | 0.53 | - | |
| 叶片凋落物纤维素所占比 Leaf litter cellulose proportion | Lcel | 0.25 | 0.22 | - | |
| 叶片凋落物木质素所占比 Leaf litter lignin proportion | Llig | 0.30 | 0.25 | - | |
| 细根中易分解物质所占比 Fine root labile proportion | FRlab | 0.34 | 0.30 | - | Biome-BGC V4.2 |
| 细根中纤维素所占比 Fine root cellulose proportion | FRcel | 0.44 | 0.45 | - | Biome-BGC V4.2 |
| 细根中木质素所占比 Fine root lignin proportion | FRlig | 0.22 | 0.25 | - | Biome-BGC V4.2 |
| 死立木中纤维素所占比 Dead wood cellulose proportion | DWcel | 0.73 | 0.76 | - | |
| 死立木中木质素所占比 Dead wood lignin proportion | DWlig | 0.27 | 0.24 | - | |
| 冠层截留系数 Water interception coef?cient | Wint | 0.045 | 0.033 | LAI-1·d-1 | |
| 冠层消光系数 Light extinction coef?cient | k | 0.50 | 0.58 | - | |
| 所有叶面积与投影叶面积之比 Ratio of all sided to projected leaf area | LAIall:proj | 2.6 | 2.0 | - | |
| 冠层平均比叶面积 Average speci?c leaf area | SLA | 16.4 | 54.2 | m2·kg-1 | Measured by us |
| 阴叶与阳叶比叶面积比 Ratio of shade SLA : sunlit SLA | SLAshd:sun | 2 | 2 | - | |
| Rubisco酶中叶氮含量 Fraction of leaf N in Rubisco | FLNR | 0.080 | 0.075 | - | |
| 最大气孔导度 Maximum stomatal conductance | Gsmax | 0.006 0 | 0.006 5 | m·s-1 | |
| 表皮导度 Cuticular conductance | Gcut | 0.000 06 | 0.000 01 | m·s-1 | |
| 边界层导度 Boundary layer conductance | Gbl | 0.09 | 0.01 | m·s-1 | |
| 气孔开始减小时叶片水势 Leaf water potential : start of gs reduction | LWPi | -0.65 | -0.34 | MPa | |
| 气孔停止减小时叶片水势 Leaf water potential : completion of gs reduction | LWPf | -2.5 | -2.2 | MPa | |
| 气孔开始减小时饱和水汽压差 Vapor pressure deficit : start of gs reduction | VPDi | 610 | 1 100 | Pa | |
| 气孔停止减小时饱和水汽压差 Vapor pressure deficit : completion of gs reduction | VPDf | 3 100 | 3 600 | Pa |
利用直接法和间接法测定针阔混交林叶面积指数的季节动态
1
2014
... Parameterization for Korean pine (PK) and broadleaved species (DB) ecophysiological parameters
| 参数 Parameter | 符号 Symbol | 红松基 准值 Basic value of Korean pine | 阔叶树 基准值 Basic value of broadleaf species | 单位 Unit | 来源 Source |
|---|---|---|---|---|---|
| 转移生长占生长季的比例 Transfer growth period | Tt | 0.3 | 0.2 | - | Biome-BGC V4.2 |
| 凋落过程占生长季的比例 Litterfall period | LFG | 0.3 | 0.2 | - | Biome-BGC V4.2 |
| 叶片与细根周转率 Annual leaf and fine root turnover fraction | LFRT | 0.32 | 1.0 | a-1 | |
| 活立木周转率 Annual live wood turnover fraction | LWT | 0.7 | 0.7 | a-1 | Biome-BGC V4.2 |
| 整株植物死亡率 Annual whole-plant mortality fraction | WPM | 0.009 0 | 0.021 3 | a-1 | |
| 火灾死亡率 Annual fire mortality fraction | FM | 0 | 0 | a-1 | Set by us |
| 细根与叶片碳分配比 New fine root C: leaf C | FRC:LC | 1.2 | 0.9 | - | |
| 新茎与新叶碳分配比 New stem C: leaf C | SC:LC | 1.4 | 2.4 | - | |
| 活立木与所有木质组织碳分配比 New live wood C: total wood C | LWC:TWC | 0.379 | 0.1 | - | |
| 粗根与新茎碳分配比 New coarse root C: stem C | CRC:SC | 0.29 | 0.23 | - | |
| 当前生长比例 Current growth proportion | CGP | 0.5 | 0.5 | - | Biome-BGC V4.2 |
| 叶片碳氮比 C:N of leaves | C:Nleaf | 34.30 | 17.55 | kg·kg-1 | Measured by us |
| 叶片凋落物碳氮比 C:N of falling leaf litter | C:Nlitter | 96.5 | 41.1 | kg·kg-1 | |
| 细根碳氮比 C:N of ?ne roots | C:Nfr | 56.4 | 47.4 | kg·kg-1 | |
| 活立木碳氮比 C:N of live wood | C:Nlw | 97.4 | 97.05 | kg·kg-1 | |
| 死立木碳氮比 C:N of dead wood | C:Ndw | 398 | 212 | kg·kg-1 | |
| 叶片凋落物易分解物质所占比 Leaf litter labile proportion | Llab | 0.45 | 0.53 | - | |
| 叶片凋落物纤维素所占比 Leaf litter cellulose proportion | Lcel | 0.25 | 0.22 | - | |
| 叶片凋落物木质素所占比 Leaf litter lignin proportion | Llig | 0.30 | 0.25 | - | |
| 细根中易分解物质所占比 Fine root labile proportion | FRlab | 0.34 | 0.30 | - | Biome-BGC V4.2 |
| 细根中纤维素所占比 Fine root cellulose proportion | FRcel | 0.44 | 0.45 | - | Biome-BGC V4.2 |
| 细根中木质素所占比 Fine root lignin proportion | FRlig | 0.22 | 0.25 | - | Biome-BGC V4.2 |
| 死立木中纤维素所占比 Dead wood cellulose proportion | DWcel | 0.73 | 0.76 | - | |
| 死立木中木质素所占比 Dead wood lignin proportion | DWlig | 0.27 | 0.24 | - | |
| 冠层截留系数 Water interception coef?cient | Wint | 0.045 | 0.033 | LAI-1·d-1 | |
| 冠层消光系数 Light extinction coef?cient | k | 0.50 | 0.58 | - | |
| 所有叶面积与投影叶面积之比 Ratio of all sided to projected leaf area | LAIall:proj | 2.6 | 2.0 | - | |
| 冠层平均比叶面积 Average speci?c leaf area | SLA | 16.4 | 54.2 | m2·kg-1 | Measured by us |
| 阴叶与阳叶比叶面积比 Ratio of shade SLA : sunlit SLA | SLAshd:sun | 2 | 2 | - | |
| Rubisco酶中叶氮含量 Fraction of leaf N in Rubisco | FLNR | 0.080 | 0.075 | - | |
| 最大气孔导度 Maximum stomatal conductance | Gsmax | 0.006 0 | 0.006 5 | m·s-1 | |
| 表皮导度 Cuticular conductance | Gcut | 0.000 06 | 0.000 01 | m·s-1 | |
| 边界层导度 Boundary layer conductance | Gbl | 0.09 | 0.01 | m·s-1 | |
| 气孔开始减小时叶片水势 Leaf water potential : start of gs reduction | LWPi | -0.65 | -0.34 | MPa | |
| 气孔停止减小时叶片水势 Leaf water potential : completion of gs reduction | LWPf | -2.5 | -2.2 | MPa | |
| 气孔开始减小时饱和水汽压差 Vapor pressure deficit : start of gs reduction | VPDi | 610 | 1 100 | Pa | |
| 气孔停止减小时饱和水汽压差 Vapor pressure deficit : completion of gs reduction | VPDf | 3 100 | 3 600 | Pa |
Multiplicative sensitivity analysis and its role in development of simulation models
1
1981
... 近些年来, 生态过程模型的发展为研究者在长时间序列和区域、全球尺度上对陆地生态系统碳、水循环以及它们应对全球气候变化方面的研究提供了极大的便利(
氮添加对典型阔叶红松林凋落叶分解及养分释放的影响
1
2016
... Parameterization for Korean pine (PK) and broadleaved species (DB) ecophysiological parameters
| 参数 Parameter | 符号 Symbol | 红松基 准值 Basic value of Korean pine | 阔叶树 基准值 Basic value of broadleaf species | 单位 Unit | 来源 Source |
|---|---|---|---|---|---|
| 转移生长占生长季的比例 Transfer growth period | Tt | 0.3 | 0.2 | - | Biome-BGC V4.2 |
| 凋落过程占生长季的比例 Litterfall period | LFG | 0.3 | 0.2 | - | Biome-BGC V4.2 |
| 叶片与细根周转率 Annual leaf and fine root turnover fraction | LFRT | 0.32 | 1.0 | a-1 | |
| 活立木周转率 Annual live wood turnover fraction | LWT | 0.7 | 0.7 | a-1 | Biome-BGC V4.2 |
| 整株植物死亡率 Annual whole-plant mortality fraction | WPM | 0.009 0 | 0.021 3 | a-1 | |
| 火灾死亡率 Annual fire mortality fraction | FM | 0 | 0 | a-1 | Set by us |
| 细根与叶片碳分配比 New fine root C: leaf C | FRC:LC | 1.2 | 0.9 | - | |
| 新茎与新叶碳分配比 New stem C: leaf C | SC:LC | 1.4 | 2.4 | - | |
| 活立木与所有木质组织碳分配比 New live wood C: total wood C | LWC:TWC | 0.379 | 0.1 | - | |
| 粗根与新茎碳分配比 New coarse root C: stem C | CRC:SC | 0.29 | 0.23 | - | |
| 当前生长比例 Current growth proportion | CGP | 0.5 | 0.5 | - | Biome-BGC V4.2 |
| 叶片碳氮比 C:N of leaves | C:Nleaf | 34.30 | 17.55 | kg·kg-1 | Measured by us |
| 叶片凋落物碳氮比 C:N of falling leaf litter | C:Nlitter | 96.5 | 41.1 | kg·kg-1 | |
| 细根碳氮比 C:N of ?ne roots | C:Nfr | 56.4 | 47.4 | kg·kg-1 | |
| 活立木碳氮比 C:N of live wood | C:Nlw | 97.4 | 97.05 | kg·kg-1 | |
| 死立木碳氮比 C:N of dead wood | C:Ndw | 398 | 212 | kg·kg-1 | |
| 叶片凋落物易分解物质所占比 Leaf litter labile proportion | Llab | 0.45 | 0.53 | - | |
| 叶片凋落物纤维素所占比 Leaf litter cellulose proportion | Lcel | 0.25 | 0.22 | - | |
| 叶片凋落物木质素所占比 Leaf litter lignin proportion | Llig | 0.30 | 0.25 | - | |
| 细根中易分解物质所占比 Fine root labile proportion | FRlab | 0.34 | 0.30 | - | Biome-BGC V4.2 |
| 细根中纤维素所占比 Fine root cellulose proportion | FRcel | 0.44 | 0.45 | - | Biome-BGC V4.2 |
| 细根中木质素所占比 Fine root lignin proportion | FRlig | 0.22 | 0.25 | - | Biome-BGC V4.2 |
| 死立木中纤维素所占比 Dead wood cellulose proportion | DWcel | 0.73 | 0.76 | - | |
| 死立木中木质素所占比 Dead wood lignin proportion | DWlig | 0.27 | 0.24 | - | |
| 冠层截留系数 Water interception coef?cient | Wint | 0.045 | 0.033 | LAI-1·d-1 | |
| 冠层消光系数 Light extinction coef?cient | k | 0.50 | 0.58 | - | |
| 所有叶面积与投影叶面积之比 Ratio of all sided to projected leaf area | LAIall:proj | 2.6 | 2.0 | - | |
| 冠层平均比叶面积 Average speci?c leaf area | SLA | 16.4 | 54.2 | m2·kg-1 | Measured by us |
| 阴叶与阳叶比叶面积比 Ratio of shade SLA : sunlit SLA | SLAshd:sun | 2 | 2 | - | |
| Rubisco酶中叶氮含量 Fraction of leaf N in Rubisco | FLNR | 0.080 | 0.075 | - | |
| 最大气孔导度 Maximum stomatal conductance | Gsmax | 0.006 0 | 0.006 5 | m·s-1 | |
| 表皮导度 Cuticular conductance | Gcut | 0.000 06 | 0.000 01 | m·s-1 | |
| 边界层导度 Boundary layer conductance | Gbl | 0.09 | 0.01 | m·s-1 | |
| 气孔开始减小时叶片水势 Leaf water potential : start of gs reduction | LWPi | -0.65 | -0.34 | MPa | |
| 气孔停止减小时叶片水势 Leaf water potential : completion of gs reduction | LWPf | -2.5 | -2.2 | MPa | |
| 气孔开始减小时饱和水汽压差 Vapor pressure deficit : start of gs reduction | VPDi | 610 | 1 100 | Pa | |
| 气孔停止减小时饱和水汽压差 Vapor pressure deficit : completion of gs reduction | VPDf | 3 100 | 3 600 | Pa |
1
2006
... Parameterization for Korean pine (PK) and broadleaved species (DB) ecophysiological parameters
| 参数 Parameter | 符号 Symbol | 红松基 准值 Basic value of Korean pine | 阔叶树 基准值 Basic value of broadleaf species | 单位 Unit | 来源 Source |
|---|---|---|---|---|---|
| 转移生长占生长季的比例 Transfer growth period | Tt | 0.3 | 0.2 | - | Biome-BGC V4.2 |
| 凋落过程占生长季的比例 Litterfall period | LFG | 0.3 | 0.2 | - | Biome-BGC V4.2 |
| 叶片与细根周转率 Annual leaf and fine root turnover fraction | LFRT | 0.32 | 1.0 | a-1 | |
| 活立木周转率 Annual live wood turnover fraction | LWT | 0.7 | 0.7 | a-1 | Biome-BGC V4.2 |
| 整株植物死亡率 Annual whole-plant mortality fraction | WPM | 0.009 0 | 0.021 3 | a-1 | |
| 火灾死亡率 Annual fire mortality fraction | FM | 0 | 0 | a-1 | Set by us |
| 细根与叶片碳分配比 New fine root C: leaf C | FRC:LC | 1.2 | 0.9 | - | |
| 新茎与新叶碳分配比 New stem C: leaf C | SC:LC | 1.4 | 2.4 | - | |
| 活立木与所有木质组织碳分配比 New live wood C: total wood C | LWC:TWC | 0.379 | 0.1 | - | |
| 粗根与新茎碳分配比 New coarse root C: stem C | CRC:SC | 0.29 | 0.23 | - | |
| 当前生长比例 Current growth proportion | CGP | 0.5 | 0.5 | - | Biome-BGC V4.2 |
| 叶片碳氮比 C:N of leaves | C:Nleaf | 34.30 | 17.55 | kg·kg-1 | Measured by us |
| 叶片凋落物碳氮比 C:N of falling leaf litter | C:Nlitter | 96.5 | 41.1 | kg·kg-1 | |
| 细根碳氮比 C:N of ?ne roots | C:Nfr | 56.4 | 47.4 | kg·kg-1 | |
| 活立木碳氮比 C:N of live wood | C:Nlw | 97.4 | 97.05 | kg·kg-1 | |
| 死立木碳氮比 C:N of dead wood | C:Ndw | 398 | 212 | kg·kg-1 | |
| 叶片凋落物易分解物质所占比 Leaf litter labile proportion | Llab | 0.45 | 0.53 | - | |
| 叶片凋落物纤维素所占比 Leaf litter cellulose proportion | Lcel | 0.25 | 0.22 | - | |
| 叶片凋落物木质素所占比 Leaf litter lignin proportion | Llig | 0.30 | 0.25 | - | |
| 细根中易分解物质所占比 Fine root labile proportion | FRlab | 0.34 | 0.30 | - | Biome-BGC V4.2 |
| 细根中纤维素所占比 Fine root cellulose proportion | FRcel | 0.44 | 0.45 | - | Biome-BGC V4.2 |
| 细根中木质素所占比 Fine root lignin proportion | FRlig | 0.22 | 0.25 | - | Biome-BGC V4.2 |
| 死立木中纤维素所占比 Dead wood cellulose proportion | DWcel | 0.73 | 0.76 | - | |
| 死立木中木质素所占比 Dead wood lignin proportion | DWlig | 0.27 | 0.24 | - | |
| 冠层截留系数 Water interception coef?cient | Wint | 0.045 | 0.033 | LAI-1·d-1 | |
| 冠层消光系数 Light extinction coef?cient | k | 0.50 | 0.58 | - | |
| 所有叶面积与投影叶面积之比 Ratio of all sided to projected leaf area | LAIall:proj | 2.6 | 2.0 | - | |
| 冠层平均比叶面积 Average speci?c leaf area | SLA | 16.4 | 54.2 | m2·kg-1 | Measured by us |
| 阴叶与阳叶比叶面积比 Ratio of shade SLA : sunlit SLA | SLAshd:sun | 2 | 2 | - | |
| Rubisco酶中叶氮含量 Fraction of leaf N in Rubisco | FLNR | 0.080 | 0.075 | - | |
| 最大气孔导度 Maximum stomatal conductance | Gsmax | 0.006 0 | 0.006 5 | m·s-1 | |
| 表皮导度 Cuticular conductance | Gcut | 0.000 06 | 0.000 01 | m·s-1 | |
| 边界层导度 Boundary layer conductance | Gbl | 0.09 | 0.01 | m·s-1 | |
| 气孔开始减小时叶片水势 Leaf water potential : start of gs reduction | LWPi | -0.65 | -0.34 | MPa | |
| 气孔停止减小时叶片水势 Leaf water potential : completion of gs reduction | LWPf | -2.5 | -2.2 | MPa | |
| 气孔开始减小时饱和水汽压差 Vapor pressure deficit : start of gs reduction | VPDi | 610 | 1 100 | Pa | |
| 气孔停止减小时饱和水汽压差 Vapor pressure deficit : completion of gs reduction | VPDf | 3 100 | 3 600 | Pa |
Simulation and sensitivity analysis of carbon storage and fluxes in the New Jersey Pinelands
2
2011
... 近些年来, 生态过程模型的发展为研究者在长时间序列和区域、全球尺度上对陆地生态系统碳、水循环以及它们应对全球气候变化方面的研究提供了极大的便利(
... 模型参数敏感性分析包括局部敏感性分析和全局敏感性分析(
Uncertainty assessment of the model RICEWQ in northern Italy
1
2004
... 近些年来, 生态过程模型的发展为研究者在长时间序列和区域、全球尺度上对陆地生态系统碳、水循环以及它们应对全球气候变化方面的研究提供了极大的便利(
Carbon stock of larch plantations and its comparison with an old-growth forest in Northeast China
1
2016
... 本研究地点在吉林省抚松县露水河林业局(127.48°-128.03° E, 42.40°-42.82° N), 其位于长白山自然保护区西北麓, 总经营面积120 934 hm2.该区域属温带大陆性季风气候, 温度和降水季节变化显著, 降水集中在夏季, 年降水量为800-1 040 mm, 年平均气温4.5-7.8 ℃, 平均相对湿度为70%-75%.土壤类型为山地暗棕色森林土(
Variance-based sensitivity analysis of BIOME-BGC for gross and net primary production
4
2014
... 生物地球化学循环模型(Biome-BGC)是一个典型的参数众多的生理生态过程模型, 它能够模拟不同植被类型的碳通量和水通量.目前关于该模型的敏感性分析已有一些报道, 多是采用局部敏感性分析的方法, 分析单个参数变化对模拟的年净初级生产力(NPP)的影响(
... 影响红松模拟NPP的敏感参数依次为LAIall:proj、C:Nfr、Wint、LFRT、FLNR、SLA和C:Nleaf.影响阔叶树NPP的敏感参数有C:Nleaf、SLA、Gsmax、C:Nlitter、C:Nfr、SC:LC以及Wint.早前的研究中,
... 那么这几个参数是如何影响模型模拟结果的呢? 具体来讲, 首先, 在Biome-BGC模型的光合作用模块中, C:Nleaf、FLNR和SLA这3个参数决定了最大羧化速率的大小, 而1,5-二磷酸羧核酮糖羧化/加氧酶(Rubisco酶)直接影响到植被固定大气CO2的第一步(羧化作用), 羧化速率为状态变量, 其本身具有较高的空间异质性且难以获取(
... 除了上述相同的敏感参数, 其他对植被NPP表现出敏感性的参数会随着研究对象和研究地区而变化.如本文中红松和阔叶树NPP对FRC:LC不敏感, 而在其他研究中FRC:LC则为敏感参数(
基于Extend FAST方法的新安江模型参数全局敏感性分析
1
2010
... 模型参数敏感性分析包括局部敏感性分析和全局敏感性分析(
基于Extend FAST方法的新安江模型参数全局敏感性分析
1
2010
... 模型参数敏感性分析包括局部敏感性分析和全局敏感性分析(
A general model of forest ecosystem processes for regional applications I. Hydrologic balance, canopy gas exchange and primary production processes
1
1988
... Biome-BGC模型是美国蒙大拿大学陆地动态数值模拟小组(Numerical Terradynamic Simulation Group, NTSG)研发的生理生态过程模型, 由Forest-BGC模型(
Sensitivity analysis for importance assessment
1
2002
... 其中, VY是模型模拟结果的总方差, Vi是单个因子的方差, Vij-V12···n是参数之间交互作用的方差.参数Xi对模型输出结果总方差的直接贡献可用一阶敏感性指数表示: 即Si = Vi/VY, 而Xi的全局敏感性指数为参数的一阶敏感性以及该参数与其他参数相互作用的各阶敏感性指数之和(
小兴安岭南坡红松林动态模拟
1
1998
... Parameterization for Korean pine (PK) and broadleaved species (DB) ecophysiological parameters
| 参数 Parameter | 符号 Symbol | 红松基 准值 Basic value of Korean pine | 阔叶树 基准值 Basic value of broadleaf species | 单位 Unit | 来源 Source |
|---|---|---|---|---|---|
| 转移生长占生长季的比例 Transfer growth period | Tt | 0.3 | 0.2 | - | Biome-BGC V4.2 |
| 凋落过程占生长季的比例 Litterfall period | LFG | 0.3 | 0.2 | - | Biome-BGC V4.2 |
| 叶片与细根周转率 Annual leaf and fine root turnover fraction | LFRT | 0.32 | 1.0 | a-1 | |
| 活立木周转率 Annual live wood turnover fraction | LWT | 0.7 | 0.7 | a-1 | Biome-BGC V4.2 |
| 整株植物死亡率 Annual whole-plant mortality fraction | WPM | 0.009 0 | 0.021 3 | a-1 | |
| 火灾死亡率 Annual fire mortality fraction | FM | 0 | 0 | a-1 | Set by us |
| 细根与叶片碳分配比 New fine root C: leaf C | FRC:LC | 1.2 | 0.9 | - | |
| 新茎与新叶碳分配比 New stem C: leaf C | SC:LC | 1.4 | 2.4 | - | |
| 活立木与所有木质组织碳分配比 New live wood C: total wood C | LWC:TWC | 0.379 | 0.1 | - | |
| 粗根与新茎碳分配比 New coarse root C: stem C | CRC:SC | 0.29 | 0.23 | - | |
| 当前生长比例 Current growth proportion | CGP | 0.5 | 0.5 | - | Biome-BGC V4.2 |
| 叶片碳氮比 C:N of leaves | C:Nleaf | 34.30 | 17.55 | kg·kg-1 | Measured by us |
| 叶片凋落物碳氮比 C:N of falling leaf litter | C:Nlitter | 96.5 | 41.1 | kg·kg-1 | |
| 细根碳氮比 C:N of ?ne roots | C:Nfr | 56.4 | 47.4 | kg·kg-1 | |
| 活立木碳氮比 C:N of live wood | C:Nlw | 97.4 | 97.05 | kg·kg-1 | |
| 死立木碳氮比 C:N of dead wood | C:Ndw | 398 | 212 | kg·kg-1 | |
| 叶片凋落物易分解物质所占比 Leaf litter labile proportion | Llab | 0.45 | 0.53 | - | |
| 叶片凋落物纤维素所占比 Leaf litter cellulose proportion | Lcel | 0.25 | 0.22 | - | |
| 叶片凋落物木质素所占比 Leaf litter lignin proportion | Llig | 0.30 | 0.25 | - | |
| 细根中易分解物质所占比 Fine root labile proportion | FRlab | 0.34 | 0.30 | - | Biome-BGC V4.2 |
| 细根中纤维素所占比 Fine root cellulose proportion | FRcel | 0.44 | 0.45 | - | Biome-BGC V4.2 |
| 细根中木质素所占比 Fine root lignin proportion | FRlig | 0.22 | 0.25 | - | Biome-BGC V4.2 |
| 死立木中纤维素所占比 Dead wood cellulose proportion | DWcel | 0.73 | 0.76 | - | |
| 死立木中木质素所占比 Dead wood lignin proportion | DWlig | 0.27 | 0.24 | - | |
| 冠层截留系数 Water interception coef?cient | Wint | 0.045 | 0.033 | LAI-1·d-1 | |
| 冠层消光系数 Light extinction coef?cient | k | 0.50 | 0.58 | - | |
| 所有叶面积与投影叶面积之比 Ratio of all sided to projected leaf area | LAIall:proj | 2.6 | 2.0 | - | |
| 冠层平均比叶面积 Average speci?c leaf area | SLA | 16.4 | 54.2 | m2·kg-1 | Measured by us |
| 阴叶与阳叶比叶面积比 Ratio of shade SLA : sunlit SLA | SLAshd:sun | 2 | 2 | - | |
| Rubisco酶中叶氮含量 Fraction of leaf N in Rubisco | FLNR | 0.080 | 0.075 | - | |
| 最大气孔导度 Maximum stomatal conductance | Gsmax | 0.006 0 | 0.006 5 | m·s-1 | |
| 表皮导度 Cuticular conductance | Gcut | 0.000 06 | 0.000 01 | m·s-1 | |
| 边界层导度 Boundary layer conductance | Gbl | 0.09 | 0.01 | m·s-1 | |
| 气孔开始减小时叶片水势 Leaf water potential : start of gs reduction | LWPi | -0.65 | -0.34 | MPa | |
| 气孔停止减小时叶片水势 Leaf water potential : completion of gs reduction | LWPf | -2.5 | -2.2 | MPa | |
| 气孔开始减小时饱和水汽压差 Vapor pressure deficit : start of gs reduction | VPDi | 610 | 1 100 | Pa | |
| 气孔停止减小时饱和水汽压差 Vapor pressure deficit : completion of gs reduction | VPDf | 3 100 | 3 600 | Pa |
Analyzing the carbon dynamics of central European forests: Comparison of Biome-BGC simulations with measurements
1
2006
... 初始化文件主要包括经纬度、海拔、土壤质地、土壤有效深度等样地信息和其他状态变量的设定, 样地信息根据实际调查获取.由于研究区无气象站, 所以本文的气象驱动数据来源于中国气象科学数据共享服务网(http://data.cma.cn/data/cdcindex.html)发布的吉林省二道气象站的气象资料, 时间尺度为1958-2015年.对于不能直接从气象站获取的气象因子, 则根据日最高气温、日最低气温、日降水量, 利用小型山地气候模型(MTCLIM 4.3)估算得到.对于生理生态参数, 一部分通过实测获取; 另一部分则通过搜集已有文献数据得到; 个别不易获取且没有相关文献数据的参数采用模型缺省值.Biome-BGC模型没有针对阔叶红松林(针阔混交林)的生理生态参数, 借鉴已有研究的处理方法(
Sensitivity estimates for nonlinear mathematical models
1
1993
... 本研究采用EFAST法对模型中的生理生态参数进行敏感性分析.EFAST是基于方差的定量敏感性分析方法, 它结合了FAST方法(
Asymmetric warming significantly affects net primary production, but not ecosystem carbon balances of forest and grassland ecosystems in northern China
3
2015
... Parameterization for Korean pine (PK) and broadleaved species (DB) ecophysiological parameters
| 参数 Parameter | 符号 Symbol | 红松基 准值 Basic value of Korean pine | 阔叶树 基准值 Basic value of broadleaf species | 单位 Unit | 来源 Source |
|---|---|---|---|---|---|
| 转移生长占生长季的比例 Transfer growth period | Tt | 0.3 | 0.2 | - | Biome-BGC V4.2 |
| 凋落过程占生长季的比例 Litterfall period | LFG | 0.3 | 0.2 | - | Biome-BGC V4.2 |
| 叶片与细根周转率 Annual leaf and fine root turnover fraction | LFRT | 0.32 | 1.0 | a-1 | |
| 活立木周转率 Annual live wood turnover fraction | LWT | 0.7 | 0.7 | a-1 | Biome-BGC V4.2 |
| 整株植物死亡率 Annual whole-plant mortality fraction | WPM | 0.009 0 | 0.021 3 | a-1 | |
| 火灾死亡率 Annual fire mortality fraction | FM | 0 | 0 | a-1 | Set by us |
| 细根与叶片碳分配比 New fine root C: leaf C | FRC:LC | 1.2 | 0.9 | - | |
| 新茎与新叶碳分配比 New stem C: leaf C | SC:LC | 1.4 | 2.4 | - | |
| 活立木与所有木质组织碳分配比 New live wood C: total wood C | LWC:TWC | 0.379 | 0.1 | - | |
| 粗根与新茎碳分配比 New coarse root C: stem C | CRC:SC | 0.29 | 0.23 | - | |
| 当前生长比例 Current growth proportion | CGP | 0.5 | 0.5 | - | Biome-BGC V4.2 |
| 叶片碳氮比 C:N of leaves | C:Nleaf | 34.30 | 17.55 | kg·kg-1 | Measured by us |
| 叶片凋落物碳氮比 C:N of falling leaf litter | C:Nlitter | 96.5 | 41.1 | kg·kg-1 | |
| 细根碳氮比 C:N of ?ne roots | C:Nfr | 56.4 | 47.4 | kg·kg-1 | |
| 活立木碳氮比 C:N of live wood | C:Nlw | 97.4 | 97.05 | kg·kg-1 | |
| 死立木碳氮比 C:N of dead wood | C:Ndw | 398 | 212 | kg·kg-1 | |
| 叶片凋落物易分解物质所占比 Leaf litter labile proportion | Llab | 0.45 | 0.53 | - | |
| 叶片凋落物纤维素所占比 Leaf litter cellulose proportion | Lcel | 0.25 | 0.22 | - | |
| 叶片凋落物木质素所占比 Leaf litter lignin proportion | Llig | 0.30 | 0.25 | - | |
| 细根中易分解物质所占比 Fine root labile proportion | FRlab | 0.34 | 0.30 | - | Biome-BGC V4.2 |
| 细根中纤维素所占比 Fine root cellulose proportion | FRcel | 0.44 | 0.45 | - | Biome-BGC V4.2 |
| 细根中木质素所占比 Fine root lignin proportion | FRlig | 0.22 | 0.25 | - | Biome-BGC V4.2 |
| 死立木中纤维素所占比 Dead wood cellulose proportion | DWcel | 0.73 | 0.76 | - | |
| 死立木中木质素所占比 Dead wood lignin proportion | DWlig | 0.27 | 0.24 | - | |
| 冠层截留系数 Water interception coef?cient | Wint | 0.045 | 0.033 | LAI-1·d-1 | |
| 冠层消光系数 Light extinction coef?cient | k | 0.50 | 0.58 | - | |
| 所有叶面积与投影叶面积之比 Ratio of all sided to projected leaf area | LAIall:proj | 2.6 | 2.0 | - | |
| 冠层平均比叶面积 Average speci?c leaf area | SLA | 16.4 | 54.2 | m2·kg-1 | Measured by us |
| 阴叶与阳叶比叶面积比 Ratio of shade SLA : sunlit SLA | SLAshd:sun | 2 | 2 | - | |
| Rubisco酶中叶氮含量 Fraction of leaf N in Rubisco | FLNR | 0.080 | 0.075 | - | |
| 最大气孔导度 Maximum stomatal conductance | Gsmax | 0.006 0 | 0.006 5 | m·s-1 | |
| 表皮导度 Cuticular conductance | Gcut | 0.000 06 | 0.000 01 | m·s-1 | |
| 边界层导度 Boundary layer conductance | Gbl | 0.09 | 0.01 | m·s-1 | |
| 气孔开始减小时叶片水势 Leaf water potential : start of gs reduction | LWPi | -0.65 | -0.34 | MPa | |
| 气孔停止减小时叶片水势 Leaf water potential : completion of gs reduction | LWPf | -2.5 | -2.2 | MPa | |
| 气孔开始减小时饱和水汽压差 Vapor pressure deficit : start of gs reduction | VPDi | 610 | 1 100 | Pa | |
| 气孔停止减小时饱和水汽压差 Vapor pressure deficit : completion of gs reduction | VPDf | 3 100 | 3 600 | Pa |
...
Vapor pressure deficit : completion of gs reduction
...
Vapor pressure deficit : completion of gs reduction
1
2017
... 模型参数敏感性分析包括局部敏感性分析和全局敏感性分析(
1
2017
... 模型参数敏感性分析包括局部敏感性分析和全局敏感性分析(
Application of BIOME-BGC model to managed forests: 1. Sensitivity analysis
4
2006
... 生物地球化学循环模型(Biome-BGC)是一个典型的参数众多的生理生态过程模型, 它能够模拟不同植被类型的碳通量和水通量.目前关于该模型的敏感性分析已有一些报道, 多是采用局部敏感性分析的方法, 分析单个参数变化对模拟的年净初级生产力(NPP)的影响(
... 文中借助敏感性和不确定性分析软件SimLab 2.2实现对Biome-BGC模型参数的敏感性分析.根据各个输入参数的分布范围, 利用Monte Carlo方法对各参数进行随机采样, 本研究设定每个参数的采样次数为130次(EFAST方法认为每个参数的采样次数大于65次的分析结果才有效), 所以在对红松和阔叶树进行模拟时, 生理生态参数的采样次数分别为4 030 (130 × 31)次和3 900 (130 × 30)次.根据生成的多组输入参数, 批量运行Biome-BGC模型, 模拟得到多组红松和阔叶树58年(1958-2015)的NPP和ET, 并计算NPP和ET的多年平均值, 进而输入到SimLab中通过EFAST模块进行敏感性分析.最终将敏感性指数分为3个等级, 大于0.2为高敏感性指数, 介于0.1到0.2之间为中敏感性指数, 小于0.1则不敏感(
... 影响红松模拟NPP的敏感参数依次为LAIall:proj、C:Nfr、Wint、LFRT、FLNR、SLA和C:Nleaf.影响阔叶树NPP的敏感参数有C:Nleaf、SLA、Gsmax、C:Nlitter、C:Nfr、SC:LC以及Wint.早前的研究中,
... 除了上述相同的敏感参数, 其他对植被NPP表现出敏感性的参数会随着研究对象和研究地区而变化.如本文中红松和阔叶树NPP对FRC:LC不敏感, 而在其他研究中FRC:LC则为敏感参数(
Modeling and measuring the effects of disturbance history and climate on carbon and water budgets in evergreen needleleaf forests
1
2002
... 近些年来, 生态过程模型的发展为研究者在长时间序列和区域、全球尺度上对陆地生态系统碳、水循环以及它们应对全球气候变化方面的研究提供了极大的便利(
Model estimates of net primary productivity, evapotranspiration, and water use efficiency in the terrestrial ecosystems of the southern United States during 1895-2007
1
2010
... 近些年来, 生态过程模型的发展为研究者在长时间序列和区域、全球尺度上对陆地生态系统碳、水循环以及它们应对全球气候变化方面的研究提供了极大的便利(
长白山露水河林区乔木层生物量及生产力研究
1
2016
... 本研究地点在吉林省抚松县露水河林业局(127.48°-128.03° E, 42.40°-42.82° N), 其位于长白山自然保护区西北麓, 总经营面积120 934 hm2.该区域属温带大陆性季风气候, 温度和降水季节变化显著, 降水集中在夏季, 年降水量为800-1 040 mm, 年平均气温4.5-7.8 ℃, 平均相对湿度为70%-75%.土壤类型为山地暗棕色森林土(
长白山露水河林区乔木层生物量及生产力研究
1
2016
... 本研究地点在吉林省抚松县露水河林业局(127.48°-128.03° E, 42.40°-42.82° N), 其位于长白山自然保护区西北麓, 总经营面积120 934 hm2.该区域属温带大陆性季风气候, 温度和降水季节变化显著, 降水集中在夏季, 年降水量为800-1 040 mm, 年平均气温4.5-7.8 ℃, 平均相对湿度为70%-75%.土壤类型为山地暗棕色森林土(
Parameterization and sensitivity analysis of the BIOME- BGC terrestrial ecosystem model: Net primary production controls
12
2000
... 生物地球化学循环模型(Biome-BGC)是一个典型的参数众多的生理生态过程模型, 它能够模拟不同植被类型的碳通量和水通量.目前关于该模型的敏感性分析已有一些报道, 多是采用局部敏感性分析的方法, 分析单个参数变化对模拟的年净初级生产力(NPP)的影响(
... 本文主要针对模型的生理生态参数进行敏感性分析.首先根据实际情况选出要进行敏感性分析的参数, 对于用来表征植被类型或光合特征等标记性参数和固定组合比例的参数不进行敏感性分析.本文设定火灾死亡率均为0, 故也不参与敏感性分析.最终分别选出31个参数和30个参数参与对红松和阔叶树的NPP和ET的敏感性分析.其次确定各个参数的取值范围, 由于Biome-BGC模型没有给出每个参数的具体取值范围, 所以本文根据
... Parameterization for Korean pine (PK) and broadleaved species (DB) ecophysiological parameters
| 参数 Parameter | 符号 Symbol | 红松基 准值 Basic value of Korean pine | 阔叶树 基准值 Basic value of broadleaf species | 单位 Unit | 来源 Source |
|---|---|---|---|---|---|
| 转移生长占生长季的比例 Transfer growth period | Tt | 0.3 | 0.2 | - | Biome-BGC V4.2 |
| 凋落过程占生长季的比例 Litterfall period | LFG | 0.3 | 0.2 | - | Biome-BGC V4.2 |
| 叶片与细根周转率 Annual leaf and fine root turnover fraction | LFRT | 0.32 | 1.0 | a-1 | |
| 活立木周转率 Annual live wood turnover fraction | LWT | 0.7 | 0.7 | a-1 | Biome-BGC V4.2 |
| 整株植物死亡率 Annual whole-plant mortality fraction | WPM | 0.009 0 | 0.021 3 | a-1 | |
| 火灾死亡率 Annual fire mortality fraction | FM | 0 | 0 | a-1 | Set by us |
| 细根与叶片碳分配比 New fine root C: leaf C | FRC:LC | 1.2 | 0.9 | - | |
| 新茎与新叶碳分配比 New stem C: leaf C | SC:LC | 1.4 | 2.4 | - | |
| 活立木与所有木质组织碳分配比 New live wood C: total wood C | LWC:TWC | 0.379 | 0.1 | - | |
| 粗根与新茎碳分配比 New coarse root C: stem C | CRC:SC | 0.29 | 0.23 | - | |
| 当前生长比例 Current growth proportion | CGP | 0.5 | 0.5 | - | Biome-BGC V4.2 |
| 叶片碳氮比 C:N of leaves | C:Nleaf | 34.30 | 17.55 | kg·kg-1 | Measured by us |
| 叶片凋落物碳氮比 C:N of falling leaf litter | C:Nlitter | 96.5 | 41.1 | kg·kg-1 | |
| 细根碳氮比 C:N of ?ne roots | C:Nfr | 56.4 | 47.4 | kg·kg-1 | |
| 活立木碳氮比 C:N of live wood | C:Nlw | 97.4 | 97.05 | kg·kg-1 | |
| 死立木碳氮比 C:N of dead wood | C:Ndw | 398 | 212 | kg·kg-1 | |
| 叶片凋落物易分解物质所占比 Leaf litter labile proportion | Llab | 0.45 | 0.53 | - | |
| 叶片凋落物纤维素所占比 Leaf litter cellulose proportion | Lcel | 0.25 | 0.22 | - | |
| 叶片凋落物木质素所占比 Leaf litter lignin proportion | Llig | 0.30 | 0.25 | - | |
| 细根中易分解物质所占比 Fine root labile proportion | FRlab | 0.34 | 0.30 | - | Biome-BGC V4.2 |
| 细根中纤维素所占比 Fine root cellulose proportion | FRcel | 0.44 | 0.45 | - | Biome-BGC V4.2 |
| 细根中木质素所占比 Fine root lignin proportion | FRlig | 0.22 | 0.25 | - | Biome-BGC V4.2 |
| 死立木中纤维素所占比 Dead wood cellulose proportion | DWcel | 0.73 | 0.76 | - | |
| 死立木中木质素所占比 Dead wood lignin proportion | DWlig | 0.27 | 0.24 | - | |
| 冠层截留系数 Water interception coef?cient | Wint | 0.045 | 0.033 | LAI-1·d-1 | |
| 冠层消光系数 Light extinction coef?cient | k | 0.50 | 0.58 | - | |
| 所有叶面积与投影叶面积之比 Ratio of all sided to projected leaf area | LAIall:proj | 2.6 | 2.0 | - | |
| 冠层平均比叶面积 Average speci?c leaf area | SLA | 16.4 | 54.2 | m2·kg-1 | Measured by us |
| 阴叶与阳叶比叶面积比 Ratio of shade SLA : sunlit SLA | SLAshd:sun | 2 | 2 | - | |
| Rubisco酶中叶氮含量 Fraction of leaf N in Rubisco | FLNR | 0.080 | 0.075 | - | |
| 最大气孔导度 Maximum stomatal conductance | Gsmax | 0.006 0 | 0.006 5 | m·s-1 | |
| 表皮导度 Cuticular conductance | Gcut | 0.000 06 | 0.000 01 | m·s-1 | |
| 边界层导度 Boundary layer conductance | Gbl | 0.09 | 0.01 | m·s-1 | |
| 气孔开始减小时叶片水势 Leaf water potential : start of gs reduction | LWPi | -0.65 | -0.34 | MPa | |
| 气孔停止减小时叶片水势 Leaf water potential : completion of gs reduction | LWPf | -2.5 | -2.2 | MPa | |
| 气孔开始减小时饱和水汽压差 Vapor pressure deficit : start of gs reduction | VPDi | 610 | 1 100 | Pa | |
| 气孔停止减小时饱和水汽压差 Vapor pressure deficit : completion of gs reduction | VPDf | 3 100 | 3 600 | Pa |
...
Vapor pressure deficit : completion of gs reduction
...
Vapor pressure deficit : completion of gs reduction
...
Vapor pressure deficit : completion of gs reduction
...
Vapor pressure deficit : completion of gs reduction
...
Vapor pressure deficit : completion of gs reduction
...
Vapor pressure deficit : completion of gs reduction
...
... 影响红松模拟NPP的敏感参数依次为LAIall:proj、C:Nfr、Wint、LFRT、FLNR、SLA和C:Nleaf.影响阔叶树NPP的敏感参数有C:Nleaf、SLA、Gsmax、C:Nlitter、C:Nfr、SC:LC以及Wint.早前的研究中,
... 那么这几个参数是如何影响模型模拟结果的呢? 具体来讲, 首先, 在Biome-BGC模型的光合作用模块中, C:Nleaf、FLNR和SLA这3个参数决定了最大羧化速率的大小, 而1,5-二磷酸羧核酮糖羧化/加氧酶(Rubisco酶)直接影响到植被固定大气CO2的第一步(羧化作用), 羧化速率为状态变量, 其本身具有较高的空间异质性且难以获取(
A test of BIOME-BGC with dendrochronology for forests along the altitudinal gradient of Mt. Changbai in Northeast China
3
2017
... Parameterization for Korean pine (PK) and broadleaved species (DB) ecophysiological parameters
| 参数 Parameter | 符号 Symbol | 红松基 准值 Basic value of Korean pine | 阔叶树 基准值 Basic value of broadleaf species | 单位 Unit | 来源 Source |
|---|---|---|---|---|---|
| 转移生长占生长季的比例 Transfer growth period | Tt | 0.3 | 0.2 | - | Biome-BGC V4.2 |
| 凋落过程占生长季的比例 Litterfall period | LFG | 0.3 | 0.2 | - | Biome-BGC V4.2 |
| 叶片与细根周转率 Annual leaf and fine root turnover fraction | LFRT | 0.32 | 1.0 | a-1 | |
| 活立木周转率 Annual live wood turnover fraction | LWT | 0.7 | 0.7 | a-1 | Biome-BGC V4.2 |
| 整株植物死亡率 Annual whole-plant mortality fraction | WPM | 0.009 0 | 0.021 3 | a-1 | |
| 火灾死亡率 Annual fire mortality fraction | FM | 0 | 0 | a-1 | Set by us |
| 细根与叶片碳分配比 New fine root C: leaf C | FRC:LC | 1.2 | 0.9 | - | |
| 新茎与新叶碳分配比 New stem C: leaf C | SC:LC | 1.4 | 2.4 | - | |
| 活立木与所有木质组织碳分配比 New live wood C: total wood C | LWC:TWC | 0.379 | 0.1 | - | |
| 粗根与新茎碳分配比 New coarse root C: stem C | CRC:SC | 0.29 | 0.23 | - | |
| 当前生长比例 Current growth proportion | CGP | 0.5 | 0.5 | - | Biome-BGC V4.2 |
| 叶片碳氮比 C:N of leaves | C:Nleaf | 34.30 | 17.55 | kg·kg-1 | Measured by us |
| 叶片凋落物碳氮比 C:N of falling leaf litter | C:Nlitter | 96.5 | 41.1 | kg·kg-1 | |
| 细根碳氮比 C:N of ?ne roots | C:Nfr | 56.4 | 47.4 | kg·kg-1 | |
| 活立木碳氮比 C:N of live wood | C:Nlw | 97.4 | 97.05 | kg·kg-1 | |
| 死立木碳氮比 C:N of dead wood | C:Ndw | 398 | 212 | kg·kg-1 | |
| 叶片凋落物易分解物质所占比 Leaf litter labile proportion | Llab | 0.45 | 0.53 | - | |
| 叶片凋落物纤维素所占比 Leaf litter cellulose proportion | Lcel | 0.25 | 0.22 | - | |
| 叶片凋落物木质素所占比 Leaf litter lignin proportion | Llig | 0.30 | 0.25 | - | |
| 细根中易分解物质所占比 Fine root labile proportion | FRlab | 0.34 | 0.30 | - | Biome-BGC V4.2 |
| 细根中纤维素所占比 Fine root cellulose proportion | FRcel | 0.44 | 0.45 | - | Biome-BGC V4.2 |
| 细根中木质素所占比 Fine root lignin proportion | FRlig | 0.22 | 0.25 | - | Biome-BGC V4.2 |
| 死立木中纤维素所占比 Dead wood cellulose proportion | DWcel | 0.73 | 0.76 | - | |
| 死立木中木质素所占比 Dead wood lignin proportion | DWlig | 0.27 | 0.24 | - | |
| 冠层截留系数 Water interception coef?cient | Wint | 0.045 | 0.033 | LAI-1·d-1 | |
| 冠层消光系数 Light extinction coef?cient | k | 0.50 | 0.58 | - | |
| 所有叶面积与投影叶面积之比 Ratio of all sided to projected leaf area | LAIall:proj | 2.6 | 2.0 | - | |
| 冠层平均比叶面积 Average speci?c leaf area | SLA | 16.4 | 54.2 | m2·kg-1 | Measured by us |
| 阴叶与阳叶比叶面积比 Ratio of shade SLA : sunlit SLA | SLAshd:sun | 2 | 2 | - | |
| Rubisco酶中叶氮含量 Fraction of leaf N in Rubisco | FLNR | 0.080 | 0.075 | - | |
| 最大气孔导度 Maximum stomatal conductance | Gsmax | 0.006 0 | 0.006 5 | m·s-1 | |
| 表皮导度 Cuticular conductance | Gcut | 0.000 06 | 0.000 01 | m·s-1 | |
| 边界层导度 Boundary layer conductance | Gbl | 0.09 | 0.01 | m·s-1 | |
| 气孔开始减小时叶片水势 Leaf water potential : start of gs reduction | LWPi | -0.65 | -0.34 | MPa | |
| 气孔停止减小时叶片水势 Leaf water potential : completion of gs reduction | LWPf | -2.5 | -2.2 | MPa | |
| 气孔开始减小时饱和水汽压差 Vapor pressure deficit : start of gs reduction | VPDi | 610 | 1 100 | Pa | |
| 气孔停止减小时饱和水汽压差 Vapor pressure deficit : completion of gs reduction | VPDf | 3 100 | 3 600 | Pa |
...
Vapor pressure deficit : completion of gs reduction
...
Vapor pressure deficit : completion of gs reduction
基于EFAST方法的AquaCrop作物模型参数全局敏感性分析
1
2017
... 模型参数敏感性分析包括局部敏感性分析和全局敏感性分析(
基于EFAST方法的AquaCrop作物模型参数全局敏感性分析
1
2017
... 模型参数敏感性分析包括局部敏感性分析和全局敏感性分析(
生态模型的灵敏度分析
3
2004
... 近些年来, 生态过程模型的发展为研究者在长时间序列和区域、全球尺度上对陆地生态系统碳、水循环以及它们应对全球气候变化方面的研究提供了极大的便利(
... 模型参数敏感性分析包括局部敏感性分析和全局敏感性分析(
... 本研究采用EFAST法对模型中的生理生态参数进行敏感性分析.EFAST是基于方差的定量敏感性分析方法, 它结合了FAST方法(
生态模型的灵敏度分析
3
2004
... 近些年来, 生态过程模型的发展为研究者在长时间序列和区域、全球尺度上对陆地生态系统碳、水循环以及它们应对全球气候变化方面的研究提供了极大的便利(
... 模型参数敏感性分析包括局部敏感性分析和全局敏感性分析(
... 本研究采用EFAST法对模型中的生理生态参数进行敏感性分析.EFAST是基于方差的定量敏感性分析方法, 它结合了FAST方法(
3
2016
... 生物地球化学循环模型(Biome-BGC)是一个典型的参数众多的生理生态过程模型, 它能够模拟不同植被类型的碳通量和水通量.目前关于该模型的敏感性分析已有一些报道, 多是采用局部敏感性分析的方法, 分析单个参数变化对模拟的年净初级生产力(NPP)的影响(
... 其中, VY是模型模拟结果的总方差, Vi是单个因子的方差, Vij-V12···n是参数之间交互作用的方差.参数Xi对模型输出结果总方差的直接贡献可用一阶敏感性指数表示: 即Si = Vi/VY, 而Xi的全局敏感性指数为参数的一阶敏感性以及该参数与其他参数相互作用的各阶敏感性指数之和(
... 文中借助敏感性和不确定性分析软件SimLab 2.2实现对Biome-BGC模型参数的敏感性分析.根据各个输入参数的分布范围, 利用Monte Carlo方法对各参数进行随机采样, 本研究设定每个参数的采样次数为130次(EFAST方法认为每个参数的采样次数大于65次的分析结果才有效), 所以在对红松和阔叶树进行模拟时, 生理生态参数的采样次数分别为4 030 (130 × 31)次和3 900 (130 × 30)次.根据生成的多组输入参数, 批量运行Biome-BGC模型, 模拟得到多组红松和阔叶树58年(1958-2015)的NPP和ET, 并计算NPP和ET的多年平均值, 进而输入到SimLab中通过EFAST模块进行敏感性分析.最终将敏感性指数分为3个等级, 大于0.2为高敏感性指数, 介于0.1到0.2之间为中敏感性指数, 小于0.1则不敏感(
Simulation of forest carbon fluxes using model incorporation and data assimilation
2016
人工红松林三种林型生产力的研究
1
1986
... Parameterization for Korean pine (PK) and broadleaved species (DB) ecophysiological parameters
| 参数 Parameter | 符号 Symbol | 红松基 准值 Basic value of Korean pine | 阔叶树 基准值 Basic value of broadleaf species | 单位 Unit | 来源 Source |
|---|---|---|---|---|---|
| 转移生长占生长季的比例 Transfer growth period | Tt | 0.3 | 0.2 | - | Biome-BGC V4.2 |
| 凋落过程占生长季的比例 Litterfall period | LFG | 0.3 | 0.2 | - | Biome-BGC V4.2 |
| 叶片与细根周转率 Annual leaf and fine root turnover fraction | LFRT | 0.32 | 1.0 | a-1 | |
| 活立木周转率 Annual live wood turnover fraction | LWT | 0.7 | 0.7 | a-1 | Biome-BGC V4.2 |
| 整株植物死亡率 Annual whole-plant mortality fraction | WPM | 0.009 0 | 0.021 3 | a-1 | |
| 火灾死亡率 Annual fire mortality fraction | FM | 0 | 0 | a-1 | Set by us |
| 细根与叶片碳分配比 New fine root C: leaf C | FRC:LC | 1.2 | 0.9 | - | |
| 新茎与新叶碳分配比 New stem C: leaf C | SC:LC | 1.4 | 2.4 | - | |
| 活立木与所有木质组织碳分配比 New live wood C: total wood C | LWC:TWC | 0.379 | 0.1 | - | |
| 粗根与新茎碳分配比 New coarse root C: stem C | CRC:SC | 0.29 | 0.23 | - | |
| 当前生长比例 Current growth proportion | CGP | 0.5 | 0.5 | - | Biome-BGC V4.2 |
| 叶片碳氮比 C:N of leaves | C:Nleaf | 34.30 | 17.55 | kg·kg-1 | Measured by us |
| 叶片凋落物碳氮比 C:N of falling leaf litter | C:Nlitter | 96.5 | 41.1 | kg·kg-1 | |
| 细根碳氮比 C:N of ?ne roots | C:Nfr | 56.4 | 47.4 | kg·kg-1 | |
| 活立木碳氮比 C:N of live wood | C:Nlw | 97.4 | 97.05 | kg·kg-1 | |
| 死立木碳氮比 C:N of dead wood | C:Ndw | 398 | 212 | kg·kg-1 | |
| 叶片凋落物易分解物质所占比 Leaf litter labile proportion | Llab | 0.45 | 0.53 | - | |
| 叶片凋落物纤维素所占比 Leaf litter cellulose proportion | Lcel | 0.25 | 0.22 | - | |
| 叶片凋落物木质素所占比 Leaf litter lignin proportion | Llig | 0.30 | 0.25 | - | |
| 细根中易分解物质所占比 Fine root labile proportion | FRlab | 0.34 | 0.30 | - | Biome-BGC V4.2 |
| 细根中纤维素所占比 Fine root cellulose proportion | FRcel | 0.44 | 0.45 | - | Biome-BGC V4.2 |
| 细根中木质素所占比 Fine root lignin proportion | FRlig | 0.22 | 0.25 | - | Biome-BGC V4.2 |
| 死立木中纤维素所占比 Dead wood cellulose proportion | DWcel | 0.73 | 0.76 | - | |
| 死立木中木质素所占比 Dead wood lignin proportion | DWlig | 0.27 | 0.24 | - | |
| 冠层截留系数 Water interception coef?cient | Wint | 0.045 | 0.033 | LAI-1·d-1 | |
| 冠层消光系数 Light extinction coef?cient | k | 0.50 | 0.58 | - | |
| 所有叶面积与投影叶面积之比 Ratio of all sided to projected leaf area | LAIall:proj | 2.6 | 2.0 | - | |
| 冠层平均比叶面积 Average speci?c leaf area | SLA | 16.4 | 54.2 | m2·kg-1 | Measured by us |
| 阴叶与阳叶比叶面积比 Ratio of shade SLA : sunlit SLA | SLAshd:sun | 2 | 2 | - | |
| Rubisco酶中叶氮含量 Fraction of leaf N in Rubisco | FLNR | 0.080 | 0.075 | - | |
| 最大气孔导度 Maximum stomatal conductance | Gsmax | 0.006 0 | 0.006 5 | m·s-1 | |
| 表皮导度 Cuticular conductance | Gcut | 0.000 06 | 0.000 01 | m·s-1 | |
| 边界层导度 Boundary layer conductance | Gbl | 0.09 | 0.01 | m·s-1 | |
| 气孔开始减小时叶片水势 Leaf water potential : start of gs reduction | LWPi | -0.65 | -0.34 | MPa | |
| 气孔停止减小时叶片水势 Leaf water potential : completion of gs reduction | LWPf | -2.5 | -2.2 | MPa | |
| 气孔开始减小时饱和水汽压差 Vapor pressure deficit : start of gs reduction | VPDi | 610 | 1 100 | Pa | |
| 气孔停止减小时饱和水汽压差 Vapor pressure deficit : completion of gs reduction | VPDf | 3 100 | 3 600 | Pa |
天保工程实施以来东北阔叶红松林的可持续经营
1
2015
... 本研究地点在吉林省抚松县露水河林业局(127.48°-128.03° E, 42.40°-42.82° N), 其位于长白山自然保护区西北麓, 总经营面积120 934 hm2.该区域属温带大陆性季风气候, 温度和降水季节变化显著, 降水集中在夏季, 年降水量为800-1 040 mm, 年平均气温4.5-7.8 ℃, 平均相对湿度为70%-75%.土壤类型为山地暗棕色森林土(
天保工程实施以来东北阔叶红松林的可持续经营
1
2015
... 本研究地点在吉林省抚松县露水河林业局(127.48°-128.03° E, 42.40°-42.82° N), 其位于长白山自然保护区西北麓, 总经营面积120 934 hm2.该区域属温带大陆性季风气候, 温度和降水季节变化显著, 降水集中在夏季, 年降水量为800-1 040 mm, 年平均气温4.5-7.8 ℃, 平均相对湿度为70%-75%.土壤类型为山地暗棕色森林土(
基于EFAST方法的CERES-Wheat作物模型参数敏感性分析
2
2012
... 模型参数敏感性分析包括局部敏感性分析和全局敏感性分析(
... ;
基于EFAST方法的CERES-Wheat作物模型参数敏感性分析
2
2012
... 模型参数敏感性分析包括局部敏感性分析和全局敏感性分析(
... ;
Uncertainty analysis of modeled carbon fluxes for a broad-leaved Korean pine mixed forest using a process- based ecosystem model
2012
东北东部山区11种温带树种粗木质残体分解与碳氮释放
1
2010
... Parameterization for Korean pine (PK) and broadleaved species (DB) ecophysiological parameters
| 参数 Parameter | 符号 Symbol | 红松基 准值 Basic value of Korean pine | 阔叶树 基准值 Basic value of broadleaf species | 单位 Unit | 来源 Source |
|---|---|---|---|---|---|
| 转移生长占生长季的比例 Transfer growth period | Tt | 0.3 | 0.2 | - | Biome-BGC V4.2 |
| 凋落过程占生长季的比例 Litterfall period | LFG | 0.3 | 0.2 | - | Biome-BGC V4.2 |
| 叶片与细根周转率 Annual leaf and fine root turnover fraction | LFRT | 0.32 | 1.0 | a-1 | |
| 活立木周转率 Annual live wood turnover fraction | LWT | 0.7 | 0.7 | a-1 | Biome-BGC V4.2 |
| 整株植物死亡率 Annual whole-plant mortality fraction | WPM | 0.009 0 | 0.021 3 | a-1 | |
| 火灾死亡率 Annual fire mortality fraction | FM | 0 | 0 | a-1 | Set by us |
| 细根与叶片碳分配比 New fine root C: leaf C | FRC:LC | 1.2 | 0.9 | - | |
| 新茎与新叶碳分配比 New stem C: leaf C | SC:LC | 1.4 | 2.4 | - | |
| 活立木与所有木质组织碳分配比 New live wood C: total wood C | LWC:TWC | 0.379 | 0.1 | - | |
| 粗根与新茎碳分配比 New coarse root C: stem C | CRC:SC | 0.29 | 0.23 | - | |
| 当前生长比例 Current growth proportion | CGP | 0.5 | 0.5 | - | Biome-BGC V4.2 |
| 叶片碳氮比 C:N of leaves | C:Nleaf | 34.30 | 17.55 | kg·kg-1 | Measured by us |
| 叶片凋落物碳氮比 C:N of falling leaf litter | C:Nlitter | 96.5 | 41.1 | kg·kg-1 | |
| 细根碳氮比 C:N of ?ne roots | C:Nfr | 56.4 | 47.4 | kg·kg-1 | |
| 活立木碳氮比 C:N of live wood | C:Nlw | 97.4 | 97.05 | kg·kg-1 | |
| 死立木碳氮比 C:N of dead wood | C:Ndw | 398 | 212 | kg·kg-1 | |
| 叶片凋落物易分解物质所占比 Leaf litter labile proportion | Llab | 0.45 | 0.53 | - | |
| 叶片凋落物纤维素所占比 Leaf litter cellulose proportion | Lcel | 0.25 | 0.22 | - | |
| 叶片凋落物木质素所占比 Leaf litter lignin proportion | Llig | 0.30 | 0.25 | - | |
| 细根中易分解物质所占比 Fine root labile proportion | FRlab | 0.34 | 0.30 | - | Biome-BGC V4.2 |
| 细根中纤维素所占比 Fine root cellulose proportion | FRcel | 0.44 | 0.45 | - | Biome-BGC V4.2 |
| 细根中木质素所占比 Fine root lignin proportion | FRlig | 0.22 | 0.25 | - | Biome-BGC V4.2 |
| 死立木中纤维素所占比 Dead wood cellulose proportion | DWcel | 0.73 | 0.76 | - | |
| 死立木中木质素所占比 Dead wood lignin proportion | DWlig | 0.27 | 0.24 | - | |
| 冠层截留系数 Water interception coef?cient | Wint | 0.045 | 0.033 | LAI-1·d-1 | |
| 冠层消光系数 Light extinction coef?cient | k | 0.50 | 0.58 | - | |
| 所有叶面积与投影叶面积之比 Ratio of all sided to projected leaf area | LAIall:proj | 2.6 | 2.0 | - | |
| 冠层平均比叶面积 Average speci?c leaf area | SLA | 16.4 | 54.2 | m2·kg-1 | Measured by us |
| 阴叶与阳叶比叶面积比 Ratio of shade SLA : sunlit SLA | SLAshd:sun | 2 | 2 | - | |
| Rubisco酶中叶氮含量 Fraction of leaf N in Rubisco | FLNR | 0.080 | 0.075 | - | |
| 最大气孔导度 Maximum stomatal conductance | Gsmax | 0.006 0 | 0.006 5 | m·s-1 | |
| 表皮导度 Cuticular conductance | Gcut | 0.000 06 | 0.000 01 | m·s-1 | |
| 边界层导度 Boundary layer conductance | Gbl | 0.09 | 0.01 | m·s-1 | |
| 气孔开始减小时叶片水势 Leaf water potential : start of gs reduction | LWPi | -0.65 | -0.34 | MPa | |
| 气孔停止减小时叶片水势 Leaf water potential : completion of gs reduction | LWPf | -2.5 | -2.2 | MPa | |
| 气孔开始减小时饱和水汽压差 Vapor pressure deficit : start of gs reduction | VPDi | 610 | 1 100 | Pa | |
| 气孔停止减小时饱和水汽压差 Vapor pressure deficit : completion of gs reduction | VPDf | 3 100 | 3 600 | Pa |
基于全局敏感性分析方法的WASP模型不确定性分析
1
2014
... 关于对水通量的参数敏感性检验的相关研究较少, 本文中影响红松和阔叶树ET的敏感参数有很大不同, 且它们对模拟ET的作用方式也不同.这可能与红松和阔叶树的生长习性不同有关.影响红松ET的敏感参数有多个, 但除SLA、FRC:LC和Gcut 3个参数外, 其余敏感参数的总敏感性指数远大于一阶敏感性指数, 这类参数是通过与其他参数的二阶或多阶交互作用来间接影响模拟结果, 若采取一次变化一个参数而保持其他参数不变的局部敏感性分析就无法得到准确的结果(
基于全局敏感性分析方法的WASP模型不确定性分析
1
2014
... 关于对水通量的参数敏感性检验的相关研究较少, 本文中影响红松和阔叶树ET的敏感参数有很大不同, 且它们对模拟ET的作用方式也不同.这可能与红松和阔叶树的生长习性不同有关.影响红松ET的敏感参数有多个, 但除SLA、FRC:LC和Gcut 3个参数外, 其余敏感参数的总敏感性指数远大于一阶敏感性指数, 这类参数是通过与其他参数的二阶或多阶交互作用来间接影响模拟结果, 若采取一次变化一个参数而保持其他参数不变的局部敏感性分析就无法得到准确的结果(
基于Biome-BGC模型和集合卡尔曼滤波方法的阔叶红松林生态系统水碳通量模拟
1
2017
... 近些年来, 生态过程模型的发展为研究者在长时间序列和区域、全球尺度上对陆地生态系统碳、水循环以及它们应对全球气候变化方面的研究提供了极大的便利(
基于Biome-BGC模型和集合卡尔曼滤波方法的阔叶红松林生态系统水碳通量模拟
1
2017
... 近些年来, 生态过程模型的发展为研究者在长时间序列和区域、全球尺度上对陆地生态系统碳、水循环以及它们应对全球气候变化方面的研究提供了极大的便利(
阔叶红松林净初级生产力模型参数的敏感性
2
2008
... Parameterization for Korean pine (PK) and broadleaved species (DB) ecophysiological parameters
| 参数 Parameter | 符号 Symbol | 红松基 准值 Basic value of Korean pine | 阔叶树 基准值 Basic value of broadleaf species | 单位 Unit | 来源 Source |
|---|---|---|---|---|---|
| 转移生长占生长季的比例 Transfer growth period | Tt | 0.3 | 0.2 | - | Biome-BGC V4.2 |
| 凋落过程占生长季的比例 Litterfall period | LFG | 0.3 | 0.2 | - | Biome-BGC V4.2 |
| 叶片与细根周转率 Annual leaf and fine root turnover fraction | LFRT | 0.32 | 1.0 | a-1 | |
| 活立木周转率 Annual live wood turnover fraction | LWT | 0.7 | 0.7 | a-1 | Biome-BGC V4.2 |
| 整株植物死亡率 Annual whole-plant mortality fraction | WPM | 0.009 0 | 0.021 3 | a-1 | |
| 火灾死亡率 Annual fire mortality fraction | FM | 0 | 0 | a-1 | Set by us |
| 细根与叶片碳分配比 New fine root C: leaf C | FRC:LC | 1.2 | 0.9 | - | |
| 新茎与新叶碳分配比 New stem C: leaf C | SC:LC | 1.4 | 2.4 | - | |
| 活立木与所有木质组织碳分配比 New live wood C: total wood C | LWC:TWC | 0.379 | 0.1 | - | |
| 粗根与新茎碳分配比 New coarse root C: stem C | CRC:SC | 0.29 | 0.23 | - | |
| 当前生长比例 Current growth proportion | CGP | 0.5 | 0.5 | - | Biome-BGC V4.2 |
| 叶片碳氮比 C:N of leaves | C:Nleaf | 34.30 | 17.55 | kg·kg-1 | Measured by us |
| 叶片凋落物碳氮比 C:N of falling leaf litter | C:Nlitter | 96.5 | 41.1 | kg·kg-1 | |
| 细根碳氮比 C:N of ?ne roots | C:Nfr | 56.4 | 47.4 | kg·kg-1 | |
| 活立木碳氮比 C:N of live wood | C:Nlw | 97.4 | 97.05 | kg·kg-1 | |
| 死立木碳氮比 C:N of dead wood | C:Ndw | 398 | 212 | kg·kg-1 | |
| 叶片凋落物易分解物质所占比 Leaf litter labile proportion | Llab | 0.45 | 0.53 | - | |
| 叶片凋落物纤维素所占比 Leaf litter cellulose proportion | Lcel | 0.25 | 0.22 | - | |
| 叶片凋落物木质素所占比 Leaf litter lignin proportion | Llig | 0.30 | 0.25 | - | |
| 细根中易分解物质所占比 Fine root labile proportion | FRlab | 0.34 | 0.30 | - | Biome-BGC V4.2 |
| 细根中纤维素所占比 Fine root cellulose proportion | FRcel | 0.44 | 0.45 | - | Biome-BGC V4.2 |
| 细根中木质素所占比 Fine root lignin proportion | FRlig | 0.22 | 0.25 | - | Biome-BGC V4.2 |
| 死立木中纤维素所占比 Dead wood cellulose proportion | DWcel | 0.73 | 0.76 | - | |
| 死立木中木质素所占比 Dead wood lignin proportion | DWlig | 0.27 | 0.24 | - | |
| 冠层截留系数 Water interception coef?cient | Wint | 0.045 | 0.033 | LAI-1·d-1 | |
| 冠层消光系数 Light extinction coef?cient | k | 0.50 | 0.58 | - | |
| 所有叶面积与投影叶面积之比 Ratio of all sided to projected leaf area | LAIall:proj | 2.6 | 2.0 | - | |
| 冠层平均比叶面积 Average speci?c leaf area | SLA | 16.4 | 54.2 | m2·kg-1 | Measured by us |
| 阴叶与阳叶比叶面积比 Ratio of shade SLA : sunlit SLA | SLAshd:sun | 2 | 2 | - | |
| Rubisco酶中叶氮含量 Fraction of leaf N in Rubisco | FLNR | 0.080 | 0.075 | - | |
| 最大气孔导度 Maximum stomatal conductance | Gsmax | 0.006 0 | 0.006 5 | m·s-1 | |
| 表皮导度 Cuticular conductance | Gcut | 0.000 06 | 0.000 01 | m·s-1 | |
| 边界层导度 Boundary layer conductance | Gbl | 0.09 | 0.01 | m·s-1 | |
| 气孔开始减小时叶片水势 Leaf water potential : start of gs reduction | LWPi | -0.65 | -0.34 | MPa | |
| 气孔停止减小时叶片水势 Leaf water potential : completion of gs reduction | LWPf | -2.5 | -2.2 | MPa | |
| 气孔开始减小时饱和水汽压差 Vapor pressure deficit : start of gs reduction | VPDi | 610 | 1 100 | Pa | |
| 气孔停止减小时饱和水汽压差 Vapor pressure deficit : completion of gs reduction | VPDf | 3 100 | 3 600 | Pa |
... 本文分别对Biome-BGC在模拟红松和阔叶树碳、水通量时进行参数敏感性检验, 表明了不同植被类型的敏感参数不同.文中结果显示红松NPP对参数的敏感程度要高于阔叶树, 这可能与二者的光合特性差异较大有关(
2
2013
... Parameterization for Korean pine (PK) and broadleaved species (DB) ecophysiological parameters
| 参数 Parameter | 符号 Symbol | 红松基 准值 Basic value of Korean pine | 阔叶树 基准值 Basic value of broadleaf species | 单位 Unit | 来源 Source |
|---|---|---|---|---|---|
| 转移生长占生长季的比例 Transfer growth period | Tt | 0.3 | 0.2 | - | Biome-BGC V4.2 |
| 凋落过程占生长季的比例 Litterfall period | LFG | 0.3 | 0.2 | - | Biome-BGC V4.2 |
| 叶片与细根周转率 Annual leaf and fine root turnover fraction | LFRT | 0.32 | 1.0 | a-1 | |
| 活立木周转率 Annual live wood turnover fraction | LWT | 0.7 | 0.7 | a-1 | Biome-BGC V4.2 |
| 整株植物死亡率 Annual whole-plant mortality fraction | WPM | 0.009 0 | 0.021 3 | a-1 | |
| 火灾死亡率 Annual fire mortality fraction | FM | 0 | 0 | a-1 | Set by us |
| 细根与叶片碳分配比 New fine root C: leaf C | FRC:LC | 1.2 | 0.9 | - | |
| 新茎与新叶碳分配比 New stem C: leaf C | SC:LC | 1.4 | 2.4 | - | |
| 活立木与所有木质组织碳分配比 New live wood C: total wood C | LWC:TWC | 0.379 | 0.1 | - | |
| 粗根与新茎碳分配比 New coarse root C: stem C | CRC:SC | 0.29 | 0.23 | - | |
| 当前生长比例 Current growth proportion | CGP | 0.5 | 0.5 | - | Biome-BGC V4.2 |
| 叶片碳氮比 C:N of leaves | C:Nleaf | 34.30 | 17.55 | kg·kg-1 | Measured by us |
| 叶片凋落物碳氮比 C:N of falling leaf litter | C:Nlitter | 96.5 | 41.1 | kg·kg-1 | |
| 细根碳氮比 C:N of ?ne roots | C:Nfr | 56.4 | 47.4 | kg·kg-1 | |
| 活立木碳氮比 C:N of live wood | C:Nlw | 97.4 | 97.05 | kg·kg-1 | |
| 死立木碳氮比 C:N of dead wood | C:Ndw | 398 | 212 | kg·kg-1 | |
| 叶片凋落物易分解物质所占比 Leaf litter labile proportion | Llab | 0.45 | 0.53 | - | |
| 叶片凋落物纤维素所占比 Leaf litter cellulose proportion | Lcel | 0.25 | 0.22 | - | |
| 叶片凋落物木质素所占比 Leaf litter lignin proportion | Llig | 0.30 | 0.25 | - | |
| 细根中易分解物质所占比 Fine root labile proportion | FRlab | 0.34 | 0.30 | - | Biome-BGC V4.2 |
| 细根中纤维素所占比 Fine root cellulose proportion | FRcel | 0.44 | 0.45 | - | Biome-BGC V4.2 |
| 细根中木质素所占比 Fine root lignin proportion | FRlig | 0.22 | 0.25 | - | Biome-BGC V4.2 |
| 死立木中纤维素所占比 Dead wood cellulose proportion | DWcel | 0.73 | 0.76 | - | |
| 死立木中木质素所占比 Dead wood lignin proportion | DWlig | 0.27 | 0.24 | - | |
| 冠层截留系数 Water interception coef?cient | Wint | 0.045 | 0.033 | LAI-1·d-1 | |
| 冠层消光系数 Light extinction coef?cient | k | 0.50 | 0.58 | - | |
| 所有叶面积与投影叶面积之比 Ratio of all sided to projected leaf area | LAIall:proj | 2.6 | 2.0 | - | |
| 冠层平均比叶面积 Average speci?c leaf area | SLA | 16.4 | 54.2 | m2·kg-1 | Measured by us |
| 阴叶与阳叶比叶面积比 Ratio of shade SLA : sunlit SLA | SLAshd:sun | 2 | 2 | - | |
| Rubisco酶中叶氮含量 Fraction of leaf N in Rubisco | FLNR | 0.080 | 0.075 | - | |
| 最大气孔导度 Maximum stomatal conductance | Gsmax | 0.006 0 | 0.006 5 | m·s-1 | |
| 表皮导度 Cuticular conductance | Gcut | 0.000 06 | 0.000 01 | m·s-1 | |
| 边界层导度 Boundary layer conductance | Gbl | 0.09 | 0.01 | m·s-1 | |
| 气孔开始减小时叶片水势 Leaf water potential : start of gs reduction | LWPi | -0.65 | -0.34 | MPa | |
| 气孔停止减小时叶片水势 Leaf water potential : completion of gs reduction | LWPf | -2.5 | -2.2 | MPa | |
| 气孔开始减小时饱和水汽压差 Vapor pressure deficit : start of gs reduction | VPDi | 610 | 1 100 | Pa | |
| 气孔停止减小时饱和水汽压差 Vapor pressure deficit : completion of gs reduction | VPDf | 3 100 | 3 600 | Pa |
...
Vapor pressure deficit : completion of gs reduction
