 , 焦俊男
, 焦俊男Exploring the influence of soil types underneath the canopy in winter wheat leaf area index remote estimating
, 通讯作者:
责任编辑:
版权声明:2017植物生态学报编辑部本文是遵循CCAL协议的开放存取期刊,引用请务必标明出处。
基金资助:
展开
摘要
关键词:
Abstract
Keywords:
-->0
PDF (6506KB)元数据多维度评价相关文章收藏文章
本文引用格式导出EndNoteRisBibtex收藏本文-->
叶面积指数(LAI)是表征植物几何结构的关键参数, 被定义为单位地表面积上绿叶表面积总和的一半(Chen & Black, 1992)。它与光合作用、蒸腾作用等有机物积累相关过程关系密切, 也是分析作物长势状况和预测产量的重要依据(Fang et al., 2011; Bolton & Friedl, 2013)。
20世纪70年代, 遥感在揭示植物形态特征、物候状态与其光学性质之间的联系方面起到关键作用(Gausman et al., 1969; Woolley, 1971; Allen et al., 1973)。它为星-机-地遥感框架下农艺管理的精细化、科学化发展提供了技术支撑。高通量、非侵入式、广覆盖、实时观测等遥感优势不仅有效地弥补了传统直接测量LAI费时费力、具有一定破坏性、仅获得小区域值的缺陷; 也使遥感成为快速、高效开展从田块到区域乃至全球范围的农作物LAI无损探测的有效方法。过去30年, 遥感工作者们沿着以实际应用为主线, 提高精度与其紧密咬合的框架不断探索LAI估算方法(Thenkabail et al., 2012): (1)关注作物类型差异、种间LAI变化差异对模型外推的影响, 寻找普适性更强的光谱指数(Vi?a et al., 2011); (2)侧重于减小叶绿素浓度干扰, 尝试发展对LAI变化更敏感的新植被指数(Broge & Leblanc, 2001); (3)着眼非参数算法在提高LAI预测精度中的作用(Wang et al., 2011); (4)注重宽、窄波段信息以及多源遥感数据对估算LAI潜力的挖掘(Lee et al., 2004; Li et al., 2017)。这些研究在一定程度上降低了LAI估算模型对作物类型、种植品种、生长阶段以及地理环境的特殊依赖性, 拓宽了LAI估算模型的应用范围; 同时, 也提高了LAI的预测精度。但大多研究是在单一土壤类型或未知土壤类型先验知识的前提下开展的, 忽略了植冠下土壤类型差异对估算作物LAI的影响。
土壤背景对植冠光谱的影响主要涉及两点: 一是土壤的表面状况, 包括朝向、粗糙度、阴影、结壳、秸秆残留物等; 二是影响土壤光谱特征的内在物理和化学性质, 包括矿物、有机质、水分、颗粒大小、土壤结构。许多****分析了土壤湿度对遥感估算LAI的影响(Bausch, 1993; Todd & Hoffer, 1998; Yu et al., 2014; Liu et al., 2016); 但土壤的光谱特性与土壤的组成有重要关系, 当土壤类型发生变化时, 常伴有颜色、矿物、有机质、颗粒大小等影响土壤表面反射率理化性质的相应变化(Nolet et al., 2014; Sadeghi et al., 2015); 有****(Rondeaux et al., 1996)就指出相比土壤湿度或粗糙度, 土壤类型能造成对植冠光谱更大数量级的影响。再者, 不少****(Rouse et al., 1974; Huete et al., 1985; Huete, 1988; Farrar et al., 1994; Qi et al., 1994; Haboudane et al., 2004)证实近红外-红波段的光谱指数与土壤线关系密切; 而土壤类型是造成土壤线变化的主要因素之一(Jasinske & Eagleson, 1989), 但能够代表所有土壤类型的土壤线并不存在。因此, 若发展一种适应于各种陆表条件的LAI遥感估算方法, 则探究植冠下土壤类型背景差异对LAI遥感估算的影响显得极其必要, 而目前还鲜有此方面的研究。
鉴于此, 本文从以下方面研究植冠下土壤类型背景对遥感估算作物LAI的影响, 以期为发展一种适应各种陆表环境的LAI遥感估算方法和宽覆盖卫星影像下基于土壤背景影响去除模型的LAI遥感估算研究提供理论依据和方法途径。
1)分析现有的一些光谱指数在不同土壤类型区对LAI的敏感差异, 进而挖掘对植冠下土壤类型背景影响不敏感的光谱区间或光谱参数。
2)比较国际上估算LAI比较主流的两种回归模型——偏最小二乘回归(PLSR)和随机森林回归(RFR), 在复杂土壤类型区估算LAI的适用性, 进而探究单土壤类型区发展的LAI估算模型应用到复杂土壤类型区时可能产生的问题。
1 材料和方法
1.1 研究区概况与数据采集
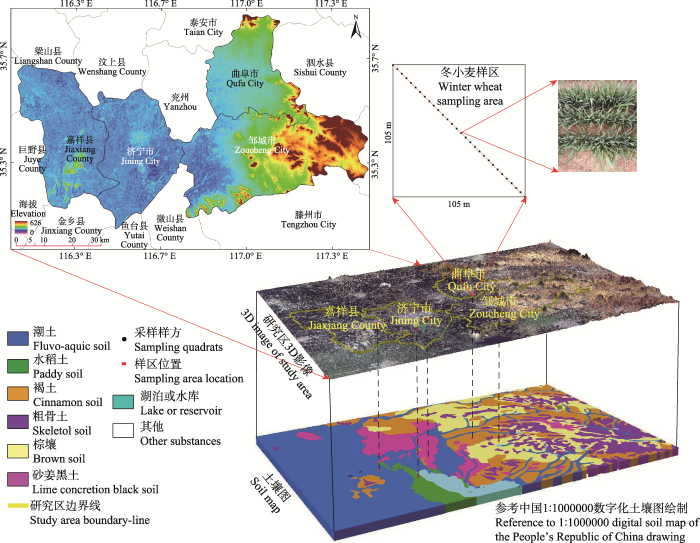
野外试验于2016年4月5日至12日在山东省济宁、曲阜和邹城地区(图1)开展。研究区地处鲁南泰沂低山丘陵与鲁西南黄淮海平原的交接地带, 属暖温带季风气候, 四季分明, 夏季高温, 雨量充沛, 冬季低温少雨; 全区地势平坦, 土质肥沃, 土壤类型复杂多样(主要土壤类型有潮土、水稻土、棕壤、褐土、砂姜黑土以及粗骨土), 是我国重要的冬小麦(Triticum aestivum)种植区。本研究参考2009年全国第二次土壤普查成果——中国1:100万数字化土壤图, 分别在潮土、水稻土、棕壤、砂姜黑土以及褐土5种土壤类型区选择地势平坦、土壤表面干燥的大田, 设置面积为105 m × 105 m的冬小麦样区, 并沿样区对角线以5 m为间隔设置30个样方(样方直径0.6 m)。5种土壤类型区种植的冬小麦品种均为‘济麦22号’, 播种日期在2015年10月1日前后, 播种间距0.3 m, 前茬作物均为玉米(Zea mays)。试验期间冬小麦正值拔节期, 所有样方的土壤表面干燥。
在北京时间11: 00-14: 00, 天气晴朗无云, 太阳光强度稳定时, 使用ASD FieldSpec Pro2500光谱辐射仪(Analytical Spectral Device, Boulder, USA)采集样方内冬小麦冠层光谱反射率, 并且待每一个样方的光谱采集工作结束, 随即插上标杆以便下一步进行LAI测量。ASD的光谱采集范围是350-2β500 nm, 其中350-1β000 nm范围的光谱采样间隔为1.4 nm; 1β000-2β500 nm范围的光谱采样间隔为2 nm (Zhao et al., 2012)。光谱测量过程中, 我们始终让ASD光纤探头与冬小麦冠层保持约1.0 m的垂直距离(地面视场范围约0.15 m2); 并在每一个样方内随机测量10次, 测量前后均通过标准白板进行校正, 最后取10次测量的平均值作为该样方的冬小麦冠层光谱反射率(高林等, 2017)。使用相同方法对样区内无植被覆盖的纯裸土表面进行光谱测量, 获取到5种土壤类型的光谱反射率。
 显示原图|下载原图ZIP|生成PPT
图1研究区地理位置及土壤类型分布。研究区位于济宁、曲阜和邹城。
-->Fig. 1Geographic location of the study area and soil types distribution. The study area is located in Jining, Qufu and Zoucheng.
-->
在光谱测量当天的17:00-18:00, 采用LAI-2000植物冠层分析仪(LI-COR, Nebraska, USA)无损测量样方内冬小麦的LAI。LAI-2000利用LAI-2050光学探头内的“鱼眼”镜头拍摄半球视场(≤ 74°)影像, 通过光电二极管监测器探测由中心向外张开的5个观测方向(7°、23°、38°、53°、68°)的透射光线, 进而利用间隙率模型计算LAI。考虑到LAI-2000的感应波长范围在320-490 nm, 野外测量时应尽量避免直射光, 在背向太阳一侧, 将LAI-2000探头放置于冠层上方, 先测定1个天空光, 再将其放入样点地面, 依次在冠层下不同位置重复测量5个目标值, 测量前后始终保持探头水平, 取其平均值作为样点冬小麦的LAI。每种土壤类型区均获取30组冬小麦的LAI, 统计分析结果(表1)表明: 5种土壤类型区的LAI均集中在2-4范围(个别样点> 5), 且LAI的变异系数(CV)较低(< 0.5), 说明5种土壤类型区冬小麦的LAI变化范围比较接近; 再者, 除褐土地区以外, 潮土、水稻土、棕壤和砂姜黑土地区冬小麦的LAI样本数据均呈正态分布。下文中涉及5种土壤区冬小麦的LAI依次简称为LAI潮土、LAI水稻土、LAI棕壤、LAI砂姜黑土、LAI褐土。
1.2 研究方法
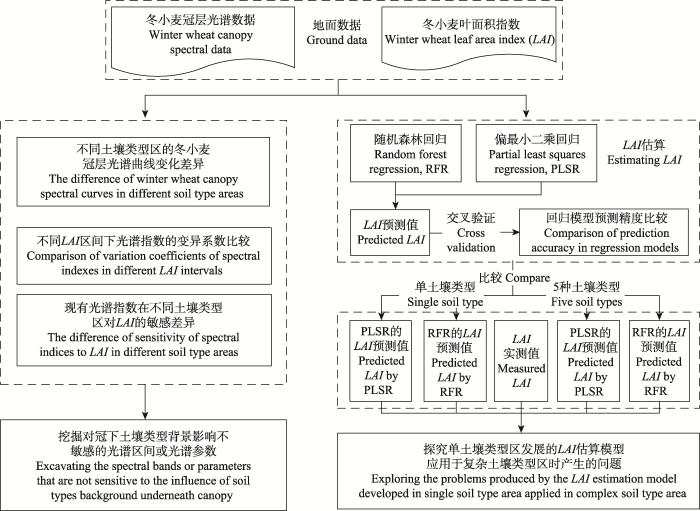
本研究围绕冬小麦冠层光谱、光谱指数、LAI估算模型三方面系统分析植冠下土壤类型差异对遥感估算冬小麦LAI的影响, 研究思路如图2所示。首先分析了植冠下土壤类型差异对冬小麦冠层光谱的影响; 其次, 比较了不同LAI区间光谱指数的变异系数, 并分析了现有光谱指数在不同土壤类型区对LAI的敏感性; 最后讨论不同土壤类型下两种回归模型对LAI的估算潜力。Table 1
表1
表1冬小麦叶面积指数(LAI)统计分析(5种土壤类型)
Table 1Descriptive statistics of winter wheat leaf area index (LAI) values (five soil types)
| 土壤类型 Soil type | LAI | p | ||||
|---|---|---|---|---|---|---|
| 最小值 Min | 最大值 Max | 平均值 Mean | 标准差 SD | 变异系数 CV (%) | ||
| 潮土 Fluvo-aquic soil | 1.970 | 5.870 | 3.650 | 1.031 | 28.24 | 0.105 |
| 水稻土 Paddy soil | 2.240 | 5.880 | 4.114 | 0.962 | 23.39 | 0.593 |
| 棕壤 Brown soil | 1.100 | 6.710 | 3.482 | 1.557 | 44.71 | 0.610 |
| 砂姜黑土 Lime concretion black soil | 1.700 | 5.500 | 3.463 | 1.018 | 29.39 | 0.536 |
| 褐土 Cinnamon soil | 1.320 | 5.860 | 4.483 | 1.235 | 27.54 | < 0.005 |
| 5种土壤 Five type soils | 1.100 | 6.710 | 3.838 | 1.232 | 32.09 | 0.242 |
新窗口打开
1.2.1 光谱指数
光谱指数是利用代数运算(加、减、乘、除及其组合)将植被-土壤系统中不同波段反射率因子组合而成的(徐希孺, 2005), 用以强调植物生理活性的一种参数。参考已有文献, 本研究选取8种在LAI遥感估算方面较为常用且效果良好的光谱指数(表2)。
1.2.2 偏最小二乘回归(PLSR)
PLSR法是一种集多元线性回归分析、主成分分析和典型相关分析于一体的, 基于自变量(X)的潜变量关于因变量(Y)的潜变量的线性回归模型, 间接描述自变量与因变量关系的回归建模方法(王惠文等, 2006)。PLSR最初发展是为了提高光谱检测化学成分的精度(Wold et al., 2001), 由于其有效地解决了光谱集合内部高度线性相关问题, 从理论上降低了光谱变量之间的相关性对估测模型的影响, 同时还构建了一个具有预测功能的“响应”矩阵, 使得PLSR成为高光谱研究中处理自变量多重共线性问题以及变量个数大于样本量问题的重要工具(Abdi, 2003; Atzberger et al., 2010)。本研究使用Minitab (http://www.minitab.com)进行PLSR分析。PLSR主要由3步构成: 1)所有自变量X和因变量Y的分解(公式1、2); 2) T和U的关系方程(公式3); 3)将公式3代入公式2得到关于因变量Y的新预测方程(公式4) (Yeniay & Goktas, 2002):
X = TPT + E (1)
Y = UQT + F (2)
U = bT + e (3)
Y = bTQ + G (4)
其中, T、U分别是X和Y的主成分矩阵(score矩阵); P、Q分别是X和Y的回归系数矩阵(loading矩阵); E、F分别是X和Y的残差矩阵; P、Q的上标T表示矩阵转置运算; b是方程系数; e是T和U的残差矩阵; G是预测Y的新残差矩阵。目前, PLSR在高光谱遥感探测植物物理化学参数方面得到广泛使用(Hansen & Schjoerring, 2003; Cho et al., 2007; Herrmann et al., 2011; Li et al., 2014)。
Table 2
表2
表2本文估算冬小麦叶面积指数的光谱指数
Table 2Spectral indices for winter wheat leaf area index estimating in this paper
| 光谱指数 Spectral indices | 公式 Equation | 来源 Reference |
|---|---|---|
| 归一化差异植被指数 Normalized difference vegetation index (NDVI) | $NDVI=\frac{{{R}_{800}}-{{R}_{680}}}{{{R}_{800}}+{{R}_{680}}}$ | Rouse et al., 1974 |
| 修正型土壤调节植被指数 Modified soil-adjusted vegetation index (MSAVI) | $MSAVI=\frac{1}{2}\times \left[ 2\times {{R}_{800}}+1-\sqrt{{{\left( 2\times {{R}_{800}}+1 \right)}^{2}}-8\times \left( {{R}_{800}}-{{R}_{670}} \right)} \right]$ | Qi et al., 1994 |
| 修正的叶绿素吸收比率指数 Modified chlorophyll absorption ratio index 2 (MCARI2) | $MCAR{{I}_{2}}=\frac{1.5\times \left[ 2.5\times \left( {{R}_{800}}-{{R}_{670}} \right)-1.3\times \left( {{R}_{800}}-{{R}_{550}} \right) \right]}{\sqrt{{{\left( 2\times {{R}_{800}}+1 \right)}^{2}}-\left( 6\times {{R}_{800}}-5\times \sqrt{{{R}_{670}}} \right)-0.5}}$ | Haboudane et al., 2004 |
| 红边拐点 Red edge inflection point (REIP) | $REIP=700+40\times \frac{\left( {{R}_{670}}+{{R}_{780}} \right)\text{/2}-{{R}_{700}}}{{{R}_{\text{740}}}-{{R}_{\text{700}}}}$ | Danson & Plummer, 1995 |
| 红边振幅 Red edge amplitude (Dr) | $d{{\lambda }_{\text{red-edge}}}$ | Feng et al., 2009 |
| 红边面积 Red edge area (SDr) | $\sum{d{{\lambda }_{\left( 680\text{-}750 \right)}}}$ | Filella & Penuelas, 1994 |
| 红边对称指数 Red edge symmetry (RES) | $RES=\frac{{{R}_{718}}-{{R}_{675}}}{{{R}_{755}}-{{R}_{675}}}$ | Ju et al., 2010 |
| 归一化差异光谱指数 Normalized difference spectral index (NDSI) | $NDS{{I}_{(i,j)}}=\frac{{{R}_{i}}-{{R}_{j}}}{{{R}_{\text{i}}}+{{R}_{j}}}$ | Li et al., 2013 |
新窗口打开
1.2.3 随机森林回归(RFR)
随机森林(Breiman, 2001)是基于决策树发展的一种将随机且有放回抽样生成的n棵树集成于一体进行分类和回归学习的算法; 森林中每棵CART树独立且不经修剪地生长至最大。
每次随机且有放回的抽样过程中, 大约有36.8%的样本未用于生成树, 这些样本称为“外袋” (OOB)数据。就分类问题而言, 预测“外袋”数据的响应值是通过多数投票方式完成的, 而回归问题则基于对所有树的平均得到。随机森林回归模型中, 3个参数需要根据“外袋”预测误差(the OOB estimate of error rate)进行优化: 1)构成森林的树个数ntree (默认值是500); 2)树节点二叉分裂的参与变量个数mtry (默认值是p/3); 在随机森林回归中, 参与树节点的二叉最优分裂的子变量集是根据节点不纯度最小原则(the input variable with the lowest Gini index)从全部变量p中随机选取m (m << p)个子变量构成的; 3)树末端节点的最小尺寸(nodesize, 默认值是5), 树生长过程中, 节点拥有的尺寸若小于末端节点最小尺寸则不再进行二叉分裂。
随机森林回归在R语言(https://www.r-project.org/)环境下执行。
1.2.4 LAI反演精度评价
本文选择决定系数(R2)、均方根误差(RMSE)和相对分析误差(RPD)(Rossel & Webster, 2012; Siegmann & Jarmer, 2015)作为评价LAI估测模型鲁棒性的指标。R2用于评价模型拟合程度, 其取值范围在0-1之间, R2越接近1, 模型拟合精度越高; RMSE用于评价预测数据与实测数据之间的差异, RMSE越小, 两者差异越小, 模型的预测精度也相对越高; RPD用于评价模型鲁棒性, RPD越大, 模型鲁棒性越高。此外, PLSR采用留一法交叉验证(leave-one- out cross validation), 即每次用n - 1个样本进行训练, 留下1个样本对训练模型进行检验, 获得该样本的估测值, 如此循环n次, 共建立n个训练模型, 得到每一个参与验证的样本的估测值(McLachlan, 2004)。
 显示原图|下载原图ZIP|生成PPT
图2研究路线图。
-->Fig. 2Flowchart of research in this study.
-->
2 结果和讨论
2.1 光谱特征分析
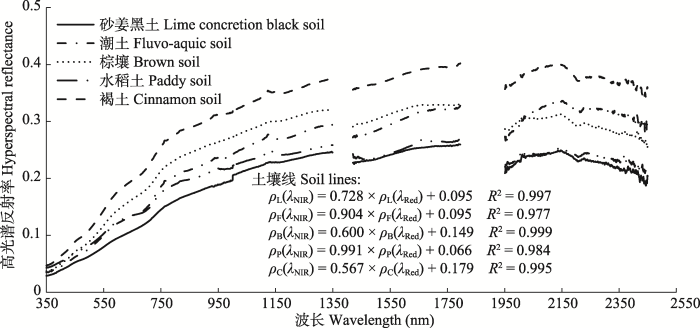
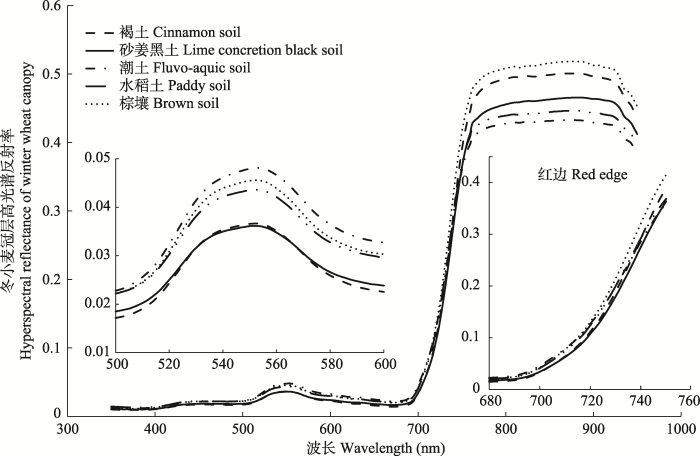
图3是剔除存在较大反射率波动噪声(噪声存在于1β350-1β419 nm、1β796-1β950 nm和2β450- 2β500 nm光谱范围)后的土壤光谱反射率曲线。从图中可以发现: 在350-2β500 nm范围, 褐土的反射率(ρC)最高, 砂姜黑土的反射率(ρL)最低; 在550- 1β950 nm范围, 棕壤的反射率(ρB)高于潮土的反射率(ρF)和水稻土的反射率(ρP), 其中550-750 nm范围, ρF和ρP比较接近, 1β950-2β450 nm范围, ρF > ρB > ρP。土壤线方面, 不同土壤类型的红波段反射率ρ(λRed)和近红外波段反射率ρ(λNIR)的线性差异显著: 土壤线斜率, 水稻土>潮土>砂姜黑土>棕壤>褐土; 褐土的土壤线截距最大, 棕壤次之, 潮土和砂姜黑土接近, 水稻土最小。图4描述了5种土壤类型区的冬小麦冠层平均光谱曲线变化。从图中可以发现: 在550 nm “绿峰”附近, 冬小麦“绿峰”的高度是潮土>棕壤>水稻土, 砂姜黑土和褐土的冬小麦“绿峰”的高度接近且低于水稻土; 800-900 nm “近红外反射平台”附近, 冬小麦冠层“近红外反射平台”的反射率高度为棕壤>褐土>砂姜黑土>水稻土>潮土; 680-750 nm红边范围, 5种土壤类型区的冬小麦红边有差异但不明显。
上述分析表明在样区内冬小麦没有封垄时, 由于冬小麦冠层光谱掺杂了植冠下土壤的某些光学特征, 导致不同土壤类型区的3个冬小麦冠层光谱特征(“绿峰”、“红边”和“近红外反射平台”)发生不同程度的变化, 其中土壤类型背景对近红外波段光谱的影响最突出; 但对红边光谱影响最不明显, 主要原因在于绿色健康的冬小麦红光吸收位置与近红外“肩部”连线的斜率随LAI增大会发生微小变化, 但这种微小变化在680-750 nm范围反射率由低值急剧变化到高值的趋势中不足以使不同土壤类型区的绿色健康的冬小麦红边光谱曲线发生较大位移。
 显示原图|下载原图ZIP|生成PPT
图3不同类型土壤的光谱反射率曲线和土壤线。ρL(λNIR)和ρL(λRed)分别表示砂姜黑土的近红外波段反射率和红波段反射率; ρF(λNIR)和ρF(λRed)分别表示潮土的近红外波段反射率和红波段反射率; ρB(λNIR)和ρB(λRed)分别表示棕壤的近红外波段反射率和红波段反射率; ρP(λNIR)和ρP(λRed)分别表示水稻土的近红外波段反射率和红波段反射率; ρC(λNIR)和ρC(λRed)分别表示褐土的近红外波段反射率和红波段反射率。
-->Fig. 3Different soil spectral reflectance curves and soil lines. ρL(λNIR) and ρL(λRed) are spectral reflectance of lime concretion back soil in near infrared band and red band, respectively; ρF(λNIR) and ρF(λRed) are spectral reflectance of fluvo-aquic soil in near infrared band and red band, respectively; ρB(λNIR) and ρB(λRed) are spectral reflectance of brown soil in near infrared band and red band, respectively; ρP(λNIR) and ρP(λRed) are spectral reflectance of paddy soil in near infrared band and red band, respectively; ρC(λNIR) and ρC(λRed) are spectral reflectance of cinnamon soil in near infrared band and red band, respectively.
-->
 显示原图|下载原图ZIP|生成PPT
图45种土壤类型的冬小麦冠层光谱反射率比较。
-->Fig. 4Comparison of winter wheat canopy spectral reflectance in five soil types.
-->
2.2 光谱指数与冬小麦LAI的相关关系探讨
表3是将150个冬小麦LAI样本及其对应的光谱指数按LAI为1.0-1.5、1.5-2.0、2.0-2.5、2.5-3.0、3.0-3.5、3.5-4.0、4.0-4.5、4.5-5.0、>5.0依次划分9组, 并分别计算每组光谱指数的变异系数; 结果表明8个光谱指数中只有NDVI和REIP具有较低的变异系数(CVNDVI、CVREIP); 且当LAI < 3时, CVNDVI具有高值, 说明在低冠层覆盖下, 植被冠层光谱容易混入土壤光谱, 导致不同土壤类型区的NDVI变化特别强烈; 当LAI > 3时, CVNDVI逐渐降低, 且在LAI > 4以后, CVNDVI始终保持低值, 说明高冠层覆盖下的组内NDVI值变化不大。相反, CVREIP随LAI取值区间的变化是8种光谱指数中最小的, 始终在0.36上下浮动, 且CVREIP随LAI的递增出现先增大再减小最后不变的变化趋势, 说明相比其他7种光谱指数, 植冠下土壤类型背景的改变对红边位置的影响较小。表4描述了8种光谱指数与冬小麦LAI的相关性。如表所示, 虽然NDVI是表征植被光合作用及其生长发育动态变化的最佳指示因子(Baret & Guyot, 1991; Myneni et al., 1995), 但NDVI-LAI的相关性因植冠下裸土成分差异而表现不同(r水稻土> r潮土> r褐土> r砂姜黑土> r棕壤)。尽管MSAVI和MCARI2作为NDVI的改进形式, 在不考虑土壤类型时提高了与LAI的相关性, 但土壤类型背景影响仍然十分突出, 不同土壤类型区MSAVI-LAI和MCARI2-LAI的相关性均为r水稻土> r潮土> r褐土> r砂姜黑土> r棕壤; 这说明基于一种土壤线假设改进的光谱指数在小区域研究中似乎合理, 但在复杂土壤类型地区使用基于一种土壤线发展的光谱指数分析植被必然会产生较大误差。同样, 不同植冠下土壤类型的变化也会引起红边反射特征指数与LAI的相关性差异: REIP与LAI的相关性为r水稻土> r潮土> r棕壤> r褐土> r砂姜黑土; RES与5种土壤类型的冬小麦LAI均呈负相关关系, 且r水稻土> r潮土> r褐土> r棕壤> r砂姜黑土; Dr与LAI的相关性为r潮土> r水稻土> r砂姜黑土> r褐土> r棕壤; SDr与LAI的相关性(无论正相关还是负相关, 均以绝对值作比较)为r潮土> r水稻土> r砂姜黑土> r棕壤> r褐土。NDSI与LAI相关性是8种光谱指数中最高的, 这是由于“lambda-by-lambda”波段优选算法构建NDSI时不需要如NDVI、MSAVI和MCARI2那般依赖固定波段(680 nm、800 nm), 也不需要如红边反射特征指数那般受限于特定的光谱区域(680-750 nm红边范围), 它可以使用350-950 nm范围内的任意光谱波段进行两两组合, 通过计算归一化差异光谱指数与LAI的相关性等值线图, 挑选出与LAI有最高相关性的NDSI(i,j)。然而, 不同土壤类型区NDSI与LAI的相关性仍存在差异(r水稻土> r潮土> r棕壤> r砂姜黑土> r褐土), 且不同土壤类型区优选的光谱波段组合(i,j)也不同; 这说明即使采用这种波段优选算法也不能忽视土壤类型背景影响, 但值得欣慰的是该算法可以在一定程度上缓解植冠下土壤类型差异对NDSI与LAI相关性的影响。
Table 3
表3
表3不同叶面积指数(LAI)区间下光谱指数的变异系数(%)
Table 3Coefficient of variation (%) of spectral indices in different leaf area index (LAI) intervals
| 光谱指数 Spectral indices | LAI | ||||||||
|---|---|---|---|---|---|---|---|---|---|
| 1-1.5 | 1.5-2 | 2-2.5 | 2.5-3 | 3-3.5 | 3.5-4 | 4-4.5 | 4.5-5 | >5 | |
| NDVI | 6.32 | 10.91 | 7.18 | 7.94 | 4.37 | 1.95 | 1.9 | 2.01 | 1.44 |
| MSAVI | 13.86 | 24.48 | 18.57 | 24.42 | 12.77 | 8.72 | 10.01 | 8.02 | 4.25 |
| MCARI2 | 15.72 | 25.98 | 20.51 | 26.03 | 13.95 | 8.94 | 9.97 | 8.28 | 4.84 |
| RES | 20.54 | 25.8 | 24.06 | 18.15 | 16.26 | 8.36 | 8.49 | 11.69 | 7.8 |
| REIP | 0.44 | 0.45 | 0.53 | 0.39 | 0.41 | 0.23 | 0.25 | 0.29 | 0.24 |
| NDSI | 100.97 | 206.38 | 187.41 | 139.56 | 154.61 | 155.92 | 114.89 | 158.33 | 150.22 |
| Dr | 19.51 | 28.93 | 20.25 | 31.48 | 15.98 | 15.68 | 12.38 | 13.61 | 7.38 |
| SDr | 17.01 | 23.61 | 14.44 | 27.18 | 12.2 | 16.32 | 11.07 | 11.35 | 6.68 |
新窗口打开
Table 4
表4
表4光谱指数与不同土壤类型背景的冬小麦叶面积指数(LAI)相关性
Table 4Correlations between spectral indices and winter wheat leaf area index (LAI) in different soil types
| 光谱指数 Spectral indices | 不同土壤类型区的冬小麦LAI/相关系数 Winter wheat LAI in different soil types/Correlation coefficient (r) | |||||
|---|---|---|---|---|---|---|
| 水稻土 Paddy soil (n = 30) | 潮土 Fluvo-aquic soil (n = 30) | 棕壤 Brown soil (n = 30) | 砂姜黑土 Lime concretion black soil (n = 30) | 褐土 Cinnamon soil (n = 30) | 5种土壤 Five type soils (n = 150) | |
| NDVI | 0.789 | 0.655 | 0.079 | 0.145 | 0.630 | 0.379 |
| MSAVI | 0.753 | 0.724 | 0.037 | 0.283 | 0.313 | 0.383 |
| MCARI2 | 0.769 | 0.722 | -0.008 | 0.258 | 0.401 | 0.386 |
| NDSI(i, j) | 0.854/NDSI(727, 932) | 0.852/NDSI(416, 429) | 0.788/NDSI(781, 783) | 0.701/NDSI(669, 676) | 0.679/NDSI(629, 636) | 0.561/NDSI(628, 636) |
| REIP | 0.836 | 0.735 | 0.500 | 0.208 | 0.426 | 0.408 |
| Dr | 0.714 | 0.732 | 0.016 | 0.375 | 0.186 | 0.340 |
| SDr | 0.624 | 0.704 | -0.086 | 0.371 | 0.008 | 0.265 |
| RES | -0.834 | -0.675 | -0.368 | -0.176 | -0.477 | -0.404 |
新窗口打开
基于上述分析发现: 不同土壤类型区, 同一种光谱指数与冬小麦LAI的相关性不同; 同一种土壤类型区, 不同光谱指数对冬小麦LAI的敏感性也迥异; 且波段位置的选择对减弱植植冠下土壤类型背景影响极其重要。
2.3 PLSR模型精度分析
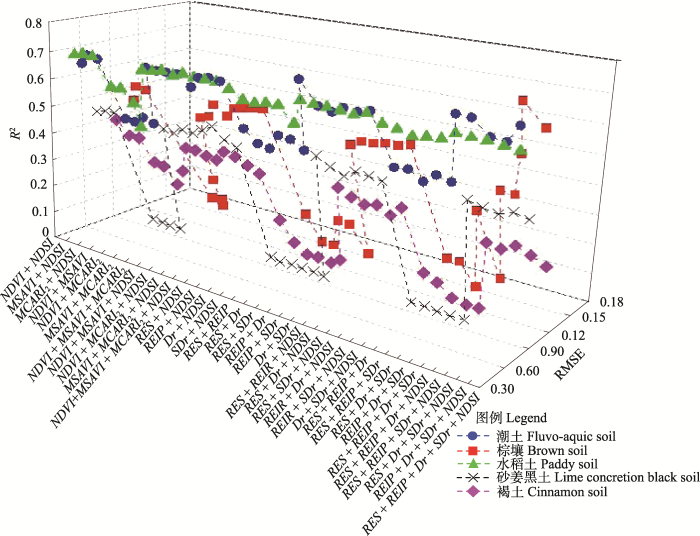
37种变量组合(NDSI和800 nm固定波段反射率计算的NDVI、MSAVI、MCARI2随机且不重复组合, NDSI和红边特征参数RES、REIP、Dr、SDr随机且不重复组合)的PLSR模型交叉验证结果如图5所示。整体上, 水稻土地区的PLSR模型精度(简称PLSR水稻土)较高, 且PLSR水稻土不因输入变量组的不同而有较大差异, R2在0.65上下波动, RMSECV在0.56上下变化。潮土、棕壤、砂姜黑土和褐土地区的PLSR模型精度(简称PLSR潮土、PLSR棕壤、PLSR砂姜黑土、PLSR褐土)在NDSI参与变量组合前后有较大变化。基于对模型过度拟合和优化PLSR模型输入变量个数的考虑, 选择具有最小RMSECV和最大的R2的PLSR模型作为估算冬小麦LAI的最优线性模型(表5)。当考虑土壤类型时, PLSR模型提高了单独使用红边反射特征指数估算冬小麦LAI的精度, 由NDSI和红边反射特征指数构成的4种变量组合, 实现对水稻土、潮土、棕壤和砂姜黑土地区冬小麦LAI的理想估算: 其中PLSRRES+NDSI解释了水稻土地区68.4%的冬小麦LAI变量(RMSECV = 0.533), PLSRRES+REIP+NDSI解释了潮土地区74.3%的冬小麦LAI变量(RMSECV = 0.518), PLSRREIP+Dr+SDr+NDSI解释了棕壤地区77.1%的冬小麦LAI变量(RMSECV = 0.735), PLSRREIP+NDSI解释了砂姜黑土地区49%的冬小麦LAI变量(RMSECV = 0.721); 由NDVI和NDSI构建的PLSR仅解释了褐土地区38.5%的冬小麦LAI变量(RMSECV = 0.954); 同时, 棕壤地区的PLSRREIP+Dr+SDr+NDSI > 潮土地区的PLSRRES+REIP+NDSI >水稻土地区的PLSRRES+NDSI >砂姜黑土地区的PLSRREIP+NDSI >褐土地区的PLSRNDVI+NDSI。当不考虑土壤类型因素时, 5个地区150个样本的分析结果表明, 由RES、REIP、Dr和NDSI组合的PLSR精度最高, 解释了整个研究区34.1%的冬小麦LAI变量(RMSECV = 0.997)。然而, 相比任何单一土壤类型区的冬小麦LAI估算模型精度, 不考虑土壤类型因素时的PLSRRES+REIP+Dr+NDSI精度较低。
值得注意的是, 虽然红边信息对LAI的敏感性是一个复杂问题, 长久以来都没有一致性的结论, 多数****也更倾向于指出红边反射特征指数在描述(叶片或冠层)叶绿素或氮素含量(Schlemmer et al., 2013)、病虫害胁迫(Vogelmann et al., 1993)等方面的研究价值, 但从PLSR模型精度分析结果和不同LAI区间下光谱指数的变异系数比较(表3)中不难得出与已有研究(Horler et al., 1983; Delegido et al., 2013; 高林等, 2017)相似的结论, 即红边信息依然比近红外波段更适宜预测LAI, 以及红边特征光谱指数(如REIP)可认为是近红外-红波段光谱指数预测LAI的理想替代。
2.4 RFR模型精度分析
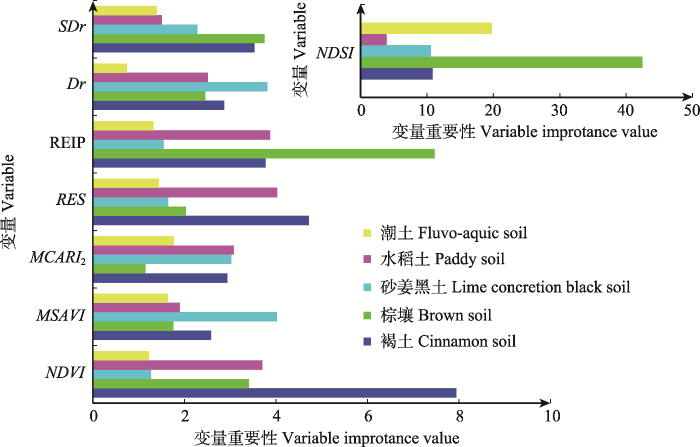
RFR模型是根据ntree与mtry的不同组合构建而成, 其中ntree从1β000-6β000范围以1 000为间隔选取, mtry从1-8范围以1为间隔选取。研究比较了RFR估算的LAI与实测LAI的拟合精度(R2和RMSE), 确定出最优ntree和mtry (表6), 并分析了8种光谱指数在最优RFR估算冬小麦LAI中的重要性(图6)。由表6可知不同土壤类型区的优选ntree和mtry有差异, 且最优RFR估算LAI的精度也不同: 水稻土地区, 由ntree = 1β000, mtry = 2组成的RFR精度最高, R2 = 0.604, RMSE = 0.598; 潮土地区, 由ntree = 1β000, mtry = 8组成的RFR精度最高, R2 = 0.733, RMSE = 0.528; 棕壤地区, 由ntree = 2β000, mtry = 6组成的RFR精度最高, R2 = 0.441, RMSE = 1.155; 砂姜黑土地区, 由ntree = 1β000, mtry = 6组成的RFR精度最高, R2 = 0.488, RMSE = 0.717; 褐土地区, 由ntree = 1β000, mtry = 3组成的RFR精度最高, R2 = 0.258, RMSE = 1.054; 且RFR潮土> RFR水稻土> RFR砂姜黑土> RFR棕壤> RFR褐土。然而, 当不考虑土壤类型时, 由ntree = 2β000, mtry = 4组成的RFR估算冬小麦LAI精度最高, R2 = 0.427, RMSE = 0.930; 但相比于考虑土壤类型(水稻土、潮土和砂姜黑土)时优选的RFR, 不考虑土壤类型时优选的RFR估算冬小麦LAI的精度明显较低。图6显示了8种光谱指数在最优RFR模型中估算冬小麦LAI的重要性: 整体上, NDSI对5种土壤类型区的冬小麦LAI估算最重要; NDVI、MSAVI、MCARI2、RES、REIP、SDr在RFR估算LAI中发挥了不同程度的作用, 且它们之间的重要性差异不大(均小于10)。
Table 5
表5
表5优选的偏最小二乘回归(PLSR)模型估测冬小麦叶面积指数(LAI)结果
Table 5Results of estimating winter wheat leaf area index (LAI) by optimal partial least squares regression (PLSR) models
| 土壤类型 Soil type | PLSR模型 PLSR models | 潜变量个数 Number of latent variables | 建模 Calibration | 交叉验证 Cross validation | |||
|---|---|---|---|---|---|---|---|
| R2 | RMSEC | R2 | RMSECV | RPDCV | |||
| 水稻土 Paddy soil (n = 30) | RES + NDSI | 2 | 0.733 | 0.489 | 0.684 | 0.533 | 1.805 |
| 潮土 Fluvo-aquic soil (n = 30) | RES + REIP + NDSI | 3 | 0.803 | 0.450 | 0.743 | 0.518 | 1.990 |
| 棕壤 Brown soil (n = 30) | REIP + Dr + SDr + NDSI | 4 | 0.837 | 0.617 | 0.771 | 0.735 | 2.118 |
| 砂姜黑土 Lime concretion black soil (n = 30) | REIP + NDSI | 2 | 0.579 | 0.649 | 0.490 | 0.721 | 1.412 |
| 褐土 Cinnamon soil (n = 30) | NDVI + NDSI | 1 | 0.466 | 0.887 | 0.385 | 0.954 | 1.295 |
| 5种土壤 Five type soils (n = 150) | RES + REIP + Dr + NDSI | 4 | 0.378 | 0.968 | 0.341 | 0.997 | 1.236 |
新窗口打开
Table 6
表6
表6优选的随机森林回归(RFR)模型估测冬小麦叶面积指数(LAI)结果
Table 6Results of estimating winter wheat leaf area index (LAI) by optimal random forest regression (RFR) models
| 土壤类型 Soil type | 随机森林回归模型的优化参数 The optimized parameters in RFR | 模型精度 Model precision | ||||
|---|---|---|---|---|---|---|
| ntree | mtry | 变量解释 Variable explained (%) | R2 | RMSE | RPD | |
| 水稻土 Paddy soil (n = 30) | 1 000 | 2 | 60.08 | 0.604 | 0.598 | 1.609 |
| 潮土 Fluvo-aquic soil (n = 30) | 1 000 | 8 | 72.86 | 0.733 | 0.528 | 1.953 |
| 棕壤 Brown soil (n = 30) | 2 000 | 6 | 43.07 | 0.441 | 1.155 | 1.348 |
| 砂姜黑土 Lime concretion black soil (n = 30) | 1 000 | 6 | 48.65 | 0.488 | 0.717 | 1.420 |
| 褐土 Cinnamon soil (n = 30) | 1 000 | 3 | 24.58 | 0.258 | 1.054 | 1.172 |
| 5种土壤 Five type soils (n = 150) | 2 000 | 4 | 42.61 | 0.427 | 0.930 | 1.325 |
新窗口打开
2.5 PLSR与RFR模型精度比较
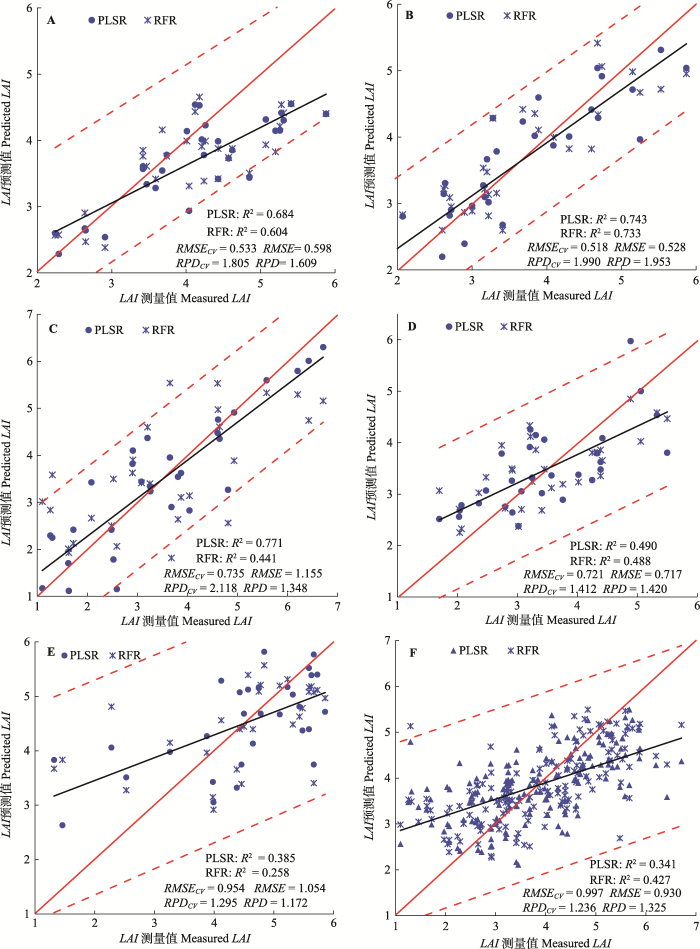
图7描述了PLSR和RFR两种算法最优模型的冬小麦LAI预测精度。当考虑土壤类型背景时, PLSR最优模型对冬小麦LAI的预测精度整体优于RFR, 特别是在棕壤地区, PLSRREIP+Dr+SDr+NDSI的冬小麦LAI预测值与LAI实测值的拟合度远大于RFR(ntree=2000, mtry=6) (R2高0.33, RMSE低0.42, RPD高0.77); 当不考虑土壤类型背景时, RFR(ntree=2000, mtry=4)对冬小麦LAI的解释能力略高于PLSRRES+REIP+Dr+NDSI (R2高0.086, RMSE低0.067, RPD高0.089)。由于考虑土壤类型背景(30个样本)和不考虑土壤类型背景(150个样本)直接反映样本数量的变化, 而随机森林采用Bagging思想, 即通过平均若干多个弱分类器的回归结果, 选择出一个强分类器, 从而提高模型预测的准确性, 使得RFR对样本数量的依赖性极强, 这在一定程度上造成分析少量样本时(即考虑土壤类型背景), RFR优选模型对LAI的解释能力弱于PLSR; 分析大量样本时(即不考虑土壤类型背景), RFR算法估算LAI的能力得到极大改善。因此, Yuan等(2017)曾指出开展大样本数据集(如: 多或全生育期、作物品种或样本区域面积相当大)的LAI预测, 随机森林模型更理想; 但是, Bagging集成学习思想在提高预测精度同时, 也降低了RFR对变量的解释性, 虽然我们能够得知各变量在模型中的重要性(图6), 但对具体哪些参与树节点二叉最优分裂的变量对模型预测起到作用是未知的。相比RFR, 最小二乘法在回归迭代每个输入变量过程中, 不仅将自变量映射为主成分, 确定其系数, 也通过组合那些与因变量相关性大的主成分构建PLSR模型, 因此, PLSR对变量的解释可靠, 且整体性强; 但是, 如果没有红边反射特征指数组合的PLSR或红边反射特征指数与NDSI组合的PLSR对LAI具有理想的解释能力等类似先验知识, 那么从众多变量组合中筛选出最优PLSR所花费的时间和精力远多于优化RFR所花费的时间。
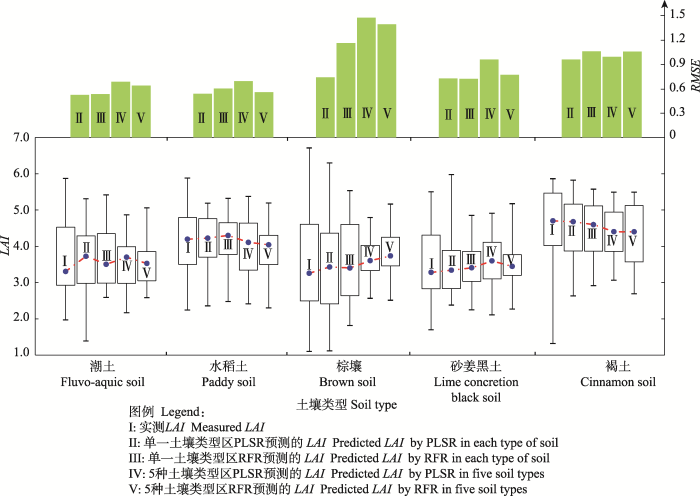
为了进一步探讨土壤类型对回归模型预测LAI的影响, 我们将不考虑土壤类型时预测的冬小麦LAI按已知的5种土壤类型区划分, 将划分的LAI预测值与考虑土壤类型时的LAI预测值以及LAI实测值进行对比(表7; 图8), 结果表明: 5个土壤类型区, 不考虑土壤类型背景时预测的LAI与实测LAI的拟合精度整体低于考虑土壤类型背景时; 不同土壤类型区,
 显示原图|下载原图ZIP|生成PPT
图5不同组合的偏最小二乘回归模型估测叶面积指数(LAI)结果。NDVI、MSAVI、MCARI2、RES、REIP、Dr、SDr、NDSI同
-->Fig. 5Results of different groups of partial least squares regression model for estimating leaf area index (LAI). NDVI, MSAVI, MCARI2, RES, REIP, Dr, SDr, NDSI see
-->
 显示原图|下载原图ZIP|生成PPT
图6优选的随机森林回归(RFR)模型中各变量的重要性。NDVI、MSAVI、MCARI2、RES、REIP、Dr、SDr、NDSI同
-->Fig. 6Variable importance values in optimal random forest regression (RFR) models. NDVI, MSAVI, MCARI2, RES, REIP, Dr, SDr, NDSI see
-->
模型预测的LAI趋势不同(潮土、棕壤、砂姜黑土地区预测的LAI有高估趋势, 褐土地区预测的LAI有低估趋势, 水稻土地区预测的LAI高、低估趋势均有); 是否考虑土壤类型因素对棕壤地区PLSR的LAI预测精度影响较大, 对褐土地区PLSR的LAI预测精度影响较小。
 显示原图|下载原图ZIP|生成PPT
图7冬小麦叶面积指数(LAI)测量值与预测值的拟合精度。A, 水稻土。B, 潮土。C, 棕壤。D, 砂姜黑土。E, 褐土。F, 5种土壤类型。虚线为预测区间线。PLSR, 偏最小二乘回归; RFR, 随机森林回归; RMSE, 均方根误差; RPD, 相对分析误差。
-->Fig. 7Measured vs. predicted leaf area index (LAI). A, Paddy soil. B, Fluvo-aquic soil. C, Brown soil. D, Lime concretion black soil. E, Cinnamon soil. F, Five soil types. Dash lines indicate the confidence intervals of prediction. PLSR, partial least squares regression; RFR, random forest regression; RMSE, root mean square error; RPD, relative percent deviation.
-->
Table 7
表7
表7叶面积指数(LAI)估算精度
Table 7Leaf area index (LAI) predicted accuracy
| 土壤类型 Soil type | 考虑土壤类型因素 Considering the soil background | 不考虑土壤类型因素 Neglecting the soil background | ||||||
|---|---|---|---|---|---|---|---|---|
| PLSR | RFR | PLSR | RFR | |||||
| R2 | RMSECV | R2 | RMSE | R2 | RMSECV | R2 | RMSE | |
| 水稻土 Paddy soil | 0.684 | 0.533 | 0.604 | 0.598 | 0.529 | 0.689 | 0.722 | 0.553 |
| 潮土 Fluvo-aquic soil | 0.743 | 0.518 | 0.733 | 0.528 | 0.559 | 0.682 | 0.635 | 0.632 |
| 棕壤 Brown soil | 0.771 | 0.735 | 0.441 | 1.155 | 0.098 | 1.467 | 0.244 | 1.387 |
| 砂姜黑土 Lime concretion black soil | 0.490 | 0.721 | 0.488 | 0.717 | 0.173 | 0.953 | 0.413 | 0.768 |
| 褐土 Cinnamon soil | 0.385 | 0.954 | 0.258 | 1.054 | 0.349 | 0.986 | 0.287 | 1.052 |
新窗口打开
 显示原图|下载原图ZIP|生成PPT
图8估算叶面积指数(LAI)与实测LAI的箱线图比较。PLSR, 偏最小二乘回归; RFR, 随机森林回归。RMSE, 均方根误差。箱线图从上到下依次表示一组数据的最大值、上四分位数、中位数、下四分位数和最小值。
-->Fig. 8Comparison of measured leaf area index (LAI) and predicted LAI in box plots. PLSR, partial least squares regression; RFR, random forest regression. RMSE, root mean square error. From top to bottom, the box plot represents the maximum, upper quartile, median, lower quartile, and minimum of a set data, respectively.
-->
基于上述分析, 作者认为: 1)土壤类型不同很可能造成长势相同的作物具有不同的光谱指数信息, 因此不考虑土壤类型而直接使用光谱指数估算LAI, 会降低预测LAI的有效性, 容易使人们对作物长势产生错误认知; 2)在小区域尤其是田块尺度的研究中, 模型对变量的解释能力可作为模型选择的第一考虑, 因为参与构建最优模型的变量是农作物长势和墒情最佳描述的数学表达, 对它们的理解有助于改善对作物长势的认知, 便于农业管理的进行, 而在此方面PLSR优于RFR; 3)在未知地表先验知识前提下, RFR对大区域LAI估算比PLSR适合, 但先验知识的获取对LAI遥感估算仍然十分必要。
3 结论
面对当前宽幅、高空间(光谱)分辨率的星载传感器发展趋势, 一景影像往往涵盖多种土壤类型, 农田土壤背景愈加复杂, 而植冠反射率是各种因素物理耦合的结果, 它反映了植被-土壤的光学性质以及它们在冠层内的光子交换过程; 随着植被物候时序变化, 土壤背景的影响随植冠覆盖度的增大而明显减小, 但仍然存在。因此, 研究分析常用的8种光谱指数和估算方法在不同土壤类型区估算LAI的差异, 得出以下结论:1)光谱指数对LAI的敏感性因土壤类型背景不同而差异明显, 因此, 波段位置的合理选择是降低植冠下土壤类型背景影响的首要保证。8个光谱指数中, REIP受植冠下土壤类型背景影响最小; “lambda-by-lambda”波段优选算法不仅可以提供对LAI最敏感的光谱区间, 也可在一定程度上为抵抗植冠下土壤类型差异影响的光谱指数构建提供可行思路。因此, 后期研究可借鉴“lambda-by-lambda”算法发展一种适用于各种陆表条件的可见光-红边-近红外波段的光谱指数。
2)回归模型的LAI预测精度因是否考虑土壤类型而差异明显; 同时, 土壤类型对回归模型估算LAI精度的影响程度也因所使用的回归模型不同而有差异。在小区域研究中, 模型对变量的解释能力可作为模型选择的第一考虑, 而在此方面PLSR优于RFR; 在未知地表先验知识前提下, RFR对大区域LAI估算比PLSR适合, 但先验知识的获取对LAI遥感估算仍然十分必要。
这些研究结论为发展一种适应各种陆表条件的LAI遥感估算方法和宽覆盖卫星影像下基于土壤背景影响去除模型的LAI遥感估算研究提供了理论依据和方法途径; 但鉴于本研究涉及的作物品种、生长阶段以及样本数量有限, 今后我们会在此基础上, 对更复杂的陆表环境开展更深层次的探索。
The authors have declared that no competing interests exist.
作者声明没有竞争性利益冲突.
参考文献 原文顺序
文献年度倒序
文中引用次数倒序
被引期刊影响因子
| [1] | . |
| [2] | . The widely accepted Willst盲tter-Stoll (W-S) theory of leaf reflectance has been investigated by extensive ray tracing through a model (W-S model) in which the leaf cellular structure is approximated by circular arcs. Calculations were performed on an IBM 1800 computer. The W-S model is treated as a two-dimensional, uncentered optical system consisting of a single medium and air. Optical properties of the medium are specified by a complex index of refraction. Given an incident ray, new reflected and transmitted rays are produced at each interface with properties determined by the laws of Snell, Fresnel, and Lambert. Calculations indicate that the W-S model, as exemplified by their artist conception, is too transparent, that is, the magnitude predicted for transmittance is too high. Transmittance is still too high if each interface is treated as a diffusive instead of a smooth surface. The W-S model can be easily improved, however, by introduction of more intercellular air spaces. The modified W-S model promises to be an excellent representation of physical reality. Accurate predictions, however, require an inordinate amount of computer time. |
| [3] | . Hyperspectral data sets contain useful information for characterizing vegetation canopies not previously available from multi-spectral data sources. However, to make full use of the information content one has to find ways for coping with the strong multi-collinearity in the data. The redundancy directly results from the fact that only a few variables effectively control the vegetation signature. This low dimensionality strongly contrasts with the often more than 100 spectral channels provided by modern spectroradiometers and through imaging spectroscopy. With this study we evaluated three different chemometric techniques specifically designed to deal with redundant (and small) data sets. In addition, a widely used 2-band vegetation index was chosen (NDVI) as a baseline approach. A multi-site and multi-date field campaign was conducted to acquire the necessary reference observations. On small subplots the total canopy chlorophyll content was measured and the corresponding canopy signature (450–2500 nm) was recorded ( n obs = 42). Using this data set we investigated the predictive power and noise sensitivity of stepwise multiple linear regression (SMLR) and two ‘full spectrum’ methods: principal component regression (PCR) and partial least squares regression (PLSR). The NDVI was fitted to the canopy chlorophyll content using an exponential relation. For all techniques, a jackknife approach was used to obtain cross-validated statistics. The PLSR clearly outperformed all other techniques. PLSR gave a cross-validated RMSE of 51 mg m 612 ( R cv 2 = 0.82 ) for canopy chlorophyll contents ranging between 38 and 475 mg m 612 (0.99 ≤ LAI ≤ 8.74 m 2 m 612). The lowest accuracy was achieved using PCR (RMSE cv = 82 mg m 612 and R cv 2 = 0.57). The NDVI, even using chlorophyll optimized band settings, could not reach the accuracy of PLSR. Regarding the sensitivity to artificially created (white) noise, PCR showed some advantages, whereas SMLR was the most sensitive chemometric technique. For relatively small, highly multi-collinear data sets the use of partial least square regression is recommended. PLSR makes full use of the rich spectral information while being relatively insensitive to sensor noise. PLSR provides a regression model where the entire spectral information is taken – in a weighted form – into account. This method seems therefore much better adapted to deal with potentially confounding factors compared to any 2-band vegetation index which can only avoid the most harmful factor of variation. |
| [4] | . |
| [5] | . |
| [6] | . |
| [7] | . |
| [8] | . |
| [9] | . To eliminate the confusion in the definition of leaf area index ( L ) for non-flat leaves, the projection coefficients of several objects including spheres, cylinders, hemicircular cylinders, and triangular and square bars are investigated through mathematical derivation and numerical calculation for a range of ellipsoidal angular distributions. It is shown that the projection coefficient calculated based on half the total intercepting area is close to a constant of 0.5 when the inclination angle of the objects is randomly (spherically) distributed, whereas the calculated results based on the object's largest projected area are strongly dependent on the shape of the objects. Therefore, it is suggested that the leaf area index of non-flat leaves be defined as half the total intercepting area per unit ground surface area and that the definition of L based on the projected leaf area be abandoned. |
| [10] | . The main objective was to determine whether partial least squares (PLS) regression improves grass/herb biomass estimation when compared with hyperspectral indices, that is normalised difference vegetation index (NDVI) and red-edge position (REP). To achieve this objective, fresh green grass/herb biomass and airborne images (HyMap) were collected in the Majella National Park, Italy in the summer of 2005. The predictive performances of hyperspectral indices and PLS regression models were then determined and compared using calibration ( n = 30) and test ( n = 12) data sets. The regression model derived from NDVI computed from bands at 740 and 771 nm produced a lower standard error of prediction (SEP = 264 g m 612) on the test data compared with the standard NDVI involving bands at 665 and 801 nm (SEP = 331 g m 612), but comparable results with REPs determined by various methods (SEP = 261 to 295 g m 612). PLS regression models based on original, derivative and continuum-removed spectra produced lower prediction errors (SEP = 149 to 256 g m 612) compared with NDVI and REP models. The lowest prediction error (SEP = 149 g m 612, 19% of mean) was obtained with PLS regression involving continuum-removed bands. In conclusion, PLS regression based on airborne hyperspectral imagery provides a better alternative to univariate regression involving hyperspectral indices for grass/herb biomass estimation in the Majella National Park. |
| [11] | . |
| [12] | . Leaf area index (LAI) is a key biophysical parameter for the monitoring of agroecosystems. Conventional two-band vegetation indices based on red and near-infrared relationships such as the normalized difference vegetation index (NDVI) are well known to suffer from saturation at moderate-to-high LAI values (3 5). To bypass this saturation effect, in this work a robust alternative has been proposed for the estimation of green LAI over a wide variety of crop types. By using data from European Space Agency (ESA) campaigns SPARC 2003 and 2004 (Barrax, Spain) experimental LAI values over 9 different crop types have been collected while at the same time spaceborne imagery have been acquired using the hyperspectral CHRIS (Compact High Resolution Imaging Spectrometer) sensor onboard PROBA (Project for On-Board Autonomy) satellite. This extensive dataset allowed us to evaluate the optimal band combination through spectral indices based on normalized differences. The best linear correlation against the experimental LAI dataset was obtained by combining the 674/nm and 712/nm wavebands. These wavelengths correspond to the maximal chlorophyll absorption and the red-edge position region, respectively, and are known to be sensitive to the physiological status of the plant. Contrary to the NDVI ( r 2 : 0.68), the red-edge NDI correlated strongly ( r 2 : 0.82) with LAI without saturating at larger values. The index has been subsequently validated against field data from the 2009 SEN3EXP campaign (Barrax, Spain) that again spanned a wide variety of crop types. A linear relationship over the full LAI range was confirmed and the regression equation was applied to a CHRIS/PROBA image acquired during the same campaign. A LAI map has been derived with an RMSE accuracy of 0.6. It is concluded that the red-edge spectral index is a powerful alternative for LAI estimation and may provide valuable information for precision agriculture, e.g. when applied to high spatial resolution imagery. |
| [13] | . . Cited: 2017-9-1. |
| [14] | . |
| [15] | . Advanced information on crop yield is important for crop management and food policy making. A data assimilation approach was developed to integrate remotely sensed data with a crop growth model for crop yield estimation. The objective was to model the crop yield when the input data for the crop growth model are inadequate, and to make the yield forecast in the middle of the growing season. The Cropping System Model (CSM)–Crop Environment Resource Synthesis (CERES)–Maize and the Markov Chain canopy Reflectance Model (MCRM) were coupled in the data assimilation process. The Moderate Resolution Imaging Spectroradiometer (MODIS) Leaf Area Index (LAI) and vegetation index products were assimilated into the coupled model to estimate corn yield in Indiana, USA. Five different assimilation schemes were tested to study the effect of using different control variables: independent usage of LAI, normalized difference vegetation index (NDVI) and enhanced vegetation index (EVI), and synergic usage of LAI and EVI or NDVI. Parameters of the CSM–CERES–Maize model were initiated with the remotely sensed data to estimate corn yield for each county of Indiana. Our results showed that the estimated corn yield agreed very well with the US Department of Agriculture (USDA) National Agricultural Statistics Service (NASS) data. Among different scenarios, the best results were obtained when both MODIS vegetation index and LAI products were assimilated and the relative deviations from the NASS data were less than 3.5%. Including only LAI in the model performed moderately well with a relative difference of 8.6%. The results from using only EVI or NDVI were unacceptable, as the deviations were as high as 21% and 6113% for the EVI and NDVI schemes, respectively. Our study showed that corn yield at harvest could be successfully predicted using only a partial year of remotely sensed data. |
| [16] | . This article is the continuation of a study of the relationship between NDVI and rainfall in semiarid Botswana. That study notes significant differences in the NDVI-rainfall relationship for various soil types and a much higher ratio of NDVI to rainfall over Botswana than over comparable regions of the Sahel or East Africa. The current article examines the extent to which differences in the rate of soil moisture generation, as a function of soil type or locality, can account for these results. It concludes that they cannot. This study demonstrates that the five soil types do differ significantly with respect to both the rate of soil moisture generation per unit rainfall and the ratio of NDVI to soil moisture. The most productive soils are the clay-rich vertisols; the arenosols are the least productive, although the rate of soil moisture generation is about the same for both soil types. The results also suggest that over Botswana NDVI may be significantly influenced by soil reflectivity and that the vegetation growth is promoted by exogenous soil water originating as runoff in the surrounding higher terrain. |
| [17] | . . 以不同类型小麦品种在氮素差异梯度下连续3 a田间试验为基础,在关键生育时期同步测定冠层光谱反射率、叶片干物质量及氮含量,探索建立小麦叶片氮素状况估算的新型红边参数及监测模型.结果表明,冠层微分光谱在红边区域内随氮素水平提高呈明显规律性变化,而原始光谱反射率的变化却较为复杂.与叶片氮积累量关系密切的常见红边参数间存在差异,其中,以GM2、SR705和FD742表现最突出,线性回归模型拟合精度(R~2)分别为0.854、0.848和0.873,估计标准误差(SE)分别为1.136、1.160和1.059.基于红边双峰特征分析,构建新型红边双峰特征参数,其中,红边左偏峰面积LSDr_REP_(LE)对叶片氮积累量方程拟合取得很好效果,决定系数和估计标准误差分别为0.869和1.080.经不同年际独立数据的检验表明,以GM2、SR705和FD742为变量,模型预测平均相对误差(RE)分别为17.6%、17.0%和14.9%,而红边左偏峰面积LSDr_REP_(LE)模型预测误差控制得更好,平均相对误差RE为14.5%.以上表明,红边参数GM2、SR705和FD742可以对小麦叶片氮素状况进行有效监测,而红边左偏峰面积LSDr_REP_(LE)模型预测更为准确可靠. |
| [18] | . |
| [19] | . . |
| [20] | . |
| [21] | . |
| [22] | . |
| [23] | . |
| [24] | . |
| [25] | . A transformation technique is presented to minimize soil brightness influences from spectral vegetation indices involving red and near-infrared (NIR) wavelengths. Graphically, the transformation involves a shifting of the origin of reflectance spectra plotted in NIR-red wavelength space to account for first-order soil-vegetation interactions and differential red and NIR flux extinction through vegetated canopies. For cotton ( Gossypium hirsutum L. var DPI-70) and range grass ( Eragrostics lehmanniana Nees) canopies, underlain with different soil backgrounds, the transformation nearly eliminated soil-induced variations in vegetation indices. A physical basis for the soil-adjusted vegetation index (SAVI) is subsequently presented. The SAVI was found to be an important step toward the establishment of simple lobal that can describe dynamic soil-vegetation systems from remotely sensed data. |
| [26] | . The spectral behavior of a cotton canopy with four soil types alternately inserted underneath was examined at various levels of vegetation density. Measured composite spectra, representing various mixtures of vegetation with different soil backgrounds, were compared with existing measures of greenness, including the NIR-red band ratios, the perpendicular vegetation index (PVI), and the greenness vegetation index (GVI). Observed spectral patterns involving constant vegetation amounts with different soil backgrounds could not be explained nor predicted by either the ratio or the orthogonal greenness measures. All greenness measures were found to be strongly dependent on soil brightness. Furthermore, soil-induced greenness changes became greater with increasing amounts of vegetation up to 60% green cover. The results presented suggests that soil and plant spectra interactively mix in a nonadditive, partly correlated manner to produce composite canopy spectra. |
| [27] | . A physically based linear stochastic geometric canopy-soil reflectance model is presented for characterizing spatial variability of semivegetated landscapers at subpixel and regional scales. Landscapes are conceptualized as stochastic geometric surfaces, incorporating not only the variability in geometric elements but also the variability in vegetation and soil background reflectance, which can be important in some scenes. The model is used to investigate several possible mechanisms which contribute to the often observed characteristic triangular shape of red-infrared scattergrams of semivegetated landscapes. Scattergrams of simulated semivegetated scenes are analyzed with respect to the scales of the satellite pixel and subpixel components |
| [28] | . |
| [29] | . |
| [30] | . |
| [31] | . |
| [32] | . |
| [33] | . Abstract As important parameters in the land-atmosphere system, both soil moisture (SM) and vegetation play a significant role in land-atmosphere interactions. Using observational data from clay and sand stations over central eastern China, the relationship between leaf area index (LAI) and SM (LAI-SM) in different types of soil was investigated. The results show that the LAI-SM correlation is significantly positive in clay but not significant in sand. The physical causes for the discrepant LAI-SM correlations in different types of soil were explored from the perspectives of evapotranspiration (ET) and soil water retention. In clay stations, increasing LAI is associated with greater soil-water-retention capacity. Although the increasing LAI corresponds to increasing ET, the impact of ET on SM is weak because of the small particle size of soil. Consequently, the LAI-SM relationship in clay is significantly positive. In sand stations, ET is negatively correlated with SM owing to the large soil particle size, resulting in a negative LAI-SM correlation in sand. However, soil water retention is weakened by the increased LAI, which may be an important factor causing the insignificant LAI-SM correlation in sand. |
| [34] | . |
| [35] | . Empirical studies report several plausible correlations between transforms of spectral reflectance, called vegetation indexes, and parameters descriptive of vegetation leaf area, biomass and physiological functioning. However, most indexes can be gen... |
| [36] | . |
| [37] | . A transformation technique is presented to minimize soil brightness influences from spectral vegetation indices involving red and near-infrared (NIR) wavelengths. Graphically, the transformation involves a shifting of the origin of reflectance spectra plotted in NIR-red wavelength space to account for first-order soil-vegetation interactions and differential red and NIR flux extinction through vegetated canopies. For cotton (Gossypium hirsutum L. var DPI-70) and range grass (Eragrosticslehmanniana Nees) canopies, underlain with different soil backgrounds, the transformation nearly eliminated soil-induced variations in vegetation indices. A physical basis for the soil-adjusted vegetation index (SAVI) is subsequently presented. The SAVI was found to be an important step toward the establishment of simple lobal that can describe dynamic soil-vegetation systems from remotely sensed data. |
| [38] | . |
| [39] | . <P>There are reflectance spectra in the visible and near infrared wavelengths from some 20 000 archived samples of soil in Australia. Their particular forms depend on absorbances at specific wavelengths characteristic of components in the soil such as water, iron oxides, clay minerals and carbon compounds, and so one might expect to be able to predict soil properties from the spectra. We tested a tree-based technique for the prediction of 24 soil properties. A tree is first constructed by the definition of rules that separate the data into fairly homogeneous groups for any given property on both the absorptions at specified wavelengths and other, categoric, variables. Then within each group the property is predicted from the absorptions at those wavelengths by ordinary least-squares regression. The spectroscopic predictions of the soil properties were compared with actual values in a subset of sample data separated from the whole data for validation. The criteria of success that we used were the root mean squared error (RMSE) to measure the inaccuracy of our predictions, the mean error (ME) to measure their bias and the standard deviation of the error (SDE) to measure their imprecision. We also used the ratio of performance to deviation (RPD), which is the ratio of the standard deviation of the observed values to the RMSE of the predictions; the larger it is the better does the technique perform. We found good predictions (RPD>2) for clay and total sand content, for total organic carbon and total nitrogen, pH, cation exchange capacity, and exchangeable calcium, magnesium and sodium. Several other properties were moderately well predicted (1.5 RPD < 2); they included air-dry water content, volumetric water content at field capacity and wilting point, bulk density, the contents of silt, fine sand and coarse sand, total and exchangeable potassium, total phosphorus and extractable iron. Properties that were poorly predicted (RPD < 1.5) include the carbon-to-nitrogen ratio, available phosphorus and exchangeable acidity. We conclude that even though the predictions are less accurate than direct measurements, the spectra are cheap yet valuable sources of information for predicting values of individual soil properties when large numbers of analyses are needed, for example, for soil mapping.</P> |
| [40] | . . Cited: 2017-9-1. |
| [41] | . |
| [42] | . |
| [43] | . |
| [44] | . CRC Press, New York. |
| [45] | . |
| [46] | . |
| [47] | . |
| [48] | . |
| [49] | . National Defense Industry Press, Beijing. . 国防工业出版社, 北京.] |
| [50] | . |
| [51] | . Spectrophotometric transmittance and reflectance curves were recorded for wavelengths from 0.45 (in some cases 0.34) to 2.7 micrometers for faces and backs of leaves and for stacked leaves of several plant species. Measurements were made at different angles of illumination. Leaf spectrophotometric curves were compared with curves for leaf extracts, potato tuber tissue, glass beads in water, and frozen leaves to demonstrate the physical bases for the leaf curves. Leaves were infiltrated with liquids of different refractive indices for further comparison of spectrophotometric curves. Goniophotometric reflectance curves were recorded, giving visible reflectance and degree of polarization as functions of viewing angle for two different angles of illumination.No retroreflection was observed, and no phenomena were observed which could be attributed to interference because of similarity between leaf structural sizes and wavelengths used. |
| [52] | . 北京大学出版社, 北京.] |
| [53] | . |
| [54] | . |
| [55] | . Monitoring in situ chlorophyll (Chl) content in agricultural crop leaves is of great importance for stress detection, nutritional state diagnosis, yield prediction and studying the mechanisms of plant and environment interaction. Numerous spectral indices have been developed for chlorophyll estimation from leaf- and canopy-level reflectance. However, in most cases, these indices are negatively affected by variations in canopy structure and soil background. The objective of this study was to develop spectral indices that can reduce the effects of varied canopy structure and growth stages for the estimation of leaf Chl. Hyperspectral reflectance data was obtained through simulation by a radiative transfer model, PROSAIL, and measurements from canopies of barley comprising different cultivars across growth stages using spectroradiometers. We applied a comprehensive band-optimization algorithm to explore five types of spectral indices: reflectance difference (RD), reflectance ratio (RR), normalized reflectance difference (NRD), difference of reflectance ratio (DRR) and ratio of reflectance difference (RRD). Indirectly using the multiple scatter correction (MSC) theory, we hypothesized that RRD can eliminate adverse effects of soil background, canopy structure and multiple scattering. Published indices and multivariate models such as optimum multiple band regression (OMBR), partial least squares regression (PLSR) and support vector machines for regression (SVR) were also employed. Results showed that the ratio of reflectance difference index (RRDI) optimized for simulated data significantly improved the correlation with Chl ( R 2 02=020.98, p 02<020.0001) and was insensitive to LAI variations (1–8), compared to widely used indices such as MCARI/OSAVI ( R 2 02=020.64, p 02<020.0001) and TCARI/OSAVI ( R 2 02=020.74, p 02<020.0001). The RRDI optimized for barley explained 76% of the variation in Chl and outperformed multivariate models. However, the accuracy decreased when employing the indices for individual growth stages ( R 2 02<020.59). Accordingly, RRDIs optimized for open and closed canopies improved the estimations of Chl for individual stages before and after canopy closure, respectively, with R 2 of 0.65 ( p 02<020.0001) and 0.78 ( p 02<020.0001). This study shows that RRDI can efficiently eliminate the effects of structural properties on canopy reflectance response to canopy biochemistry. The results yet are limited to the datasets used in this study; therefore, transferability of the methods to large scales or other datasets should be further evaluated. |
| [56] | . Remote sensing is a promising tool that provides quantitative and timely information for crop stress detection over large areas. Nitrogen (N) is one of the important nutrient elements influencing grain yield and quality of winter wheat (Triticum aestivum L.). In this study, canopy spectral parameters were evaluated for N status assessment in winter wheat. A winter wheat field experiment with 25 different cultivars was conducted at the China National Experimental Station for Precision Agriculture, Beijing, China. Wheat canopy spectral reflectance over 350 2500 nm at different stages was measured with an ASD FieldSpec Pro 2500 spectrometer (Analytical Spectral Devices, Boulder, CO, USA) fitted with a 25 field of view (FOV) fibre optic adaptor. Thirteen narrow-band spectral indices, three spectral features parameters associated with the absorption bands centred at 670 and 980 nm and another three related to reflectance maximum values located at 560, 920, 1690 and 2230 nm were calculated and correlated with leaf N concentration (LNC) and canopy N density (CND). The results showed that CND was a more sensitive parameter than LNC in response to the variation of canopy-level spectral parameters. The correlation coefficient values between LNC and CND, on the one hand, and narrow-band spectral indices and spectral features parameters, on the other hand, varied with the growth stages of winter wheat, with no predominance of a single spectral parameter as the best variable. The differences in correlation results for the relationships of CND and LNC with narrow-band spectral indices and spectral features parameters decreased with wheat plant developing from Feekes 4.0 to Feekes 11.1. The red edge position (REP) was demonstrated to be a good indicator for winter wheat LNC estimation. The absorption band depth (ABD) normalized to the area of absorption feature (NBD) at 670 nm (NBD670) was the most reliable indicator for winter wheat canopy N status assessment. |
2003
Willst?tter- Stoll theory of leaf reflectance evaluated by ray tracing
1
1973
... 20世纪70年代, 遥感在揭示植物形态特征、物候状态与其光学性质之间的联系方面起到关键作用(
Comparative analysis of three chemometric techniques for the spectroradiometric assessment of canopy chlorophyll content in winter wheat
1
2010
... PLSR法是一种集多元线性回归分析、主成分分析和典型相关分析于一体的, 基于自变量(X)的潜变量关于因变量(Y)的潜变量的线性回归模型, 间接描述自变量与因变量关系的回归建模方法(
Potentials and limits of vegetation indices for LAI and APAR assessment
1
1991
...
Soil background effects on reflectance- based crop coefficients for corn
1
1993
... 土壤背景对植冠光谱的影响主要涉及两点: 一是土壤的表面状况, 包括朝向、粗糙度、阴影、结壳、秸秆残留物等; 二是影响土壤光谱特征的内在物理和化学性质, 包括矿物、有机质、水分、颗粒大小、土壤结构.许多****分析了土壤湿度对遥感估算LAI的影响(
Forecasting crop yield using remotely sensed vegetation indices and crop phenology metrics
1
2013
... 叶面积指数(LAI)是表征植物几何结构的关键参数, 被定义为单位地表面积上绿叶表面积总和的一半(
Random forests
1
2001
... 随机森林(
Comparing prediction power and stability of broadband and hyperspectral vegetation indices for estimation of green leaf area index and canopy chlorophyll density
1
2001
... 20世纪70年代, 遥感在揭示植物形态特征、物候状态与其光学性质之间的联系方面起到关键作用(
Defining leaf area index for non-flat leaves
1
1992
... 叶面积指数(LAI)是表征植物几何结构的关键参数, 被定义为单位地表面积上绿叶表面积总和的一半(
Estimation of green grass/herb biomass from airborne hyperspectral imagery using spectral indices and partial least squares regression
1
2007
... 其中, T、U分别是X和Y的主成分矩阵(score矩阵); P、Q分别是X和Y的回归系数矩阵(loading矩阵); E、F分别是X和Y的残差矩阵; P、Q的上标T表示矩阵转置运算; b是方程系数; e是T和U的残差矩阵; G是预测Y的新残差矩阵.目前, PLSR在高光谱遥感探测植物物理化学参数方面得到广泛使用(
Red-edge response to forest leaf area index
1995
A red-edge spectral index for remote sensing estimation of green LAI over agroecosystems
1
2013
... 值得注意的是, 虽然红边信息对LAI的敏感性是一个复杂问题, 长久以来都没有一致性的结论, 多数****也更倾向于指出红边反射特征指数在描述(叶片或冠层)叶绿素或氮素含量(
Quantitative analysis from unifying field and airborne hyperspectral in prediction biophysical parameters by using partial least square (PLSR) and Normalized Difference Spectral Index (NDSI)
2
2009
... R是光谱反射率.NDSI采用“lambda-by-lambda”波段优选算法计算(
... R is spectral reflectance. NDSI calculated by band optimized algorithm of “lambda-by-lambda” (
Normalized difference spectral indices and partial least squares regression to assess the yield and yield components of peanut
2
2015
... R是光谱反射率.NDSI采用“lambda-by-lambda”波段优选算法计算(
... R is spectral reflectance. NDSI calculated by band optimized algorithm of “lambda-by-lambda” (
Integration of MODIS LAI and vegetation index products with the CSM-CERES-Maize model for corn yield estimation
1
2011
... 叶面积指数(LAI)是表征植物几何结构的关键参数, 被定义为单位地表面积上绿叶表面积总和的一半(
The influence of soil type on the relationships between NDVI, rainfall, and soil moisture in semiarid Botswana. II. NDVI response to soil moisture
1
1994
... 土壤背景对植冠光谱的影响主要涉及两点: 一是土壤的表面状况, 包括朝向、粗糙度、阴影、结壳、秸秆残留物等; 二是影响土壤光谱特征的内在物理和化学性质, 包括矿物、有机质、水分、颗粒大小、土壤结构.许多****分析了土壤湿度对遥感估算LAI的影响(
利用红边特征参数监测小麦叶片氮素积累状况
2009
The red edge position and shape as indicators of plant chlorophyll content, biomass and hydric status
1994
基于光谱特征与PLSR结合的叶面积指数拟合方法的无人机画幅高光谱遥感应用
2
2017
... 在北京时间11: 00-14: 00, 天气晴朗无云, 太阳光强度稳定时, 使用ASD FieldSpec Pro2500光谱辐射仪(Analytical Spectral Device, Boulder, USA)采集样方内冬小麦冠层光谱反射率, 并且待每一个样方的光谱采集工作结束, 随即插上标杆以便下一步进行LAI测量.ASD的光谱采集范围是350-2β500 nm, 其中350-1β000 nm范围的光谱采样间隔为1.4 nm; 1β000-2β500 nm范围的光谱采样间隔为2 nm (
... 值得注意的是, 虽然红边信息对LAI的敏感性是一个复杂问题, 长久以来都没有一致性的结论, 多数****也更倾向于指出红边反射特征指数在描述(叶片或冠层)叶绿素或氮素含量(
Reflectance and internal structure of cotton leaves,Gossypium hirsutum L
1
1969
... 20世纪70年代, 遥感在揭示植物形态特征、物候状态与其光学性质之间的联系方面起到关键作用(
Hyperspectral vegetation indices and novel algorithms for predicting green LAI of crop canopies: Modeling and validation in the context of precision agriculture
1
2004
... 土壤背景对植冠光谱的影响主要涉及两点: 一是土壤的表面状况, 包括朝向、粗糙度、阴影、结壳、秸秆残留物等; 二是影响土壤光谱特征的内在物理和化学性质, 包括矿物、有机质、水分、颗粒大小、土壤结构.许多****分析了土壤湿度对遥感估算LAI的影响(
Reflectance measurement of canopy biomass and nitrogen status in wheat crops using normalized difference vegetation indices and partial least squares regression
1
2003
... 其中, T、U分别是X和Y的主成分矩阵(score矩阵); P、Q分别是X和Y的回归系数矩阵(loading矩阵); E、F分别是X和Y的残差矩阵; P、Q的上标T表示矩阵转置运算; b是方程系数; e是T和U的残差矩阵; G是预测Y的新残差矩阵.目前, PLSR在高光谱遥感探测植物物理化学参数方面得到广泛使用(
LAI assessment of wheat and potato crops by VENμS and Sentinel-2 bands
1
2011
... 其中, T、U分别是X和Y的主成分矩阵(score矩阵); P、Q分别是X和Y的回归系数矩阵(loading矩阵); E、F分别是X和Y的残差矩阵; P、Q的上标T表示矩阵转置运算; b是方程系数; e是T和U的残差矩阵; G是预测Y的新残差矩阵.目前, PLSR在高光谱遥感探测植物物理化学参数方面得到广泛使用(
The red edge of plant leaf reflectance
1
1983
... 值得注意的是, 虽然红边信息对LAI的敏感性是一个复杂问题, 长久以来都没有一致性的结论, 多数****也更倾向于指出红边反射特征指数在描述(叶片或冠层)叶绿素或氮素含量(
A soil-adjusted vegetation index (SAVI)
1
1988
... 土壤背景对植冠光谱的影响主要涉及两点: 一是土壤的表面状况, 包括朝向、粗糙度、阴影、结壳、秸秆残留物等; 二是影响土壤光谱特征的内在物理和化学性质, 包括矿物、有机质、水分、颗粒大小、土壤结构.许多****分析了土壤湿度对遥感估算LAI的影响(
Spectral response of a plant canopy with different soil backgrounds
1
1985
... 土壤背景对植冠光谱的影响主要涉及两点: 一是土壤的表面状况, 包括朝向、粗糙度、阴影、结壳、秸秆残留物等; 二是影响土壤光谱特征的内在物理和化学性质, 包括矿物、有机质、水分、颗粒大小、土壤结构.许多****分析了土壤湿度对遥感估算LAI的影响(
The structure of red-infrared scattergrams of semivegetated landscapes
1989
Estimating leaf chlorophyll content using red edge parameters
2010
Hyperspectral versus multispectral data for estimating leaf area index in four different biomes
1
2004
... 20世纪70年代, 遥感在揭示植物形态特征、物候状态与其光学性质之间的联系方面起到关键作用(
Comparing hyperspectral index optimization algorithms to estimate aerial N uptake using multi-temporal winter wheat datasets from contrasting climatic and geographic zones in China and Germany
2013
Comparative analysis of GF-1, HJ-1, and Landsat-8 data for estimating the leaf area index of winter wheat
1
2017
... 20世纪70年代, 遥感在揭示植物形态特征、物候状态与其光学性质之间的联系方面起到关键作用(
Exploring the best hyperspectral features for LAI estimation using partial least squares regression
1
2014
... 其中, T、U分别是X和Y的主成分矩阵(score矩阵); P、Q分别是X和Y的回归系数矩阵(loading矩阵); E、F分别是X和Y的残差矩阵; P、Q的上标T表示矩阵转置运算; b是方程系数; e是T和U的残差矩阵; G是预测Y的新残差矩阵.目前, PLSR在高光谱遥感探测植物物理化学参数方面得到广泛使用(
The relationship between soil moisture and LAI in different types of soil in central eastern China
1
2016
... 土壤背景对植冠光谱的影响主要涉及两点: 一是土壤的表面状况, 包括朝向、粗糙度、阴影、结壳、秸秆残留物等; 二是影响土壤光谱特征的内在物理和化学性质, 包括矿物、有机质、水分、颗粒大小、土壤结构.许多****分析了土壤湿度对遥感估算LAI的影响(
Discriminant Analysis and Statistical Pattern Recognition
1
2004
... 本文选择决定系数(R2)、均方根误差(RMSE)和相对分析误差(RPD)(
The interpretation of spectral vegetation indices
1
1995
...
Measuring and modeling the effect of surface moisture on the spectral reflectance of coastal beach sand
1
2014
... 土壤背景对植冠光谱的影响主要涉及两点: 一是土壤的表面状况, 包括朝向、粗糙度、阴影、结壳、秸秆残留物等; 二是影响土壤光谱特征的内在物理和化学性质, 包括矿物、有机质、水分、颗粒大小、土壤结构.许多****分析了土壤湿度对遥感估算LAI的影响(
A modified soil adjusted vegetation index
1
1994
... 土壤背景对植冠光谱的影响主要涉及两点: 一是土壤的表面状况, 包括朝向、粗糙度、阴影、结壳、秸秆残留物等; 二是影响土壤光谱特征的内在物理和化学性质, 包括矿物、有机质、水分、颗粒大小、土壤结构.许多****分析了土壤湿度对遥感估算LAI的影响(
Optimization of soil-adjusted vegetation indices
1
1996
... 土壤背景对植冠光谱的影响主要涉及两点: 一是土壤的表面状况, 包括朝向、粗糙度、阴影、结壳、秸秆残留物等; 二是影响土壤光谱特征的内在物理和化学性质, 包括矿物、有机质、水分、颗粒大小、土壤结构.许多****分析了土壤湿度对遥感估算LAI的影响(
Predicting soil properties from the Australian soil visible-near infrared spectroscopic database
1
2012
... 本文选择决定系数(R2)、均方根误差(RMSE)和相对分析误差(RPD)(
Monitoring the vernal advancements and retrogradation of natural vegetation, NASA/GSFC, Type III, Final Report
1
1974
... 土壤背景对植冠光谱的影响主要涉及两点: 一是土壤的表面状况, 包括朝向、粗糙度、阴影、结壳、秸秆残留物等; 二是影响土壤光谱特征的内在物理和化学性质, 包括矿物、有机质、水分、颗粒大小、土壤结构.许多****分析了土壤湿度对遥感估算LAI的影响(
A linear physically- based model for remote sensing of soil moisture using short wave infrared bands
1
2015
... 土壤背景对植冠光谱的影响主要涉及两点: 一是土壤的表面状况, 包括朝向、粗糙度、阴影、结壳、秸秆残留物等; 二是影响土壤光谱特征的内在物理和化学性质, 包括矿物、有机质、水分、颗粒大小、土壤结构.许多****分析了土壤湿度对遥感估算LAI的影响(
Remote estimation of nitrogen and chlorophyll contents in maize at leaf and canopy levels
1
2013
... 值得注意的是, 虽然红边信息对LAI的敏感性是一个复杂问题, 长久以来都没有一致性的结论, 多数****也更倾向于指出红边反射特征指数在描述(叶片或冠层)叶绿素或氮素含量(
Comparison of different regression models and validation techniques for the assessment of wheat leaf area index from hyperspectral data
1
2015
... 本文选择决定系数(R2)、均方根误差(RMSE)和相对分析误差(RPD)(
Hyperspectral Remote Sensing of Vegetation
2012
Responses of spectral indices to variations in vegetation cover and soil background
1
1998
... 土壤背景对植冠光谱的影响主要涉及两点: 一是土壤的表面状况, 包括朝向、粗糙度、阴影、结壳、秸秆残留物等; 二是影响土壤光谱特征的内在物理和化学性质, 包括矿物、有机质、水分、颗粒大小、土壤结构.许多****分析了土壤湿度对遥感估算LAI的影响(
Comparison of different vegetation indices for the remote assessment of green leaf area index of crops
1
2011
... 20世纪70年代, 遥感在揭示植物形态特征、物候状态与其光学性质之间的联系方面起到关键作用(
Red edge spectral measurements from sugar maple leaves
1
1993
... 值得注意的是, 虽然红边信息对LAI的敏感性是一个复杂问题, 长久以来都没有一致性的结论, 多数****也更倾向于指出红边反射特征指数在描述(叶片或冠层)叶绿素或氮素含量(
A comparison of three methods for estimating leaf area index of paddy rice from optimal hyperspectral bands
1
2011
... 20世纪70年代, 遥感在揭示植物形态特征、物候状态与其光学性质之间的联系方面起到关键作用(
偏最小二乘回归的线性与非线性方法
2006
PLS-regression: A basic tool of chemometrics
1
2001
... PLSR法是一种集多元线性回归分析、主成分分析和典型相关分析于一体的, 基于自变量(X)的潜变量关于因变量(Y)的潜变量的线性回归模型, 间接描述自变量与因变量关系的回归建模方法(
Reflectance and transmittance of light by leaves
1
1971
... 20世纪70年代, 遥感在揭示植物形态特征、物候状态与其光学性质之间的联系方面起到关键作用(
遥感物理
2005
A comparison of partial least squares regression with other prediction methods
1
2002
... PLSR法是一种集多元线性回归分析、主成分分析和典型相关分析于一体的, 基于自变量(X)的潜变量关于因变量(Y)的潜变量的线性回归模型, 间接描述自变量与因变量关系的回归建模方法(
Retrieving soybean leaf area index from unmanned aerial vehicle hyperspectral remote sensing: Analysis of RF, ANN, and SVM regression models
1
2017
... 由于考虑土壤类型背景(30个样本)和不考虑土壤类型背景(150个样本)直接反映样本数量的变化, 而随机森林采用Bagging思想, 即通过平均若干多个弱分类器的回归结果, 选择出一个强分类器, 从而提高模型预测的准确性, 使得RFR对样本数量的依赖性极强, 这在一定程度上造成分析少量样本时(即考虑土壤类型背景), RFR优选模型对LAI的解释能力弱于PLSR; 分析大量样本时(即不考虑土壤类型背景), RFR算法估算LAI的能力得到极大改善.因此,
Estimating leaf chlorophyll of barley at different growth stages using spectral indices to reduce soil background and canopy structure effects
1
2014
... 土壤背景对植冠光谱的影响主要涉及两点: 一是土壤的表面状况, 包括朝向、粗糙度、阴影、结壳、秸秆残留物等; 二是影响土壤光谱特征的内在物理和化学性质, 包括矿物、有机质、水分、颗粒大小、土壤结构.许多****分析了土壤湿度对遥感估算LAI的影响(
Relationships of leaf nitrogen concentration and canopy nitrogen density with spectral features parameters and narrow-band spectral indices calculated from field winter wheat (Triticum aestivum L.) spectra
1
2012
... 在北京时间11: 00-14: 00, 天气晴朗无云, 太阳光强度稳定时, 使用ASD FieldSpec Pro2500光谱辐射仪(Analytical Spectral Device, Boulder, USA)采集样方内冬小麦冠层光谱反射率, 并且待每一个样方的光谱采集工作结束, 随即插上标杆以便下一步进行LAI测量.ASD的光谱采集范围是350-2β500 nm, 其中350-1β000 nm范围的光谱采样间隔为1.4 nm; 1β000-2β500 nm范围的光谱采样间隔为2 nm (

