中国林业科学研究院森林生态环境与保护研究所, 国家林业局森林生态环境重点实验室, 北京 100091
A comparison of spectral reflectance indices in response to water: A case study of Quercus aliena var. acuteserrata
LIUChang, SUNPeng-Sen版权声明:2017植物生态学报编辑部本文是遵循CCAL协议的开放存取期刊,引用请务必标明出处。
基金资助:
展开
摘要
关键词:
Abstract
Keywords:
-->0
PDF (1534KB)元数据多维度评价相关文章收藏文章
本文引用格式导出EndNoteRisBibtex收藏本文-->
水分是植物体的重要组成成分, 植物的各项生理活动都必须在水的参与下才能进行。有研究表明, 叶片含水量降低会影响叶片光系统II (PSII)的电子传递速率和叶片的光化学效率(Augusti et al., 2001), 降低植物的光合碳同化速率(Lawlor & Cornic, 2002), 叶片水分亏缺严重时还将引起植物碳饥饿或液压失效, 进而导致植物死亡(McDowell et al., 2008, 2013; Sevanto et al., 2014)。
遥感是一种非损伤性的获得被测物体信息的手段, 高光谱遥感在生态学上的应用扩展了我们认识植被的能力, 使我们能够由简单的识别植被“是什么”逐步发展到定量化估测植被“怎么样”的更高水平(Muttiah, 2002)。利用反射光谱探测植物的生理生态活动是定量遥感新的发展方向。目前国内外对植被的反射光谱与其生理生态参数之间的关系已经有一定的研究和认识, 在利用遥感技术对植被生态水文学的观测中, 水分变化引起的植被反射光谱的变化最为常见, 也最为复杂(杜朋选等, 2011)。
植物在近红外和短波红外区域吸收电磁辐射的特征变化主要是水分子和其他分子中的O—H键的伸缩和弯曲振动引起的, 其吸收的峰值分别位于970、1β145、1β400和1β940 nm (Curran, 1989), 因此, 叶片水分状况的变化能够导致这些区域相当广泛的光谱变化。基于光谱反射率数据的模型反演(Jacquemoud et al., 1996)和光谱指数(Ceccato et al., 2001)是估测叶片水分状况中普遍应用的两种遥感方法。与模型反演相比, 基于几个窄的或宽的光谱波段组合的光谱指数方法既简单又与叶片水分状况具有良好的相关性, 因此, 如何利用遥感数据设计一个通用的光谱指数来估算植被水分状况引起了更多的关注(Ceccato et al., 2002a, 2002b; le Maire et al., 2008)。Aoki等(1988)在研究中指出对于木本植物来说, 单位面积叶片水分含量(LWC)与R1650/R1430的反射率比值有紧密的关系。Pe?uelas等(1993)用970 nm的水分敏感波段和900 nm处的光谱反射率构建了水分指数(WI), 并验证了WI在预测叶片水分胁迫方面的有效性。Gao (1996)在研究中发现1β240 nm处的光谱特征峰对水分含量变化非常敏感, 而860 nm处则非常不敏感, 故由此提出归一化水分指数(NDWI)。Pe?uelas和Inoue (1999)的研究表明, WI与NDVI的比值(WI/NDVI)在预测叶片的水分含量的基础上, 还可以用来预测植株的含水量或水势。Yu等(2000)用比叶含水量(SWC)、叶片水分鲜质量比(LMP)、相对含水量(RWC)和LWC等水分指标表征草本和木本树种叶片的水分状况, 进而建立了叶片反射光谱和水分状况之间的关系。田永超等(2004, 2006)在对不同水分条件小麦(Triticum aestivum)和水稻(Oryza sativa)的研究中发现SR(610,560)/ND(810,610)和SR(760,1650)与其水分指标的相关性最好。为了找出能把水分胁迫与其他生物胁迫区分开来的光谱波段或光谱组合, Graeff和Claupein (2007)对不同水分处理下小麦叶片的反射光谱数据进行分析, 发现在小麦整个生长期内510780 nm (波长范围为510-780 nm的光谱反射率, 下同)、540780 nm、4901300 nm和5401300 nm波段最适合来表示小麦叶片的水分状况。Sun等(2008)在水分胁迫对橄榄(Canarium album)叶的反射光谱和生理参数影响的研究中提出了水分含量反射率指数(WCRI), 并探讨了WCRI与RWC之间的关系。Osório等(2012)对不同温度和水分组合条件下长角豆(Ceratonia siliqua)幼苗的研究表明, 与叶片水势和RWC相比, 长角豆叶片的水浓度(WC)和WI的相关性更高。Cao等(2015)通过5个树种叶片的失水试验发现双差值指数(DDn(1530,525))与叶片RWC和EWT的关系良好且稳定。Caturegli等(2015)在对高羊茅(Festuca arundinacea)的研究中发现不同水分条件下WI对水分状况的预测精确度高于NDWI等其他光谱指数。Gerhards等(2016)在对马铃薯(Solanum tuberosum)植株的研究中测定并分析了作物缺水指数(CWSI)、水分胁迫指数(MSI)和光化学反射指数(PRI)等光谱指数与水分胁迫的关系, 发现基于近红外光谱与短波红外光谱反射率比值(NIR/SWIR)的光谱指数与植物含水量的关系最好。Zhao等(2016)的研究表明NDWI、简单比值指数(SR)和短波红外垂直水分胁迫指数(SPSI)与冬小麦叶片水分含量的相关性显著, 其中, NDWI和SR与叶片含水量的相关性高于SPSI。以上可见, 当前植物水分状况相关的反射光谱指数众多, 但有关植物水分状况与现有反射光谱指数关系敏感性的系统比较研究较少, 而认清究竟哪些反射光谱指数在探测植物叶片水分状况的变化中更为直接和有效, 对于短时期内快速、实时评估树木的干旱与水分胁迫状态具有重要意义。
通常来说, 模拟高强度水分胁迫条件下的野外试验中, 植物叶片的物理结构和生理活动都受到了很大的影响, 此时获得的光谱指数无法纯粹地反映植物叶片的水分状况; 而以往的研究表明, 叶片失水试验可以提供大范围的水分变化条件, 这比野外试验更适于光谱指数的识别(Carter, 1991; Pe?uelas et al., 1993, 1997; Seelig et al., 2008)。本研究依托宝天曼森林生态系统定位研究站, 在我国暖温带与亚热带过渡区的锐齿槲栎(Quercus aliena var. acuteserrata)林开展试验, 和长期干旱引起的植物复杂的生理、结构响应变化不同, 本研究模拟植物叶片快速失水过程, 突出叶片水分状况的单一变化对反射光谱的影响, 为进一步利用高光谱信息识别植被的水分状况提供参考。
1 材料和方法
1.1 研究区概况
宝天曼国家级自然保护区(33.42°-33.55° N, 111.88°-112.00° E)位于河南省西南部, 地处秦岭东段和伏牛山南坡, 最高峰海拔1β830 m, 总面积约53.4 km2, 总辐射量平均为455.34 kJ·cm-2, 年平均气温15.1 ℃, 1月平均气温1.5 ℃, 7月平均气温27.8 ℃; 年降水量885.6 mm, 多集中分布于6-8月的雨季, 年蒸发量991.6 mm, 年平均相对湿度为68%。植被以暖温带落叶阔叶林为主, 兼有北亚热带常绿落叶阔叶混交林的特点, 栎类物种约占宝天曼乔木树种的70%, 是当地主要建群树种(史作民等, 1999)。1.2 试验方法
1.2.1 样品采集试验于2014年8月和2015年5月两个不同发育阶段进行, 研究对象为宝天曼生态定位站后南坡(坡度约25°)上的锐齿槲栎中龄次生林(高约25 m)。采样选取了4株生长健康的锐齿槲栎样本树, 在树顶部和下部位置分别选取1枝南朝向的枝条剪下, 将采集到的枝条样本迅速放到装有冰袋的保温箱内低温保鲜并立即带回生态站实验室(约20 min), 每一枝条选取3片叶用于测定反射光谱和水分状况指标。两次试验锐齿槲栎样本树相同。
1.2.2 人工模拟叶片快速失水
本试验利用离体植物叶片自然失水的方法来改变叶片的水分状况。即在室温下, 将选好的锐齿槲栎叶片在叶片基部从枝条上剪下来, 展开平铺在通风的试验台上, 使其在自然条件下散失水分, 然后按照一定的时间间隔, 同步测定叶片的水分指标和反射光谱响应曲线。
1.2.3 叶片水分指标的测定
首先采用1/1000天平称出叶片的鲜质量并做好记录(FM), 然后在叶片自然失水处理的第1、2、3、4、5、8 h测定其反射光谱并称质量记录(MT, T = 1, 2, 3, 4, 5, 8; M0 = FM), 之后将叶片浸在去离子水中6 h, 使其充分吸水, 称其饱和吸水质量(SM), 在称质量过程中同步测定叶片样本的面积(LA), 最后将称质量后的叶片放入烘箱内105 ℃高温杀青30 min, 之后保持65 ℃的温度烘干至恒质量, 称干质量并记录(DM), 分别计算样品的SWC、LMP、RWC和等效水分厚度(EWT)。
SMC = (MT - DM)/DM
LMP = (MT - DM)/MT
RWC = (MT - DM)/(SM - DM)
EWT (g·m-2) = (MT - DM)/LA
1.2.4 叶片反射光谱的测定和处理
叶片的反射光谱曲线测定: 每次锐齿槲栎叶片称质量后, 采用ASD FieldSpec 4地物光谱辐射仪(Analytica Spectra Devices, Boulder, USA)自带的手持叶夹式叶片光谱探测器测定叶片的反射光谱曲线, 测量时将叶片擦净展平置于叶片夹的叶室中, 使用探测器的内置稳定光源测定。每一叶片测定反射光谱5次, 取其平均值作为这一叶片的反射光谱测量值。光谱测量范围为350-2β500 nm, 光谱采样间隔在350-1β025 nm区间为1.4 nm, 在1β025-2β500 nm区间内为2 nm, 每组数据测量前均进行标准白板校正。
反射光谱处理: 为清晰地描述不同发育阶段和冠层位置的锐齿槲栎叶片在失水过程中的光谱反射率变化特征, 本研究中使用3种不同的方法(原始光谱反射率、反射率差值和反射率敏感性)来处理获得的不同锐齿槲栎叶片样本的光谱反射率。
反射率差值(Reflectance difference) = RT - RF
反射率敏感性(Reflectance sensitivity) = (RT - RF)/RF
其中, RT和RF分别代表失水T h后和新鲜叶片的光谱反射率。
1.2.5 水分相关的光谱指数
许多基于几个或多个光谱波段组合构建的高光谱指数已经被开发出来估测植株的水分状况。本研究中, 选择前人研究中具有代表性的15个光谱指标, 来测试其在叶片失水过程中监测叶片水分状况的表现(表1)。
Table 1
表1
表1水分状况相关的反射光谱指数及其定义
Table 1Reflectance spectral indices related to water status and their definitions
| 反射光谱指数 Spectral reflectance index | 缩写 Acronym | 定义 Definition | 参考文献 Reference |
|---|---|---|---|
| 水分指数 Water index | WI | R900/R970 | Pe?uelas et al., 1993 |
| 水分指数/归一化植被指数 Water index/normalized difference vegetation index | WI/NDVI | (R900/R970)/[(R900-R680)/(R900+R680)] | Pe?uelas & Inoue, 1999 |
| 水分胁迫指数 Moisture stress index | MSI | R820/R1600 | Hunt & Rock, 1989 |
| 简单比值指数 Simple ratio index(760,1650) | SR(760,1650) | R760/R1650 | Tian et al., 2006 |
| 简单比值指数 Simple ratio index(1300,1450) | SR(1300,1450) | R1300/R1450 | Seelig et al., 2008 |
| 简单比值水分指数 Simple ratio water index | SRWI | R860/R1240 | Zarco-Tejada et al., 2003 |
| 归一化红外指数 Normalized difference infrared index | NDII | (R850-R1650)/(R850+R1650) | Hardisky et al., 1983 |
| 归一化水分指数 Normalized difference water index | NDWI | (R860-R1240)/(R860+R1240) | Gao, 1996 |
| 水分含量反射指数 Water content reflactance index | WCRI | R1455/(R1272-R1455) | Sun et al., 2008 |
| 三波段复合指数 Three-band composite index | SR(610,560)/ND(810,610) | (R610/R560)/[(R810-R610)/(R810+R610)] | Tian et al., 2004 |
| 四波段干旱指数 Four bands drought index | SR(1640,2130)/ND(855,555) | (R1640/R2130)/[(R855-R555)/(R855+R555)] | Zhang & Guo, 2006 |
| 归一化多波段干旱指数 Normalized multi-band drought index | NMDI | [(R860-(R1640-R2130)]/[R860+(R1640+R2130)] | Wang & Qu , 2007 |
| 三波段比值指数 Three-band ratio index975 | Ratio975 | 2R960-990/(R920-940+R1090-1110) | Pu et al., 2003 |
| 三波段比值指数 Three-band ratio index1200 | Ratio1200 | 2R1180-1220/(R1090-1110+R1265-1285) | Pu et al., 2003 |
| 双差值指数 Double difference index | DDn(1530, 525) | 2R1530-R1005-R2055 | Wang & Li, 2012 |
Rλ, spectral reflectance of λ nm; Rλ1-λ2, mean of spectral reflectance of λ1-λ2 nm.
新窗口打开
1.3 数据处理与分析
本研究测得的叶片的水分状况指标使用Excel 2013软件进行平均值、标准偏差求算等处理; 叶片的光谱反射率使用ASD公司提供的ViewSpec Pro软件进行光谱曲线平均化和数据导出等处理; 最后使用SPSS 19.0和SigmaPlot 12.5软件对所有数据统计分析和制图。2 结果和分析
2.1 水分散失过程中叶片水分指标的变化
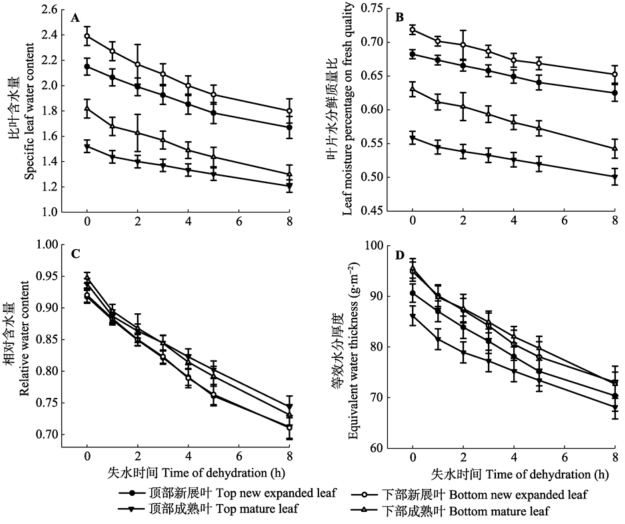
表2显示了本试验锐齿槲栎叶片样本在试验前的水分状况(SWC、LMP、RWC和EWT)的统计结果, 不同发育阶段和冠层位置的叶片样本的SWC、LMP、RWC和EWT均存在一定的差异, 说明样本具有较好的代表性。图1显示的是失水过程中不同发育阶段和冠层位置的锐齿槲栎叶片的水分指标随时间的变化。可以看出, 叶片离体后, 由于没有外来水分的补给, 加之叶片自身生理活动的消耗, 水分胁迫的强度越来越大, 锐齿槲栎叶片的SWC、LMP、RWC和EWT不同程度地下降。在失水过程中, 新展叶的SWC和LMP始终显著大于成熟叶, 同一时期下部叶的SWC和LMP整体上大于顶部叶, SWC和LMP在不同发育阶段和冠层位置上的变异很大(图1A、1B)。而与SWC和LMP相比, RWC和EWT在不同发育阶段和冠层位置上的变异则相对较小(图1C、1D)。
Table 2
表2
表2不同发育阶段和冠层位置的叶片样本失水前的水分状况
Table 2Water status of leaf samples at different developmental stages and canopy position before dehydration
| 样本 Sample | 水分相关变量 Variables related to water | 样本数 Number of sample | 最大值 Maximum value | 最小值 Minimum value | 平均值 Mean value | 标准偏差 Standard deviation | 变异系数 Coefficient of variation (%) |
|---|---|---|---|---|---|---|---|
| 顶部新展叶 Top new expended leaf | SWC | 12 | 2.24 | 2.06 | 2.15 | 0.07 | 3.11 |
| LMP | 12 | 0.69 | 0.67 | 0.68 | 0.01 | 0.99 | |
| RWC | 12 | 0.94 | 0.90 | 0.92 | 0.01 | 1.12 | |
| EWT | 12 | 93.40 | 87.40 | 90.60 | 1.81 | 2.00 | |
| 下部新展叶 Bottom new expended leaf | SWC | 12 | 2.49 | 2.31 | 2.39 | 0.07 | 3.11 |
| LMP | 12 | 0.73 | 0.71 | 0.72 | 0.01 | 0.99 | |
| RWC | 12 | 0.94 | 0.90 | 0.92 | 0.01 | 1.22 | |
| EWT | 12 | 97.80 | 91.60 | 94.90 | 1.90 | 2.00 | |
| 顶部成熟叶 Top mature leaf | SWC | 12 | 1.36 | 1.20 | 1.28 | 0.05 | 4.21 |
| LMP | 12 | 0.58 | 0.55 | 0.56 | 0.01 | 1.85 | |
| RWC | 12 | 0.96 | 0.93 | 0.94 | 0.01 | 0.87 | |
| EWT | 12 | 88.00 | 82.20 | 85.00 | 2.02 | 2.38 | |
| 下部成熟叶 Bottom mature leaf | SWC | 12 | 1.76 | 1.52 | 1.65 | 0.07 | 4.46 |
| LMP | 12 | 0.65 | 0.62 | 0.63 | 0.01 | 1.73 | |
| RWC | 12 | 0.96 | 0.93 | 0.95 | 0.01 | 0.91 | |
| EWT | 12 | 98.30 | 93.10 | 95.50 | 1.92 | 2.01 |
新窗口打开
 显示原图|下载原图ZIP|生成PPT
图1失水过程中不同发育阶段和冠层位置的锐齿槲栎叶片的比叶含水量(A)、叶片水分鲜质量比(B)、相对含水量(C)和等效水分厚度(D)的变化(平均值±标准偏差)。
-->Fig. 1Changes of specific leaf water content (A), leaf moisture percentage on fresh mass (B), relative water content (C), and equivalent water thickness (D) of Quercus aliena var. acuteserrata leaves in different growth stages and canopy positions during the dehydration process (mean ± SD).
-->
2.2 不同水分状况下叶片反射光谱的变化特征
与多数绿色植物一样, 锐齿槲栎在可见光区的550-560 nm有一个明显的反射峰, 680-690 nm光谱反射率迅速降低形成一个反射谷; 700-770 nm叶片的光谱反射曲线陡然上升, 在近红外区域的770- 1β300 nm波段形成了一个明显的反射平台; 而在短波红外区域的1β400-2β500 nm波段则出现了两个反射峰和两个反射谷。不同发育阶段和冠层位置锐齿槲栎叶片在失水过程中反射光谱变化存在一定的差异。图2显示随着叶片水分的持续散失, 锐齿槲栎叶片样本的光谱反射率在可见光区的变化均较小, 而在近红外区域和短波红外区域发生了较为明显的变化。与原始反射光谱(图2A)相比, 光谱反射率差值分析法(图2B)和反射率敏感性分析法(图2C)能提供叶片在失水过程中更详细的光谱变化信息。由图2B可以看出, 不同叶片样本在955-970 nm、1β400-1β500 nm、1β650-1β750 nm、1β940-1β960 nm和2β055-2β400 nm波段的光谱反射率随叶片水分的散失而均明显增加; 由图2C可以看出, 叶片在可见光区光谱反射率变化的规律性较差, 而在短波红外区域以1β455 nm、 1β950 nm和2β480 nm为中心波段的光谱区则与失水时间呈现明显的负相关关系。对比来看, 成熟叶在失水过程中可见光区的光谱反射率变化更小, 且在短波红外区域成熟叶在前几个小时的失水过程中的光谱变化也明显小于新展叶, 当达到一定水分胁迫程度后, 反射率才出现更明显的变化。不同水分条件下叶片光谱反射率的这种变化规律为利用反射光谱指数探测锐齿槲栎叶片的水分状况奠定了基础。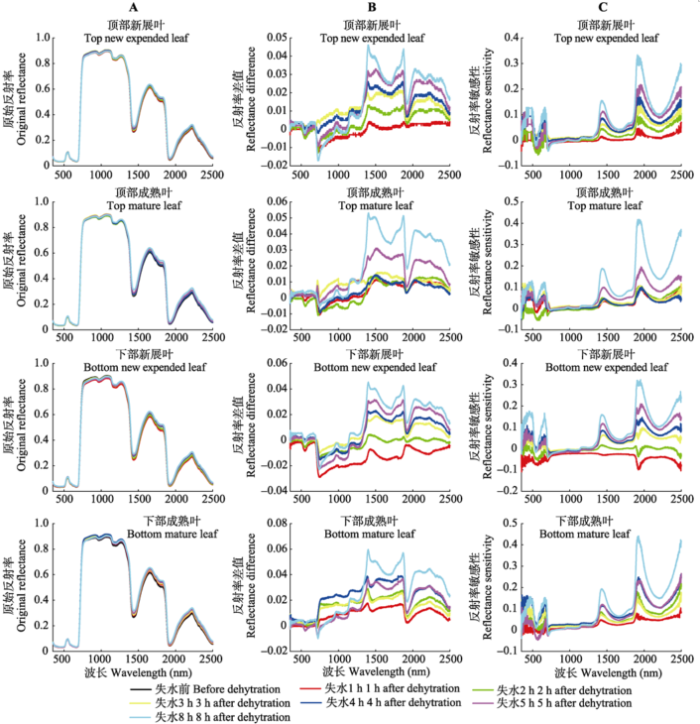 显示原图|下载原图ZIP|生成PPT
图2失水过程中不同发育阶段和冠层位置锐齿槲栎叶片的原始光谱反射率、反射率差值和反射率敏感性变化。
-->Fig. 2Changes of original spectral reflectance, reflectance differences and reflectance sensitivities of Quercus aliena var. acuteserrata leaves in different growth stages and canopy positions during the dehydration process.
-->
2.3 叶片的水分指标与光谱反射率的相关性
植物叶片水分状况的光谱探测是以叶片水分敏感的光谱反射率与水分指标的相关关系为基础的。本研究为了能更好地反映反射光谱对锐齿槲栎叶片水分状况变化的敏感性, 选取水分敏感的叶片光谱反射率与水分指标(SWC、LMP、RWC和EWT)进行了总体相关性分析(图3)。结果显示, 新展叶在可见光区480-650 nm波段的光谱反射率与水分指标呈现负相关关系, 相关性最好的波段在555 nm附近, 但相关性都没有达到显著水平(r < 0.2); 成熟叶在可见光区的光谱反射率与水分指标的相关性很差。在近红外区域的740-855 nm波段, 新展叶的光谱反射率与SWC、LMP、RWC和EWT呈现显著的正相关关系, 且均达到了0.01的显著性水平, 780 nm处下部新展叶的反射率与RWC的相关性最高(r = 0.45)(图3A、3C); 成熟叶的光谱反射率与SWC、LMP、RWC和EWT呈现正相关关系, 且反射率与SWC、LMP和EWT的相关性达到了0.05的显著性水平, 760 nm处下部成熟叶的反射率与LMP的相关性最高(r = 0.39) (图3B、3D)。在短波红外区域的1β220-2β130 nm波段, 新展叶的光谱反射率与SWC、LMP、RWC和EWT呈现显著的负相关关系, 且均达到了0.01的显著性水平(图3A、3C); 其中, 1β455 nm处顶部新展叶的反射率与RWC的相关性最高(r = 0.58)(图3A); 在 1β420-1β540 nm波段, 成熟叶的光谱反射率与水分指标呈现显著的负相关关系, 且均达到了0.05的显著性水平, 且反射率与RWC和EWT的相关性达到了0.01的显著水平(图3B、3D); 其中, 1β455 nm处顶部成熟叶的反射率与RWC的相关性最高(r = 0.56) (图3B)。 显示原图|下载原图ZIP|生成PPT
图3顶部新展叶(A)、顶部成熟叶(B)、下部新展叶(C)和下部成熟叶(D)的不同水分指标与敏感反射光谱波段的相关性。EWT, 等效水分厚度; LMP, 叶片水分鲜质量比; SWC, 比叶含水量; RWC, 相对含水量。
-->Fig. 3Correlations of different moisture indices of top new expended leaf (A), top mature leaf (B), bottom new expended leaf (C), and bottom mature leaf (D) and their sensitive reflectance spectral bands. EWT, equivalent water thickness; LMP, leaf moisture percentage on fresh quality; SWC, specific leaf water content; RWC, relative water content.
-->
2.4 不同反射光谱指数与水分指标相关性的差异
本研究将选取的15个反射光谱指数分别与不同发育阶段和冠层位置叶片样本的水分状况指标(SWC、LMP、RWC和EWT)进行相关分析, 相关系数结果见表3。Table 3
表3
表3不同反射光谱指数与锐齿槲栎叶片水分指标的相关性
Table 3Correlation between different reflectance spectral indices and water indices of Quercus aliena var. acuteserrata leaf
| 反射光谱指数 Reflectance spectral index | 下部新展叶 Bottom new expended leaf | 顶部新展叶 Top new expended leaf | 下部成熟叶 Bottom mature leaf | 顶部成熟叶 Top mature leaf | ||||||||||||
|---|---|---|---|---|---|---|---|---|---|---|---|---|---|---|---|---|
| SWC | LMP | RWC | EWT | SWC | LMP | RWC | EWT | SWC | LMP | RWC | EWT | SWC | LMP | RWC | EWT | |
| 水分指数 Water index | 0.751** | 0.751** | 0.836** | 0.801** | 0.831** | 0.830** | 0.894** | 0.867** | 0.678** | 0.685** | 0.876** | 0.806** | 0.708** | 0.713** | 0.818** | 0.776** |
| 水分指数/归一化植被指数 Water index/ normalized difference vegetation index | 0.400** | 0.401** | 0.439** | 0.432** | 0.413** | 0.415** | 0.457** | 0.465** | 0.372** | 0.376** | 0.626** | 0.634* | 0.553** | 0.556** | 0.594** | 0.602** |
| 水分胁迫指数 Moisture stress index | 0.411** | 0.412** | 0.493** | 0.336** | 0.401** | 0.403** | 0.483** | 0.330** | 0.251* | 0.253* | 0.633** | 0.471** | 0.338** | 0.340** | 0.603** | 0.475** |
| 简单比值指数 Simple ratio index(760,1650) | 0.491** | 0.494** | 0.565** | 0.463** | 0.462** | 0.465** | 0.505** | 0.393** | 0.283* | 0.285* | 0.682** | 0.550** | 0.404** | 0.406** | 0.655** | 0.536** |
| 简单比值指数 Simple ratio index(1300,1450) | 0.366** | 0.364** | 0.601** | 0.726** | 0.385** | 0.386** | 0.612** | 0.732** | 0.421** | 0.426** | 0.716** | 0.811** | 0.488** | 0.495** | 0.708** | 0.808** |
| 简单比值水分指数 Simple ratio water index | 0.722** | 0.722** | 0.798** | 0.736** | 0.771** | 0.773** | 0.829** | 0.786** | 0.619** | 0.617** | 0.801** | 0.695** | 0.663** | 0.665** | 0.756** | 0.732** |
| 归一化红外指数 Normalized difference infrared index | -0.363** | -0.363** | -0.477** | -0.373** | -0.377** | -0.375** | -0.472** | -0.395** | -0.217* | -0.219* | -0.631** | -0.465** | -0.317** | -0.319** | -0.577** | -0.452** |
| 归一化水分指数 Normalized difference water index | 0.715** | 0.717** | 0.787** | 0.726** | 0.763** | 0.764** | 0.824** | 0.777** | 0.621** | 0.623** | 0.808** | 0.697** | 0.664** | 0.667** | 0.758** | 0.733** |
| 水分含量反射指数 Water content reflectance index | -0.312** | -0.315** | -0.510** | -0.485** | -0.306** | -0.308** | -0.503** | -0.465** | -0.356** | -0.359** | -0.600** | -0.468** | -0.331** | -0.336** | -0.584** | -0.461** |
| 三波段复合指数 Three-band composite index | -0.426** | -0428** | -0.469** | -0.485** | -0.422** | -0423** | -0.466** | -0.473** | -0.486** | -0.505** | -0.529** | -0.535** | -0.568** | -0.577** | -0.578** | -0.592** |
| 四波段干旱指数 Four bands drought index | 0.463** | 0.466** | 0.496** | 0.382** | 0.456** | 0.459** | 0.485** | 0.367** | 0.163 | 0.164 | 0.414** | 0.193 | 0.023 | 0.024 | 0.364** | 0.176 |
| 归一化多波段干旱指数 Normalized multi-band drought index | 0.571** | 0.574** | 0.793** | 0.796** | 0.553** | 0.550** | 0.807** | 0.811** | 0.531** | 0.533** | 0.788** | 0.797** | 0.536** | 0.536** | 0.781** | 0.783** |
| 三波段比值指数 Three-band ratio index975 | -0.127 | -0.129 | -0.398** | -0.309** | -0.143 | -0.145 | -0.421** | -0.316** | -0.182* | -0.185* | -0.600** | -0.416** | -0.302** | -0.305** | -0.585** | -0.431** |
| 三波段比值指数 Three-band ratio index1200 | -0.093 | -0.096 | -0.355** | -0.202* | -0.085 | -0.088 | -0.322** | -0.182 | -0.103 | -0.106 | -0.565** | -0.382** | -0.233* | -0.236* | -0.537** | -0.379** |
| 双差值指数 Double difference index | 0.636** | 0.634** | 0.734** | 0.835** | 0.650** | 0.651** | 0.728** | 0.857** | 0.621** | 0.625** | 0.727** | 0.852** | 0.608** | 0.609** | 0.736** | 0.821** |
新窗口打开
从表3可以看出, 选取的光谱指数中只有SR(1640,2130)/ND(855,555)、Ratio975和Ratio1200与部分锐齿槲栎叶片样本水分指标的相关关系没有达到显著水平, 其他光谱指数与不同叶片所有水分指标的相关关系均达到了显著或极显著水平。相比于SWC和LMP, 多数光谱指数与不同发育阶段、不同冠层位
置叶片RWC和EWT的相关关系更好, 这表明RWC和EWT具有更好的光谱敏感性, 更适于在光谱探测中表征植物的水分状况。WI、SRWI、NDWI、NMDI和DDn(1530,525)与不同发育阶段、不同冠层位置叶片的RWC和EWT的相关关系明显优于其他指数(r ≥ 0.727), 其中, WI与锐齿槲栎叶片RWC的相关性最好(r ≥ 0.818), 尽管WI与顶部新展叶EWT的相关关系达到了0.867, 但WI与EWT的相关关系的稳定性不及DDn(1530,525)(r ≥ 0.821)。从叶片的发育阶段看, WI、SRWI、NDWI、NMDI和DDn(1530,525)与新展叶RWC和EWT的相关性略优于成熟叶; 而从叶片冠层位置看, 样本则没有表现出一致性的规律。
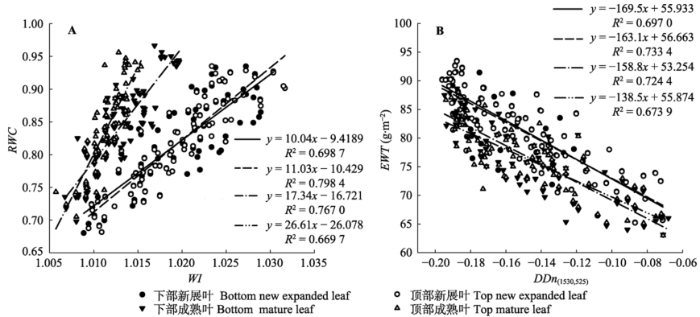
基于本次试验的水分和光谱数据, 图4展示了不同发育阶段、不同冠层位置锐齿槲栎叶片WI-RWC和DDn(1530,525)-EWT的线性拟合关系。可以看出, 相同冠层位置锐齿槲栎叶片的RWC与WI在叶片成熟前后的拟合关系相差较大; 不同冠层位置新展叶的RWC-WI的拟合关系在叶片成熟前后相差较小, 不同冠层位置成熟叶的RWC与WI的拟合关系在叶片成熟前后相差较大; 其中, WI与顶部新展叶RWC的线性拟合结果表现最好(R2 = 0.798β4)(图4A)。不同锐齿槲栎叶片的EWT-DDn(1530,525)在叶片成熟前后的拟合关系相差很小, DDn(1530,525)与不同发育阶段、不同冠层位置叶片EWT的线性拟合结果表现十分稳定(图4B)。
 显示原图|下载原图ZIP|生成PPT
图4不同发育阶段和冠层位置的锐齿槲栎叶片水分指数-相对含水量(WI-RWC)(A)和双差值指数-等效水分厚度(DDn(1530,525)-EWT)(B)的线性拟合关系。
-->Fig. 4Linear fitting relationship of water index - relative water content (WI-RWC)(A) and double difference index - equivalent water thickness (DDn(1530,525)-EWT)(B) of Quercus aliena var. acuteserrata leaves in different growth stages and canopy positions.
-->
3 讨论和结论
前人的研究证明, 叶片的水分状况与反射光谱之间存在着紧密的相关关系, 这种关系在近红外区域和短波红外区域的特定波段范围表现得更为显著, 而在可见光区域的相关关系较弱(Carter, 1991; Pe?uelas et al., 1993; Foley et al., 2006; Seelig et al., 2008)。叶片在可见光区的反射光谱变化主要受色素的影响(Sims & Gamon, 2002), 在短时间的失水试验中, 色素降解和转化的比例很小, 可见光区的光谱反射率变化也不明显, 故350-750 nm波段的光谱反射率不适于估测叶片水分状况的变化。叶片在近红外区域的光谱反射率主要受叶片内部结构的影响(Jacquemoud & Baret, 1990; Jacquemoud et al., 1996), 水分散失会对叶片的内部结构造成一定影响, 进而会造成750-1 300 nm波段光谱反射率的变化。而叶片在短波红外区域的光谱反射率对水分变化最为敏感(Knipling, 1970; Tucker, 1980; Hunt et al., 1987; Carter, 1991; Danson et al., 1992), 尽管某些波段 (1β730 nm、2β100 nm附近)的反射率受叶片干物质的影响较大(Cheng et al., 2011), 但在短时间的失水过程中, 叶片的干物质含量几乎不会发生变化, 水分是引起光谱反射率变化的主因。Inoue等(1993)研究认为短波红外区域的水分吸收波段存在着强烈的大气吸收, 不适合在星载遥感中用于评估植被的水分状况, 近年来为克服这一缺点, 通过航空等手段进行的冠层高光谱遥感逐渐兴起。同一时期植物的冠层光谱受叶片冠层位置的影响较大, 而植被不同发育时期的植物冠层光谱也不尽相同, 因此, 搞清不同发育阶段和不同冠层位置叶片的水分变化及其反射光谱响应的差异对冠层高光谱遥感的应用尤为重要。本研究发现, 在锐齿槲栎叶片的失水过程中, RWC和EWT在不同发育阶段和不同冠层位置上的变异较小(图1), 可以稳定地表征树木整体的水分状况。光谱反射率差值分析法和光谱反射率敏感性分析法表明, 叶片的光谱敏感性受发育阶段的影响较大(图2); 因此, 在利用卫星或航空遥感手段监测植被的水分状况时, 应选择在植物水分敏感的发育阶段进行。
光谱指数可以放大植被的有效反射信息, 减小外部因素影响, 构建适宜的敏感光谱指数能够有效地提取植被水分等生化组分信息(Pe?uelas et al., 1993; Sun et al., 2008; Cao et al., 2015)。本研究比较和分析了不同光谱指数与不同发育阶段和冠层位置的锐齿槲栎叶片水分指标的定量关系, 结果表明, RWC和EWT比SWC和LMP具有更好的光谱敏感性, 与所选光谱指数具有更好的相关性, 适合应用于遥感探测。WI、SRWI、NDWI、NMDI和DDn(1530,525)与不同叶片样本的RWC和EWT的相关关系明显优于其他指数, 其中, WI与RWC的相关关系最好; DDn(1530,525)与EWT相关关系的稳定性最好(表3)。从WI-RWC的拟合结果可以看出, 相同冠层位置叶片的RWC与WI在叶片成熟前后的拟合关系相差较大; 不同冠层位置新展叶的RWC与WI的拟合关系在叶片成熟前后相差较小, 不同冠层位置成熟叶的RWC与WI的拟合关系在叶片成熟前后相差较大(图4A), 即WI与RWC的线性拟合关系受时间和空间的影响较大。与之相比, 不同锐齿槲栎叶片的EWT与DDn(1530,525)在叶片成熟前后的拟合关系相差很小, DDn(1530,525)与EWT的线性拟合结果表现稳定(图4B)。因此, 在所选光谱指数中, DDn(1530,525)是锐齿槲栎叶片水分变化的最优监测指标。
植物叶片的水分状况与反射光谱之间存在着复杂的相关关系, 一方面, 植物水分条件的变化会直接引起短波红外区域的光谱反射率发生相应的变化; 另一方面, 水分的变化又会诱导植物叶片发生生理和叶片结构变化, 引起反射光谱中可见光区域和近红外区域的光谱反射率变化, 这可能影响反射光谱对水分变化的敏感性(刘畅等, 2016)。本研究利用快速失水创造水分胁迫条件, 锐齿槲栎叶片水分持续减少而其他生化组分含量相对稳定, 最大程度地规避了水分之外的因素对反射光谱的影响。研究发现: 与SWC和LMP相比, RWC和EWT在不同发育阶段和冠层位置之间的变异性更小, 能稳定地表征树木整体的水分状况; 且RWC和EWT具有更高的光谱敏感性, 适合应用于遥感探测。叶片的光谱敏感性受发育阶段的影响较大; 在短波红外区域, 成熟叶片在失水胁迫初始阶段的光谱变化较小, 而新展叶在整个失水阶段均表现出明显的光谱差异。通过对不同光谱指数与水分指标的相关分析, 发现WI-RWC和DDn(1530,525)-EWT均具有较高的相关性, WI-RWC的拟合关系受叶片发育阶段和冠层位置的影响较大; 而DDn(1530,525)-EWT的拟合关系更为稳定。严重的干旱胁迫会导致叶片气孔导度迅速降低(Souza et al., 2004), 叶光合作用速率放缓; 如果没有水分供应, 植物便会死亡。近年来, 干旱在全球范围内导致了森林死亡, 而气温的升高会加剧这一事件的发生(Allen et al., 2010)。本研究证明DDn(1530,525)可以在叶片尺度反演锐齿槲栎的水分状况, 且理论上可以扩大尺度应用于航空和卫星遥感监测, 这对锐齿槲栎林的水分监测有一定的参考意义。我们的研究均只在实验室控制条件下对锐齿槲栎进行, 试验结果地应用还有待在其他物种上进一步验证。
致谢 感谢中国林业科学研究院基本科研业务费专项资金(CAFYBB2017MA009)资助。
The authors have declared that no competing interests exist.
参考文献 原文顺序
文献年度倒序
文中引用次数倒序
被引期刊影响因子
| [1] | Greenhouse gas emissions have significantly altered global climate, and will continue to do so in the future. Increases in the frequency, duration, and/or severity of drought and heat stress associated with climate change could fundamentally alter the composition, structure, and biogeography of forests in many regions. Of particular concern are potential increases in tree mortality associated with climate-induced physiological stress and interactions with other climate-mediated processes such as insect outbreaks and wildfire. Despite this risk, existing projections of tree mortality are based on models that lack functionally realistic mortality mechanisms, and there has been no attempt to track observations of climate-driven tree mortality globally. Here we present the first global assessment of recent tree mortality attributed to drought and heat stress. Although episodic mortality occurs in the absence of climate change, studies compiled here suggest that at least some of the world's forested ecosystems already may be responding to climate change and raise concern that forests may become increasingly vulnerable to higher background tree mortality rates and die-off in response to future warming and drought, even in environments that are not normally considered water-limited. This further suggests risks to ecosystem services, including the loss of sequestered forest carbon and associated atmospheric feedbacks. Our review also identifies key information gaps and scientific uncertainties that currently hinder our ability to predict tree mortality in response to climate change and emphasizes the need for a globally coordinated observation system. Overall, our review reveals the potential for amplified tree mortality due to drought and heat in forests worldwide. |
| [2] | The spectral reflectances of individual detached leaves at 15 wavelengths ranging from 400nm to 2300nm were measured versus leaf water content per unit leaf area (leaf water content; LWC; mgH2O·cm-2) for three dicotyledonous tree species, Viburnum awabuki (viburnum), Nerium indicum (oleander) and Cinnamomum camphora (camphor), in August and February. The spectral reflectances (γλi=1-15; %), their reciprocals (1/γλi=16515), and all combinations of ratio between two bands pair (γλi=1-15/γλj=1-15) were chosen as the independent variable (total 240 kinds), and LWC (mgH2O·cm-2) was the dependent variable. Regression analyses were conducted for each species and for the pooled species. The reflectance ratio (γ1650/γ1430) correlated best with leaf water content (Table 1), and the regressions differed little among three tree species. The regression equation for the pooled species in August was LWC=20.9(γ1650/γ1430)-22.8 (correlation coefficient, r=0.97; number of observations, n=90; see Fig. 3). The standard error of estimate of mean leaf water content was 1.0mgH2O·cm-2. The value equal to about 5% of the mean leaf water content per unit leaf area of all leaves examined. Thus, γ1650/γ1430 is a useful index for remotely sensing leaf water content per unit leaf area. |
| [3] | Changes in photochemical efficiency, non-radiative energy dissipation (NRD), de-epoxidation state of xanthophyll cycle components (DPS) and contents of the antioxidants ascorbic acid and glutathione were studied in leaves of the poikilohydric Ramonda serbica Panc. (Gesneriaceae) during cycles of dehydration and subsequent rehydration. In drying leaves, the intrinsic efficiency of PS II photochemistry and the photon yield of PS II electron transport showed strong progressive decreases. Simultaneously, the fraction of excitation energy dissipated as heat in the PS II antenna increased markedly. The energy-dependent component of non-photochemical quenching (NPQ) showed an increase in dehydrating leaves down to relative water contents (RWC) values near 30%. Further decreases in RWC below these values caused a decrease in NPQ. Accordingly, DPS showed a similar behaviour, with a sharp increase and a subsequent decrease at very low RWC, although the maximum DPS was reached at slightly lower RWC than that for the maximum NPQ. The pools of reduced ascorbate and glutathione increased strongly when the RWC values fell below 40% and remained high in fully dehydrated leaves. When plants were re-watered photosynthetic efficiency, NRD, DPS and antioxidant contents recovered their initial control values. However, during rehydration, the zeaxanthin content showed a transient increase, as did NPQ, indicating an increasing demand for non-radiative dissipation. On the other hand, the contents of reduced ascorbate and reduced glutathione decreased but were still relatively high in the initial phase of rehydration, when the rate of photosynthetic electron transport, proton pumping and NRD were still relatively low. These results indicate that several photoprotective mechanisms are operating in R. serbica . Protection from photo-oxidation and photoinhibition appears to be achieved by co-ordinated contributions by ascorbate, glutathione and zeaxanthin-mediated NPQ. This variety of photoprotective mechanisms may be essential for conferring desiccation-tolerance. |
| [4] | Leaf water status information is highly needed for monitoring plant physiological processes and assessing drought stress. Retrieval of leaf water status based on hyperspectral indices has been shown to be easy and rapid. However, a universal index that is applicable to various plants remains a considerable challenge, primarily due to the limited range of field-measured datasets. In this study, a leaf dehydration experiment was designed to obtain a relatively comprehensive dataset with ranges that are difficult to obtain in field measurements. The relative water content (RWC) and equivalent water thickness (EWT) were chosen as the surrogates of leaf water status. Moreover, five common types of hyperspectral indices including: single reflectance (R), wavelength difference (D), simple ratio (SR), normalized ratio (ND) and double difference (DDn) were applied to determine the best indices. The results indicate that values of original reflectance, reflectance difference and reflectance sensitivity increased significantly, particularly within the 350–70002nm and 1300–250002nm domains, with a decrease in leaf water. The identified best indices for RWC and EWT, when all the species were considered together, were the first derivative reflectance based ND type index of dND (1415, 1530) and SR type index of dSR (1530, 1895), with R 2 values of 0.95 ( p 02<020.001) and 0.97 ( p 02<020.001), respectively, better than previously published indices. Even so, different best indices for different species were identified, most probably due to the differences in leaf anatomy and physiological processes during leaf dehydration. Although more plant species and field-measured datasets are still needed in future studies, the recommend indices based on derivative spectra provide a means to monitor drought-induced plant mortality in temperate climate regions. |
| [5] | Leaves of six species selected to represent a broad range in internal structure were collected in the field and studied in the laboratory to determine primary and secondary effects of water content on leaf spectral reflectance. Primary effects were those that resulted solely from the radiative properties of water. Secondary effects were those that could not be explained solely by these properties. Decreased leaf water content generally increased reflectance throughout the 400-2,500-nm wavelength range. For the aquatics Eichhornia crassippes and Nuphar luteum, the broadleaved trees Liquidambar styraciflua and Magnolia grandiflora, the cane-grass Arundinaria tecta, and the needle-leaved Pinus taeda, the sensitivity of reflectance to water content was greatest in the water absorption bands near 1,450, 1,940, and 2,500 nm. Sensitivity maxima occurred also between 400 and 720 nm, indicating secondary effects that resulted from decreased absorption by pigments. Secondary effects of water content on reflectance that were largely wavelength-independent, together with any wavelength-independent effects of leaf internal structure, were far less significant than primary and secondary effects resulting from decreased absorption by water and pigments, respectively. |
| [6] | The issue of water and climate change is present in many countries. Drought stress is one of the main abiotic stresses influencing turfgrass growth and quality. Tall fescue is the most suitable cool-season turfgrass for the Mediterranean region. This species has a better heat tolerance than perennial ryegrass and Kentucky bluegrass. The analysis of radiation reflected by turfgrass can supply precious information on drought stress and nutritional status. In this study a Linear Gradient Irrigation System (LGIS) was adopted on a Festuca arundinacea turf with 9 water replenishment levels and 2 nitrogen conditions, to evaluate the proximity sensed spectral reflectance. ET0 was estimated using the Hargreaves and Samani method. The following parameters were determined: turf quality, drought tolerance, pest problems, temperature of the surface, clippings weight and relative nitrogen content, turf growth and soil moisture. Spectral reflectance data were acquired using a LICOR 1800 spectroradiometer. Pearson correlation coefficients were studied among all parameters and vegetation indices. Nitrogen fertilization influenced significantly turf quality, clippings weight, nitrogen content and turf growth. Water replenishment influenced significantly all parameters except nitrogen content. Among all parameters the highest correlation coefficient was registered relating drought tolerance with turf quality (r = 0.88) and with surface temperature (r = - 0.88). Among vegetation indices results showed that Water Index (WI) and Normalized Difference Water Index (NDWI), are the most suitable to discriminate between different levels of water replenishment. Comparing WI with NDWI, the correlation coefficients were higher for Water Index in all the parameters, in particular the highest WI value was registered for drought tolerance (r = 0.91). This preliminary research demonstrates that spectral remote sensing can be a useful diagnostic tool to detect water stress in turfgrasses. |
| [7] | |
| [8] | This paper outlines the first part of a series of research studies to investigate the potential and approaches for using optical remote sensing to assess vegetation water content. It first analyzes why most methods used as approximations of vegetation water content (such as vegetation stress indices, estimation of degree of curing and chlorophyll content) are not suitable for retrieving water content at leaf level. It then documents the physical basis supporting the use of remote sensing to directly detect vegetation water content in terms of Equivalent Water Thickness (EWT) at leaf level. Using laboratory measurements, the radiative transfer model PROSPECT and a sensitivity analysis, it shows that shortwave infrared (SWIR) is sensitive to EWT but cannot be used alone to retrieve EWT because two other leaf parameters (internal structure and dry matter) also influence leaf reflectance in the SWIR. A combination of SWIR and NIR (only influenced by these two parameters) is necessary to retrieve EWT at leaf level. These results set the basis towards establishing operational techniques for the retrieval of EWT at top-of-canopy and top-of-atmospheric levels. |
| [9] | |
| [10] | Leaf water content as a percentage of dry mass (LWCD), also termed fuel moisture content, is a critical variable for fire risk modeling. To date, the relationship between spectral reflectance and LWCD is poorly understood due to the mixed effect of leaf water and dry mass on spectral response. Few studies have reported an adequate estimation of LWCD from leaf reflectance spectra, in particular for a variety of species. In this study, we propose an effective approach, using continuous wavelet analysis, to determine LWCD from reflectance spectra for 47 tropical forest species in Panama. The proposed method provides a new way to select a small number of wavelet features (wavelet coefficients) that are sensitive to changes in LWCD. Wavelet features derived using this new method are compared with common spectral indices in terms of their relationship with LWCD. Results demonstrate that LWCD is poorly correlated to the water indices but strongly correlated to the derived wavelet features. Accurate estimates of LWCD across a range of species are achieved using any of those wavelet features and can be slightly improved using a combination of them. |
| [11] | Remotely sensed data are being used to estimate foliar chemical content as a result of our need for the information and our increasing ability to understand and measure foliar spectra. This paper reviews how stepwise multiple regression and deconvolution have been used to extract chemical information from foliar spectra, and concludes that both methods are useful, but neither is ideal. It is recommended that the focus of research be modeling in the long term and experimentation in the short term. Long-term research should increase our understanding of the interaction between radiation and foliar chemistry so that the focus of research can move from leaf model to canopy model to field experiment. Short-term research should aim to design experiments in which remotely sensed data are used to generate unambiguous and accurate estimates of foliar chemical content. |
| [12] | Laboratory measurements of the spectral reflectance of leaves from a variety of species were made over the 400-2500 nm range using a spectroradiomctcr. The relation between spectral reflectance and leaf water content was investigated and the effect of differences in leaf structure were found to be important. The first derivative of the reflectance spectrum, at wavelengths corresponding to the slopes on the edges of the water absorption bands, was found to be highly correlated with leaf water content and insensitive to differences in leaf structure. |
| [13] | |
| [14] | After leaves are clipped their reflectance properties change over time at variable rates. Spectral change can in part be attributed to the changing water content of the leaf, which affects absorption in the VIS, NIR and the SWIR. Maintaining water volume within samples has been the motivation behind many leaf handling techniques. This study has assessed the time constraints between leaf collection and spectral measurement. Specifically the relationship between leaf water content and foliar spectra (350–2500nm) was examined over time for five tropical trees (common guava ( Psidium guajava ), purple guava ( Psidium littorale ), weeping fig ( Ficus benjamina ), floss silk ( Chorisia speciosa ), and coffee ( Coffea arabica )). This investigation was carried for leaves wrapped with moist gauze around their petiole ( treatment leaves ) and leaves with no treatment. Spectral measurements and mass measurements were repeated for each leaf once every hour for the first 12h, then every 4–6h for 18h, followed by one measurement after 12h, and finally once a day until the control samples became air-dry. Foliar reflectance in the visible spectrum was not immediately responsive to water content changes and did not change until wilting of the leaf was observed. The NIR and SWIR wavelength regions were affected immediately by small changes in water content. Thus, by the time wilting was first observed the NIR and SWIR foliar reflectance differed considerably from corresponding fresh leaf reflectance. No common time limit could be observed for leaf clipping and reflectance measurement. Leaves have a variety of water contents and dehydration rates hence measurement time constraints are dependent on the properties of the leaf or species. Rather than using a time limit it is recommended that leaf handling techniques be based upon managing leaf water content and leaf structure. The results of this study indicate that leaves with petioles wrapped in moist paper towel and placed within plastic bags will maintain leaf reflectance longer than equivalent leaves without treatment; samples tested here lasted a minimum of 7days. θ and D indices (“angle difference” and “root mean square difference”, respectively) revealed a stronger relationship between leaf water content and spectral shape than between leaf water and raw reflectance magnitude. The ratio of 1187/1096nm, when compared with θ and D indices and individual reflectance bands, showed the highest coefficient of determination with leaf water content ( r 2 02=020.952). |
| [15] | The normalized difference vegetation index (NDVI) has been widely used for remote sensing of vegetation for many years. This index uses radiances or reflectances from a red channel around 0.66 μm and a near-IR channel around 0.86 μm. The red channel is located in the strong chlorophyll absorption region, while the near-IR channel is located in the high reflectance plateau of vegetation canopies. The two channels sense very different depths through vegetation canopies. In this article, another index, namely, the normalized difference water index (NDWI), is proposed for remote sensing of vegetation liquid water from space. NDWI is defined as (09(0.86 μm) 61 09(1.24 μm))(09(0.86 μm) + 09(1.24 μm)), where 09 represents the radiance in reflectance units. Both the 0.86-μm and the 1.24-μm channels are located in the high reflectance plateau of vegetation canopies. They sense similar depths through vegetation canopies. Absorption by vegetation liquid water near 0.86 μm is negligible. Weak liquid absorption at 1.24 μm is present. Canopy scattering enhances the water absorption. As a result, NDWI is sensitive to changes in liquid water content of vegetation canopies. Atmospheric aerosol scattering effects in the 0.86–1.24 μm region are weak. NDWI is less sensitive to atmospheric effects than NDVI. NDWI does not remove completely the background soil reflectance effects, similar to NDVI. Because the information about vegetation canopies contained in the 1.24-μm channel is very different from that contained in the red channel near 0.66 μm, NDWI should be considered as an independent vegetation index. It is complementary to, not a substitute for NDVI. Laboratory-measured reflectance spectra of stacked green leaves, and spectral imaging data acquired with Airborne Visible Infrared Imaging Spectrometer (AVIRIS) over Jasper Ridge in California and the High Plains in northern Colorado, are used to demonstrate the usefulness of NDWI. Comparisons between NDWI and NDVI images are also given. |
| [16] | This experiment shows that pre-visual water stress detection is feasible using indices depicting leaf temperature, leaf water content and spectral emissivity. |
| [17] | Available water is one of the most limiting factors in crop production. As current methods for the determination of plant water content are time-consuming and require numerous observations to characterize a field, managers could benefit from remote sensing techniques to assist in irrigation decisions and further management practices. Adoption will depend on the development of technologies, which allow real time sensing of the soil and plant water status and the discrimination of several stress factors. A greenhouse study was initiated to determine specific wavelengths and/or combinations of wavelengths indicative of water stress in wheat and to evaluate these wavelengths for discriminating water stress from other biotic stresses. Reflectance of wheat leaves from plants grown under six different water treatments ranging from 65 to 26% field capacity was determined once a week from the beginning of the fourth leaf stage until the sixth leaf stage. Reflectance measurements were performed at the fourth leaf of wheat plants with an imager (LEICA S1 Pro) under controlled light conditions. Reflectance was measured in different wavelength ranges throughout the visible and infrared spectra (380鈥1,300聽nm). Leaf scans were evaluated within the L * a * b *-color system. Total water content of wheat leaves was calculated after the difference between total fresh and total dry weight of wheat plants. Significant reflectance changes and correlations between water status and leaf reflectance were obtained at a water content <71% and enabled the identification and quantification of water status of wheat plants. Reflectance patterns at 510 780 , 540 780 , 490 1,300 , and 540 1,300 聽nm were found most suitable to describe to the water status regardless of the sampling date or growth stage. To evaluate the validity of leaf reflectance as a method for separating water stress from other biotic stresses such as nutrient deficiencies reflectance pattern of water deficient plants were compared with reflectance patterns of N, P, Mg, and Fe deficiency obtained in earlier studies by calculating the color distance 螖Eab as additional reflectance parameter. 螖E ab increased under different nutrient deficiencies, but remained constant under water stress, thus enabling the discrimination of the investigated stress factors. The approach indicated that various stress factors could be clearly identified by reflectance measurements, thus enhancing a better plant management by the use of remote sensing techniques. |
| [18] | ABSTRACT Spectra of Spartina alterniflora were measure under different salinity, growth form and moisture conditions. |
| [19] | Detection of plant water stress by remote sensing has been proposed using indices of Near-Infrared (NIR, 0.7–1.3 μm) and Middle-Infrared (MIR, 1.3–2.5 μm) wavelengths. The first objective of this study was to test the ability of the Leaf Water Content Index (LWCI) to determine leaf Relative Water content (RWC) of different species with different leaf morphologies. The second objective was to determine how the Moisture Stress Index (MSI; MIR / NIR) varies with RWC and the Equivalent Water Thickness (EWT). Reflectance factors at 0.82 μm and 1.6 μm were measured on leaves of Quercus agrifolia (sclerophyllous leaves), Liquidambar styraciflua (hardwood deciduous tree leaves), Picea rubens and Picea pungens (conifer needles), and Glycine max (herbaceous dicot leaves) as they dried on a laboratory bench. RWC and EWT were measured concurrently with the reflectance measurements. The results showed that LWCI was equal to RWC for the species tested. However, the results of a sensitivity analysis indicated the reflectances at 1.6 μm for two different RWC must be known for accurate prediction of unknown RWC; thus the LWCI is impractical for field applications. MSI was linearly correlated to RWCwith each species having a different regression equation and to log 10 EWT with data of all species falling on the same regression line. Because EWT is correlated with leaf area index, MSI should also be correlated with leaf area index. Assuming that the linear regression equation of MSI to EWT can be applied to canopies, then the minimum significant change of RWC that can be detected is 52%. For most plants, the natural variation in RWC from water stress is only about 20%, so that we conclude that indices derived from NIR and MIR reflectances cannot be used to remotely-sense water stress. |
| [20] | From basic considerations and Beer's law, a leaf water content index incorporating reflectances of wavelengths from 0.76 to 0.90 渭m and from 1.55 to 1.75 渭m (Landsat Thematic Mapper Bands TM4 and TM5, respectively) was developed that relates leaf reflectance to leaf relative water content. For the leaf succulent, Agave deserti, the leaf water content index was not significantly different from the relative water content for either individual leaves or an entire plant. Also, the relative water contents of intact plants of Encelia farinosa and Hilaria rigida in the field were estimated by the leaf water content index; variations in the proportion of living to dead leaf area could cause large errors in the estimate of relative water content. Thus, the leaf water content index may be able to estimate average relative water content of canopies when TM4 and TM5 are measured at a known relative water content and fraction of dead leaf material. |
| [21] | Abstract Visible and near- and mid- infrared spectral measurements were made on intact and detached leaves of four crop species (Corn, Peanut, Soybean and Wheat) using two spectroradiometers under three different conditions : field measurements under artificial light and solar radiation conditions with and without an integrating sphere, and laboratory measurements with an integrating sphere. In the regions of 1350-1480, 1800-2000, and 2350-2500 nm wavelenghts, measurements of spectral reflectance (ρ) of crop leaves were not possible, even under fully sun-lit conditions due to atmospheric absorption of light in these regions. Relative water content (RWC, %) was well correlated with 1n (ρ1910), ρ1430, and 1n (ρ1650), while water content (WC, H2O mg cm-2) was correlated with ρ1200/ρ1430, ρ1650/ρ1430, ρ800-ρ1200 and ρ1100-ρ1200. Despite very high correlation between those indices and RWC for different crops, no common regression equation was obtained. On the other hand, a common linear relationship was obtained between spectral indices and WC for all four crops irrespective of leaf thickness, chlorophyll content and structure. The first derivative at 1121 nm was also found to be closely related to leaf water status. An obvious spectral shift of inflection point associated with water status was found aroud 2010 nm region. The location of inflection point shifted over a range from 2080 to 1880 nm according to the dehydration of leaves, and the degree of the shift was closely correlated with RWC and WC. Relative leaf water status of intact leaves of drought-stressed and well-watered soybean plants was estimated from spectral measurements in the field. |
| [22] | PROSPECT is a radiative transfer model based of Allen's generalized “plate model” that represents the optical properties of plant leaves from 400 nm to 2500 nm. Scattering is described by a spectral refractive index (n) and a parameter characterizing the leaf mesophyll structure (N). Absorption is modeled using pigment concentration (C a+b), water content (C w), and the corresponding specific spectral absorption coefficients (K a+b and K w). The parameters n, K a+b, and K w have been fitted using experimental data corresponding to a wide range of plant types and status. PROSPECT has been tested successfully on independent data sets. Its inversion allows one to reconstruct, with reasonable accuracy, leaf reflectance, and transmittance features in the 400–2500 nm range by adjusting the three input variables N, C a+b, and C w. |
| [23] | The biophysical, biochemical, and optical properties of 63 fresh leaves and 58 dry leaves were measured to investigate the potential of remote sensing to estimate the leaf biochemistry from space. Almost 2000 hemispherical reflectance and transmittance spectra were acquired from 400 nm to 2500 nm using a laboratory spectrophotometer. The amount of chlorophyll, water, protein, cellulose, hemicellulose, lignin, and starch was determined on these leaves using standard wet chemistry techniques. These experimental data were used to improve the PROSPECT model, a simple but effective radiative transfer model that calculates the leaf optical properties with a limited number of input parameters: a structure parameter and the leaf biochemistry. The new model construction mainly consisted in providing specific absorption coefficients for the biochemical constituents; the comparison with absorption spectra of pure materials derived from the literature showed good agreement. In the inversion, however, it was necessary to group some leaf components in order to estimate leaf biochemistry with reasonable accuracy. Predictive power varied with the chemistry variable, wavelengths used in analysis, and whether leaves were fresh or dry. r 2 ranged from 0.39 to 0.88 for predictions on dry leaves; on fresh leaves, water and chlorophyll had high r 2 values, 0.95 and 0.68 respectively, carbon based compounds reasonable r 2 , from 0.50 to 0.88, while the estimation of protein is still at issue. |
| [24] | Knowledge of how solar radiation interacts with vegetation is necessary to interpret and process remote sensing data of agricultural and many natural resources. A plant leaf typically has a low reflectance in the visible spectral region because of strong absorption by chlorophylls, a relatively high reflectance in the near-infrared because of internal leaf scattering and no absorption, and a relatively low reflectance in the infrared beyond 1.3 渭 because of strong absorption by water. The reflectance of a plant canopy is similar, but is modified by the nonuniformity of incident solar radiation, plant structures, leaf areas, shadows, and background reflectivities. Airborne sensors receive an integrated view of all these effects, and each crop or vegetation type tends to have a characteristic signature which permits its discrimination. When disease and physiological stresses directly affect the reflectance properties of individual leaves, the most pronounced initial changes often occur in the visible spectral region rather than in the infrared because of the sensitivity of chlorophyll to physiological disturbances. The primary basis for the detection of stress conditions in a crop or other plant community by aerial remote sensors often, however, is not a change in the reflectance characteristics of individual leaves, but a reduction in the total leaf area exposed to the sensors. This reduction can result from a direct loss of leaves, a change in their orientation, or an overall suppression of plant growth. In such cases the total infrared reflectance tends to be decreased relatively more than the visible reflectance because of a reduction in the infrared enhancement due to fewer multiple leaf layers and because of an increase in background exposure. |
| [25] | Summary Experimental studies on CO 2 assimilation of mesophytic C3 plants in relation to relative water content (RWC) are discussed. Decreasing RWC slows the actual rate of photosynthetic CO 2 assimilation (A) and decreases the potential rate (A pot ). Generally, as RWC falls from c . 100 to c. 75%, the stomatal conductance (g s ) decreases, and with it A. However, there are two general types of relation of A pot to RWC, which are called Type 1 and Type 2. Type 1 has two main phases. As RWC decreases from 100 to c. 75%, A pot is unaffected, but decreasing stomatal conductance (g s ) results in smaller A, and lower CO 2 concentration inside the leaf (C i ) and in the chloroplast (C c ), the latter falling possibly to the compensation point. Down-regulation of electron transport occurs by energy quenching mechanisms, and changes in carbohydrate and nitrogen metabolism are considered acclimatory, caused by low C i and reversible by elevated CO 2 . Below 75% RWC, there is metabolic inhibition of A pot , inhibition of A then being partly (but progressively less) reversible by elevated CO 2 ; g s regulates A progressively less, and C i and CO 2 compensation point, 螕 rise. It is suggested that this is the true stress phase, where the decrease in A pot is caused by decreased ATP synthesis and a consequent decreased synthesis of RuBP. In the Type 2 response, A pot decreases progressively at RWC 100 to 75%, with A being progressively less restored to the unstressed value by elevated CO 2 . Decreased g s leads to a lower C i and C c but they probably do not reach compensation point: g s becomes progressively less important and metabolic limitations more important as RWC falls. The primary effect of low RWC on A pot is most probably caused by limited RuBP synthesis, as a result of decreased ATP synthesis, either through inhibition of Coupling Factor activity or amount due to increased ion concentration. Carbohydrate synthesis and accumulation decrease. Type 2 response is considered equivalent to Type 1 at RWC below c. 75%, with A pot inhibited by limited ATP and RuBP synthesis, respiratory metabolism dominates and C i and 螕 rise. The importance of inhibited ATP synthesis as a primary cause of decreasing A pot is discussed. Factors determining the Type 1 and Type 2 responses are unknown. Electron transport is maintained (but down-regulated) in Types 1 and 2 over a wide range of RWC, and a large reduced/oxidized adenylate ratio results. Metabolic imbalance results in amino acid accumulation and decreased and altered protein synthesis. These conditions profoundly affect cell functions and ultimately cause cell death. Type 1 and 2 responses may reflect differences in g s and in sensitivity of metabolism to decreasing RWC. |
| [26] | This article aims at finding efficient hyperspectral indices for the estimation of forest sun leaf chlorophyll content (CHL, 08g cm leaf 61022 ), sun leaf mass per area (LMA, g dry matter m leaf 61022 ), canopy leaf area index (LAI, m 2 leaf m soil 61022 ) and leaf canopy biomass (B leaf , g dry matter m soil 61022 ). These parameters are useful inputs for forest ecosystem simulations at landscape scale. The method is based on the determination of the best vegetation indices (index form and wavelengths) using the radiative transfer model PROSAIL (formed by the newly-calibrated leaf reflectance model PROSPECT coupled with the multi-layer version of the canopy radiative transfer model SAIL). The results are tested on experimental measurements at both leaf and canopy scales. At the leaf scale, it is possible to estimate CHL with high precision using a two wavelength vegetation index after a simulation based calibration. At the leaf scale, the LMA is more difficult to estimate with indices. At the canopy scale, efficient indices were determined on a generic simulated database to estimate CHL, LMA, LAI and Bleaf in a general way. These indices were then applied to two Hyperion images (50 plots) on the Fontainebleau and Fougères forests and portable spectroradiometer measurements. They showed good results with an RMSE of 8.208g cm 61022 for CHL, 9.1g m 61022 for LMA, 1.7m 2 m 61022 for LAI and 50.6g m 61022 for Bleaf. However, at the canopy scale, even if the wavelengths of the calibrated indices were accurately determined with the simulated database, the regressions between the indices and the biophysical characteristics still had to be calibrated on measurements. At the canopy scale, the best indices were: for leaf chlorophyll content: ND chl 02=02( ρ 925 026102 ρ 710 )/( ρ 925 02+02 ρ 710 ), for leaf mass per area: ND LMA 02=02( ρ 2260 026102 ρ 1490 )/( ρ 2260 02+02 ρ 1490 ), for leaf area index: D LAI 02=02 ρ 1725 026102 ρ 970 , and for canopy leaf biomass: ND Bleaf 02=02( ρ 2160 026102 ρ 1540 )/( ρ 2160 02+02 ρ 1540 ). |
| [27] | |
| [28] | |
| [29] | |
| [30] | |
| [31] | We investigated the use of spectral reflectance techniques to monitor the physiological responses of Ceratonia siliqua L. seedlings exposed to different levels of water availability under normal (25 : 18 degrees C, day : night) and elevated (32 : 21 degrees C, day : night) temperatures. Three spectral reflectance indices (photochemical reflectance index, PRI; water index, WI; red edge position, REP) were measured along with water status, chlorophyll fluorescence and chlorophyll concentration variables in the leaves of well watered, moderately stressed, severely stressed and rehydrated plants under each temperature regime. The PSII effective photochemical efficiency (phi(2)) and the intrinsic efficiency of open PSII centres (F-v'/F-m') correlated significantly with PRI, and these three variables loaded heavily onto the same principal component of a three-factor principal component analysis solution. Water concentration (WC) and the succulence index (SI) were more strongly correlated with WI than either water potential (Psi(PD)) or relative water content (RWC). Accordingly, WI, WC and SI were combined in the second principal component, and Psi(PD) and RWC in the third. Our results provide clear evidence for interaction between water availability and temperature in the WI and the PRI response segments of the reflectance curves. Elevated temperature inhibited the recovery of WI spectral segments more than that of the PRI segments in SS plants. REP showed a strongly positive linear relationship with leaf total chlorophyll concentration across all water and temperature treatment combinations. PRI, WI and REP are therefore reliable markers that can be used to monitor phi(2), WC and total chlorophyll concentration, respectively, in C. siliqua seedlings under drought and temperature stress. |
| [32] | Abstract We present new remote sensing indices of plant water status: the ratio between the reflectance at 970 nm, one of the water absorption bands, and the reflectance at a reference wavelength, 900 nm (R970/R9000; the first derivative minimum in this near-infrared region (dNIRminimum ) and the wavelength where this minimum is found ( 位NIRminimum). In order to evaluate them, we carried out three experiments. Daily irrigated gerbera plants were allowed to dry until almost wilting and then daily irrigation was restarted; pepper and bean plants were grown for four months submitted to two different irrigation treatments; and bean detached leaves were submitted to progressive dehydration whereas pressure-volume curves were being carried out. In gerbera plants, the trough about 950鈥970 nm decreased as the drought was increasing. Therefore, the R970/R900 index and the dNIRminimum closely tracked the changes in relative water content (RWC), leaf water potential, stomatal conductance and the foliage-air temperat... |
| [33] | Measurements of reflectance in visible and near-infrared spectral regions were made on detached leaves of two crop species of different leaf morphology, structure, and water content (peanut and wheat) throughout progressive desiccation. Relative water content (RWC) was well correlated with water index (WI) but even better with the ratio of WI and normalized difference vegetation index. RWC was also significantly correlated with structural independent pigment index indicative of carotenoids/chlorophyll ratio. New indication is thus provided to assess leaf water content and apply simple and fast radiometric techniques for plant water stress management. |
| [34] | |
| [35] | A total of 139 reflectance spectra (between 350 and 2500 nm) from coast live oak ( Quercus agrifolia ) leaves were measured in the laboratory with a spectrometer FieldSpec庐Pro FR. Correlation analysis was conducted between absorption features, three-band ratio indices derived from the spectra and corresponding relative water content (RWC, %) of oak leaves. The experimental results indicate that there exist linear relationships between the RWC of oak leaves and absorption feature parameters: wavelength position (WAVE), absorption feature depth (DEP), width (WID) and the multiplication of DEP and WID (AREA) at the 975 nm, 1200 nm and 1750 nm positions and two three-band ratio indices: RATIO 975 and RATIO 1200, derived at 975 nm and 1200 nm. AREA has a higher and more stable correlation with RWC compared to other features. It is worthy of noting that the two three-band ratio indices, RATIO 975 and RATIO 1200, may have potential application in assessing water status in vegetation. |
| [36] | The common features of spectral reflectance from vegetation foliage upon leaf dehydration are decreasing water absorption troughs in the near-infrared (NIR) and short-wave-infrared (SWIR). We studied which leaf water index in the NIR and SWIR is most suitable for the assessment of leaf water content and the detection of leaf dehydration from the laboratory standpoint. We also examined the influence of the thickness of leaves upon leaf water indices. All leaf water content indices examined exhibited basic correlations with the relative water content (RWC) of leaves, while the R 1300/R 1450 leaf water index also demonstrated a high signal strength and low variability (R 2>0.94). All examined leaf reflectance ratios could also be correlated with leaf thickness. The thickness of leaves, however, was not independent of leaf RWC but appeared to decrease substantially as a result of leaf dehydration. |
| [37] | Abstract Despite decades of research on plant drought tolerance, the physiological mechanisms by which trees succumb to drought are still under debate. We report results from an experiment designed to separate and test the current leading hypotheses of tree mortality. We show that pi帽on pine (Pinus edulis) trees can die of both hydraulic failure and carbon starvation, and that during drought, the loss of conductivity and carbohydrate reserves can also co-occur. Hydraulic constraints on plant carbohydrate use determined survival time: turgor loss in the phloem limited access to carbohydrate reserves, but hydraulic control of respiration prolonged survival. Our data also demonstrate that hydraulic failure may be associated with loss of adequate tissue carbohydrate content required for osmoregulation, which then promotes failure to maintain hydraulic integrity. Published 2013. This article is a U.S. Government work and is in the public domain in the USA. |
| [38] | |
| [39] | Leaf pigment content can provide valuable insight into the physiological performance of leaves. Measurement of spectral reflectance provides a fast, nondestructive method for pigment estimation. A large number of spectral indices have been developed for estimation of leaf pigment content. However, in most cases these indices have been tested for only one or at most a few related species and thus it is not clear whether they can be applied across species with varying leaf structural characteristics. Our objective in this study was to develop spectral indices for prediction of leaf pigment content that are relatively insensitive to species and leaf structure variation and thus could be applied in larger scale remote-sensing studies without extensive calibration. We also quantified the degree of spectral interference between pigments when multiple pigments occur within the same leaf tissue. We found that previously published spectral indices provided relatively poor correlations with leaf chlorophyll content when applied across a wide range of species and plant functional types. Leaf surface reflectance appeared to be the most important factor in this variation. By developing a new spectral index that reduces the effect of differences in leaf surface reflectance, we were able to significantly improve the correlations with chlorophyll content. We also found that an index based on the first derivative of reflectance in the red edge region was insensitive to leaf structural variation. The presence of other pigments did not significantly affect estimation of chlorophyll from spectral reflectance. Previously published carotenoid and anthocyanin indices performed poorly across the whole data set. However, we found that the photochemical reflectance index (PRI, originally developed for estimation of xanthophyll cycle pigment changes) was related to carotenoid/chlorophyll ratios in green leaves. This result has important implications for the interpretation of PRI measured at both large and small scales. Our results demonstrate that spectral indices can be applied across species with widely varying leaf structure without the necessity for extensive calibration for each species. This opens up new possibilities for assessment of vegetation health in heterogeneous natural environments. |
| [40] | The responses of photosynthetic gas exchange and chlorophyll fluorescence along with changes in carbohydrate and proline levels were studied in cowpea ( Vigna unguiculata ) during water stress and recovery. Three experiments were conducted under greenhouse and laboratory conditions. Decreased CO 2 assimilation rates during water stress were largely dependent on stomatal closure, which reduced available internal CO 2 and restricted water loss through transpiration. During the initial phase of stress, photochemical activity was not affected, as revealed by lack of alterations in fluorescence parameters associated with photosystem II (PSII) activity. Development of non-radiative energy dissipation mechanisms was evidenced during stress by increases in non-photochemical quenching and decreases in efficiency of excitation capture by open centers. At an advanced phase of stress, a down-regulation of PSII activity was observed along with some impairment of photochemical activity, as revealed by decreases in the maximum quantum yield of PSII (Fv/Fm). However, this impairment did not limit the overall photosynthetic process, since assimilation rates recovered, upon rewatering, independent of the still present decreased Fv/Fm values. Complete recovery of all gas exchange and fluorescence parameters occurred 3 days after rewatering. However, on the first day after water stress relief, assimilation rates only partially recovered in spite of the availability of internal CO 2 , suggesting some non-stomatal limitation of photosynthesis. Accordingly, the downregulation of PSII activity observed during stress persisted at this time. Our results on carbohydrate metabolic changes revealed an accumulation of soluble sugars in water-stressed leaves, which also persisted for 1 day after rewatering. This finding suggest a transient end-product inhibition of photosynthesis, contributing to a minor non-stomatal limitation during stress and initial phase of recovery. Increases in proline level were small and their onset was delayed after stress imposition, so that it may rather be a consequence and not a stress-induced beneficial response. |
| [41] | This study aimed to determine whether modification of physiological parameters could be detected remotely by monitoring the spectral reflectance of olive leaves in response to different degrees of drought. Three different drought intensities were simulated: (a) a mild drought by feeding abscisic acid to detached branches; (b) a rapid and severe drought by detaching leaves and letting them dry over several hours; (c) a relatively slow drought caused by withholding water to potted olive plants. The three degrees of stress affected gas exchange and chlorophyll fluorescence. When the inhibition of photosynthesis occurred within an hour it was not accompanied by a parallel reduction in chlorophyll concentration in the carotenoid to chlorophyll ratio. Consequently, changes in spectral reflectance in the visible region, e.g. in PRI (photochemical reflectance index) and FRI (fluorescence reflectance indices) were not significantly induced. In contrast, when the inhibition of photosynthesis caused by slow developing drought was prolonged (i.e. more than 24 hours) and led to a decrease in chlorophyll concentration and to a simultaneous increase in carotenoid to chlorophyll ratio, there were significant changes in the visible region of the leaf spectral reflectance and, in turn, in PRI and FRI. We defined 16 new reference wavelengths, from visible to SWIR regions, which are sensitive to both fast‐developing and slow‐developing stresses. These reference wavelengths were used to develop an algorithm, the Relative Reflectance Increment (RRI), that was linearly related to changes in relative water content (RWC, r 202=020.733). This algorithm showed that the 145502nm wavelength is highly affected by drought. This wavelength was therefore used to elaborate the water content reflectance index that was inversely related to RWC (r 202=020.702). |
| [42] | |
| [43] | |
| [44] | A stochastic leaf radiation model was used to predict leaf spectral reflectance as a function of leaf water content for a dicot leaf. Simulated spectral reflectances were analyzed to quantify reflectance differences between different equivalent water thicknesses. Simulated results coupled with consideration of atmoshperic transmission properties and the incident solar spectral irradiance at the earth's surface resulted in the conclusion that the 1.55–1.75 μm region was the best-suited wavelength interval for satellite—platform remote sensing of plant canopy water status in the 0.7–2.5 μm region of the spectrum. |
| [45] | A new index, the Normalized Multi-band Drought Index (NMDI), is proposed for monitoring soil and vegetation moisture from space. NMDI is defined as $NMDI = \frac{R- \left(R- R\right)}{R+ \left(R- R\right)}$, where R represents the apparent reflectance observed by a satellite sensor. Similar to the Normalized Difference Water Index, NMDI uses the 860 nm channel as the reference; instead of using a single liquid water absorption channel, however, it uses the difference between two liquid water absorption channels centered at 1640 nm and 2130 nm as the soil and vegetation moisture sensitive band. Analysis revealed that by combining information from multiple near infrared, and short wave infrared channels, NMDI has enhanced the sensitivity to drought severity, and is well suited to estimate both soil and vegetation moisture. Typical soil reflectance spectra and satellite-acquired reflectances, are used to validate the usefulness of NMDI. Its application to areas with moderate vegetation coverage, however, needs further investigation. |
| [46] | This study aimed at finding efficient hyperspectral indices for estimating three leaf biochemical parameters: chlorophyll content (CHL, μg02cm 612 ), leaf water thickness (EWT, g02cm 612 ), and leaf mass per area (LMA, g02cm 612 ) in typical temperate deciduous forests. These parameters are required by most biogeochemical models that describe ecosystem functions. We have identified the most efficient hyperspectral indices (both the index types and the wavelength domains) based on both a simulated data set (produced with the calibrated leaf reflectance model PROSPECT) and with data sets (I, II, and III) from measurement of field-collected leaves. Results indicated that CHL, EWT, and LMA can be estimated with high precision using a two-waveband vegetation index (Double Deference index, DDn) for all parameters, with an overall root mean square error (RMSE) of 6.8702μg02cm 612 for CHL, 0.001102g02cm 612 for EWT, and 0.001502g02cm 612 for LMA. The best overall indices for temperate deciduous forests were DDn (715, 185) for CHL, DDn (1530, 525) for EWT, and DDn (1235, 25) for LMA, although these indices were not necessarily the best for every specific data set (especially for the simulated data set). Moreover, discrepancies were obvious when the identified indices were applied to different data sets. Even if the wavelengths of calibrated indices have been accurately determined through the simulated data set, the regressions between the indices and the biochemical parameters must be calibrated with field-based measurements. The indices identified in this study are applicable to various species (data set III), various phenological stages and locations (data set I), and various leaf anatomies (data set II) and may therefore be widely applicable for temperate deciduous forests and possibly for other plant communities. |
| [47] | The present study deals with the relationships between water status parameters of plant leaves and reflectances (R λ ) at characteristic wavelengths, between 522 and 2450 nm, as well as reflectance ratios, R λ /R 1430 , R λ /R 1650 , R λ /R 1850 , R λ /R 1920 , and R λ /R 1950 , based on the air-drying experimental results of soybean ( Glycine max Merr.), maize ( Zea mays L.), tuliptree ( Liriodendron tulipifera L.) and viburnum ( Viburnum awabuki K. Koch.) plants. The water status parameters include leaf water content per unit leaf area (LWC), specific leaf water content (SWC), leaf moisture percentage of fresh weight (LMP), relative leaf water content (RWC) and relative leaf moisture percentage on fresh weight basis (RMP). Effective spectral reflectances and reflectance ratios for estimating the LWC, SWC, LMP, RWC and RMP were identified. With these spectral indices, approaches to estimating LWC, RWC and RMP were discussed. Eventually, an attempt on universal formulas was made for estimating the leaf moisture conditions of both herbaceous and woody plants as mentioned above. Moreover, applicability of these formulas was checked with the field experimental results of soybean and maize grown under water and nutrient stresses. |
| [48] | Statistical and radiative-transfer physically based studies have previously demonstrated the relationship between leaf water content and leaf-level reflectance in the near-infrared spectral region. The successful scaling up of such methods to the canopy level requires modeling the effect of canopy structure and viewing geometry on reflectance bands and optical indices used for estimation of water content, such as normalized difference water index (NDWI), simple ratio water index (SRWI) and plant water index (PWI). This study conducts a radiative transfer simulation, linking leaf and canopy models, to study the effects of leaf structure, dry matter content, leaf area index (LAI), and the viewing geometry, on the estimation of leaf equivalent water thickness from canopy-level reflectance. The applicability of radiative transfer model inversion methods to MODIS is studied, investigating its spectral capability for water content estimation. A modeling study is conducted, simulating leaf and canopy MODIS-equivalent synthetic spectra with random input variables to test different inversion assumptions. A field sampling campaign to assess the investigated simulation methods was undertaken for analysis of leaf water content from leaf samples in 10 study sites of chaparral vegetation in California, USA, between March and September 2000. MODIS reflectance data were processed from the same period for equivalent water thickness estimation by model inversion linking the PROSPECT leaf model and SAILH canopy reflectance model. MODIS reflectance data, viewing geometry values, and LAI were used as inputs in the model inversion for estimation of leaf equivalent water thickness, dry matter, and leaf structure. Results showed good correlation between the time series of MODIS-estimated equivalent water thickness and ground measured leaf fuel moisture (LFM) content ( r 2=0.7), demonstrating that these inversion methods could potentially be used for global monitoring of leaf water content in vegetation. |
| [49] | |
| [50] | Water content plays an important role in the process of plant photosynthesis and biomass accumulation. Many methods have been developed to retrieve canopy leaf water content from remote sensing data. However, the validity of these methods has not been verified, which limits their applications. This study estimates the Leaf Water Content (LWC) of winter wheat with three most widely used indexes: Normalized Difference Water Index (NDWI), Simple Ratio (SR), and Shortwave Infrared Perpendicular Water Stress Index (SPSI), as well as MODIS short wave and near infrared data, and then compares remote sensing estimates of vegetation water content with field-measured values measured in concurrent dates. The results indicate that the three indexes are significantly correlated with the LWC of winter wheat at the 0.01 significance level. They all have good accuracy with higher than 90%. The indexes derived from MODIS bands 6 and 2 were better than those from bands 7 and 2 for measuring wheat leaf water content, and the correlations of the former two (NDWI and SR) were stronger than that of SPSI. |
1
2010
... 植物叶片的水分状况与反射光谱之间存在着复杂的相关关系, 一方面, 植物水分条件的变化会直接引起短波红外区域的光谱反射率发生相应的变化; 另一方面, 水分的变化又会诱导植物叶片发生生理和叶片结构变化, 引起反射光谱中可见光区域和近红外区域的光谱反射率变化, 这可能影响反射光谱对水分变化的敏感性(
Effective spectral characteristics of leaf for the remote sensing of leaf water content.
1988
Photosystem II photochemical efficiency, zeaxanthin and antioxidant contents in the poikilohydric Ramonda serbica during dehydration and rehydration.
1
2001
... 水分是植物体的重要组成成分, 植物的各项生理活动都必须在水的参与下才能进行.有研究表明, 叶片含水量降低会影响叶片光系统II (PSII)的电子传递速率和叶片的光化学效率(
Best hyperspectral indices for tracing leaf water status as determined from leaf dehydration experiments.
1
2015
... 光谱指数可以放大植被的有效反射信息, 减小外部因素影响, 构建适宜的敏感光谱指数能够有效地提取植被水分等生化组分信息(
Primary and secondary effects of water content on the spectral reflectance of leaves.
3
1991
... 通常来说, 模拟高强度水分胁迫条件下的野外试验中, 植物叶片的物理结构和生理活动都受到了很大的影响, 此时获得的光谱指数无法纯粹地反映植物叶片的水分状况; 而以往的研究表明, 叶片失水试验可以提供大范围的水分变化条件, 这比野外试验更适于光谱指数的识别(
... 前人的研究证明, 叶片的水分状况与反射光谱之间存在着紧密的相关关系, 这种关系在近红外区域和短波红外区域的特定波段范围表现得更为显著, 而在可见光区域的相关关系较弱(
... ;
Spectral reflectance of tall fescue (Festuca arundinacea Schreb.) under different irrigation and nitrogen conditions.
2015
a). Designing a spectral index to estimate vegetation water content from remote sensing data: Part 2. Validation and applications.
1
2002
... 植物在近红外和短波红外区域吸收电磁辐射的特征变化主要是水分子和其他分子中的O—H键的伸缩和弯曲振动引起的, 其吸收的峰值分别位于970、1β145、1β400和1β940 nm (
Detecting vegetation leaf water content using reflectance in the optical domain.
1
2001
... 植物在近红外和短波红外区域吸收电磁辐射的特征变化主要是水分子和其他分子中的O—H键的伸缩和弯曲振动引起的, 其吸收的峰值分别位于970、1β145、1β400和1β940 nm (
b). Designing a spectral index to estimate vegetation water content from remote sensing data: Part 1: Theoretical approach.
1
2002
... 植物在近红外和短波红外区域吸收电磁辐射的特征变化主要是水分子和其他分子中的O—H键的伸缩和弯曲振动引起的, 其吸收的峰值分别位于970、1β145、1β400和1β940 nm (
Spectroscopic determination of leaf water content using continuous wavelet analysis.
1
2011
... 前人的研究证明, 叶片的水分状况与反射光谱之间存在着紧密的相关关系, 这种关系在近红外区域和短波红外区域的特定波段范围表现得更为显著, 而在可见光区域的相关关系较弱(
Remote sensing of foliar chemistry.
1
1989
... 植物在近红外和短波红外区域吸收电磁辐射的特征变化主要是水分子和其他分子中的O—H键的伸缩和弯曲振动引起的, 其吸收的峰值分别位于970、1β145、1β400和1β940 nm (
High-spectral resolution data for determining leaf water content.
1
1992
... 前人的研究证明, 叶片的水分状况与反射光谱之间存在着紧密的相关关系, 这种关系在近红外区域和短波红外区域的特定波段范围表现得更为显著, 而在可见光区域的相关关系较弱(
川滇高山栎幼树叶片反射光谱对不同程度水分胁迫的响应. 现代农业科技,
1
2011
... 遥感是一种非损伤性的获得被测物体信息的手段, 高光谱遥感在生态学上的应用扩展了我们认识植被的能力, 使我们能够由简单的识别植被“是什么”逐步发展到定量化估测植被“怎么样”的更高水平(
Foliar spectral properties following leaf clipping and implications for handling techniques.
1
2006
... 前人的研究证明, 叶片的水分状况与反射光谱之间存在着紧密的相关关系, 这种关系在近红外区域和短波红外区域的特定波段范围表现得更为显著, 而在可见光区域的相关关系较弱(
NDWI—A normalized difference water index for remote sensing of vegetation liquid water from space.
1996
Water stress detection in potato plants using leaf temperature, emissivity, and reflectance.
2016
Identification and discrimination of water stress in wheat leaves (Triticum aestivum L.) by means of reflectance measurements.
2007
The influences of soil salinity, growth form, and leaf moisture on the spectral reflectance of Spartina alterniflora canopies.
1983
Detection of changes in leaf water content using near- and middle-infrared reflectances.
1989
Measurement of leaf relative water content by infrared reflectance.
1
1987
... 前人的研究证明, 叶片的水分状况与反射光谱之间存在着紧密的相关关系, 这种关系在近红外区域和短波红外区域的特定波段范围表现得更为显著, 而在可见光区域的相关关系较弱(
Non-destructive estimation of water status of intact crop leaves based on spectral reflectance measurements.
1993
PROSPECT: A model of leaf optical properties spectra.
1
1990
... 前人的研究证明, 叶片的水分状况与反射光谱之间存在着紧密的相关关系, 这种关系在近红外区域和短波红外区域的特定波段范围表现得更为显著, 而在可见光区域的相关关系较弱(
Estimating leaf biochemistry using the PROSPECT leaf optical properties model.
2
1996
... 植物在近红外和短波红外区域吸收电磁辐射的特征变化主要是水分子和其他分子中的O—H键的伸缩和弯曲振动引起的, 其吸收的峰值分别位于970、1β145、1β400和1β940 nm (
... 前人的研究证明, 叶片的水分状况与反射光谱之间存在着紧密的相关关系, 这种关系在近红外区域和短波红外区域的特定波段范围表现得更为显著, 而在可见光区域的相关关系较弱(
Physical and physiological basis for the reflectance of visible and near-infrared radiation from vegetation.
1
1970
... 前人的研究证明, 叶片的水分状况与反射光谱之间存在着紧密的相关关系, 这种关系在近红外区域和短波红外区域的特定波段范围表现得更为显著, 而在可见光区域的相关关系较弱(
Photosynthetic carbon assimilation and associated metabolism in relation to water deficits in higher plants.
1
2002
... 水分是植物体的重要组成成分, 植物的各项生理活动都必须在水的参与下才能进行.有研究表明, 叶片含水量降低会影响叶片光系统II (PSII)的电子传递速率和叶片的光化学效率(
Calibration and validation of hyperspectral indices for the estimation of broadleaved forest leaf chlorophyll content, leaf mass per area, leaf area index and leaf canopy biomass.
1
2008
... 植物在近红外和短波红外区域吸收电磁辐射的特征变化主要是水分子和其他分子中的O—H键的伸缩和弯曲振动引起的, 其吸收的峰值分别位于970、1β145、1β400和1β940 nm (
植物反射光谱对水分生理变化响应的研究进展. 植物生态学报,
1
2016
... 植物叶片的水分状况与反射光谱之间存在着复杂的相关关系, 一方面, 植物水分条件的变化会直接引起短波红外区域的光谱反射率发生相应的变化; 另一方面, 水分的变化又会诱导植物叶片发生生理和叶片结构变化, 引起反射光谱中可见光区域和近红外区域的光谱反射率变化, 这可能影响反射光谱对水分变化的敏感性(
Mechanisms of plant survival and mortality during drought: Why do some plants survive while others succumb to drought?
1
2008
... 水分是植物体的重要组成成分, 植物的各项生理活动都必须在水的参与下才能进行.有研究表明, 叶片含水量降低会影响叶片光系统II (PSII)的电子传递速率和叶片的光化学效率(
Evaluating theories of drought-induced vegetation mortality using a multimodel-experiment framework.
1
2013
... 水分是植物体的重要组成成分, 植物的各项生理活动都必须在水的参与下才能进行.有研究表明, 叶片含水量降低会影响叶片光系统II (PSII)的电子传递速率和叶片的光化学效率(
From Laboratory Spectroscopy to Remotely Sensed Spectra of Terrestrial Ecosystems. Kluwer Academic Publishers, Dordrecht, the
1
2002
... 遥感是一种非损伤性的获得被测物体信息的手段, 高光谱遥感在生态学上的应用扩展了我们认识植被的能力, 使我们能够由简单的识别植被“是什么”逐步发展到定量化估测植被“怎么样”的更高水平(
Reflectance indices as nondestructive indicators of the physiological status of Ceratonia siliqua seedlings under varying moisture and temperature regimes.
2012
The reflectance at the 950-970 nm region as an indicator of plant water status.
3
1993
... 通常来说, 模拟高强度水分胁迫条件下的野外试验中, 植物叶片的物理结构和生理活动都受到了很大的影响, 此时获得的光谱指数无法纯粹地反映植物叶片的水分状况; 而以往的研究表明, 叶片失水试验可以提供大范围的水分变化条件, 这比野外试验更适于光谱指数的识别(
... 前人的研究证明, 叶片的水分状况与反射光谱之间存在着紧密的相关关系, 这种关系在近红外区域和短波红外区域的特定波段范围表现得更为显著, 而在可见光区域的相关关系较弱(
... 光谱指数可以放大植被的有效反射信息, 减小外部因素影响, 构建适宜的敏感光谱指数能够有效地提取植被水分等生化组分信息(
Reflectance indices indicative of changes in water and pigment contents of peanut and wheat leaves.
1999
Estimation of plant water concentration by the reflectance Water Index WI (R900/R970).
1
1997
... 通常来说, 模拟高强度水分胁迫条件下的野外试验中, 植物叶片的物理结构和生理活动都受到了很大的影响, 此时获得的光谱指数无法纯粹地反映植物叶片的水分状况; 而以往的研究表明, 叶片失水试验可以提供大范围的水分变化条件, 这比野外试验更适于光谱指数的识别(
Spectral absorption features as indicators of water status in coast live oak (Quercus agrifolia) leaves.
2003
The assessment of leaf water content using leaf reflectance ratios in the visible, near-, and short-wave-infrared.
2
2008
... 通常来说, 模拟高强度水分胁迫条件下的野外试验中, 植物叶片的物理结构和生理活动都受到了很大的影响, 此时获得的光谱指数无法纯粹地反映植物叶片的水分状况; 而以往的研究表明, 叶片失水试验可以提供大范围的水分变化条件, 这比野外试验更适于光谱指数的识别(
... 前人的研究证明, 叶片的水分状况与反射光谱之间存在着紧密的相关关系, 这种关系在近红外区域和短波红外区域的特定波段范围表现得更为显著, 而在可见光区域的相关关系较弱(
How do trees die? A test of the hydraulic failure and carbon starvation hypotheses.
1
2014
... 水分是植物体的重要组成成分, 植物的各项生理活动都必须在水的参与下才能进行.有研究表明, 叶片含水量降低会影响叶片光系统II (PSII)的电子传递速率和叶片的光化学效率(
宝天曼落叶阔叶林种群生态位特征. 应用生态学报,
1
1999
... 宝天曼国家级自然保护区(33.42°-33.55° N, 111.88°-112.00° E)位于河南省西南部, 地处秦岭东段和伏牛山南坡, 最高峰海拔1β830 m, 总面积约53.4 km2, 总辐射量平均为455.34 kJ·cm-2, 年平均气温15.1 ℃, 1月平均气温1.5 ℃, 7月平均气温27.8 ℃; 年降水量885.6 mm, 多集中分布于6-8月的雨季, 年蒸发量991.6 mm, 年平均相对湿度为68%.植被以暖温带落叶阔叶林为主, 兼有北亚热带常绿落叶阔叶混交林的特点, 栎类物种约占宝天曼乔木树种的70%, 是当地主要建群树种(
Relationships between leaf pigment content and spectral reflectance across a wide range of species, leaf structures and developmental stages.
1
2002
... 前人的研究证明, 叶片的水分状况与反射光谱之间存在着紧密的相关关系, 这种关系在近红外区域和短波红外区域的特定波段范围表现得更为显著, 而在可见光区域的相关关系较弱(
Photosynthetic gas exchange, chlorophyll fluorescence and some associated metabolic changes in cowpea (Vigna unguiculata) during water stress and recovery.
1
2004
... 植物叶片的水分状况与反射光谱之间存在着复杂的相关关系, 一方面, 植物水分条件的变化会直接引起短波红外区域的光谱反射率发生相应的变化; 另一方面, 水分的变化又会诱导植物叶片发生生理和叶片结构变化, 引起反射光谱中可见光区域和近红外区域的光谱反射率变化, 这可能影响反射光谱对水分变化的敏感性(
Associated changes in physiological parameters and spectral reflectance indices in olive (Olea europaea L.) leaves in response to different levels of water stress.
1
2008
... 光谱指数可以放大植被的有效反射信息, 减小外部因素影响, 构建适宜的敏感光谱指数能够有效地提取植被水分等生化组分信息(
小麦冠层反射光谱与植株水分状况的关系. 应用生态学报,
2004
水稻叶片气孔导度与冠层反射光谱的定量关系分析. 植物生态学报,
2006
Remote sensing of leaf water content in the near infrared.
1
1980
... 前人的研究证明, 叶片的水分状况与反射光谱之间存在着紧密的相关关系, 这种关系在近红外区域和短波红外区域的特定波段范围表现得更为显著, 而在可见光区域的相关关系较弱(
NMDI: A normalized multi-band drought index for monitoring soil and vegetation moisture with satellite remote sensing.
2007
Hyperspectral indices for estimating leaf biochemical properties in temperate deciduous forests: Comparison of simulated and measured reflectance data sets.
2012
A proposal for universal formulas for estimating leaf water status of herbaceous and woody plants based on spectral reflectance properties.
2000
Water content estimation in vegetation with MODIS reflectance data and model inversion methods.
2003
Quantitative retrieval of crop water content under different soil moistures levels.
2006
Estimating and validating wheat leaf water content with three MODIS spectral indexes: A case study in Ningxia Plain, China.
2016

