 , 冯婵莹, 曾发旭
北京大学城市与环境学院, 北京 100871
Change of growth characters and carbon stocks in plantations of Pinus sylvestris var. mongolica in Saihanba, Hebei, China
XINGJuan, ZHENGCheng-Yang, FENGChan-Ying, ZENGFa-Xu通讯作者:
版权声明:2017植物生态学报编辑部本文是遵循CCAL协议的开放存取期刊,引用请务必标明出处。
基金资助:
展开
摘要
关键词:
Abstract
Keywords:
-->0
PDF (4605KB)元数据多维度评价相关文章收藏文章
本文引用格式导出EndNoteRisBibtex收藏本文-->
我国是世界上人工林面积最大的国家, 人工林面积达6 200万hm2, 约占我国森林总面积的31.8%① ( ① State Forestry Administration of the People’s Republic of China (2010). The 7th National forest inventory and status of forest resources, 1, 3-10. (in Chinese) [国家林业局 (2010). 第七次全国森林资源清查, 1, 3-10.])。自20世纪70年代以来, 我国森林碳储量的增加主要源自人工林面积的增加, 人工林碳储量约占森林碳储量的47.8% (Fang et al., 2001; Guo et al., 2013; Wang et al., 2014; Li et al., 2016)。樟子松(Pinus sylvestris var. mongolica)是我国北方干旱半干旱区的主要造林树种, 在我国人工林建设中具有重要的地位。樟子松属于欧洲赤松(Pinus sylvestris)的一个变种, 分布于我国大兴安岭和呼伦贝尔地区, 具有耐寒、耐旱、耐瘠薄、速生等优良特性(姜凤岐等, 1996)。樟子松在我国北方地区大量引种是从1955年开始的, 至今已在我国北方13省份300多个县营造樟子松人工林约67万hm2, 目前樟子松仍是我国北方干旱半干旱地区主要的造林树种(曾德慧等, 1996; 张继义等, 2005; Song et al., 2016)。研究樟子松人工林生长及固碳特征, 对我国北方风沙区人工林乃至全国人工林的经营管理与可持续发展具有重要的理论意义。
目前, 关于樟子松人工林生长、固碳等方面的研究已取得不少成果。20世纪后期, 主要是针对樟子松引种技术的研究(郎建民和宋廷茂, 1993; 曾德慧等, 1996)。21世纪初开始关注樟子松生长与立地条件的关系, 立地条件主要包括土壤水分和养分等(Zeng et al., 2009; Song et al., 2014, 2015)。近年来, 有关樟子松人工林的研究主要集中在生长和固碳两个方面。关于生长特征的研究主要在红花尔基、毛乌素沙漠、乌兰布和、科尔沁等地开展(Zhu et al., 2003; 格日勒等, 2004; 李露露等, 2015; 刘芳等, 2015; 刘新平等, 2016)。 这些研究中, 20-40林龄的樟子松人工林生长速率存在区域差异。关于樟子松人工林固碳特征的研究受到学界的关注, 取得了不少成果(贾炜玮等, 2012; 韩美娜等, 2015; 胡海清等, 2015), 发现樟子松中龄林仍具有较大的固碳潜力。但上述关于生长和固碳的研究, 大多是采用空间代替时间的方法或针对固定龄级的樟子松开展, 缺少时间尺度上对固定样地的调查, 并且往往未能考虑径级结构对生长与固碳的影响。针对上述问题, 我们用2006-2016年樟子松人工林固定样地生长数据, 研究其中龄林的生长及固碳特征, 并分析不同径级的林木生长及固碳特征是否存在差异。
我们选取河北塞罕坝机械林场樟子松人工林进行研究。该区域地处我国森林草原交错区、半 湿润半干旱季风气候区, 也是20世纪六七十年代大 面积樟子松造林的主要地区, 目前有林地面积7.5万hm2, 樟子松人工林约1.3万hm2 (戴继先, 2002), 樟子松生长大部分进入中龄阶段。本文基于1978年在该区营造的樟子松林, 进行10年(2006-2016年)的定点调查, 研究樟子松人工林在近自然状态下的生长和固碳特征, 并分析不同径级的林木生长和固碳差异, 为樟子松人工林的经营管理提供科学依据, 也为评估人工林生长及碳汇潜力提供参考。
1 材料和方法
1.1 研究区概况
本研究区地处内蒙古高原、大兴安岭山系与冀北山地交汇之处, 位于河北省围场满族蒙古族自治县北部的塞罕坝机械林场千层板林场(42.40° N、117.23° E, 海拔1 431 m)。该区域东部毗邻河北省围场满族蒙古族自治县姜家店乡, 西部与内蒙古自治区锡林郭勒盟多伦县接壤, 南部毗邻河北省承德市御道口牧场, 北部与内蒙古自治区赤峰市克什克腾旗相接。该区属于半干旱、半湿润气候区, 夏季凉爽, 冬季寒冷漫长。1960-2010年塞罕坝气象站统计资料表明, 该区年平均气温-1.4 ℃, 年降水量454.2 mm, 年日照时间2 367.8 h, 年平均相对湿度74.4%, 年蒸发量1 244.4 mm, 积雪期长达7个月, 最深冻土深度为168 cm。塞罕坝土壤为风沙土, 主要成土母质为风积物、残积物及冲积物。林下灌木、草本稀疏, 草本以大披针薹草(Carex lanceolata)、腺毛委陵菜(Potentilla longifolia)、地榆(Sanguisorba officinalis)、瓣蕊唐松草(Thalictrum petaloideum)等为主。1.2 数据采集
2006年9月在北京大学生态与环境观测系统塞罕坝实验站西边樟子松人工林(1978年栽植, 林龄29)设置400 m × 250 m的大样地, 样地四周以铁丝网围栏, 围栏内选择林分相对均匀的区域设置9块20 m × 20 m的固定样地。对样方内所有胸径(DBH) ≥ 3 cm的活立木进行挂牌编号, 安装自制的胸径生长圈, 用激光测高仪(Laser Technology, Germantown, USA)测定树高, 并记录其健康状态。固定样地保持自然生长状态(即无人为抚育、采伐或其他人为干扰)。2016年9月对样地内所有林木按2006年调查方法进行复查。对调查数据逐一进行校对核查, 确保数据的准确性。1.3 数据处理
根据2006年及2016年的实测胸径、树龄(N), 计算每株乔木的胸径、树高年增长量(AI)及年增长率(AIR), 计算公式如下:AIDBH = DBHN / N
AIRDBH (%) = (DBH2016 - DBH2006) / DBH2006 × 100%
根据胸径计算得到胸高断面积(BA), 将样地内胸高断面积之和换算为单位面积胸高断面积(m2?hm-2), 并计算胸高断面积增长量(BAI)及增长率(BAIR), 计算公式如下:
BAI (m2?hm-2) = (BA2016 - BA2006)
BAIR (%) = (BA2016 - BA2006) / BA2006 × 100%
乔木生物量方程是根据河北塞罕坝樟子松解析木计算获得, 包括樟子松的树干、树枝、树叶和树根生物量, 总生物量为各个器官总和。碳储量用生物量乘以0.5系数获得(表1)。
本文数据分析和图表制作采用SPSS 20.0 (IBM, USA)统计软件完成。
Table 1
表1
表1樟子松和落叶松各生物量组分计算公式
Table 1Formulae for biomass in different components of Pinus sylvestris var. mongolica and Larix principis-rupprechtii
| 树种 Species | 器官 Organ | 生物量方程 Formulate for biomass |
|---|---|---|
| 樟子松 | 树干 Stem | W = 0.039 × (D2H)0.888 |
| Pinus sylvestris var. mongolica | 树枝 Branch | W = 0. 047 × (D2H)0.705 |
| 树叶 Foliage | W = 0.075 × (D2H)0.404 | |
| 树根 Root | W = 0.012 × (D2H)0.873 | |
| 落叶松 | 树干 Stem | W = 0.065 × (D2H)0793 |
| Larix principis-rupprechtii | 树枝 Branch | W = 0.052 × (D2H)0.679 |
| 树叶 Foliage | W = 0.139 × (D2H)0.457 | |
| 树根 Root | W = 0.023 × (D2H)0.75 |
新窗口打开
2 结果和分析
2.1 胸径和树高变化
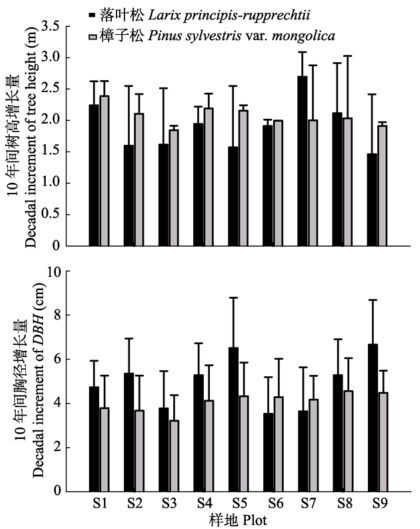
2006年和2016年塞罕坝樟子松人工林林木的平均胸径为(10.95 ± 3.53) cm和(15.56 ± 6.29) cm, 10年间胸径增长量为4.61 cm, 同比增长了4.21% (表2、表3), 年均增长量为0.461 cm, 大于2006年前的年均生长量0.456 cm; 样地内混生一些落叶松(Larix principis-rupprechtii), 2006年和2016年平均胸径为(12.29 ± 4.34)和(17.18 ± 6.54) cm, 10年间胸径增量为4.89 cm, 增长了3.98%, 年平均增长量(0.49 cm)小于2006年之前的年平均增长量(0.512 cm)。樟子松10年间平均树高增加1.88 m, 增长率21.5%, 落叶松树高10年间增加了1.18 m, 增幅为12.40%。樟子松胸径、树高增幅均大于落叶松。9块调查样地的樟子松和落叶松株数比例有差异, 其中样地S1、S2、S3的樟子松和落叶松株数比例属于混交林, 样地S4、S5、S6、S7、S8、S9为樟子松纯林, 样地间树木平均胸径、树高增长量有一定差别, 但没有统计上的显著性(图1)。Table 2
表2
表2樟子松人工林林分结构特征(平均值±标准偏差)
Table 2Stand characteristics of Pinus sylvestris var. mongolica plantations (mean ± SD)
| 树种 Species | 2006年 | 2016年 | 年均增幅 Annual increment rate (%) | |||||
|---|---|---|---|---|---|---|---|---|
| 密度 Density (stems?hm-2) | 胸径 DBH (cm) | 树高 Tree height (m) | 密度 Density (stems?hm-2) | 胸径 DBH (cm) | 树高 Tree height (m) | 胸径 DBH | 树高 Tree height (m) | |
| 樟子松 Pinus sylvestris var. mongolica | 2 900 | 10.95 ± 3.53 | 8.74 ± 1.54 | 2 625 | 15.56 ± 6.29 | 10.62 ± 2.22 | 4.21 | 2.15 |
| 落叶松 Larix principis-rupprechtii | 669 | 12.29 ± 4.34 | 9.49 ± 2.08 | 650 | 17.18 ± 6.54 | 10.67 ± 2.66 | 3.98 | 1.24 |
| 林分 Stand | 3 569 | 11.19 ± 3.73 | 8.88 ± 1.68 | 3 275 | 15.88 ± 6.37 | 10.63 ± 2.37 | 4.19 | 1.97 |
新窗口打开
Table 3
表3
表3树木年生长量特征
Table 3Dynamics of annual tree growth
| 树种 Species | 年份 Year | 胸径 DBH (cm) | 树高 Tree height (m) | ||
|---|---|---|---|---|---|
| 总生长量 Total increment | 年生长量 Annual increment | 总生长量 Total increment | 年生长量 Annual increment | ||
| 樟子松 Pinus sylvestris var. mongolica | 2006 | 10.95 | 0.456 | 8.74 | 0.257 |
| 2016 | 15.56 | 0.458 | 10.62 | 0.312 | |
| 落叶松 Larix principis- rupprechtii | 2006 | 12.29 | 0.512 | 9.49 | 0.279 |
| 2016 | 17.18 | 0.505 | 10.67 | 0.314 | |
| 林分 Stand | 2006 | 11.19 | 0.466 | 8.88 | 0.261 |
| 2016 | 15.88 | 0.467 | 10.63 | 0.313 | |
新窗口打开
 显示原图|下载原图ZIP|生成PPT
图110年间塞罕坝樟子松人工林胸径、树高增长量(平均值±标准误差)。
-->Fig. 1Decadal increment of diameter at breast height (DBH) and tree height in Pinus sylvestris var. mongolica plantations in Saihanba (mean ± SE).
-->
2.2 胸高断面积变化
樟子松林10年间胸高断面积(BA)增加了(36.27 ± 4.09) m2?hm-2, 增长率为98.1%。其中, 樟子松和落叶松胸高断面积分别增长27.94和8.33 m2?hm-2, 增长率分别为98.5%和105.0%, 这两个树种的胸高断面积年增长率相近。数据分析(图2)表明, 不同径级林木对林分总胸高断面积增长的贡献不同, 其中, 10-15 cm、15-20 cm径级的林木胸高断面积增量占林分总体增量的87.7%, 是樟子松人工林胸高断面积增加的主要来源。小径级(DBH ≤ 10 cm)林木胸高断面积增量占林分总体增量的8.1%, 该径级林木株数占林分总株数的24.5%。2.3 径级与林木生长的关系
以2006年胸径大小划分径级, 10年间不同径级林木的胸径生长存在差异(图2)。樟子松DBH增长量在0-5 cm之间(平均胸径(DBHavg) = 1.74 cm)的林木占总株数的61.7%, DBH增长量在5-10 cm之间(DBHavg = 7.27 cm)的林木占总株数的31.7%; 样地内混交的落叶松10年间胸径平均增长量为4.89 cm, DBH增长量在0-5 cm之间(DBHavg = 2.47 cm)的林木占总株数的50.2%, DBH增长量在5-10 cm之间(DBHavg = 6.78 cm)的林木占总株数的47.2%。15- 20 cm径级的林木胸径增长最高, 年增长率达6.15%, 其次是20-25 cm径级的林木年增长率达6.03%, 0- 5 cm和5-10 cm径级的林木年增长率较低, 分别为2.23%和2.47%。就胸高断面积增长而言, 10-15 cm径级的林木贡献最大, 其次是15-20 cm、5-10 cm径级的林木, 0-5 cm径级的林木对林分总体胸高断面积增量的贡献最小。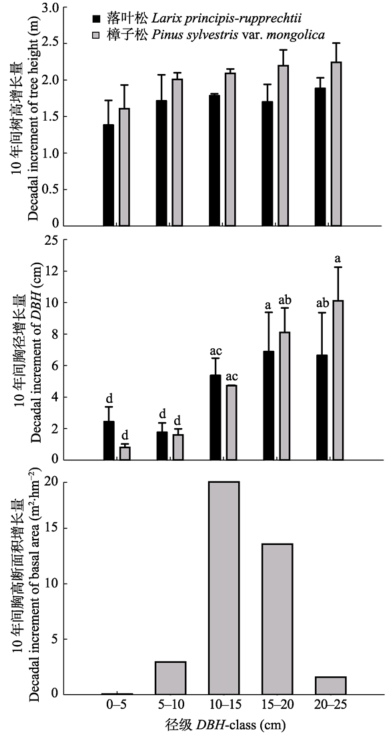 显示原图|下载原图ZIP|生成PPT
图210年间不同径级的胸径、树高和胸高断面积增长量。小写字母表示不同径级的10年间胸径、树高、胸高断面积增长量的多重比较显著水平(p < 0.05) (平均值±标准误差)。
-->Fig. 2Decadal increment of diameter at breast height (DBH), tree height and basal area in different DBH-class. Lowercase letter represent the significant level of multiple comparisons of decadal increment of DBH, tree height and basal area in different DBH-class (mean ± SE).
-->
不同径级林木的树高生长存在差异, 樟子松15-20 cm径级林木的树高年增长率(3.21%)最大, 其次是10-15 cm径级林木的年增长率(3.05%), 最小树高增长率出现在0-5 cm径级(2.54%), 这与20-25 cm径级的树高年增长率(2.64%)相近。落叶松树高年增长率呈现与樟子松相似的趋势, 即随着径级增加, 树高的年增长率逐渐增大。落叶松的树高年增长率最高出现在20-25 cm径级的林木(2.99%), 最低出现在0-5 cm径级的林木(2.25%), 其余径级的树高年增长率相近, 在2.4%-2.5%之间。总体看来, 树高年生长率与胸径呈现不同的规律, 树高生长在不同径级之间的差异小于胸径, 即胸径生长变化较大, 树高生长较为均一。
2.4 树木死亡
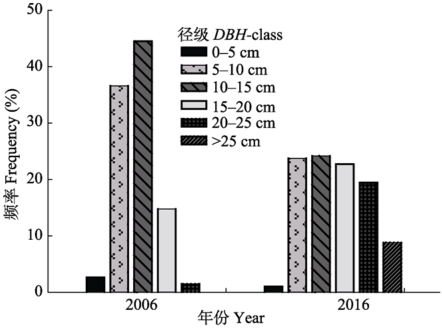
10年间树木死亡较多(表4), 总死亡株数占2006年树木株数的7.78%。其中, 0-5 cm径级的林木死亡数量较大, 死亡株数占该径级林木总株数的64.7%, 5-10 cm径级的林木死亡率为13.85%, 而10-15 cm径级的林木死亡率为1.40%。综上所述, 5-10 cm径级的林木死亡数量最大, 但是0-5 cm径级的林木死亡率最高。研究数据表明, 樟子松、落叶松株数比例为混交林样地(S1-3)樟子松死亡率大于纯林样地(S4-S9)。10年前后树木径级结构变化明显(图3)。2006年树木生长比较均一, 树木胸径主要分布在5-15 cm径级, 大部分树木生长较快, 林木个体间的差异不大, 近90%的林木处于相似径级。2016年树木径级差异增大, 小径级的林木个体减少, 中等径级的个体分布较多, 林内个体生长差异增大。
Table 4
表4
表4不同径级林木死亡率
Table 4Mortality of forest stand in different DBH-class
| 径级 DBH-class (cm) | 2006年 | 2016年 | 10年间死亡率 Decadal mortality (%) | |||
|---|---|---|---|---|---|---|
| 樟子松 Pinus sylvestris var. mongolica | 落叶松 Larix principis- rupprechtii | 樟子松 Pinus sylvestris var. mongolica | 落叶松 Larix principis- rupprechtii | 樟子松 Pinus sylvestris var. mongolica | 落叶松 Larix principis- rupprechtii | |
| 0-5 | 29 | 5 | 8 | 4 | 72.4 | 20.0 |
| 5-10 | 404 | 67 | 330 | 63 | 18.3 | 5.9 |
| 10-15 | 466 | 107 | 460 | 105 | 1.3 | 1.9 |
| 15-20 | 143 | 47 | 143 | 47 | 0.0 | 0.0 |
| 20-25 | 4 | 15 | 4 | 15 | 0.0 | 0.0 |
新窗口打开
 显示原图|下载原图ZIP|生成PPT
图32006年和2016年樟子松人工林胸径频率分布。
-->Fig. 3Diameter at breast height (DBH) frequency distribution in Pinus sylvestris var. mongolica plantation in 2006 and 2016.
-->
2.5 碳储量变化
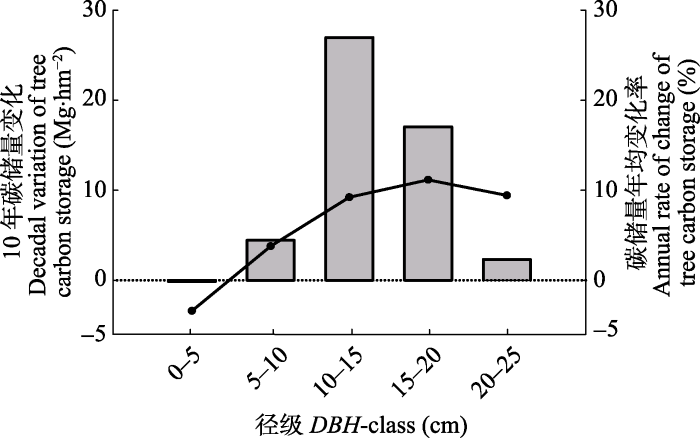
樟子松人工林2006年和2016年乔木层碳储量分别为59.04 Mg?hm-2和109.64 Mg?hm-2, 10年间固碳量为50.60 Mg?hm-2, 增幅高达85.69%。其中, 10年间樟子松组分固碳量为36.09 Mg?hm-2, 落叶松组分固碳量为14.51 Mg?hm-2。进一步划分树干、枝、叶和根进行分析, 树干碳储量占比较高, 其次是树枝、树根, 树叶碳储量占比最小。10年前后不同组分碳储量占比发生了变化, 树干、树根的碳储量占比增加, 树枝、树叶的碳储量占比下降。2006年树干、树枝、树叶、树根占比分别为56.77%、19.32%、8.94%、14.98%, 到2016年占比为60.10%、17.79%、6.61%、15.33%, 可见树干和树根是碳储量的主要载体。10年前后, 碳储量占比变化较大的是树叶, 占比减少了31.65%, 其次是树枝占比下降了7.9%, 树干占比增长了5.88%, 树根占比增加了2.33%。不同径级林木的固碳能力存在差异(图4)。2006-2016年林分整体碳储量增加明显, 但0-5 cm径级的林木碳储量减少, 这可能与该径级林木的死亡率较高有关。10-15 cm径级的林木碳储量年变化量最大, 年均增长5.41 Mg?hm-2, 其次是15-20 cm径级的林木(3.41 Mg?hm-2)、5-10 cm径级的林木(0.88 Mg?hm-2)。值得注意的是, 落叶松和樟子松的碳储量年变化量最大值分别为4.02和1.37 Mg?hm-2, 都出现在10-15 cm径级的林木。樟子松和落叶松碳储量年变化量最小值分别是-0.05和0.01 Mg?hm-2, 都出现在0-5 cm径级的林木。但两个树种5-10 cm、20-15 cm径级的林木碳储量变化存在差异。樟子松5-10 cm径级的林木碳储量年增长量更高, 这可能主要与该径级的林木株数较多有关。
 显示原图|下载原图ZIP|生成PPT
图410年间不同径级林木碳储量变化和碳储量年平均变 化率。
-->Fig. 4Decadal variation and annual rate of change of tree carbon storage in different DBH-class. DBH, diameter at breast height.
-->
碳储量年均变化率在树种和不同径级间存在差异(图4)。林分总体的碳储量年均增长8.69%, 樟子松增长了8.15%, 落叶松增长了10.58%。林分总体碳储量年均变化率最大的是15-20 cm的林木, 增长了11.29%, 年均变化率最小的是0-5 cm径级的林木, 下降了3.12%。对不同组分而言, 樟子松的碳储量年均变化率大致随着径级增长而增大, 15-20 cm径级的林木碳储量变化率高达11.46%, 即每年增长11.46%。落叶松的碳储量年均变化率有两个高峰, 变化率最大的是0-5 cm径级的林木, 达到15.38%, 并且10-15、15-20 cm的树木年均变化率相近, 约为11%。
3 讨论和结论
3.1 樟子松人工林的生长特征
樟子松人工中龄林在不同引种区的生长存在差异, 这主要与所在区域的气候条件有关(Zhu et al., 2003, 2008; Song et al., 2016)。塞罕坝作为20世纪60-70年代樟子松的主要造林地区, 樟子松人工中龄林生长比较稳定, 没有出现明显的衰退迹象。本研究中樟子松人工林在2006年(28年林龄)、2016年(38年林龄)平均胸径分别为10.95和15.56 cm, 平均树高分别为8.74和10.62 m, 该结果与辽宁省章古台地区樟子松人工林同龄级树木平均胸径、树高相近, 但胸径在10年间的年均增量(0.46 cm)高于章古台地区(0.2-0.3 cm), 树高年均增量(0.18 m)低于章古台地区(0.2 m)(曾德慧等, 1996), 胸径、树高增量均低于多伦地区樟子松人工幼龄林胸径年均增长量(6.37 cm)、树高年均增量(0.41 m)(刘红梅等, 2013), 胸径年均增量与同龄红花尔基地区樟子松天然林(0.3-0.4 cm)相似, 树高增量小于该区(0.2-0.3 m) (姜凤岐等, 1996)。本研究中樟子松人工林10年间树木胸径年均增长率为3.1%, 树高年均增长率为21.5%。该结果表明, 林分生长到一定阶段后树高的年均增长率略好于胸径的年均增长率, 这与Willims等(2012)的研究基本一致。胸径与树木生长、死亡特征密切相关(Muller- Landau et al., 2006), 影响林分的生物量(Xu et al., 2016)。本研究中, 无人为干扰的樟子松人工林10年间中等径级(15-20 cm)林木的胸径生长优于小径级(0-10 cm)林木, 其死亡率(1.4%)远远低于小径级林木。这可能与该径级的林木能够较好地获取资源, 在竞争中处于优势地位有关(Stephenson et al., 2014)。在成熟林和过熟林中, 往往是较大径级个体的林木容易死亡(Runkle, 2013), 但本研究中, 小径级林木死亡数量率约占64.7%, 说明樟子松人工中龄林仍处于发展阶段, 长势较弱的林木在竞争中逐渐被淘汰。本研究中, 10年间死亡的树木数量较大, 树木死亡率为7.78%, 这与森林不同发育阶段的树木个体间竞争加剧有关, 符合自然稀疏法则(Coomes & Allen, 2007)。综上所述, 中等径级的林木生长速率较高、死亡率低, 因此对林分生物量增加的贡献较大; 小径级林木生长率不高, 死亡率较高, 对胸高断面积以及生物量的贡献较小。
3.2 樟子松人工林的固碳特征
2006年和2016年研究区域樟子松人工中龄林的碳储量分别是59.04和109.64 Mg?hm-2, 高于其他地区的类似研究结果。胡海清等(2015)的研究显示东北地区樟子松中龄林碳密度为52.0 Mg?hm-2; 袁立敏等(2011)研究发现科尔沁沙地樟子松人工中龄林乔木层碳储量为57.8 Mg?hm-2; 韩美娜等(2015)研究的辽宁地区樟子松人工中龄林植被碳密度为33.83 Mg?hm-2。但该结果与中欧地区樟子松林的碳储量相近, 该生态系统碳储量为79-187 Mg?hm-2, 其中乔木层碳储量占比小于50% (Vucetich et al., 2000), 该结果也接近我国森林平均碳密度116.68 Mg?hm-2 (赵敏, 2004)。通过对比, 塞罕坝樟子松人工林密度较高(3 568株?hm-2), 其他研究地的樟子松密度一般在900-2 000株?hm-2。以往研究表明, 立地条件好的樟子松林适宜密度为3 000株?hm-2 (曾德慧等, 2000), 塞罕坝地区樟子松人工林能维持较高密度, 与当地中纬度、中海拔、降水量适中的良好环境条件有关。不同径级的林木固碳能力有差异。本研究中, 中等径级(10-20 cm)的林木株数约占总体的50%, 但碳储量增加量占总体碳储量增量的87%, 中等、较大径级林木生物量较高、固碳能力较强, 是林分生物量、碳储量的主要载体。该结果与我国尖峰岭地区、美国东北部地区关于森林生长的研究结论一致(陈德祥等, 2010; Fedrigo et al., 2014; Xu et al., 2016)。本研究中, 小径级(5-10 cm)林木10年间碳储量增加量较少。0-5 cm径级林木的碳储量减少, 这可能与该径级林木死亡率较高有关。但本研究区中等径级林木占比较大, 且树木生长较稳定, 可以预测未来10年能够持续、稳定地发挥固碳作用(张日升, 2016)。
影响樟子松林固碳能力的因素比较复杂。气候条件是影响樟子松固碳能力的重要因素, Vucetich等(2000)研究发现, 随着纬度升高和水热条件的下降, 樟子松林的碳储量减少, Dobbertin等(2010)发现水分增加能够促进樟子松的生长, Eilmann等(2010)和Maetin-Benito等(2013)认为干旱会导致樟子松生长减缓, 并且影响生长周期, 干旱通过影响碳水化合物的产生进而影响树木生长和林分的固碳能力。同时, 森林的自身特征也影响樟子松人工林的固碳水平, Alvarez等(2016)发现合理的林分密度有利于樟子松林的生长, Lee等(2016)研究认为樟子松林碳储量随着林龄的增加而增长, Michelot等(2012)研究认为生长季持续的时间对樟子松生长非常重要。同时, 王霓虹等(2014)和韩美娜等(2015)发现, 随着树龄增加, 树干、树枝、树叶、树根对碳储量的贡献度发生变化, 树根占比略微增长, 树枝和树叶占比逐渐下降, 本研究结果与之一致。
塞罕坝地区樟子松人工中龄林10年间生长状况良好, 碳储量增加明显, 该林分未来仍具有较大的固碳潜力。不同径级的林木生长、固碳能力有差异, 中等径级(10-20 cm)的林木生长速率较高, 对林分年固碳量贡献最大; 小径级(0-10 cm)林木株数虽多, 但在竞争中处于劣势, 生长速率低于中等径级林木, 并且死亡率高, 固碳能力十分有限。可见,樟子松人工中龄林生长及固碳量与径级结构、胸径增长量等密切相关。因此, 在人工林经营管理中应充分考虑上述因素, 并且在今后评估樟子松人工林乃至我国其他人工林生长特征和固碳潜力时, 应充分考虑林分的径级结构特征, 以期得到更准确的预测结果。
致谢 北京大学方精云等老师在本研究中给予指导, 任艳林在数据收集中给予支持和帮助, 李鹏、郭强、李超等同学在文章撰写中给予帮助, 在此表示感谢。
The authors have declared that no competing interests exist.
参考文献 原文顺序
文献年度倒序
文中引用次数倒序
被引期刊影响因子
| [1] | Prediction of future forest carbon (C) stocks as influenced by forest management and climate is a crucial issue in the search for strategies to mitigate and adapt to global change. It is hard to quantify the long-term effect of specific forest practices on C stocks due to the high number of processes affected by forest management. This work aims to quantify how forest management impacts C stocks in Mediterranean mountain forests based on 25 combinations of site index, tree species composition and thinning intensity in three different climate scenarios using the CO2Fix v.3.2 model Masera et al. (Ecol Modell 164:177-199, 2003 ). The study area is an ecotonal zone located in Central Spain, and the tree species are Scots pine ( Pinus sylvestris L.) and Pyrenean oak ( Quercus pyrenaica Willd.). Our results show a strong effect of tree species composition and a negligible effect of thinning intensity. Mixed stands have the highest total stand C stocks: 100% and 15% more than pure oak and pine stands respectively, and are here suggested as a feasible and effective mitigation option. Climate change induced a net C loss compared to control scenarios, when reduction in tree growth is taken into account. Mixed stands showed the lowest reduction in forest C stocks due to climate change, indicating that mixed stands are also a valid adaptation strategy. Thus converting from pure to mixed forests would enhance C sequestration under both current and future climate conditions. |
| [2] | 利用从1983年以来,2块固定样地清查数据(P8302,P9201)对尖峰岭热带山地雨林生物量和碳源汇大小进行估算,并探讨该森林碳源汇大小与环境因子的关系.结果表明,基于林分生物量、主要树种各组分碳含量而估算的碳密度,P8302样地在(223.95±45.92)~(254.85±48.86)MgC/ha间变动,平均为(243.35±47.64)MgC/ha;而P9201样地在(201.43±29.38)~(229.16±39.2)MgC/ha间变动,平均为(214.17±32.42)MgC/ha.林分碳源汇的年际变化较大,多年平均碳汇为(0.56±0.22)MgC·ha?1·a?1,与非洲和美洲热带森林的碳汇量((0.62±0.23)MgC·ha?1·a?1)相近,表明尖峰岭热带雨林具有一定的碳汇能力.碳源汇的大小与暴雨次数和干旱月份次数呈现二次曲线的变化趋势,暴雨次数和干旱月份次数是尖峰岭热带山地雨林碳源汇大小的两个关键影响因子. |
| [3] | Summary 1 Tree-size distributions are changing in many natural forests around the world, and it is important to understand the underlying processes that are causing these changes. Here we use a classic conceptual framework - the shifting mosaic of patches model - to explore the ways in which competitive thinning and disturbance influence tree-size distributions, and to consider the effects of temporal variability in disturbance frequency on the size structure of forests. 2 We monitored 250 stands of Nothofagus solandri var. cliffortiodes (mountain beech), randomly distributed over 9000 hectares, for 19 years. Mountain beech is a light-demanding species that forms monospecific forests in New Zealand mountains. For the purposes of our model, we assumed that each stand functions as an even-aged population: it is initiated by a pulse of recruitment, undergoes competitive thinning as it matures, and is eventually destroyed by a disturbance event. The tree-size distribution of the whole forest is driven partly by the frequency and temporal patchiness of disturbance events and partly by competitive processes within the constituent stands. 3 Temporal changes in stem density and mean tree size were observed to be remarkably similar in all young stands, indicating that a consistent packing rule operates during this phase of stand development. A popular idea in the self-thinning literature is that the maintenance of constant leaf area index (LAI) provides the mechanism for this packing rule, but our analyses suggest that LAI increased by about 30% during the thinning phase. We use leaf economic theory to develop a new packing rule based on light interception, and argue that LAI increases with stand age because of changes in canopy organisation. 4 Smaller trees were significantly more likely to die than larger trees within the young stands. Tree-diameter distributions within young stands were left skewed but those of older populations were normally distributed. These observations are consistent with asymmetric competition winnowing out small, suppressed trees from young stands but having less effect in older stands. 5 Large-scale disturbances created gaps of sufficient size to allow mass recruitment of seedlings in about 0.8% of stands each year. Older stands were most susceptible to such large-scale disturbance, but the trend was weak. 6 The diameter-distribution of the whole Nothofagus forest was found to be approximately exponential in form. Simulation models only produced realistic diameter distributions when competitive packing rules and disturbance were included. Therefore, the shifting mosaic model provides a general framework for understand the ways in which these mortality processes determine forest size structure. 7 The diameter distribution of the forest was not in equilibrium over the 19-year study. Using simulation models, we show that temporal variability in disturbance frequency can generate enormous deviations in tree-diameter distributions away from the long-term mean, leading us to conclude that modern-day disequilibrium in natural forests may be the legacy of past disturbance events. |
| [4] | |
| [5] | Abstract In Valais, Switzerland, Scots pines (Pinus sylvestris L.) are declining, mainly following drought. To assess the impact of drought on tree growth and survival, an irrigation experiment was initiated in 2003 in a mature pine forest, approximately doubling the annual precipitation. Tree crown transparency (lack of foliage) and leaf area index (LAI) were annually assessed. Seven irrigated and six control trees were felled in 2006, and needles, stem discs and branches were taken for growth analysis. Irrigation in 2004 and 2005, both with below-average precipitation, increased needle size, area and mass, stem growth and, with a 1-year delay, shoot length. This led to a relative decrease in tree crown transparency (-14%) and to an increase in stand LAI (+20%). Irrigation increased needle length by 70%, shoot length by 100% and ring width by 120%, regardless of crown transparency. Crown transparency correlated positively with mean needle size, shoot length and ring width and negatively with specific leaf area. Trees with high crown transparency (low growth, short needles) experienced similar increases in needle mass and growth with irrigation than trees with low transparency (high growth, long needles), indicating that seemingly declining trees were able to 'recover' when water supply became sufficient. A simple drought index before and during the irrigation explained most of the variation found in the parameters for both irrigated and control trees. |
| [6] | |
| [7] | The location and mechanisms responsible for the carbon sink in northern mid-latitude lands are uncertain. Here, we used an improved estimation method of forest biomass and a 50-year national forest resource inventory in China to estimate changes in the storage of living biomass between 1949 and 1998. Our results suggest that Chinese forests released about 0.68 petagram of carbon between 1949 and 1980, for an annual emission rate of 0.022 petagram of carbon. Carbon storage increased significantly after the late 1970s from 4.38 to 4.75 petagram of carbon by 1998, for a mean accumulation rate of 0.021 petagram of carbon per year, mainly due to forest expansion and regrowth. Since the mid-1970s, planted forests (afforestation and reforestation) have sequestered 0.45 petagram of carbon, and their average carbon density increased from 15.3 to 31.1 megagrams per hectare, while natural forests have lost an additional 0.14 petagram of carbon, suggesting that carbon sequestration through forest management practices addressed in the Kyoto Protocol could help offset industrial carbon dioxide emissions. |
| [8] | Reducing uncertainty in forest carbon estimates at local and regional scales has become increasingly important due to the centrality of the terrestrial carbon cycle in issues of climate change. Despite relatively limited geographical extent, temperate forests are among the most carbon dense forests in the world. Estimates of carbon in key understorey life forms and belowground components of these forests have often been excluded from previous studies in south-eastern Australia. We estimated above- and belowground carbon stocks (including soil to 0.302m depth) in stands of cool temperate rainforest (‘rainforest’), wet sclerophyll forest (‘eucalypt forest’), and mixed rainforest–wet sclerophyll stands (‘ecotone forest’) across a wide range of environmental conditions and forest structures. We examined relationships among component carbon stocks and a range of environmental variables (edaphic, climatic, spatial) and present the first allometric equations and carbon stock estimates for south-eastern Australian tree ferns. Component carbon stocks were within the range of published values for these stand types. Using multivariate analyses of all component stocks, we detected significantly more carbon in total above- and belowground components in ecotone (69702Mg02ha 611 , 95% confidence interval 575–81902Mg02ha 611 ) and eucalypt forests (68902Mg02ha 611 , 605–77302Mg02ha 611 ) than rainforest (55002Mg02ha 611 , 453–64702Mg02ha 611 ). However, we found no significant differences among the stand types in the proportional distribution of carbon among components despite significant differences in structural composition as indicated by size class distributions of the main genera. Of total carbon, 6548% was stored in trees (>202cm over-bark diameter), and 6572% of tree carbon was stored in the largest 10% of all trees. The most important environmental variables associated with carbon stocks irrespective of stand type were edaphic variables, most commonly total and available soil nitrogen. Tree fern carbon was the only component stock more strongly associated with climatic and spatial than edaphic variables. Our findings indicate that disturbance mediated changes in stand dynamics could significantly alter total carbon stocks, particularly if more frequent fires limit tree recruitment and increase large tree mortality. Monitoring of these forests for carbon could place greater emphasis on key structural elements associated with the largest proportion of total carbon, the largest trees. By reducing uncertainties associated with estimates of carbon in key stocks, we can better understand potential future changes to the carbon cycle from altered stand dynamics under climate change. |
| [9] | . |
| [10] | Forests play a leading role in regional and global carbon (C) cycles. Detailed assessment of the temporal and spatial changes in C sinks/sources of China’s forests is critical to the estimation of the national C budget and can help to constitute sustainable forest management policies for climate change. In this study, we explored the spatio-temporal changes in forest biomass C stocks in China between 1977 and 2008, using six periods of the national forest inventory data. According to the definition of the forest inventory, China’s forest was categorized into three groups: forest stand, economic forest, and bamboo forest. We estimated forest biomass C stocks for each inventory period by using continuous biomass expansion factor (BEF) method for forest stands, and the mean biomass density method for economic and bamboo forests. As a result, China’s forests have accumulated biomass C (i.e., biomass C sink) of 1896 Tg (1 Tg=10 12 g) during the study period, with 1710, 108 and 78 Tg C in forest stands, and economic and bamboo forests, respectively. Annual forest biomass C sink was 70.2 Tg C a 611 , offsetting 7.8% of the contemporary fossil CO 2 emissions in the country. The results also showed that planted forests have functioned as a persistent C sink, sequestrating 818 Tg C and accounting for 47.8% of total C sink in forest stands, and that the old-, mid- and young-aged forests have sequestrated 930, 391 and 388 Tg C from 1977 to 2008. Our results suggest that China’s forests have a big potential as biomass C sink in the future because of its large area of planted forests with young-aged growth and low C density. |
| [11] | . 沙地樟子松人工林作为三北防护林的重要组成部分,在防风固沙和固碳增汇过程中起着重要作用.本研究在辽西北付家林场选择不同林龄的樟子松人工林,包括10~20、20~ 30、30~40及40 ~ 50年生等4个林龄,并结合已建立的辽西北地区樟子松的异速生长方程,分别对其乔木和土壤碳储量进行研究.结果表明:樟子松人工林乔木碳储量随林龄的增加逐渐增大,10 ~ 20、20 ~ 30、30 ~ 40和40 ~ 50年生乔木碳储量分别为20.98、25.89、33.83、34.94 Mg C·hm-2,这主要与树干碳储量随林龄的增加逐渐增大有关,且树干碳储量占乔木总碳储量的比例最大,为47.25% ~ 56.17%;樟子松人工林土壤碳储量随林龄增加呈逐渐增大的趋势(30~40年生林略有下降),其中10~ 20年生林最小,40 ~ 50年生林最大,分别为32.80和51.46 Mg C·hm-2;此外,在土壤垂直剖面上,有机碳储量和碳含量均随土层深度的增加逐渐减小,其中土壤碳储量变化范围为19.20~4.57 Mg C·hm-2,碳含量为2.04% ~0.35%;樟子松人工林生态系统总碳储量随林龄增加逐渐增大,10~20年生到40~50年生樟子松林分别为53.78、61.88、67.48和86.40 Mg C·hm-2,整体固碳作用明显;此外,土壤碳库作为该地区樟子松林生态系统碳库的主要组成部分,其占总碳储量的比例为49.87% ~60.99%,乔木碳储量占总碳储量的比例为38.91%~50.13%.该研究结果为综合评价三北防护林的生态效益提供了可靠的基础数据. |
| [12] | ., |
| [13] | , |
| [14] | , |
| [15] | . 苗木不同包装和根系处理方法对造林成活率和初期生长量有着决定性的影响,塑料袋包装、稀土处理根系能显著提高樟子松造林效果(其造林成活率为96%;当年高生长量为5.9cm);吸水剂为一种很好的苗木根系处理药剂,它对不同的包装方法有很强的适用性(最低成活率为93%,最高达96.6%). |
| [16] | 61 Key messageSimulated and observed carbon stocks in Scots pine forests varied considerably with stand age. The contribution of biomass to the total forest carbon stocks increased and that of dead organic matter decreased with increasing stand age. 61 Context Understanding changes in forest carbon stocks over time is important to estimate carbon inventory. Although Scots pine (Pinus sylvestris L.) is a main species in Turkey, studies on such changes are still lacking. 61 Aims We aimed to estimate the changes in carbon stocks, with stand age, of Scots pine stands in Turkey using field work data and a forest carbon model (FBDC model). 61 Methods Biomass and dead organic matter carbon stocks were investigated to adjust the forest carbon model and to verify the model estimates. Forest carbon stocks with regards to stand age were simulated. 61 Results The simulated carbon stocks were generally in clear agreement with the observed values on a stand scale. Changes in simulated and observed carbon stocks of biomass and dead organic matter varied with stand age. The contribution of biomass to total forest carbon stocks increased, and that of dead organic matter decreased, with increasing stand age. 61 Conclusion We found that the carbon stocks in each pool and their contribution to the total forest carbon stocks varied with stand age. Our results are expected to contribute to the understanding of annual changes in the carbon stocks of Turkish forests. |
| [17] | , 基于树轮年代学的理论和方法,建立辽宁地区人工林樟子松年轮宽度年表网络,研究人工林樟子松树木年轮生长变化,探讨樟子松生长与气候变化的关系以及其对水热梯度变化的响应规律。结果表明,研究区各采样点人工林樟子松的径向生长变化呈现较为一致的显著下降趋势(P0.05),并且下降趋势由西北至东南降低。空间上水平上,研究区樟子松的径向生长与研究区降水和相对湿度的空间梯度变化吻合(P0.05),均呈西北至东南增加的特点;各采样点樟子松年轮宽度变化的平均敏感度与降水量、相对湿度显著负相关关系(P0.05),但与温度的正相关关系不显著。各样点樟子松径向生长与月降雨量和月平均相对湿度多呈正相关关系,与月平均温度多呈负相关关系,进一步表明区域水分因子对人工林樟子松生长的限制作用明显。 |
| [18] | , 根据全国第7次(2004-2008年)和第8次(2009-2013年)森林资源清查数据,采用IPCC法估算了我国9种主要人工林碳储量及碳密度变化规律和龄组特征,探讨了近年来主要造林树种的固碳能力.两次清查间隔期间,9种人工林平均碳密度增加了1.6 Mg· hm-2,总碳储量增加了126.89 Tg,年平均增加25.38 Tg.杨树和桉树年固碳量较高,分别为10.21、9.96 Tg·a-1,碳密度增加量分别为4.32、7.72 Mg· hm-2.2009-2013年间9种人工林各龄组的碳密度为:幼龄林(8.82 Mg· hm-2)<中龄林(24.01Mg·hm-2)<近熟林(29.37 Mg·hm-2)<过熟林(30.89 Mg·hm-2)<成熟林(35.67 Mg·hm-2).幼龄林和中龄林占主要人工林总面积的70.52%,具有较高的生长潜力和固碳潜力.研究结果可为我国人工林森林经营管理及碳汇功能评价提供参考. |
| [19] | . 本文以乌兰布和沙漠绿洲防护林中的樟子松(Pinus sylvestris var.mongolica)为对象,运用树干解析方法对树高、径生长和材积进行研究,结果表明:乌兰布和沙漠人工栽植的樟子松长势良好,樟子松防护林的初始成熟龄为24年;树高生长在12年(0.632m·a-1)之前为速生期,15年树高生长降为0.517m·a-1,在18年达到最大值0.634m·a-1;胸径生长速生期从第6年开始,18年达到最大值1.039cm·a-1;材积在第21年达到最大值0.108m3·a-1,达到最大值之前,樟子松材积在第12~15年和第18~21年生长速度减缓。平均木、优势木和园林木的树高差异均不显著(p>0.05);优势木与平均木、园林木的胸径生长量在F检验下差异显著(p0.05),第18年开始优势木与平均木材积量差异逐渐显著(p0.05)。 |
| [20] | , 本文以多伦县樟子松人工林为研究对象,对樟子松生物量、碳储量、林下枯落物和土壤进行研究,结果如下。樟子松树高和胸径在监测期间的增长模型均符合线性模型,模型拟合率均大于99%。樟子松叶片、树枝、树干和根系生物量和碳储量在年度间变化显著,其中树干生物量和碳储量的年增长量最大。樟子松生物量和碳储量中叶片、树枝的生物量和碳储量所占比例随着生长年限的增加呈下降的变化趋势,而树干的生物量和碳储量所占比例则呈增加的变化趋势。樟子松林下枯落物现存量较高,碳储量为2488kg/hm2。樟子松林下土壤碳储量集中在0-25cm层,达到54.94t/hm2,其平均碳含率为1.03%。 |
| [21] | . 樟子松(<i>Pinus sylvestris</i> var. <i>mongolica</i>)是科尔沁沙地广泛分布的一种具有显著经济和生态效益的树种。调查分析了降水和温度对樟子松人工林生长的影响。结果表明:25年龄樟子松人工林平均树高4.8 m,平均胸径7.81 cm,枯稍比可达16.87%。年生长高度对当年降水量的响应有1~2 a的滞后效应,年径生长量随着降水变化出现一定程度的波动,年累积降水量与累积径生长量之间存在显著的线性关系。当年高生长与当年、生长季及春季降水量显著负相关,与生长季气温显著正相关。累积径生长量与当年任一时段降水量均显著相关,与除春季之外的任一时段气温显著相关。气温是该区域樟子松生长的主要影响因素,生长季较高的气温有利于樟子松的高生长。 |
| [22] | We investigated the influence of climate on the ring width and xylem anatomy of two co-occurring pines ( Pinus nigra Arn. and P. sylvestris L.) in the mountains of east-central Spain in order to test their utility for dendroclimatic reconstructions. We developed chronologies of ring width, mean lumen diameter and mean cell-wall thickness (in the earlywood, latewood, and the total annual ring) and the number of cells between 1960 and 2006. Drought, expressed as the standardized precipitation-evapotranspiration index (SPEI), was the main climatic driver of tree radial growth, although trees were also sensitive to temperature (negative effect in previous autumn and current summer) and precipitation (with a general positive effect). P. sylvestris response was stronger to climate of the current year, whereas the effect of previous-year climate was more important for P. nigra . Warm and dry summers reduced ring width, tracheid lumen, and wall thickness in both species, whereas warm winter-spring temperatures had the opposite effect, primarily for P. sylvestris . Previous-year or early-season conditions mainly affected earlywood features, whereas latewood was more responsive to summer climate. Overall, climate appeared to be a stronger limiting factor for P. sylvestris . During periods of drought, cell-wall thickness was reduced while lumen width increased in the latewood of P. sylvestris . This could compromise its hydraulic safety against drought-induced cavitation as our site was close to the southern and dry edge of the species distribution area. Our results suggest that anatomical variables record different and stronger climate information than ring width variables, especially in P. sylvestris . Reconstruction models for SPEI at the 3-month scale were developed for July-August and September-October using principal components regression. The best models included anatomical and width variables of both pine species suggesting that tracheid chronologies can be useful for drought reconstructions especially at mesic sites or with species that encode a mixed drought and temperature-precipitation signal. |
| [23] | Monitoring cambial phenology and intra-annual growth dynamics is a useful approach for characterizing the tree growth response to climate change. However, there have been few reports concerning intra-annual wood formation in lowland temperate forests with high time resolution, especially for the comparison between deciduous and coniferous species. The main objective of this study was to determine how the timing, duration and rate of radial growth change between species as related to leaf phenology and the dynamics of non-structural carbohydrates (NSC) under the same climatic conditions. We studied two deciduous species, Fagus sylvatica L. and Quercus petraea (Matt.) Liebl., and an evergreen conifer, Pinus sylvestris L. During the 2009 growing season, we weekly monitored (i) the stem radial increment using dendrometers, (ii) the xylem growth using microcoring and (iii) the leaf phenology from direct observations of the tree crowns. The NSC content was also measured in the eight last rings of the stem cores in April, June and August 2009. The leaf phenology, NSC storage and intra-annual growth were clearly different between species, highlighting their contrasting carbon allocation. Beech growth began just after budburst, with a maximal growth rate when the leaves were mature and variations in the NSC content were low. Thus, beech radial growth seemed highly dependent on leaf photosynthesis. For oak, earlywood quickly developed before budburst, which probably led to the starch decrease quantified in the stem from April to June. For pine, growth began before the needles unfolding and the lack of NSC decrease during the growing season suggested that the substrates for radial growth were new assimilates of the needles from the previous year. Only for oak, the pattern determined from the intra-annual growth measured using microcoring differed from the pattern determined from dendrometer data. For all species, the ring width was significantly influenced by growth duration and not by growth rate, which differs from previous studies. The observed between-species difference at the intra-annual scale is key information for anticipating suitability of future species in temperate forests. |
| [24] | The theory of metabolic ecology predicts specific relationships among tree stem diameter, biomass, height, growth and mortality. As demographic rates are important to estimates of carbon fluxes in forests, this theory might offer important insights into the global carbon budget, and deserves careful assessment. We assembled data from 10 old-growth tropical forests encompassing censuses of 367 ha and > 1.7 million trees to test the theory's predictions. We also developed a set of alternative predictions that retained some assumptions of metabolic ecology while also considering how availability of a key limiting resource, light, changes with tree size. Our results show that there are no universal scaling relationships of growth or mortality with size among trees in tropical forests. Observed patterns were consistent with our alternative model in the one site where we had the data necessary to evaluate it, and were inconsistent with the predictions of metabolic ecology in all forests. |
| [25] | Old-growth forests dominated by understory-tolerant tree species are among forest types most likely to be in equilibrium. However, documentation of the degree to which they are in equilibrium over decades-long time periods is lacking. Changes in climate, pathogens, and land use all are likely to impact stand characteristics and species composition, even in these forests. Here, 32 years of vegetation changes in an old-growth beech (Fagus grandifolia)-sugar maple (Acer saccharum) forest in Hueston Woods, southwest Ohio, USA, are summarized. These changes involve canopy composition and structure, turnover in snags, and development of vegetation in treefall gaps. Stand basal area and canopy density have changed little in 32 years. However, beech has decreased in canopy importance (49% to 32%) while sugar maple has increased (32% to 47%). Annual mortality was about 1.3% throughout the study period. Mortality rates increased with stem size, but the fraction of larger stems increased due to ingrowth from smaller size classes. Beech was represented by more very large stems than small canopy stems: over time, death of those larger stems with inadequate replacement has caused the decrease in beech importance. Sugar maple was represented by more small canopy stems whose growth has increased its importance. The changes in beech and sugar maple relative importance are hypothesized to be due to forest fragmentation mostly from the early 1800s with some possible additional effects associated with the formation of the state park. Snag densities (12-16 snags/ha) and formation rates (1-3 snags.ha(-1).yr(-1)) remained consistent. The treefall gaps previously studied are closing, with a few, large stems remaining. Death of gap border trees occurs consistently enough to favor species able to combine growth in gaps and survival in the understory. |
| [26] | Key message Mongolian pine in a sparse wood grassland stand maintains a relatively stable state under the current water conditions by varying its water use sources at a constant water use efficiency. Abstract In a semi-arid sandy ecosystem, water is one of the most important factors influencing survival and growth of Mongolian pine in a sparse wood grassland (MPSWG); however, the mechanism of water utilization of MPSWG has been yet poorly understood. Stable isotopes of hydrogen and oxygen of water in xylem, soil, precipitation and groundwater were analyzed to determine water sources used by MPSWG from April to October in two consecutive years (1.2 and 0.89 times of long-term annual precipitation in 2010 and 2011, respectively). Needles 13 C were measured simultaneously to assess water use efficiency. Results showed that MPSWG used soil water (sampling depth up to 60 cm) between April and July, and in October. However, water sources used by MPSWG exhibited significant differences in August and September between 2 years. In 2010, MPSWG only utilized soil water in August and September due to higher soil water content, but they used both soil water and groundwater in 2011 because of lower soil water availability, suggesting that MPSWG could utilize groundwater to replenish soil water deficiency. No significant differences in mean 13 C among months and between 2 years indicated that MPSWG did not suffer severely water stresses. In conclusion, MPSWG only used soil water during higher precipitation year, whereas they primarily utilized soil water and relied a little on groundwater during lower precipitation year. Water obtained by MPSWG (including water stored in trunk) basically satisfied its requirement for growth. Thus, MPSWG stand was relatively stable presently in the semi-arid sandy region. |
| [27] | Mongolian pine ( Pinus sylvestris var. mongolica ) plantations in semiarid sandy lands play an important role in the prevention and control of desertification in northern China, but plantation dieback often occurs approximately 30–35 years after planting due to water deficiency. However, the seasonal changes in the water sources used by Mongolian pine trees of different ages remain unclear, and these changes influence the management of the plantations. During two consecutive years, 2012 and 2013, stable isotopes of hydrogen and oxygen from twig xylem water, soil water at different depths (0–20, 20–40, 40–60 and 60–10002cm), precipitation and groundwater were analyzed in 10-, 22-, 32- and 42-year-old Mongolian pine plantations to identify the sources of water used by the trees during different seasons (spring, summer and autumn). The soil water content, groundwater level and δ 13 C of the needles were measured concurrently, and the results showed that the 10- and 22-year-old trees only used soil water during the two years of observation, but the 32- and 42-year-old trees utilized both soil water and groundwater. In spring (late May), when soil water content was low, the 10- and 22-year-old trees used water from the 20–6002cm soil layer, but the 32- and 42-year-old trees utilized water from the 40–10002cm soil layer and groundwater. In summer (mid or late July), when soil water content was high, the trees of different ages used water from the 0–6002cm soil layer, and in autumn (mid or late September), when the soil water content was relatively high (2012), the trees of different ages used water from the 20–10002cm soil layer. However, when the soil water content was relatively low (2013), the 10- and 22-year-old trees continued to use water from the 20–10002cm soil layer, but the 32- and 42-year-old trees absorbed water from both the 60–10002cm soil layer and the groundwater. The contribution of groundwater to tree transpiration increased with decreasing soil moisture for the 32- and 42-year-old trees, and groundwater was the dominant water source (e.g., 60.2% of tree transpiration in the 42-year-old trees) when the soil moisture was approximately 20% of field capacity (3.5%). In addition, the significantly higher δ 13 C in the needles of the 22-year-old trees relative to the four ages of pine trees suggested higher water use efficiency in the 22-year-old trees. These findings suggest that the old Mongolian pine plantations (e.g., 30–35 years old) will experience greater mortality in the future if the groundwater level suddenly declines under drought conditions, but the young Mongolian pine plantations would suffer only slightly because their roots are unable to reach the saturated zone. |
| [28] | Dieback of Mongolian pine ( Pinus sylvestris var. mongolica ) wide windbreaks often emerges 3502years after planting in agroforestry systems. Water stress is considered to be the main cause for such dieback, but there is little knowledge about how water use efficiency of trees changes with their age. We measured needle δ 13 C as a proxy for intrinsic water use efficiency (iWUE), combined with specific leaf area, leaf dry matter content, soil water content, and groundwater level in 9-, 21-, and 41-year-old pine stands in 2011. Results showed that the mean δ 13 C value of 9-year-old trees was lower by 0.66 and 0.4802‰ than that of 21- and 41-year-old trees, respectively, but the mean δ 13 C value in 21-year-old trees was higher by 0.1702‰ than that in 41-year-old trees. Soil water content for 9-year-old trees was highest. Specific leaf area for 21-year-old trees was lowest. Compared with the other two tree ages, tree roots reached groundwater levels for 41-year-old trees. These results suggested that (1) 9-year-old trees with the lowest iWUE applied a prodigal water use strategy due to higher soil moisture, (2) 21-year-old trees with the highest iWUE employed a more conservative water use strategy and experienced significant water stress because of lower soil moisture and specific leaf area, and (3) the water use strategy of 41-year-old trees was between that of 9- and 21-year-old trees, likely due to both aging and uptake of groundwater. Dieback of Mongolian pine trees at older age (e.g., more than 3502years old) might occur when the groundwater level declines suddenly in years of extremely low rainfall. |
| [29] | Forests are major components of the global carbon cycle, providing substantial feedback to atmospheric greenhouse gas concentrations. Our ability to understand and predict changes in the forest carbon cycle--particularly net primary productivity and carbon storage--increasingly relies on models that represent biological processes across several scales of biological organization, from tree leaves to forest stands. Yet, despite advances in our understanding of productivity at the scales of leaves and stands, no consensus exists about the nature of productivity at the scale of the individual tree, in part because we lack a broad empirical assessment of whether rates of absolute tree mass growth (and thus carbon accumulation) decrease, remain constant, or increase as trees increase in size and age. Here we present a global analysis of 403 tropical and temperate tree species, showing that for most species mass growth rate increases continuously with tree size. Thus, large, old trees do not act simply as senescent carbon reservoirs but actively fix large amounts of carbon compared to smaller trees; at the extreme, a single big tree can add the same amount of carbon to the forest within a year as is contained in an entire mid-sized tree. The apparent paradoxes of individual tree growth increasing with tree size despite declining leaf-level and stand-level productivity can be explained, respectively, by increases in a tree's total leaf area that outpace declines in productivity per unit of leaf area and, among other factors, age-related reductions in population density. Our results resolve conflicting assumptions about the nature of tree growth, inform efforts to undertand and model forest carbon dynamics, and have additional implications for theories of resource allocation and plant senescence. |
| [30] | A significant portion of the Earth’s carbon is in forested terrestrial ecosystems. Carbon fluxes to and from these ecosystems in response to climate change have the potential to alter global climate. To understand how forest carbon budgets may be affected by climate, we observed patterns of carbon storage, forest structure, and composition in Scots pine forest ecosystems at nine sites along a northern latitudinal gradient (50–70°N) crossing Poland, Lithuania, Latvia, Estonia, and Finland. This gradient is characterized by a northward decline in average annual temperature (Δ = ca. 9°C) and precipitation (Δ = ca. 300 mm). Total ecosystem carbon, decomposition rates, and litterfall amounts all decreased nonlinearly with increasing latitude. Plant species richness in the ground flora also decreased with increasing latitude. However, the percent cover of lower canopy vegetation varied asystematically with respect to latitude, temperature, or precipitation. Our results are largely consistent with models and analyses indicating that northern latitude forests may respond to predicted climate changes with increased carbon sequestration. In the short term, however, these forests may be a source rather than a sink for atmospheric carbon as the relative distribution of C among ecosystem components adjusts in response to changing climatic conditions. |
| [31] | Carbon sequestration is important in studying global carbon cycle and budget. Here, we used the National Forest Resource Inventory data for China collected from 2004 to 2008 and forest biomass and soil carbon storage data obtained from direct field measurements to estimate carbon (C) sequestration rate and benefit keeping C out of the atmosphere in forest ecosystems and their spatial distributions. Between 2004 and 2008, forests sequestered on average 0.36 Pg C yr611 (1 Pg = 1015g), with 0.30 Pg C yr611 in vegetation and 0.06 Pg C yr611 in 0–1 meter soil. Under the different forest categories, total C sequestration rate ranged from 0.02 in bamboo forest to 0.11 Pg C yr611 in broadleaf forest. The southwest region had highest C sequestration rate, 30% of total C sequestration, followed by the northeast and south central regions. The C sequestration in the forest ecosystem could offset about 21% of the annual C emissions in China over the same period, especially in provinces of Tibet, Guangxi, and Yunnan, and the benefit was similar to most Annex I countries. These results show that forests play an important role in reducing the increase in atmospheric carbon dioxide in China, and forest C sequestration are closely related to forest area, tree species composition, and site conditions. |
| [32] | , |
| [33] | Forests of North America are thought to constitute a significant long-term sink for atmospheric carbon. The United States Forest Service Forest Inventory and Analysis (FIA) program has developed a large database of stock changes derived from consecutive estimates of growing stock volume in the U.S. These data reveal a large and relatively stable increase in forest carbon stocks over the last two decades or more. The mechanisms underlying this national increase in forest stocks may include recovery of forests from past disturbances, net increases in forest area, and growth enhancement driven by climate or fertilization by CO2 and Nitrogen. Here we estimate the forest recovery component of the observed stock changes using FIA data on the age structure of U.S. forests and carbon stocks as a |
| [34] | Quantifying forest biomass carbon (C) stock change is important for understanding forest dynamics and their feedbacks with climate change. Forests in the northeastern U.S. have been a net carbon sink in recent decades, but C accumulation in some northern hardwood forests has been halted due to the impact of emerging stresses such as invasive pests, land use change and climate change. The Delaware River Basin (DRB), sited in the southern edge of the northern hardwood forest, features diverse forest types and land-use histories. In 2001–2003, the DRB Monitoring and Research Initiative established 61 forest plots in three research sites, using Forest Service inventory protocols and enhanced measurements. These plots were revisited and re-measured in 2012–2014. By comparing forest biomass C stocks in the two measurements, our results suggest that the biomass C stock of the DRB forest increased, and was thus a carbon sink over the past decade. The net biomass C stock change in the Neversink area in the north of the DRB was 1.94MgCha611yr611, smaller than the biomass C change in the French Creek area (2.52MgCha611yr611, southern DRB), and Delaware Water Gap Area (2.68MgCha611yr611, central DRB). An increase of dead biomass C accounted for 20% of the total biomass C change. The change of biomass C stocks did not correlate with any climatic or topographic factors, but decreased with increasing stand age, and with tree mortality rate. Mortality rates were highest in the smallest size class. In most of the major tree species, stem density decreased, but the loss of biomass from mortality was offset by recruitment and growth. The demographic changes differ dramatically among species. The living biomass of chestnut oak, white oak and black oak decreased because of the large mortality rate, while white pine, American beech and sweet birch increased in both biomass and stem density. Our results suggest that forests in the DRB could continue to be a carbon sink in the coming decades, because they are likely at a middle successional stage. The linkage between demography of individual trees species and biomass C change underscores the effects of species-specific disturbances such as non-native insects and pathogens on forest dynamics, and highlights the need for forest managers to anticipate these effects in their management plans. |
| [35] | , 以科尔沁沙地樟子松人工林为研究对象,分别实地测定了造林10年、18年2、5年和30年樟 子松人工林树木生物量、枯落物生物量、草本生物量和根系生物量,并研究了各碳库碳储量动态变化特征。结果表明:樟子松各器官平均碳含量为48.12%;随 着林龄的增大,除了林下草本碳库碳储量减小外,樟子松地上部分碳库、枯落物碳库、根系碳库及土壤碳库碳储量均增加;在沙地上造林10年、18年2、5年和 30年樟子松林总碳库储量分别为43 663.65 kg/hm2、68 777.10 kg/hm21、07 746.50 kg/hm2和144 764.25 kg/hm2,随着林龄的增大樟子松林总碳库储量也呈现增加趋势。 |
| [36] | We compared soil moisture content, pH, total organic carbon ( C org ), total nitrogen (TN), total phosphorus (TP) and inorganic N (NH 4 + –N, NO 3 61 –N) concentrations, soil potential C and N mineralization rates, soil microbial biomass C ( C mic ), soil metabolic quotient ( q CO 2 ), soil microbial quotient ( C mic / C org ) and soil enzyme (urease and invertase) activities in semiarid sandy soils under three types of land cover: grassland, Mongolian pine ( Pinus sylvestris var. mongolica ) plantation, and elm ( Ulmus punila )–grass savanna in southeastern Keerqin, in northeast China. Soil C org , TN and TP concentrations (0–10, 10–20, 20–40 and 40–6002cm) were lower while soil C/N and C/P ratios were higher in the plantation than in grassland and savanna. The effects of land cover change on NH 4 + –N and NO 3 61 –N concentrations, soil potential nitrification and C mineralization rates in the surface soil (0–1002cm) were dependent on sampling season; but soil potential N mineralization rates were not affected by land cover type and sampling season. The effects of land cover change on C mic and q CO 2 of surface soil were not significant; but C mic / C org were significantly affected by land cover change and sampling season. We also found that land cover change, sampling season and land cover type65×65sampling season interaction significantly influenced soil enzyme (urease and invertase) activities. Usually soil enzyme activities were lower in the pine plantations than in grassland and savanna. Our results suggest that land cover change markedly influenced soil chemical and biological properties in sandy soils in the semiarid region, and these effects vary with sampling season. |
| [37] | , 林分在自然稀疏过程中,与密度相关的死亡是由林木大小的增加引起的。因此,很自然地要选择反映林木大小的指标,来表示林木株数与林木大小的关系。选取林分总断面积作为林大小的指标,建立了沙地樟子松人工林自然稀疏过程中林分密度与断面积的相关关系,旨在为沙地樟子松人工林的合理经营提供依据。对自然稀疏-3/2法则进行的评述,认为尽管没有充分证据表明斜率-3/2存在的精确性,但它可以作为一个理想的常数,并且考虑到各 |
| [38] | , 提出了人工林稳定性的内涵及其评价标准。分析了影响沙地樟子松人工林稳定性的各种干扰因子,通过对沙地樟子松人工林造林成活、生长情况、对不良外界环境的抗御能力、林分寿命、林分结构和生产力的综合评价分析,认为沙地樟子松引种人工林基本上是稳定的;而生长在立地较好的丘间低地的林分,其稳定性大于沙丘顶部的林分;从抗枯梢病角度看,幼林的抗性大于中林;从林分密度和生产力角度来看,红花尔基沙地樟子松林稳定性高于章古台 |
| [39] | , <p>对樟子松人工林群落结构和土壤水分动态进行研究。结果表明:13年林龄的樟子松人工林300cm深层的土壤水分已基本耗竭,而且整个生长季还在持续减少,土壤水分不能得到有效补给;林木生长衰弱,平均高仅3.59m ,平均胸径5.77cm ,并出现大量枯梢;林木生长已受到土壤水分亏缺的严重制约,林分开始衰败;林下草本层发育良好,盖度较高。研究指出,干旱半干旱地区人工林在不适宜的密度下造成群落结构与环境条件不相适应,存在着由乔木植被向草本植被演替的规律,对人工林群落的稳定性进行分析,指出通过密度控制、树种选择等措施可以进行调整,延缓土壤水分的耗竭速度,提高林分的稳定性。要建立稳定性更高和维持时间更长的人工林,从根本上改变草本植被代替乔木植被的规律,需要借鉴天然稀树草原植被的乔木密度,大幅度降低人工林的密度。在有地下水存在和植物可以利用的情况下,人工林的稳定性可以维持一个世代甚或更长。</p> |
| [40] | ( |
| [41] | . . 森林作为陆地生态系统中主要的植被类型在全球碳循环研究中有着 十分重要的作用,而森林资源清样调查资料以其系统性、科学性、连续 性等优点在森林生态系统碳循环研究中具有十分重要的地位。本研究以 中国主要森林植被类型为研究对象,基于中国森林资源清样调查资料 (FID),采用建立的生物气候生产力模型和反映林龄和蓄积量共同影响的 生产力回归模型分别估计了中国油松林和主要造林树种的生产力;利用 改进的材积源生物量法估算了中国主要森林植被类型的碳储量;并基于 多元线性回归方法和因子分析法探讨了林业用地以及气候因子对中国森 林植被碳储量的影响;同时,结合生物地球化学循环模型CENTURY模型 评估了中国森林生态系统的碳收支。主要研究结果如下: 1建立了中国油松林生物气候生产力模型NPPa=[0. 3 31 n(V/A)+0. 18] × 3000(1-e-0. 0009695E), 根据油松林的森林资源清样调查资料和气候资料估 算的中国油松林生产力平均为7. 82 Mg·ha-1·yr-1,其变化幅度为3. 32~ 11. 87 Mg·ha-1·yr-1,其分布表现为南高北低的趋势。生产力较高的区域 主要分布在东部和南部(四川、湖北、河南、辽宁等省),均大于7. 7 Mg.ha-1·yr-1;生产力较低的区域主要分布在北部和西部较为干旱的区域 (内蒙古),NPP均低于5. 5 Mg·ha-1·yr-1;油松林集中分布区(陕西、 山西)生产力处于中等水平,在5. 5~7. 7 Mg·ha-1·yr-1之间。 2 基于森林资源清样调查资料评估了中国五种主要造林树种(落叶松 Larix,油松 Pinus tabulaeformiS,马尾松 Pinus massoniana,杉木 Cunninghamia lanceolata,杨树 Populus)的生产力,分别为8. 43、 5. 75、 4. 42、 4. 41、 7. 33 Mg·ha-1·yr-1,低于世界平均生产力水平,主 要原因可能是这五种造林树种大都处于未成熟阶段,表明中国造林树种 在提高中国森林生态系统的固碳能力方面有很大的潜力。 3基于两次(第三次和第四次)森林资源清查资料和改进的材积源生物 量法评估了中国森林的碳储量,分别为3. 48和3. 78 Pg C(1 Pg=1015 g)。 基于多元线性回归模型探讨了林业用地变化对森林植被碳储量的影 响。分析表明:在森林平均林龄减小的情况下,森林植被碳储量有增加 的趋势;而森林碳储量随森林面积的增加而增加。当平均林龄增加10 年,全国森林面积增加lx10场a时,全国森林植被的碳储量将增加 54.51Tg(1 Tg=10‘29),表明我国森林植被碳储量取决于自然和人为因素 共同作用。 采用因子分析方法探讨了气候变化对森林植被碳储量的影响,分析表 明:气温是森林植被碳储量的主要限制因子。当气温升高时,森林植被 碳储量有降低的趋势;降水与森林植被碳储量呈正相关,随降水的增加 森林植被碳储量增加。在年均温升高4℃,年降水量增加10%;年均温升 高4℃,年降水量不变;年均温升高4℃,年降水量减少10%三种气候变 化情景下,我国森林植被碳储量的增加量分别为:9,19 Tg、6.67 Tg和 4 .1 STg。 4基于生物地球化学循环模型模拟的中国森林生态系统的碳收支为 0.17Pgc,中国森林表现为一个巨大的碳汇。其中,西南地区森林碳收 支占44%,华东及西北地区的森林碳收支总和不足140/0。 关键词:森林资源清样调查资料;生产力模型;材积源生物量法;多 元线性回归模型;碳储量;碳收支:CENTURY模型 |
| [42] | |
| [43] |
1
2016
... 影响樟子松林固碳能力的因素比较复杂.气候条件是影响樟子松固碳能力的重要因素,
尖峰岭热带山地雨林生物量及碳库动态.
1
2010
... 不同径级的林木固碳能力有差异.本研究中, 中等径级(10-20 cm)的林木株数约占总体的50%, 但碳储量增加量占总体碳储量增量的87%, 中等、较大径级林木生物量较高、固碳能力较强, 是林分生物量、碳储量的主要载体.该结果与我国尖峰岭地区、美国东北部地区关于森林生长的研究结论一致(
Mortality and tree-size distributions in natural mixed-age forests.
1
2007
... 胸径与树木生长、死亡特征密切相关(
1
2002
... 我们选取河北塞罕坝机械林场樟子松人工林进行研究.该区域地处我国森林草原交错区、半 湿润半干旱季风气候区, 也是20世纪六七十年代大 面积樟子松造林的主要地区, 目前有林地面积7.5万hm2, 樟子松人工林约1.3万hm2 (
Effect of irrigation on needle morphology, shoot and stem growth in a drought-exposed Pinus sylvestris forest.
1
2010
... 影响樟子松林固碳能力的因素比较复杂.气候条件是影响樟子松固碳能力的重要因素,
Fast response of Scots pine to improved water availability reflected in tree-ring width and delta 13C.
1
2010
... 影响樟子松林固碳能力的因素比较复杂.气候条件是影响樟子松固碳能力的重要因素,
Changes in forest biomass carbon storage in China between 1949 and 1998.
1
2001
... 我国是世界上人工林面积最大的国家, 人工林面积达6 200万hm2, 约占我国森林总面积的31.8%① ( ① State Forestry Administration of the People’s Republic of China (2010). The 7th National forest inventory and status of forest resources, 1, 3-10. (in Chinese) [国家林业局 (2010). 第七次全国森林资源清查, 1, 3-10.]).自20世纪70年代以来, 我国森林碳储量的增加主要源自人工林面积的增加, 人工林碳储量约占森林碳储量的47.8% (
Carbon stocks in temperate forests of south-eastern Australia reflect large tree distribution and edaphic conditions.
1
2014
... 不同径级的林木固碳能力有差异.本研究中, 中等径级(10-20 cm)的林木株数约占总体的50%, 但碳储量增加量占总体碳储量增量的87%, 中等、较大径级林木生物量较高、固碳能力较强, 是林分生物量、碳储量的主要载体.该结果与我国尖峰岭地区、美国东北部地区关于森林生长的研究结论一致(
毛乌素沙地引种樟子松生长特性的研究
1
2004
... 目前, 关于樟子松人工林生长、固碳等方面的研究已取得不少成果.20世纪后期, 主要是针对樟子松引种技术的研究(
Spatio-temporal changes in biomass carbon sinks in China’s forests from 1977 to 2008.
1
2013
... 我国是世界上人工林面积最大的国家, 人工林面积达6 200万hm2, 约占我国森林总面积的31.8%① ( ① State Forestry Administration of the People’s Republic of China (2010). The 7th National forest inventory and status of forest resources, 1, 3-10. (in Chinese) [国家林业局 (2010). 第七次全国森林资源清查, 1, 3-10.]).自20世纪70年代以来, 我国森林碳储量的增加主要源自人工林面积的增加, 人工林碳储量约占森林碳储量的47.8% (
沙地樟子松人工林碳库动态及其分配特征
1
2015
... 目前, 关于樟子松人工林生长、固碳等方面的研究已取得不少成果.20世纪后期, 主要是针对樟子松引种技术的研究(
小兴安岭7种典型林型林分生物量碳密度与固碳能力
1
2015
... 目前, 关于樟子松人工林生长、固碳等方面的研究已取得不少成果.20世纪后期, 主要是针对樟子松引种技术的研究(
基于相容性生物量模型的樟子松林碳密度与碳储量研究
1
2012
... 目前, 关于樟子松人工林生长、固碳等方面的研究已取得不少成果.20世纪后期, 主要是针对樟子松引种技术的研究(
沙地樟子松林单木生长的研究
2
1996
... 我国是世界上人工林面积最大的国家, 人工林面积达6 200万hm2, 约占我国森林总面积的31.8%① ( ① State Forestry Administration of the People’s Republic of China (2010). The 7th National forest inventory and status of forest resources, 1, 3-10. (in Chinese) [国家林业局 (2010). 第七次全国森林资源清查, 1, 3-10.]).自20世纪70年代以来, 我国森林碳储量的增加主要源自人工林面积的增加, 人工林碳储量约占森林碳储量的47.8% (
... 樟子松人工中龄林在不同引种区的生长存在差异, 这主要与所在区域的气候条件有关(
根系处理及包装方法对樟子松苗木造林效果的影响
1
1993
... 目前, 关于樟子松人工林生长、固碳等方面的研究已取得不少成果.20世纪后期, 主要是针对樟子松引种技术的研究(
Estimating the age-dependent changes in carbon stocks of Scots pine (Pinus sylvestris L.) stands in Turkey.
1
2016
... 影响樟子松林固碳能力的因素比较复杂.气候条件是影响樟子松固碳能力的重要因素,
辽宁省人工林樟子松径向生长对水热梯度变化的响应
1
2015
... 目前, 关于樟子松人工林生长、固碳等方面的研究已取得不少成果.20世纪后期, 主要是针对樟子松引种技术的研究(
中国主要人工林碳储量与固碳能力
1
2016
... 我国是世界上人工林面积最大的国家, 人工林面积达6 200万hm2, 约占我国森林总面积的31.8%① ( ① State Forestry Administration of the People’s Republic of China (2010). The 7th National forest inventory and status of forest resources, 1, 3-10. (in Chinese) [国家林业局 (2010). 第七次全国森林资源清查, 1, 3-10.]).自20世纪70年代以来, 我国森林碳储量的增加主要源自人工林面积的增加, 人工林碳储量约占森林碳储量的47.8% (
乌兰布和沙漠绿洲樟子松(Pinus sylvestris var. mongolica)生长规律初探
1
2015
... 目前, 关于樟子松人工林生长、固碳等方面的研究已取得不少成果.20世纪后期, 主要是针对樟子松引种技术的研究(
多伦县樟子松人工林生物量及碳储量研究
1
2013
... 樟子松人工中龄林在不同引种区的生长存在差异, 这主要与所在区域的气候条件有关(
科尔沁沙地樟子松(Pinus sylvestris var. mongolica)生长对降水和温度的响应
1
2016
... 目前, 关于樟子松人工林生长、固碳等方面的研究已取得不少成果.20世纪后期, 主要是针对樟子松引种技术的研究(
Influence of drought on tree rings and tracheid features of Pinus nigra and Pinus sylvestris in a mesic Mediterranean forest.
2013
Comparing the intra-annual wood formation of three European species (Fagus sylvatica, Quercus petraea and Pinus sylvestris) as related to leaf phenology and non-structural carbohydrate dynamics.
1
2012
... 影响樟子松林固碳能力的因素比较复杂.气候条件是影响樟子松固碳能力的重要因素,
Testing metabolic ecology theory for allometric scaling of tree size, growth and mortality in tropical forests.
1
2006
... 胸径与树木生长、死亡特征密切相关(
Thirty-two years of change in an old-growth Ohio beech-maple forest.
1
2013
... 胸径与树木生长、死亡特征密切相关(
Water utilization of Pinus sylvestris var. mongolica in a sparse wood grassland in the semiarid sandy region of Northeast China.
1
2014
... 目前, 关于樟子松人工林生长、固碳等方面的研究已取得不少成果.20世纪后期, 主要是针对樟子松引种技术的研究(
Water use patterns of Pinus sylvestris var. mongolica trees of different ages in a semiarid sandy lands of Northeast China.
2
2016
... 我国是世界上人工林面积最大的国家, 人工林面积达6 200万hm2, 约占我国森林总面积的31.8%① ( ① State Forestry Administration of the People’s Republic of China (2010). The 7th National forest inventory and status of forest resources, 1, 3-10. (in Chinese) [国家林业局 (2010). 第七次全国森林资源清查, 1, 3-10.]).自20世纪70年代以来, 我国森林碳储量的增加主要源自人工林面积的增加, 人工林碳储量约占森林碳储量的47.8% (
... 樟子松人工中龄林在不同引种区的生长存在差异, 这主要与所在区域的气候条件有关(
Comparison of intrinsic water use efficiency between different aged Pinus sylvestris var. mongolica wide windbreaks in semiarid sandy land of northern China.
1
2015
... 目前, 关于樟子松人工林生长、固碳等方面的研究已取得不少成果.20世纪后期, 主要是针对樟子松引种技术的研究(
Rate of tree carbon accumulation increases continuously with tree size.
1
2014
... 胸径与树木生长、死亡特征密切相关(
Carbon pools and ecosystem properties along a latitudinal gradient in northern Scots pine (Pinus sylvestris) forests.
2
2000
... 2006年和2016年研究区域樟子松人工中龄林的碳储量分别是59.04和109.64 Mg?hm-2, 高于其他地区的类似研究结果.胡海清等(2015)的研究显示东北地区樟子松中龄林碳密度为52.0 Mg?hm-2; 袁立敏等(2011)研究发现科尔沁沙地樟子松人工中龄林乔木层碳储量为57.8 Mg?hm-2; 韩美娜等(2015)研究的辽宁地区樟子松人工中龄林植被碳密度为33.83 Mg?hm-2.但该结果与中欧地区樟子松林的碳储量相近, 该生态系统碳储量为79-187 Mg?hm-2, 其中乔木层碳储量占比小于50% (
... 影响樟子松林固碳能力的因素比较复杂.气候条件是影响樟子松固碳能力的重要因素,
Forest carbon sequestration in China and its benefits.
1
2014
... 我国是世界上人工林面积最大的国家, 人工林面积达6 200万hm2, 约占我国森林总面积的31.8%① ( ① State Forestry Administration of the People’s Republic of China (2010). The 7th National forest inventory and status of forest resources, 1, 3-10. (in Chinese) [国家林业局 (2010). 第七次全国森林资源清查, 1, 3-10.]).自20世纪70年代以来, 我国森林碳储量的增加主要源自人工林面积的增加, 人工林碳储量约占森林碳储量的47.8% (
长白落叶松人工林乔木层生物量分布特征及其固碳能力研究
1
2014
... 影响樟子松林固碳能力的因素比较复杂.气候条件是影响樟子松固碳能力的重要因素,
Carbon consequences of forest disturbance and recovery across the conterminous United States.
2012
Decadal change of forest biomass carbon stocks and tree demography in the Delaware River Basin.
2
2016
... 胸径与树木生长、死亡特征密切相关(
... 不同径级的林木固碳能力有差异.本研究中, 中等径级(10-20 cm)的林木株数约占总体的50%, 但碳储量增加量占总体碳储量增量的87%, 中等、较大径级林木生物量较高、固碳能力较强, 是林分生物量、碳储量的主要载体.该结果与我国尖峰岭地区、美国东北部地区关于森林生长的研究结论一致(
沙地樟子松人工林碳储量研究
2011
Land cover change effects on soil chemical and biological properties after planting Mongolian pine (Pinus sylvestris var. mongolica) in sandy lands in Keerqin, northeastern China.
2000
沙地樟子松人工林自然稀疏规律
2
2000
... 目前, 关于樟子松人工林生长、固碳等方面的研究已取得不少成果.20世纪后期, 主要是针对樟子松引种技术的研究(
... 2006年和2016年研究区域樟子松人工中龄林的碳储量分别是59.04和109.64 Mg?hm-2, 高于其他地区的类似研究结果.胡海清等(2015)的研究显示东北地区樟子松中龄林碳密度为52.0 Mg?hm-2; 袁立敏等(2011)研究发现科尔沁沙地樟子松人工中龄林乔木层碳储量为57.8 Mg?hm-2; 韩美娜等(2015)研究的辽宁地区樟子松人工中龄林植被碳密度为33.83 Mg?hm-2.但该结果与中欧地区樟子松林的碳储量相近, 该生态系统碳储量为79-187 Mg?hm-2, 其中乔木层碳储量占比小于50% (
樟子松人工固沙林稳定性的研究
3
1996
... 我国是世界上人工林面积最大的国家, 人工林面积达6 200万hm2, 约占我国森林总面积的31.8%① ( ① State Forestry Administration of the People’s Republic of China (2010). The 7th National forest inventory and status of forest resources, 1, 3-10. (in Chinese) [国家林业局 (2010). 第七次全国森林资源清查, 1, 3-10.]).自20世纪70年代以来, 我国森林碳储量的增加主要源自人工林面积的增加, 人工林碳储量约占森林碳储量的47.8% (
... 目前, 关于樟子松人工林生长、固碳等方面的研究已取得不少成果.20世纪后期, 主要是针对樟子松引种技术的研究(
... 樟子松人工中龄林在不同引种区的生长存在差异, 这主要与所在区域的气候条件有关(
科尔沁沙地樟子松人工林土壤水分动态的研究
1
2005
... 我国是世界上人工林面积最大的国家, 人工林面积达6 200万hm2, 约占我国森林总面积的31.8%① ( ① State Forestry Administration of the People’s Republic of China (2010). The 7th National forest inventory and status of forest resources, 1, 3-10. (in Chinese) [国家林业局 (2010). 第七次全国森林资源清查, 1, 3-10.]).自20世纪70年代以来, 我国森林碳储量的增加主要源自人工林面积的增加, 人工林碳储量约占森林碳储量的47.8% (
沙地樟子松人工林的生长与成熟. 防护林科技,
1
2016
... 不同径级的林木固碳能力有差异.本研究中, 中等径级(10-20 cm)的林木株数约占总体的50%, 但碳储量增加量占总体碳储量增量的87%, 中等、较大径级林木生物量较高、固碳能力较强, 是林分生物量、碳储量的主要载体.该结果与我国尖峰岭地区、美国东北部地区关于森林生长的研究结论一致(
中国主要森林生态系统碳储量和碳收支评估
1
2004
... 2006年和2016年研究区域樟子松人工中龄林的碳储量分别是59.04和109.64 Mg?hm-2, 高于其他地区的类似研究结果.胡海清等(2015)的研究显示东北地区樟子松中龄林碳密度为52.0 Mg?hm-2; 袁立敏等(2011)研究发现科尔沁沙地樟子松人工中龄林乔木层碳储量为57.8 Mg?hm-2; 韩美娜等(2015)研究的辽宁地区樟子松人工中龄林植被碳密度为33.83 Mg?hm-2.但该结果与中欧地区樟子松林的碳储量相近, 该生态系统碳储量为79-187 Mg?hm-2, 其中乔木层碳储量占比小于50% (
Comparison of stand structure and growth between artificial and natural forests of Pinus sylvestiris var. mongolica on sandy land.
2
2003
... 目前, 关于樟子松人工林生长、固碳等方面的研究已取得不少成果.20世纪后期, 主要是针对樟子松引种技术的研究(
... 樟子松人工中龄林在不同引种区的生长存在差异, 这主要与所在区域的气候条件有关(
The role of ectomycorrhizal fungi in alleviating pine decline in semiarid sandy soil of northern China: An experimental approach.
1
2008
... 樟子松人工中龄林在不同引种区的生长存在差异, 这主要与所在区域的气候条件有关(

