HTML
--> --> -->| Database profile | |
| Database title | CAS FGOALS-f3-L Large-ensemble Simulations for the CMIP6 Polar Amplification Model Intercomparison Project |
| Time range | 1 Apr 2000 to 30 Jun 2001 |
| Geographical scope | Global |
| Data format | The Network Common Data Form (NetCDF) version 4 |
| Data volume | pdSST-pdSIC: 1.9 TB |
| piSST-piSIC: 1.9 TB | |
| piSST-pdSIC: 1.9 TB | |
| pdSST-piArcSIC: 1.9 TB | |
| pdSST-futArcSIC: 1.9 TB | |
| pdSST-piAntSIC: 1.9 TB | |
| futSST-pdSIC: 1.9 TB | |
| (to be continued) | |
| (Continued) | |
| Database profile | |
| pdSST-futAntSIC: 1.9 TB | |
| Data service system | pdSST-pdSIC: http://doi.org/10.22033/ESGF/CMIP6.11516 |
| piSST-piSIC: http://doi.org/10.22033/ESGF/CMIP6.11521 | |
| piSST-pdSIC: http://doi.org/10.22033/ESGF/CMIP6.11520 | |
| pdSST-piArcSIC: http://doi.org/10.22033/ESGF/CMIP6.11519 | |
| pdSST-futArcSIC: http://doi.org/10.22033/ESGF/CMIP6.11512 | |
| pdSST-piAntSIC: http://doi.org/10.22033/ESGF/CMIP6.11518 | |
| futSST-pdSIC: http://doi.org/10.22033/ESGF/CMIP6.11500 | |
| pdSST-futAntSIC: http://doi.org/10.22033/ESGF/CMIP6.11511 | |
| Sources of funding | Strategic Priority Research Program of the Chinese Academy of Sciences (Grant No. XDA19070404). National Natural Science Foundation of China (Grant Nos. 42030602, 91837101 and 91937302 |
| Database composition | The shared database contains 8 groups of data. Each group contains 100 ensemble members. Each member contains 3 kinds of output depending on the time frequency, including 3hr, day, Amon. The variable numbers are 17,24,41 for 3hr, day, Amon, respectively |
The cause and effect of polar amplification has attracted much scientific attention but still remains debated. The surface albedo feedback is recognized as the most popular mechanism for the cause (Manabe and Stouffer, 1994; Curry et al., 1995; Holland and Bitz, 2003; Hall, 2004; Screen and Simmonds, 2010; Serreze and Barry, 2011; Screen et al., 2012; Taylor et al., 2013; Stuecker et al., 2018; Dai et al., 2019). However, some studies have argued that lapse rate, water vapor, and cloud feedback are also important (Manabe and Wetherald, 1975; Hall, 2004; Graversen and Wang, 2009; Lu and Cai, 2009; Bintanja et al., 2012; Pithan and Mauritsen, 2014; Goosse et al., 2018; Gao et al., 2019). The influence of polar amplification has been found to be closely connected with weather and climate in the Northern Hemisphere (Cohen et al., 2014; Gramling, 2015; Overland et al., 2015; Shepherd, 2016; Screen, 2017; Sévellec et al., 2017; Zhang et al., 2018), especially with the recently observed Warm Arctic-Cold Continents pattern (Mori et al., 2014; Xie et al., 2020) and changes in the Arctic Oscillation (AO) and North Atlantic Oscillation (NAO) (Magnusdottir et al., 2004; Seierstad and Bader, 2009; Cassano et al., 2014; Screen et al., 2014).
Although extensive studies have investigated different aspects of the effects of polar amplification, the understanding of this phenomenon remains somewhat uncertain, which attributes to the different climate model behaviors in response to identical external forcing (Serreze and Francis, 2006; Shepherd, 2016; Screen et al., 2018). To reduce these uncertainties and improve our understanding on polar amplification, Smith et al. (2019) coordinated the Polar Amplification Model Intercomparison Project (PAMIP) as one of the endorsed MIPs during the six phases of the Coupled Model Intercomparison Project (CMIP6) (Eyring et al., 2016). The PAMIP requires each participating model group to conduct a large-ensemble simulation with at least 100 ensemble members for each experiment to obtain statistically robust results since models typically simulate a small atmospheric response to sea ice relative to the internal variability (Screen et al., 2014; Mori et al., 2019). By the end of December 2020, there are 10 modeling groups who have published 19 types of PAMIP experiments on the Earth System Grid Federation (ESGF) website. These experiments provide a solid basis for the study of contributions by local SIC and remote SST to polar amplification and the response to SIC. Preliminary multi-model analysis (Smith et al., 2021①) reveals a robust equatorward shift of the tropospheric jet in response to future Arctic sea ice loss, while the stratospheric response could amplify the surface response. Sun et al. (2020) emphasized that the seasonal cycle of ice loss could slow the thermohaline circulation in the Atlantic Ocean based on an air-sea coupled simulation.
Since November 2019, the modeling group of CAS FGOALS-f3-L [a low-resolution version of the Chinese Academy of Sciences (CAS) Flexible Global Ocean-Atmosphere-Land System Model, finite-volume version 3] has carried out and published datasets for eight groups of atmosphere-only time-slice experiments for PAMIP. These experiments will complement the large-ensemble simulations of PAMIP to facilitate the understanding of the mechanisms of polar amplification and to reduce the uncertainties in projections of future polar climate change and the associated impacts. The main goal of this paper is to provide a description of the PAMIP experiments produced by CAS FGOALS-f3-L and the relevant essential model configurations and experimental methods for a variety of users. Furthermore, an overview of the model responses of global SAT and precipitation is also documented in a broad sense. The paper is organized as follows: Section 2 presents a description of the model and experimental design. Section 3 addresses the large-ensemble simulations of SAT and precipitation for all experiments. Section 4 provides the final conclusions and discussion.
2.1. Introduction to the Model
CAS FGOALS-f3-L is a climate system model developed at the State Key Laboratory of Numerical Modeling for Atmospheric Sciences and Geophysical Fluid Dynamics (LASG), Institute of Atmospheric Physics (IAP). The model contains five components including an atmospheric model, a land model, an oceanic model, a sea ice model, and a coupler. Detailed descriptions of each component and basic performances for the CMIP6 DECK and historical experiments are documented in He et al. (2020) and Guo et al. (2020). Because the atmosphere-only time-slice experiments in PAMIP were performed by the model group, in which the atmospheric and land models are active, the basic configurations of the atmospheric and land component are briefly introduced in this section.The atmospheric component is version 2.2 of the Finite-volume Atmospheric Model (FAMIL) (Zhou et al., 2015; Bao et al., 2018; He et al., 2019; Li et al., 2019). The finite-volume dynamical core (Lin, 2004) on a cubed-sphere grid (Putman and Lin, 2007) is applied in FAMIL. The horizontal resolution is approximately equal to 1° × 1° after remapping from the native grids. The vertical hybrid coordinate is 32 layers with the model top at 2.16 hPa. The model physics scheme mainly includes a moisture turbulence boundary layer scheme (Bretherton and Park, 2009) with updated shallow convection (Wang and Zhang, 2014), a single-moment six-category cloud microphysics scheme (Lin et al., 1983, Harris and Lin, 2014), the Xu and Randall (1996) cloud macrophysics scheme, a resolving convective precipitation parameterization (Bao and Li, 2020), and the radiation scheme of the Rapid Radiative Transfer Model for GCMs (RRTMG) (Clough et al., 2005). The version 4.0 of the Community Land Model (CLM4) (Oleson et al., 2010) is applied in the model. The land model applies the same horizontal resolution as in the atmospheric model. The CLM4 model describes surface land heterogeneity and consists of submodels such as a lake model, a river transport model, an urban model, etc. The default configurations of model physics are used in our experiments.
2
2.2. Experimental design
Atmosphere-only time-slice experiments from No. 1.1 to 1.8 (Table 1 in Smith et al., 2019) in PAMIP were carried out based on CAS FGOALS-f3-L (Table 1). These experiments use different combinations of SST and SIC representing present-day (pd), pre-industrial (pi), and future (fut, representing 2-degree warming) conditions. The present-day SST (pdSST) and SIC (pdSIC) were acquired from the 1979–2008 mean Hadley Centre Ice and Sea Surface Temperature dataset (HadISST, Rayner et al., 2003). The pre-industrial SST (piSST) and SIC (piSIC) were obtained from an ensemble of 31 historical CMIP5 model outputs, but by removing an estimated global warming index (Haustein et al., 2017) for the period of 1979–2008. The future SST (futSST) and SIC (futSIC) were obtained from an ensemble of 31 RCP8.5 simulations from CMIP5 model simulations, but additional constraints were adopted to reduce the large model spread and unrealistically diffuse ice edge. All the prescribed SST and SIC fields are monthly climatologies. More detailed information on the forcing data is provided in Appendix A of Smith et al. (2019).| No. | Experiment_id | Variant label | Integration period | SST & SIC forcings | DOIs |
| 1.1 | pdSST-pdSIC | r1i1p1f1 to r100i1p1f1. The realization index denotes the different initial fields, as shown in Fig. 1. The initial fields with the same realization index values are exactly the same for all the experiment_id. | 1 April 2000 to 30 June 2001. The first two months represent the spin-up time, as recommended in Smith et al. (2018). We submitted all the integration periods in case the users are interested in studying the spin-up process. | Present-day SST and present-day SIC | http://doi.org/10.22033/ESGF/CMIP6.11516 |
| 1.2 | piSST-piSIC | Preindustrial SST and pre-industrial SIC | http://doi.org/10.22033/ESGF/CMIP6.11521 | ||
| 1.3 | piSST-pdSIC | Preindustrial SST and present-day SIC | http://doi.org/10.22033/ESGF/CMIP6.11520 | ||
| 1.4 | futSST-pdSIC | Future SST and present-day SIC | http://doi.org/10.22033/ESGF/CMIP6.11500 | ||
| 1.5 | pdSST-piArcSIC | Present-day SST and pre-industrial Arctic SIC | http://doi.org/10.22033/ESGF/CMIP6.11519 | ||
| 1.6 | pdSST-futArcSIC | Present-day SST and future Arctic SIC | http://doi.org/10.22033/ESGF/CMIP6.11512 | ||
| 1.7 | pdSST-piAntSIC | Present-day SST and pre-industrial Antarctic SIC | http://doi.org/10.22033/ESGF/CMIP6.11518 | ||
| 1.8 | pdSST-futAntSIC | Present-day SST and future Antarctic SIC | http://doi.org/10.22033/ESGF/CMIP6.11511 |
Table1. Experimental designs of the CAS FGOALS-f3-L large-ensemble simulations for PAMIP. All atmospheric radiative forcings are prescribed as their values in 2000.
Eight experimental groups were constructed representing the different combinations of SST and SIC forcing and can be identified according to their experiment_id label (Table 1). The No.1.1 experimental group, pdSST-pdSIC, is regarded as the reference run, which was forced by present-day SST and present-day SIC. The No.1.2 experimental group, piSST-piSIC, was forced by pre-industrial SST and SIC. The difference between No.1.1 and No.1.2 can be used to identify the total effect of historical SST and SIC change on the climate. The No.1.3 experimental group, piSST-pdSIC, was forced by pre-industrial SST and present-day SIC. The difference between No.1.1 and No.1.3 can be used to understand the effects of historical changes in SST on the climate. The No.1.4 experimental group, futSST-pdSIC, was forced by future SST and present-day SIC. The difference between No.1.1 and No.1.4 estimates the possible climatic response to future changes in SST. The No.1.5 experimental group, pdSST-piArcSIC, was forced by present-day SST and pre-industrial Arctic SIC. The difference between No.1.1 and No.1.5 indicates the possible climatic response to historical changes in Arctic SIC. The No.1.6 experimental group, pdSST-futArcSIC, was forced by present-day SST and future Arctic SIC. The difference between No.1.1 and No.1.6 estimates the possible influence of future Arctic SIC changes on the climate. The No.1.7 experimental group, pdSST-piAntSIC, and the No.1.8 experimental group, pdSST-futAntSIC, are similar to the No.1.5 and 1.6 groups, respectively, but were forced by the changes of Antarctic SIC for pre-industrial and future conditions, respectively.
The technological roadmap for the CAS FGOALS-f3-L large-ensemble simulations is shown in Fig. 1. Following the requirement of the PAMIP design (Table 1 in Smith et al., 2019), the radiative forcings in the atmosphere-only time-slice experiments are all prescribed as their values in 2000 (Table 1), including the greenhouse gases, solar irradiance, ozone, and aerosols in CAS FGOALS-f3-L. To provide an equilibrium state for the atmosphere and land model and the initial field for the large-ensemble simulation, we set up a control run for the spin-up process. The control run is an AMIP simulation with all the same prescribed external forcings as in pdSST-pdSIC. This experiment runs for 1 January 1990 to 1 April 2000 and provides 100 restart files every 6 hours from 7 March to 1 April 2000 for the initial field of the large-ensemble simulation as output. A total of eight groups of large-ensemble simulations are carried out, as shown in Table 1, from No.1.1 to No.1.8. Each group contains 100 simulations with a variant label of r1i1p1f1 to r100i1p1f1. For all the experiments, the initial fields are the same if the realization indexes are identical. Each member integrates from 1 April 2000 to 30 June 2001 for 14 months. The analysis for the equilibrium state could be adopted from 1 June 2000. In case potential users are interested in the spin-up process of the CAS FGOALS-f3-L model results, we submitted and published all the integration periods on the ESG node of IAP.
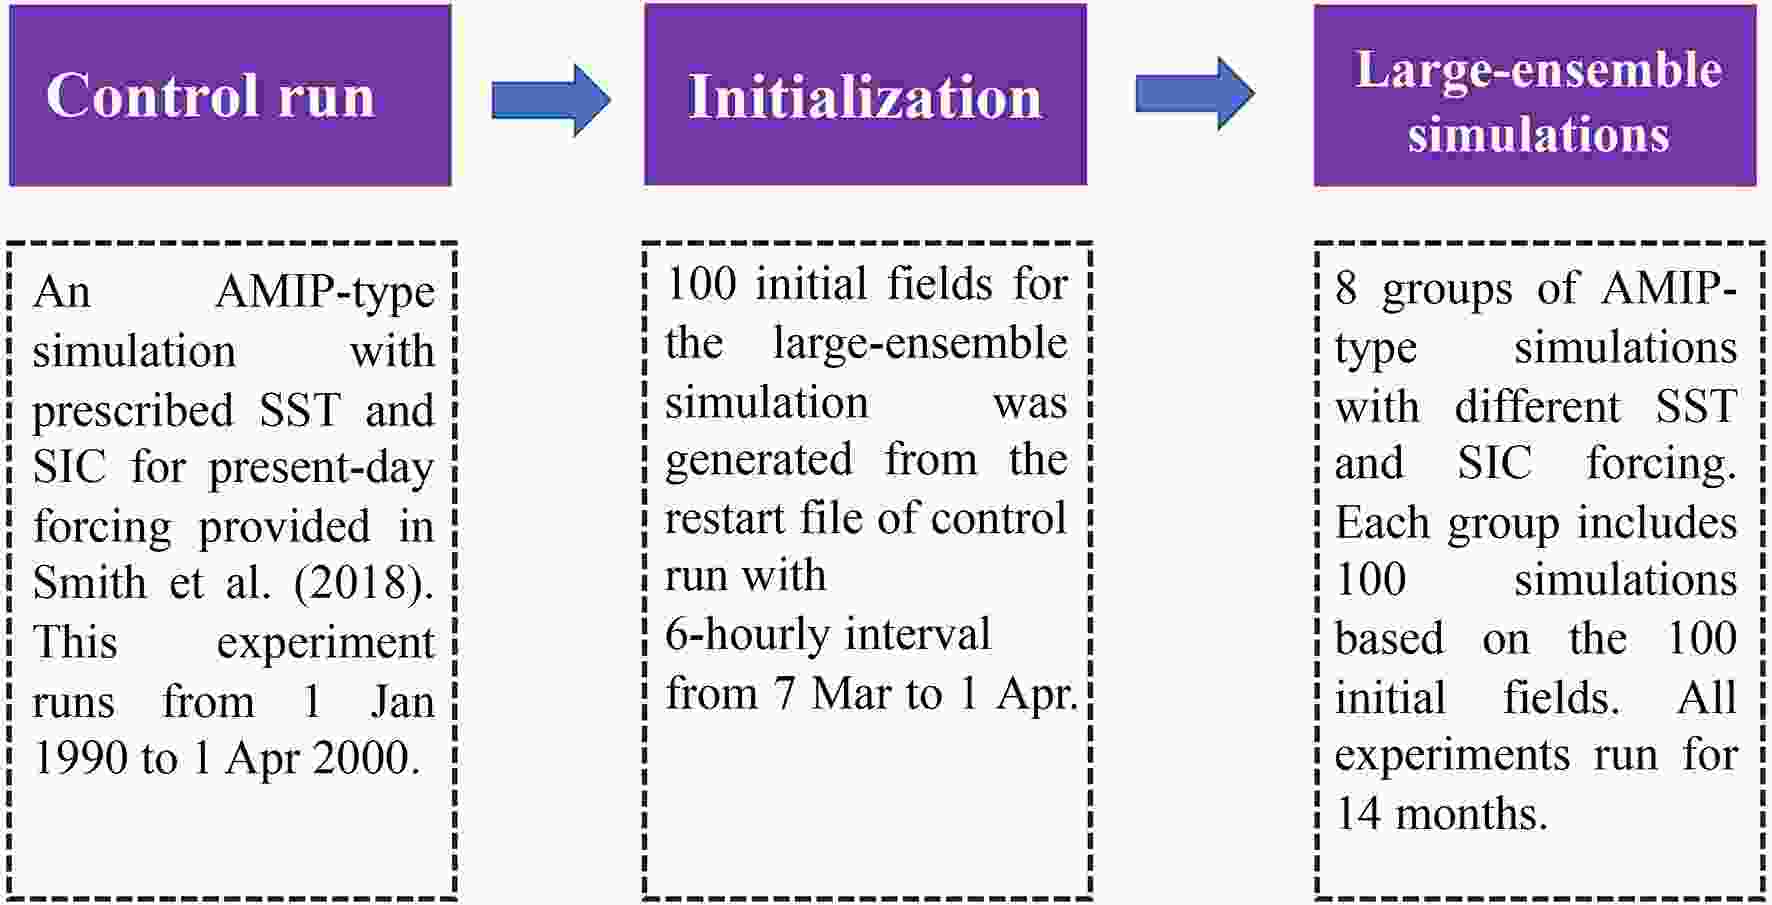 Figure1. Technological roadmap for the CAS FGOALS-f3-L large-ensemble simulations and external forcings.
The imposed external forcings in CAS FGOALS-f3-L for the present day, pre-industrial period, and future are examined in this paragraph, and the calculation of the changes in SST and SIC forcing between the present day and the pre-industrial period and between the future and the present day is also documented to understand the model responses. Figure 2a shows the annual mean spatial pattern of pdSST prescribed in the experiments of pdSST-pdSIC, pdSST-piArcSIC, pdSST-futArcSIC, pdSST-piAntSIC, and pdSST-futAntSIC. As the SST forcing was obtained from the 1979–2008 mean of HadISST, the large-scale pattern of pdSST mainly shows increased temperatures in the tropics (e.g., the 28°C isotherm mainly encloses the mid-eastern Indian Ocean and tropical western Pacific) and colder temperatures at high latitudes, with a uniform trend of ?1.8°C over the sea-ice regions. The global mean pdSST is approximately 18.19°C. The spatial pattern of piSST is similar to that of pdSST. We show the difference between pdSST and piSST in Fig. 2b. The difference shows an overall warming pattern, with a global mean value of 0.78°C. The warming reaches 1.2°C over the north Pacific and north Atlantic and exceeds 1.8°C over the Barents Sea. The difference between the future and present SST is shown in Fig. 2c. The global mean warming is approximately 1.06°C, which is higher than the difference between the present day and the pre-industrial period (Fig. 2b). This warming is strongest in the Northern Hemisphere, especially close to the Bering Sea, Barents Sea, and northern Atlantic.
 Figure2. Spatial distribution of annual mean SST (°C) forcings for (a) present-day SST (pdSST) and (b) the difference between pdSST and pre-industrial SST (piSST) and (c) between future SST (futSST) and pdSST.
The global mean annual cycle of the three kinds of SST forcing is shown in Fig. 3. All the SST forcings show semiannual variation, with maxima in March and August and minima in June and November associated with the seasonal variations in SST. The future SST is almost 1.8°C warmer while the present day SST is 0.8°C warmer than the pre-industrial SST in all months.
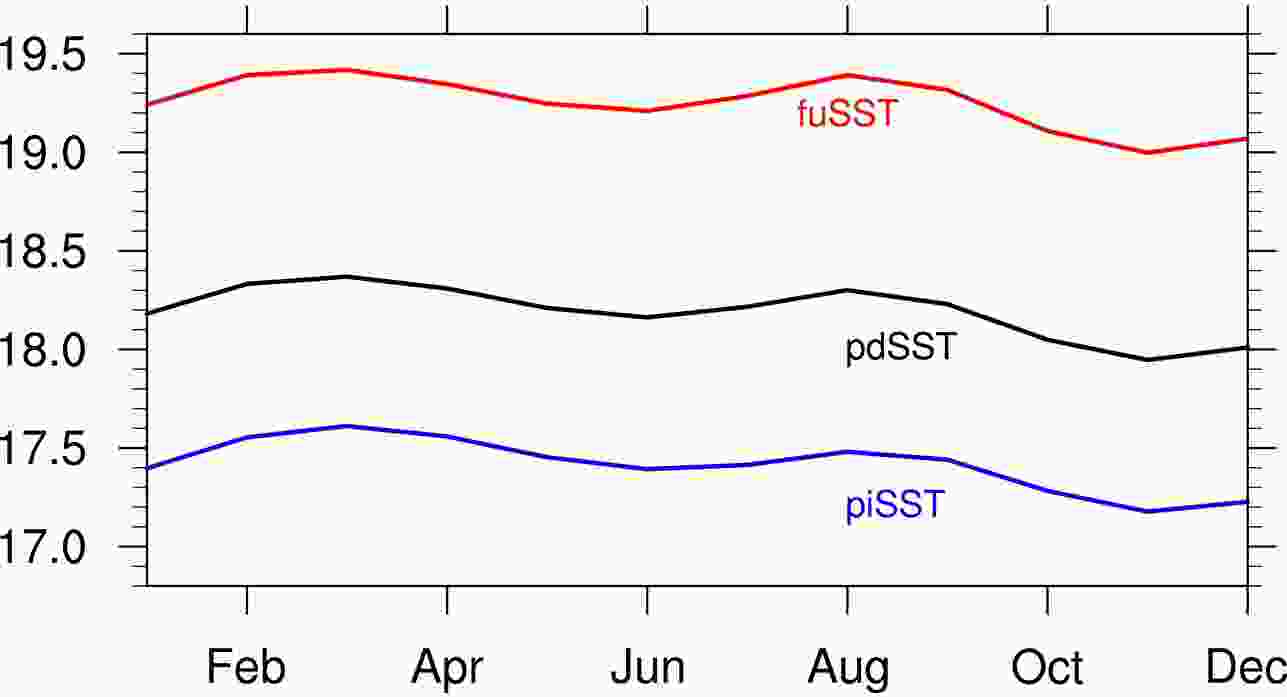 Figure3. Annual cycle of global mean SST forcings for present-day SST (pdSST), pre-industrial SST (piSST), and future SST (futSST).
The annual mean SIC forcings for both the Arctic and Antarctic are shown in Fig. 4. For the present-day Arctic SIC (Fig. 4a), the SIC mainly covers the whole Arctic Ocean, with the ice extent covering part of the northern Pacific and northern Atlantic. The differences between the present-day SIC and pre-industrial SIC for the Arctic are shown in Fig. 4b. The decrease in Arctic SIC mainly occurs in the latitudinal band between 50°N and 75°N. The SIC decreased by more than 30% in the Barents Sea and Greenland Sea. For the future changes in SIC, the difference between the future and present-day annual mean Arctic SIC (Fig. 4c) covers the whole Arctic Ocean, with two local negative centers over the northern Barents Sea and the region from the eastern East Siberian Sea to Beaufort Sea. For the Antarctic region (Figs. 4d–f), the present-day Antarctic SIC (Fig. 4d) exhibits a zonally symmetric pattern with an ice extent close to 60°S. the difference between the present-day and the pre-industrial SIC is smaller overall than that in the Arctic (Fig. 4e). The decrease in SIC is approximately 5%–10% and mainly occurs over the edge of the Antarctic mainland and at high latitudes in the South Atlantic Ocean. For the difference between future and present-day (Fig. 4f), the decrease in SIC is approximately 10%–15% within the latitudinal band of 60°S to 80°S and more than 20% over the Amundsen Sea. Overall, the decreases in SIC for both the Arctic and Antarctic are greater for future changes than for present-day changes.
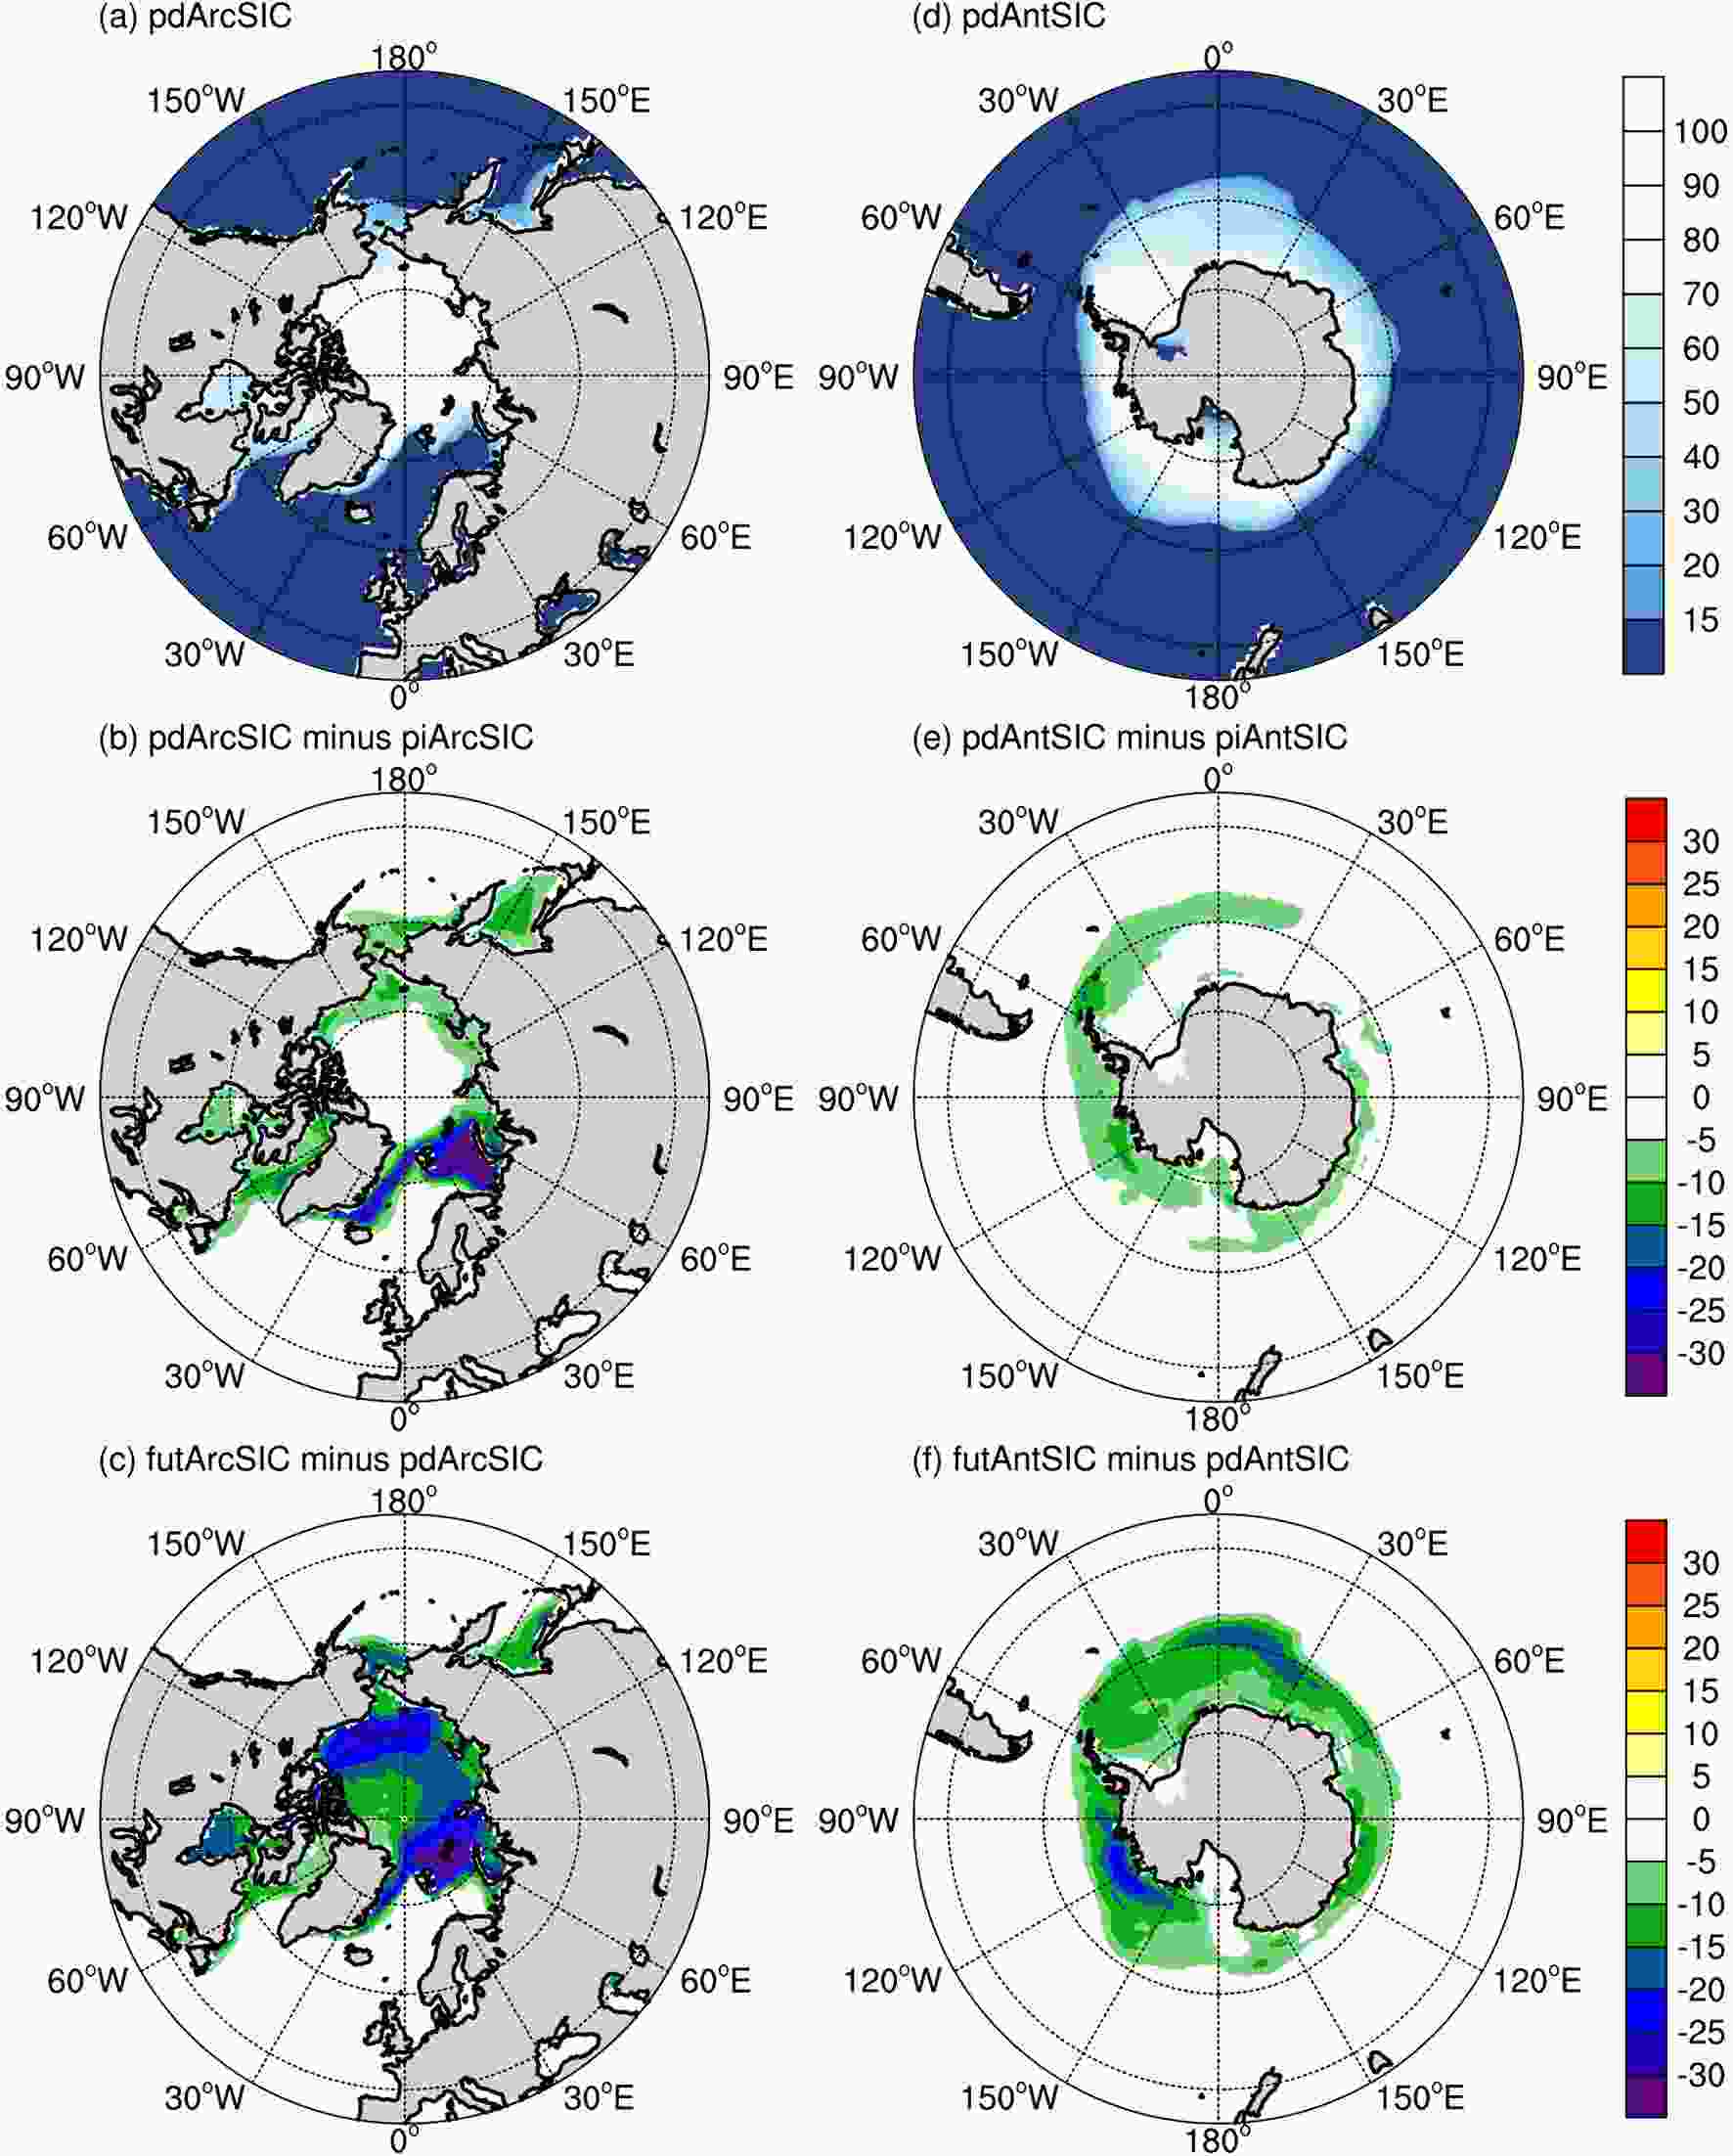 Figure4. Spatial distribution of annual mean SIC (%) forcings for the (a) present-day Arctic SIC (pdArcSIC), (b) difference between pdArcSIC and pre-industrial Arctic SIC (piArcSIC), (c) difference between future Arctic SIC (futArcSIC) and pdArcSIC, (d) present-day Antarctic SIC (pdAntSIC), (e) difference between pdAntSIC and pre-industrial Antarctic SIC (piAntSIC), and (f) difference between future Antarctic SIC (futAntSIC) and pdAntSIC.
To quantify the changes in SIC forcing, we calculated the SIC area for each month for both the Arctic and Antarctic, and the results are presented in Table 2. The present-day Arctic SIC area shows a clear annual cycle with a maximum of 13.4 × 10⁶ km2 in March and a minimum of 5.3 × 10⁶ km2 in September. The differences in Arctic SIC between the present day and pre-industrial period are approximately ?1.4 to ?1.8 × 10⁶ km2 for all months. For the future changes in SIC, the difference between future and present-day SIC reaches ?4 × 10⁶ km2 during the boreal summer months, which is twice the value of the present-day changes. For the Antarctic, the present-day SIC area also shows an annual cycle, but with a minimum of 2.7 × 10⁶ km2 in February and a maximum of 16.6 × 10⁶ km2 in September. The differences between the present day and pre-industrial period are approximately ?1 × 10⁶ km2 from January to May and ?1.4 × 10⁶ km2 from June to December. The differences between the future and present-day SIC areas are almost twice as large from April to December, ranging between ?1.9 × 10⁶ km2 and ?2.7 × 10⁶ km2.
| Month | Arctic | Antarctic | |||||||||
| pd | pi | fut | pd-pi | fut-pd | pd | pi | fut | pd-pi | fut-pd | ||
| January | 12.6 | 14.1 | 10.7 | ?1.5 | ?1.9 | 4.1 | 5.2 | 2.7 | ?1.1 | ?1.4 | |
| February | 13.4 | 15 | 11.8 | ?1.5 | ?1.7 | 2.7 | 3.7 | 1.7 | ?0.9 | ?1.1 | |
| March | 13.6 | 15.2 | 12 | ?1.6 | ?1.5 | 3.6 | 4.6 | 2.2 | ?1 | ?1.4 | |
| April | 12.8 | 14.4 | 11.5 | ?1.6 | ?1.3 | 6.2 | 7.1 | 4.2 | ?0.9 | ?2 | |
| May | 11.5 | 13 | 10.3 | ?1.4 | ?1.3 | 9.2 | 10.3 | 6.9 | ?1.1 | ?2.3 | |
| June | 10 | 11.3 | 8.3 | ?1.3 | ?1.7 | 12.2 | 13.4 | 9.7 | ?1.3 | ?2.5 | |
| July | 7.5 | 9.2 | 5 | ?1.7 | ?2.5 | 14.6 | 15.9 | 12.1 | ?1.4 | ?2.5 | |
| August | 5.7 | 7.5 | 2.2 | ?1.8 | ?3.5 | 16 | 17.4 | 13.5 | ?1.4 | ?2.5 | |
| September | 5.3 | 7.1 | 1.3 | ?1.8 | ?4 | 16.6 | 18 | 14 | ?1.4 | ?2.6 | |
| October | 7.2 | 9 | 2.7 | ?1.8 | ?4.5 | 16.1 | 17.5 | 13.4 | ?1.4 | ?2.7 | |
| November | 9.4 | 10.8 | 5.9 | ?1.4 | ?3.4 | 13.5 | 14.9 | 11 | ?1.4 | ?2.4 | |
| December | 11.3 | 12.7 | 8.6 | ?1.5 | ?2.7 | 8.2 | 9.6 | 6.3 | ?1.4 | ?1.9 | |
Table2. Sea ice concentration area (106 km2) for pdSIC, piSIC, and futSIC.
2
3.1. SAT and precipitation responses to present-day forcings
Precipitation and SAT are the two most important elements for understanding global climate change, and identifying the changes in these variables is necessary to obtain quantitative knowledge of the climate model response to external forcing and model sensitivity. To identify the basic model response of CAS FGOALS-f3-L to the present-day forcing of global SST and SIC and to understand the large-ensemble simulation spread, we first show the global mean daily evolution of the SAT over land and oceans and global precipitation of pdSST-pdSIC (No.1.1) in Fig. 5. The ensemble mean (red line) global land SAT (Fig. 5a) shows a clear annual cycle with a maximum close to 15°C in July 2000 and a minimum close to 2°C from December 2000 to January 2001. The large-ensemble simulation provides a range of 5°C to 7°C on the initial date of 1 April 2000. During the integration, the large-ensemble spread remains stable and becomes slightly larger from November 2000 to January 2000. As a measurement of the large-ensemble spread, the standard deviation of the global land SAT in pdSST-pdSIC is approximately 0.5°C.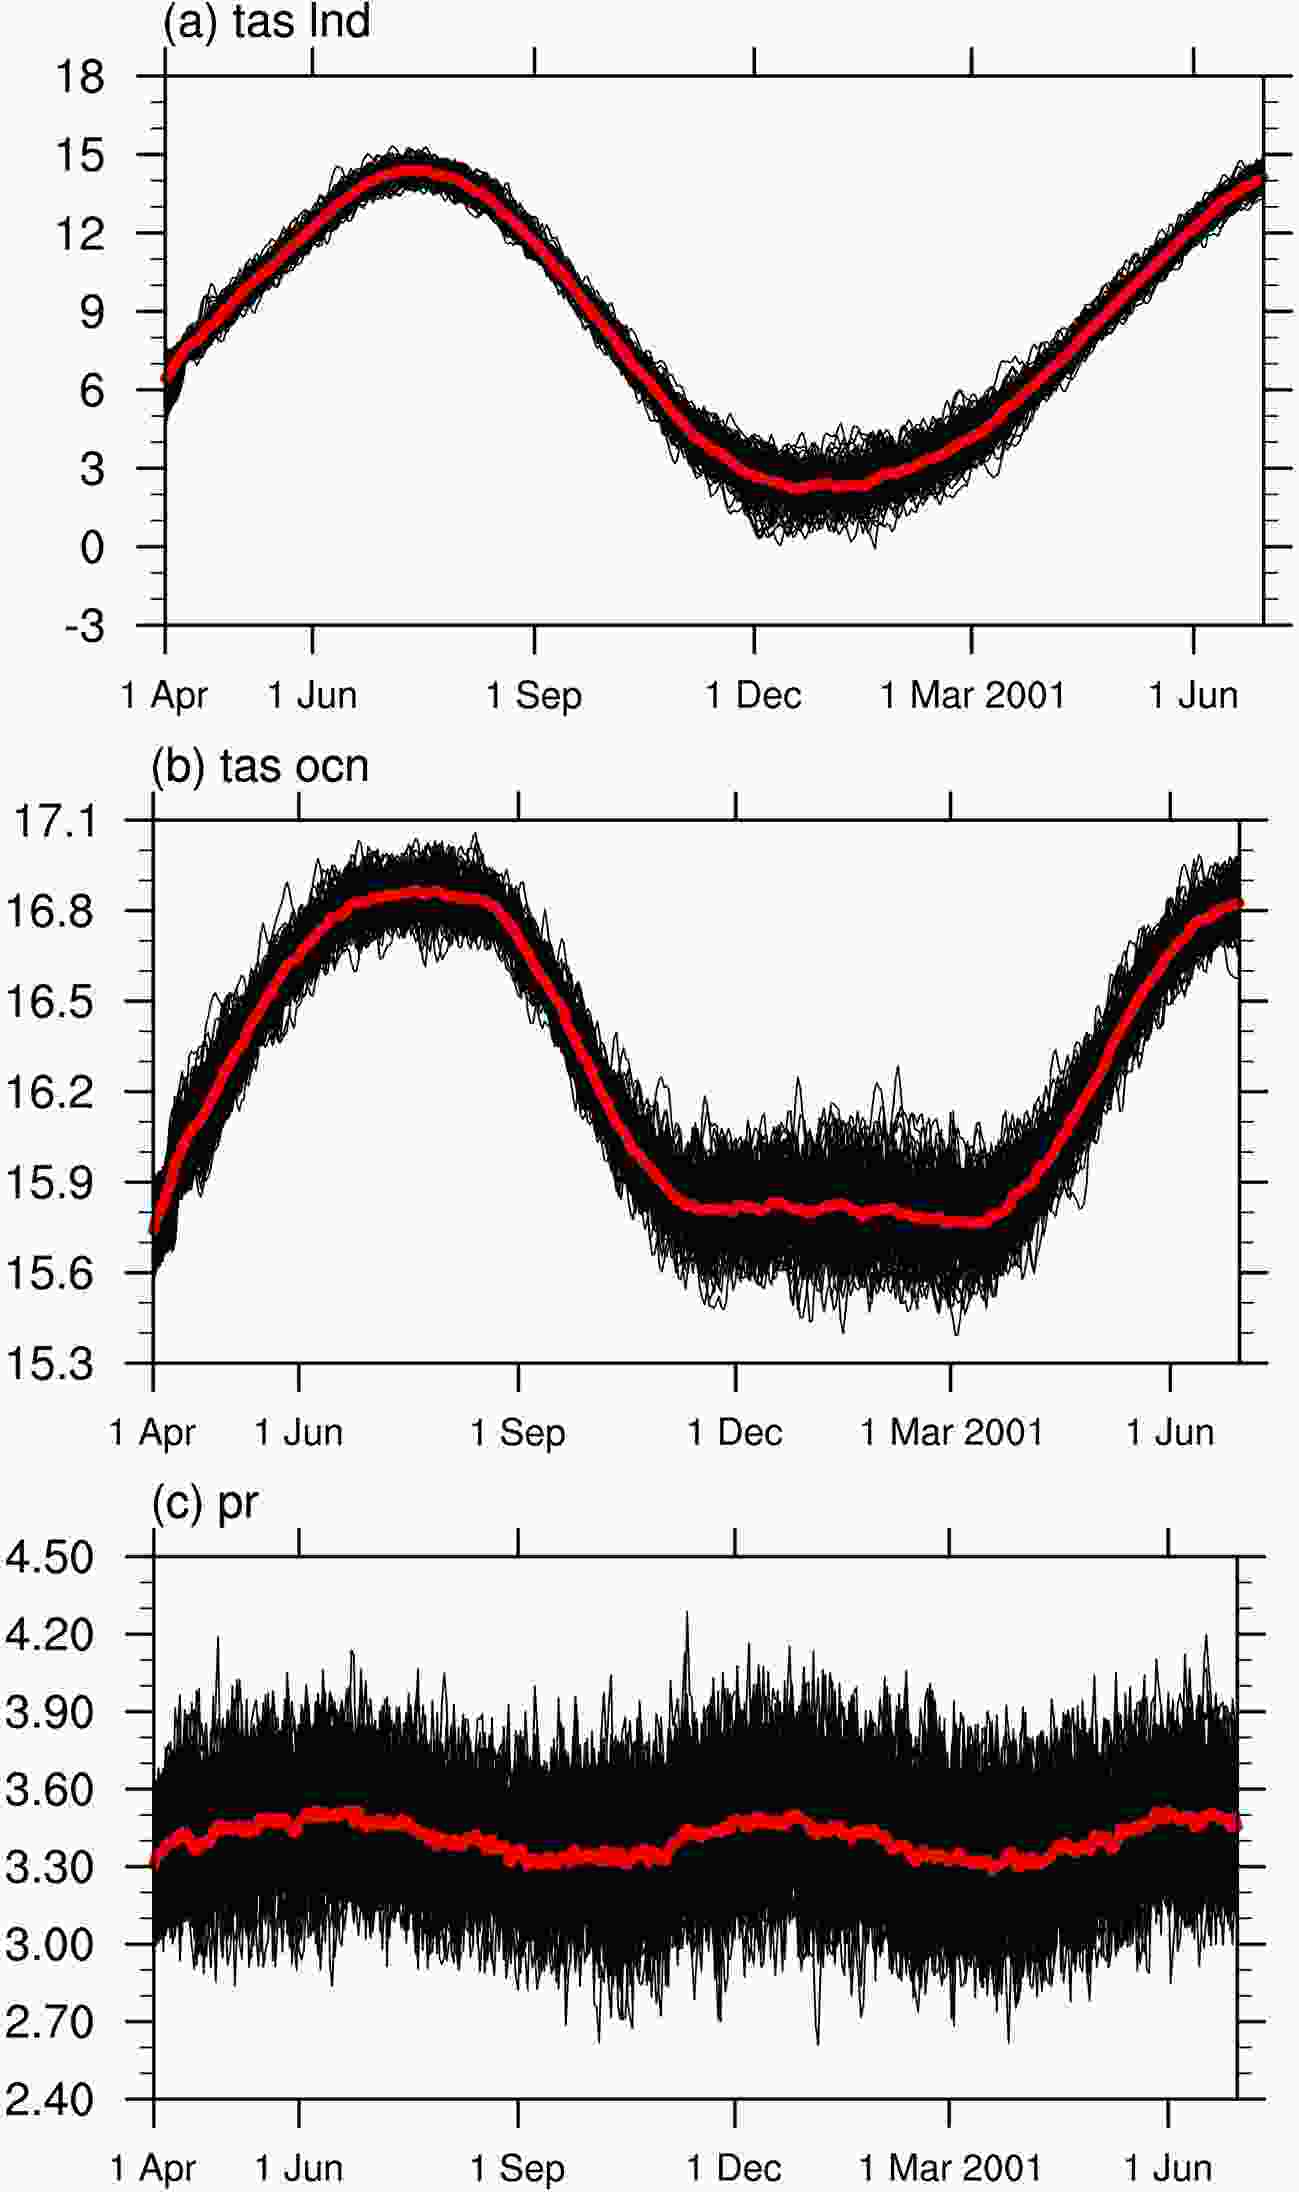 Figure5. Time series of global mean daily SAT (°C) for the (a) global land, (b) global ocean, and (c) precipitation (mm d?1) in pdSST_pdSIC. The red line denotes the ensemble mean results, and the black lines represent 100 ensemble members. The standard deviation of SAT is 0.5°C over land and 0.1°C over ocean. The standard deviation of global precipitation is 0.2 mm d?1.
The evolution of SAT over the global ocean regions is similar overall to that of land SAT, with a clear annual cycle (Fig. 5b) from April 2000 to June 2001. However, the variation in SAT over the ocean regions ranges from 15.7°C to 16.8°C, which is much smaller than the land SAT range. The standard deviation of ocean SAT is approximately 0.1°C, which suggests that the model response for ocean regions is weaker than that over land, partly because SST is prescribed in the model. The daily evolution of the global mean precipitation is shown in Fig. 5c. The ensemble mean precipitation time series shows a semiannual cycle that is similar to that of the SST forcing in Fig. 3. This is because tropical precipitation plays a dominant role in global precipitation variation, which is mainly driven by changes in SST. The large-ensemble spread is also quite stable during the integration, and the standard deviation is approximately 0.2 mm d?1.
The above analysis shows the basic performance of the CAS FGOALS-f3-L large-ensemble simulations for the present-day forcing. The model simulation is reasonable since the ensemble spread is stable during the whole integration under the fixed external forcing. To understand the relative contributions of present-day changes in SST and SIC to polar amplification, we show the ensemble mean differences in the annual mean SAT response to the four combinations in Fig. 6. The SAT responses to both the global SST and SIC changes (pdSST-pdSIC minus piSST-piSIC) are shown in Fig. 6a. The SAT anomaly shows a unified global warming pattern accompanied by polar amplification in both hemispheres. This warming pattern is similar to the observed global warming trend during the last century (Fig. TS.2 in Stocker et al., 2013), which also suggests that the experimental design of PAMIP could reasonably reproduce the observed global warming through large-ensemble simulation. In the Arctic, the SAT anomaly shows several local maxima exceeding 1.8°C over the Barents/Kara Sea, the Okhotsk Sea, the Bering Strait, Hudson Bay, Baffin Bay, and the Greenland Sea. In the Antarctic, SAT reaches its maximum along the Antarctic mainland coast from 90°E to 60°W, which includes the Ross Sea, Amundsen Sea, Bellingshausen Sea, and Weddell Sea.
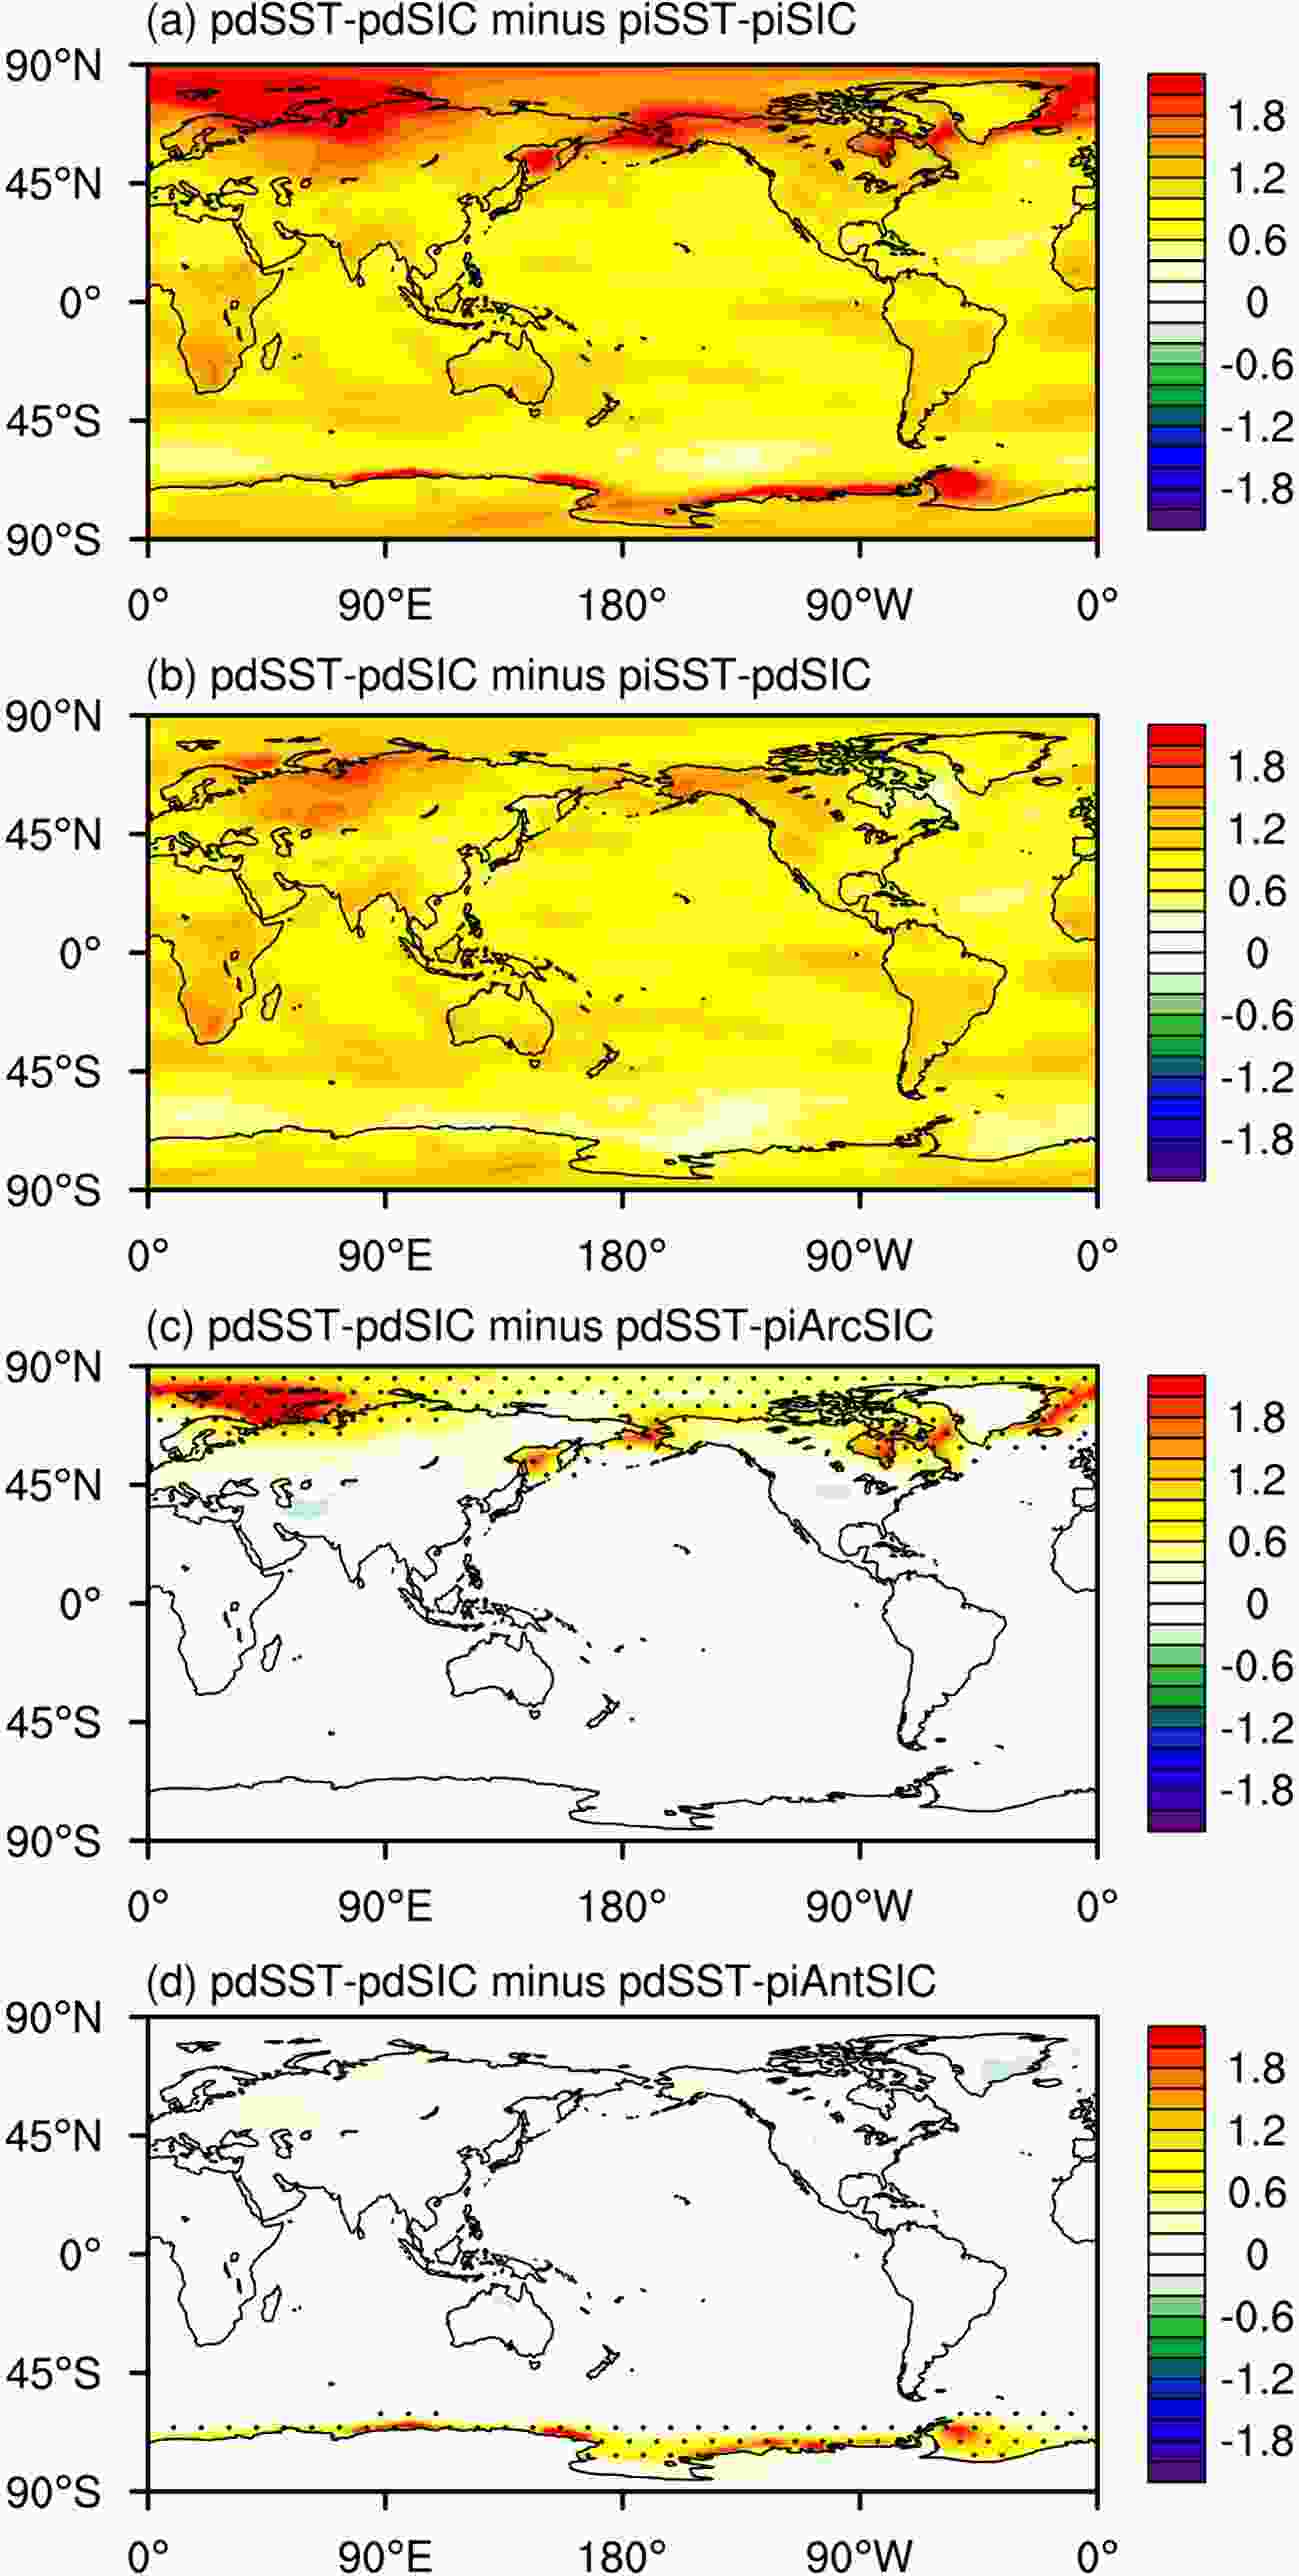 Figure6. Spatial pattern of ensemble mean differences in annual mean SAT (°C) response in the following experiments: (a) pdSST-pdSIC minus piSST-piSIC, (b) pdSST-pdSIC minus piSST-pdSIC, (c) pdSST-pdSIC minus pdSST-piArcSIC, and (d) pdSST-pdSIC minus pdSST-piAntSIC. All the SAT responses in (a) and (b) and the black dots in (c) and (d) are statistically significant at the 99% confidence level according to Student’s t test.
The SAT responses to only the global SST changes (pdSST-pdSIC minus piSST-pdSIC) show a unified global warming pattern (Fig. 6b). However, the polar amplification pattern disappeared in this pair of experiments. There are several local maxima of SAT over the northern part of the Asian mainland, the coastal region of Barents Sea, and northwestern North America of approximately 1.2°C. The SAT response to the historical changes in Arctic SIC forcing (Fig. 6c, pdSST-pdSIC minus pdSST-piArcSIC) shows limited warming in the basin region of the Arctic Ocean. The SAT changes over other regions of the globe are very small. The SAT anomaly reaches its maximum mainly over the areas where the prescribed Arctic SIC decreases (Fig. 4b), and this pattern is also similar to the polar amplification pattern shown in Fig. 6a. Similarly, in the Antarctic, SAT increases only in the ocean regions (Fig. 6d) where the prescribed Antarctic SIC decreases (Fig. 4e). The above results suggest that polar amplification is dominantly controlled by changes in global SIC, especially Arctic SIC, because SAT changes are larger (Fig. 6c) at high latitudes, which is similar to the combined forcing of both SST and SIC (Fig. 6a).
The response of precipitation to global warming is another topic of scientific interest in terms of the estimation of global pattern changes. The large-ensemble simulation in this study provides additional evidence for understanding the relative roles of SST and SIC forcings in changes in global precipitation. We show the spatial pattern of ensemble mean differences in annual mean precipitation between pdSST-pdSIC and piSST-piSIC in Fig. 7a, which shows that the response of precipitation is apparently different from that of SAT. Precipitation increases mainly over ocean regions, including the tropical Pacific, Southwest Pacific close to the Maritime Continent, South Indian Ocean, and tropical Atlantic. Furthermore, precipitation also decreases in the South Asian monsoon regions, middle tropical Pacific, African mainland region, and low latitudes of North America.
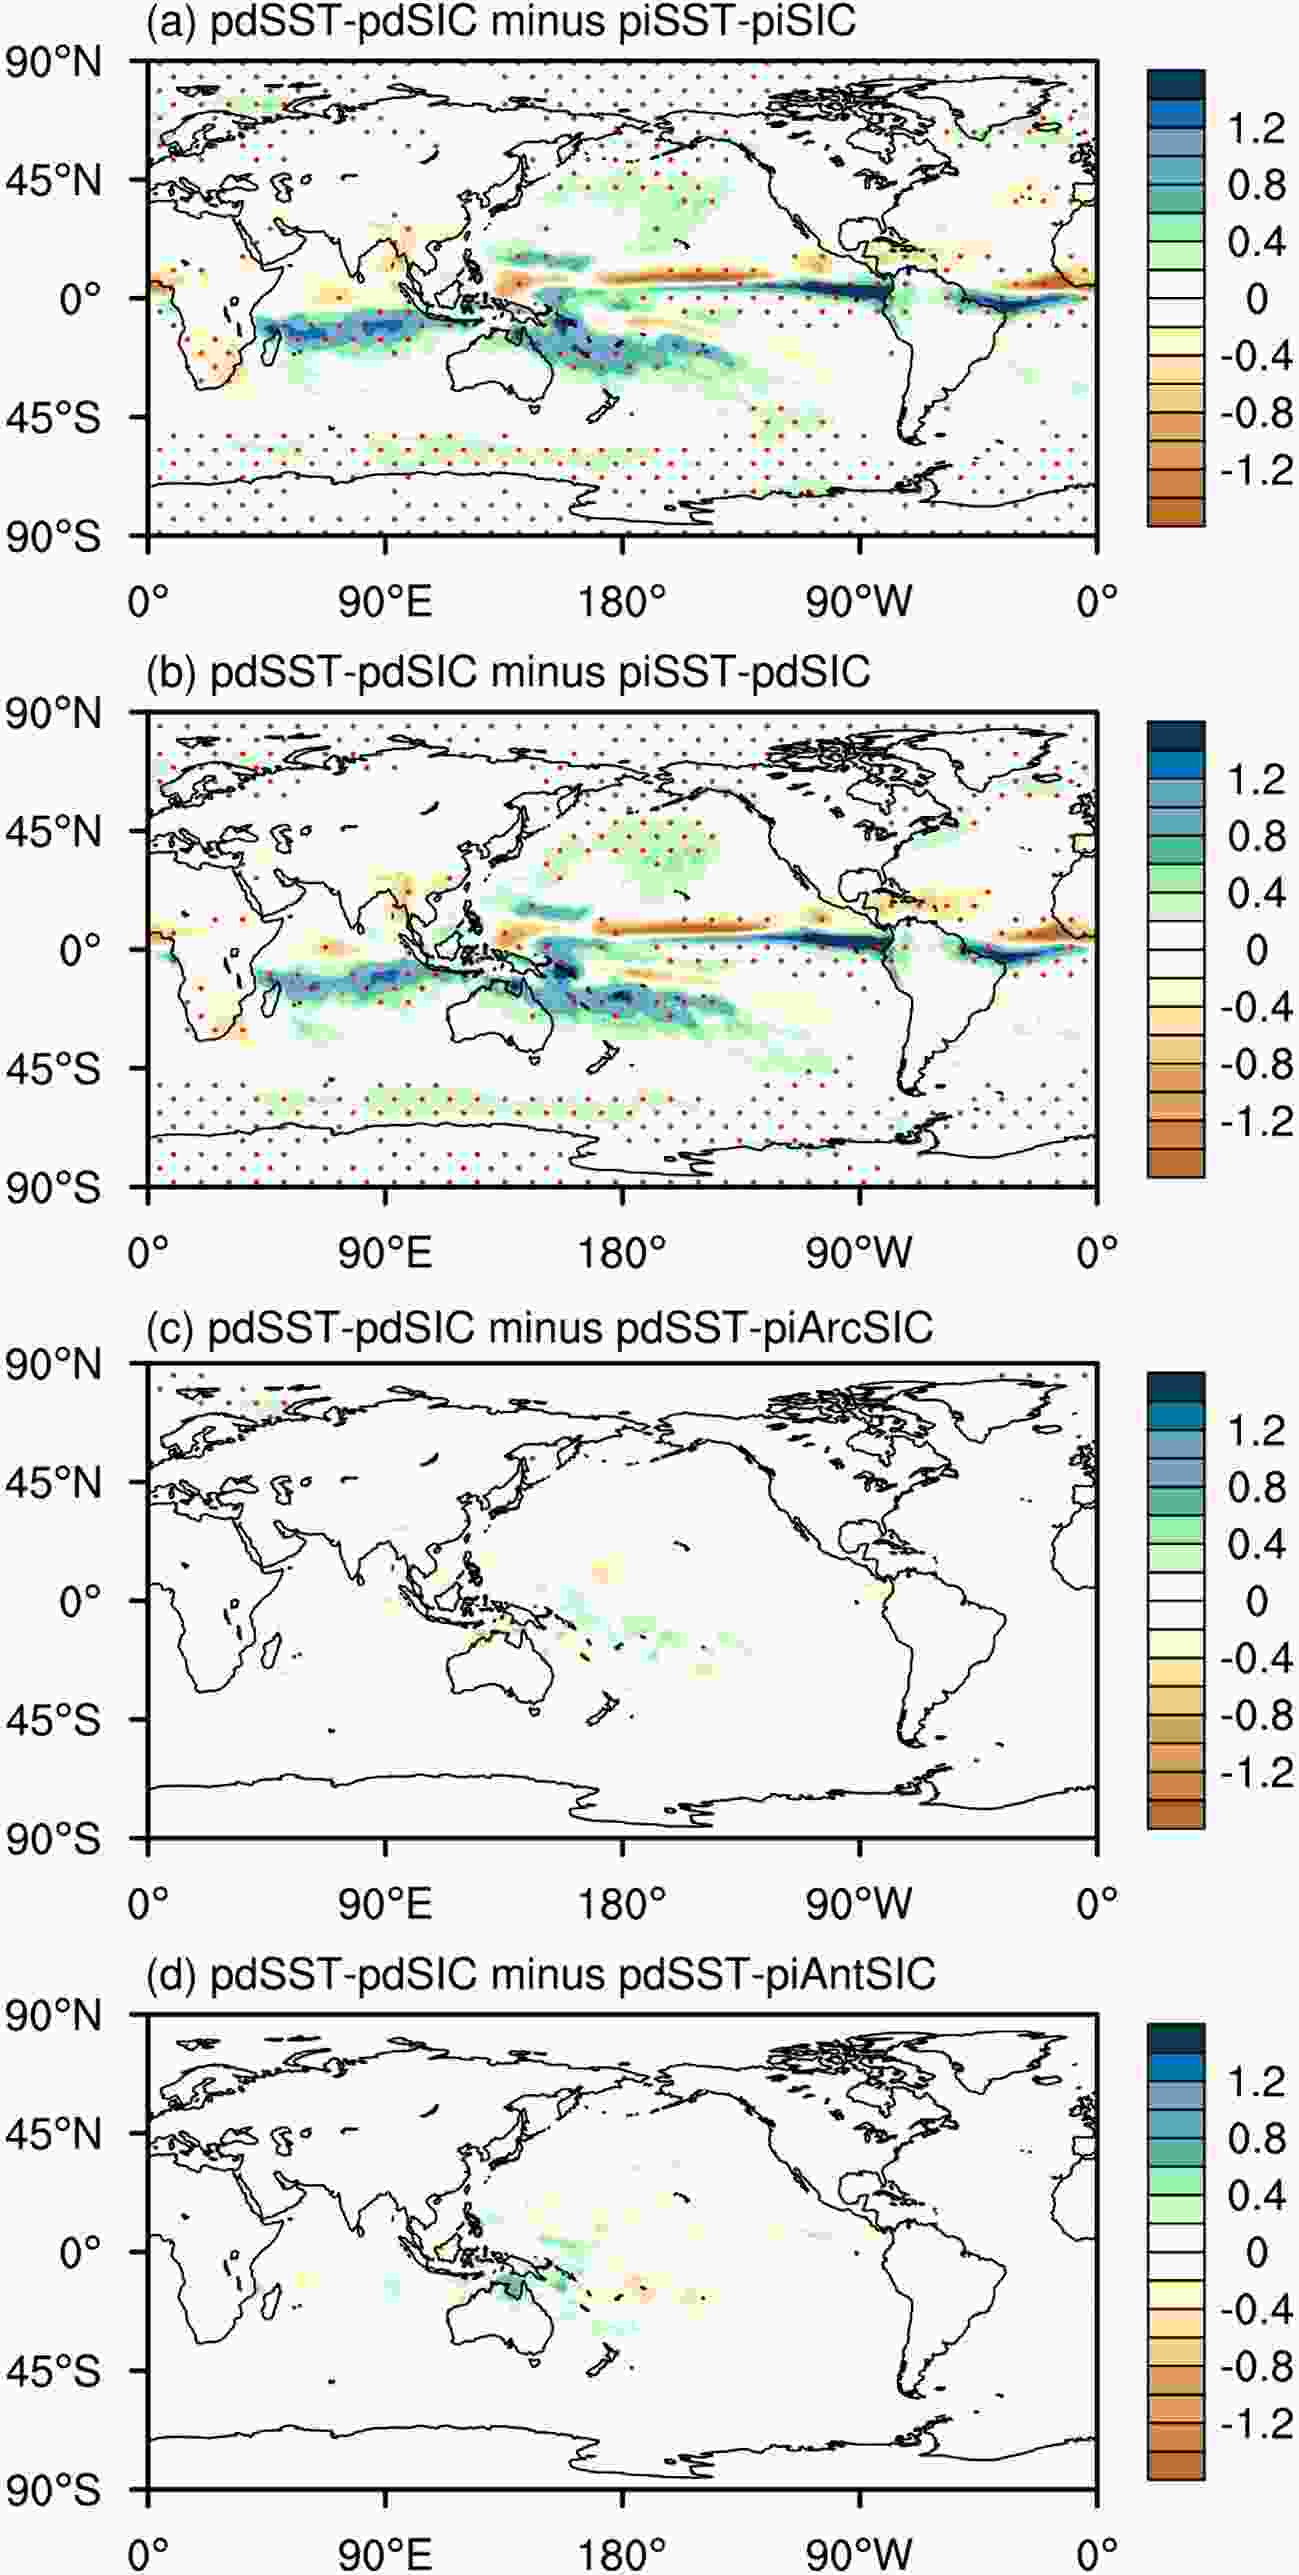 Figure7. Spatial pattern of ensemble mean differences in annual mean precipitation (mm d?1) response in the following experiments: (a) pdSST-pdSIC minus piSST-piSIC, (b) pdSST-pdSIC minus piSST-pdSIC, (c) pdSST-pdSIC minus pdSST-piArcSIC, and (d) pdSST-pdSIC minus pdSST-piAntSIC. The red dots denote values that are statistically significant at the 99% confidence level according to Student’s t test.
The precipitation response to global SST forcing alone (Fig. 7b, pdSST-pdSIC and piSST-pdSIC) shows a very similar pattern to the response to SST and SIC forcing together (Fig. 7a). The response of precipitation to the changes in Arctic SIC is shown in Fig. 7c. This pattern implies that the influence of Arctic SIC on global precipitation changes is very limited compared to the impact of SST (Fig. 7b). Precipitation increases only slightly over the tropical western Pacific close to the Maritime Continent. Similarly, the influence of Antarctic SIC on the annual mean changes in precipitation is also weak (Fig. 7d). The ensemble precipitation anomalies (pdSST-pdSIC and pdSST-piAntSIC) mainly increase on the Maritime Continent by approximately 0.4 mm d?1. The above result indicates that the changes in global precipitation for the present day are dominated by the changes in global SST relative to the changes in global SIC.
The large-ensemble simulations provide not only a robust model response by calculating the ensemble mean but also a range of the uncertainty or the possibility of model response through the analysis of the adequate ensemble members. To quantitively estimate the uncertainty of the SAT response to SST and SIC forcings, in this study, we calculated the probability density distribution (PDF) of the SAT anomalies of 100 ensemble cases for each pair of experiments in Fig. 8. For pdSST-pdSIC minus piSST-piSIC, the global mean SAT anomaly increases to 1°C for more than 25% of cases. The SAT maximum is approximately 1.1°C for about 5% of cases, and the minimum is approximately 0.9°C for about 5% of cases.
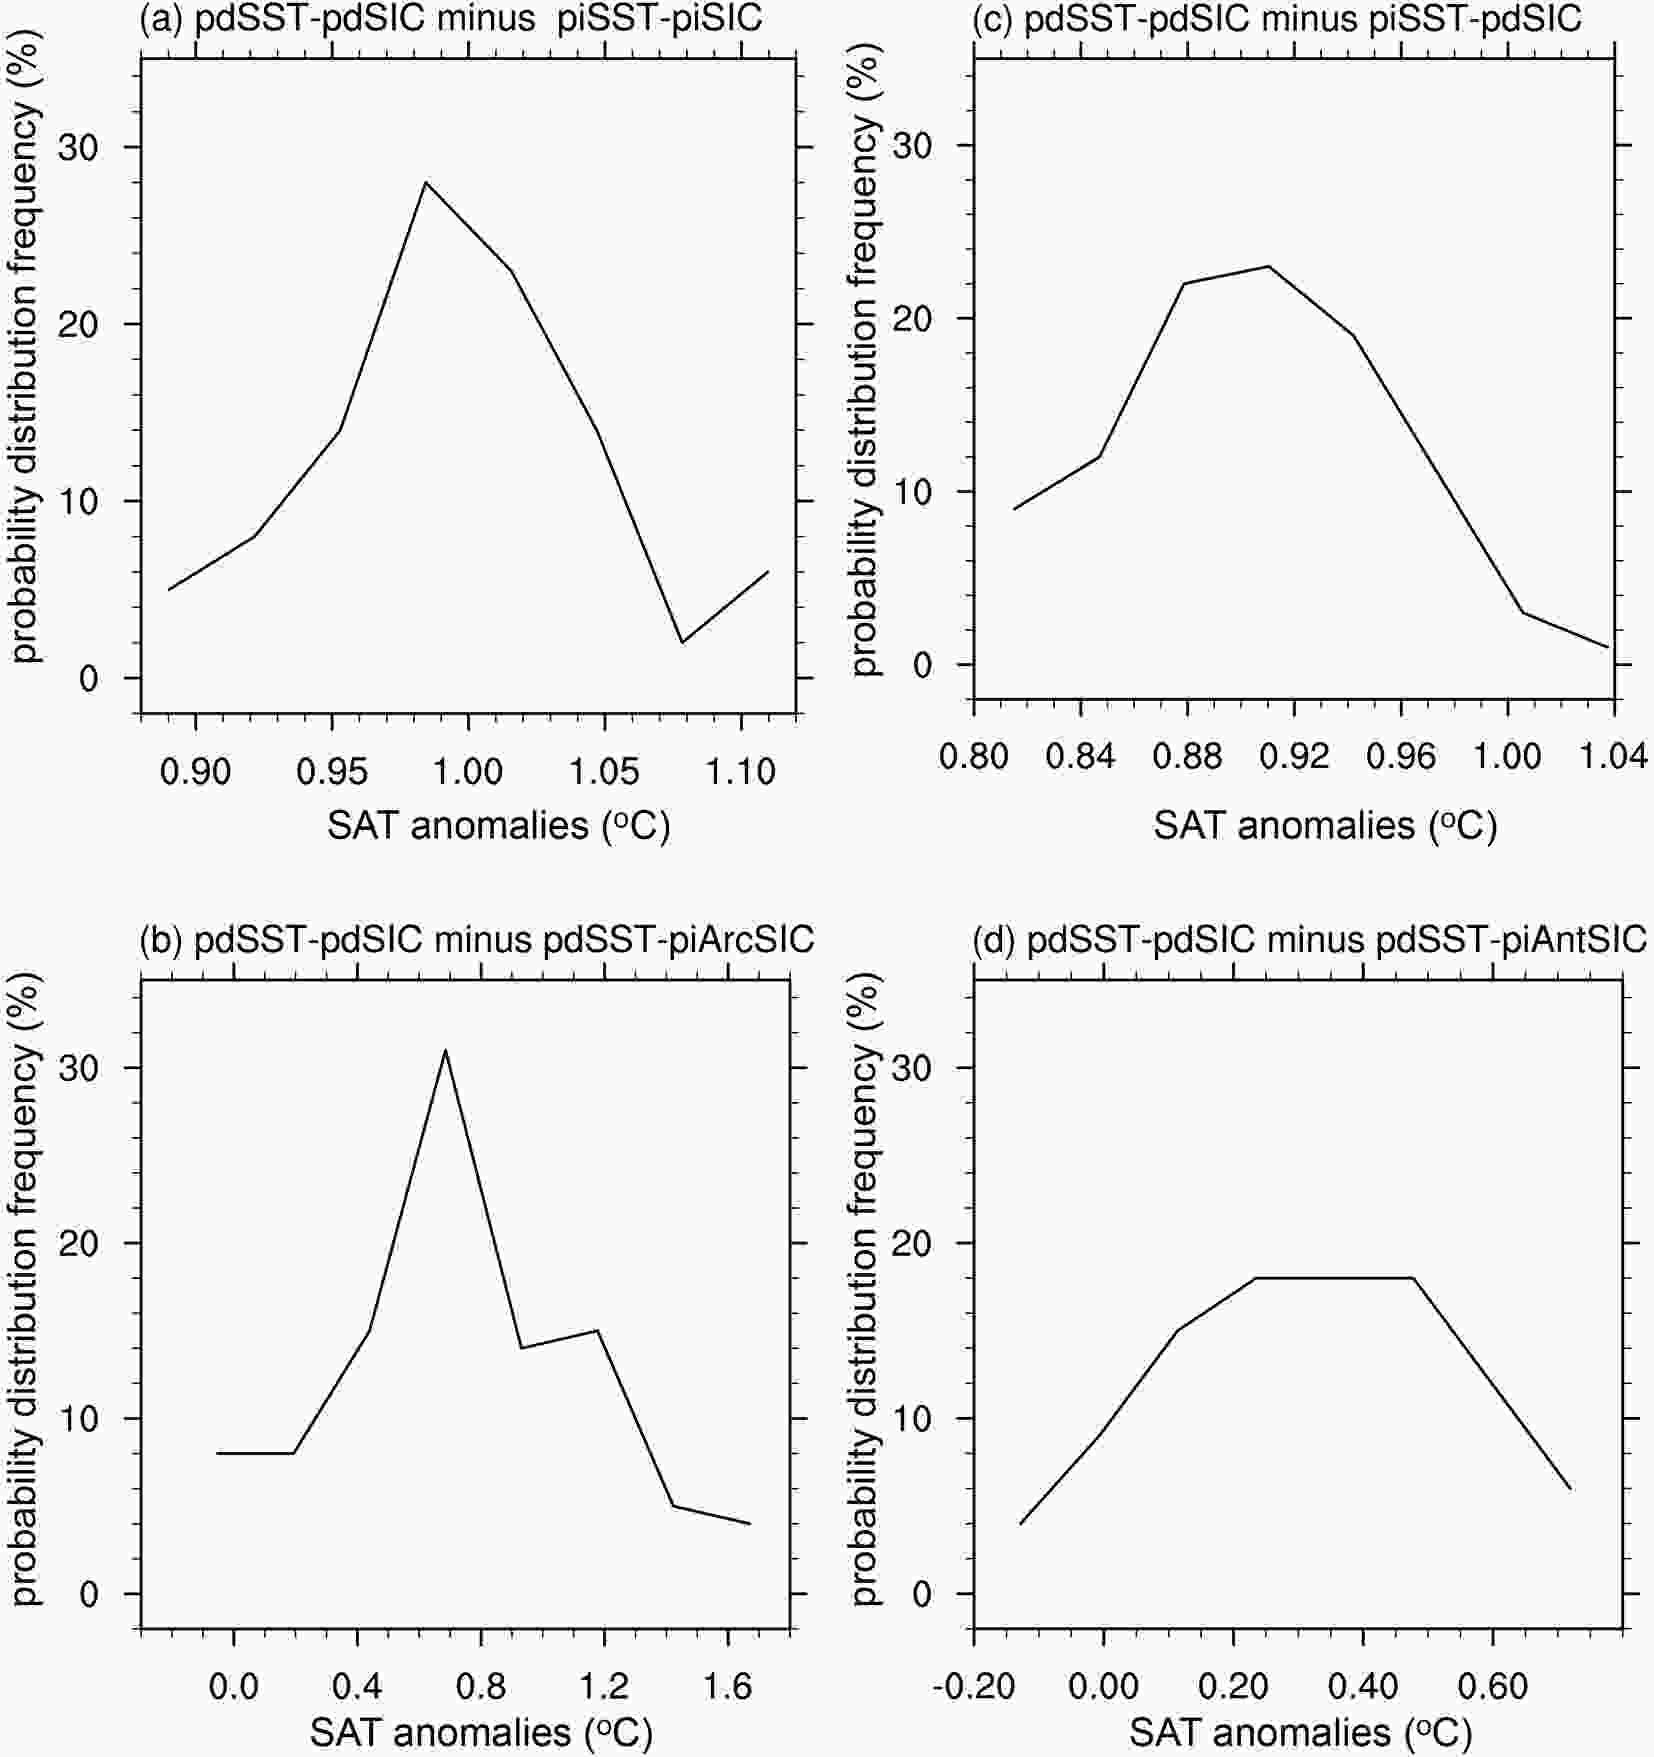 Figure8. Probability density distribution of (a) global mean SAT anomalies of pdSST-pdSIC minus piSST-piSIC, (b) regional mean (60°–90°N) SAT anomalies of pdSST-pdSIC minus piSST-piArcSIC, (c) global mean SAT anomalies of pdSST-pdSIC minus piSST-pdSIC, and (d) regional mean (60°–90°S) SAT anomalies of pdSST-pdSIC minus piSST-piAntSIC. The abscissa denotes the SAT anomalies (°C), and the vertical coordinate denotes the associated probability density distribution.
For the cases forced by global SST changes alone (Fig. 8c, pdSST-pdSIC minus piSST-pdSIC), more than 20% simulate global mean SAT anomalies ranging from 0.88°C to 0.92°C. The SAT maximum is approximately 1.04°C for only 1% of cases, while the minimum is approximately 0.81°C for 9% of cases. Because the SAT responses to Arctic and Antarctic SIC are quite local, we calculated the PDF of the regional mean SAT (60°–90°N) anomalies for the cases of pdSST-pdSIC minus pdSST-piArcSIC and the regional mean SAT (60°–90°S) anomalies for the cases of pdSST-pdSIC minus pdSST-piAntSIC in Figs. 8b and 8d, respectively. The results show that SAT anomalies range from 0°C (8% of cases) to 1.6°C (4% of cases) in the high latitudes in the Northern Hemisphere, with more than 30% of cases simulating a SAT anomaly of 0.6°C. The SAT anomalies are smaller in the Southern Hemisphere middle and high latitudes (Fig. 8d). More than 18% of cases simulate a SAT anomaly of 0.4°C. The maximum is approximately 0.8°C for nearly 6% of cases and ?0.18°C for another 4% of cases.
The PDFs of the precipitation anomalies for these cases are shown in Fig. 9. Because the precipitation responses mainly occur in the low latitudes, we only calculated the PDF for the regional mean (45°S–45°N) precipitation anomalies. In the cases of pdSST-pdSIC minus piSST-piSIC (Fig. 9a), the precipitation anomalies range from 0.062 mm d?1 (2% of cases) to 0.108 mm d?1 (5% of cases), with most cases simulating from 0.08 mm d?1 to 0.09 mm d?1. The PDF of pdSST-pdSIC minus piSST-pdSIC (Fig. 9c) is very similar to the PDF of pdSST-pdSIC minus piSST-piSIC (Fig. 9a), which is also consistent with the ensemble mean results in Figs. 7a and 7b.
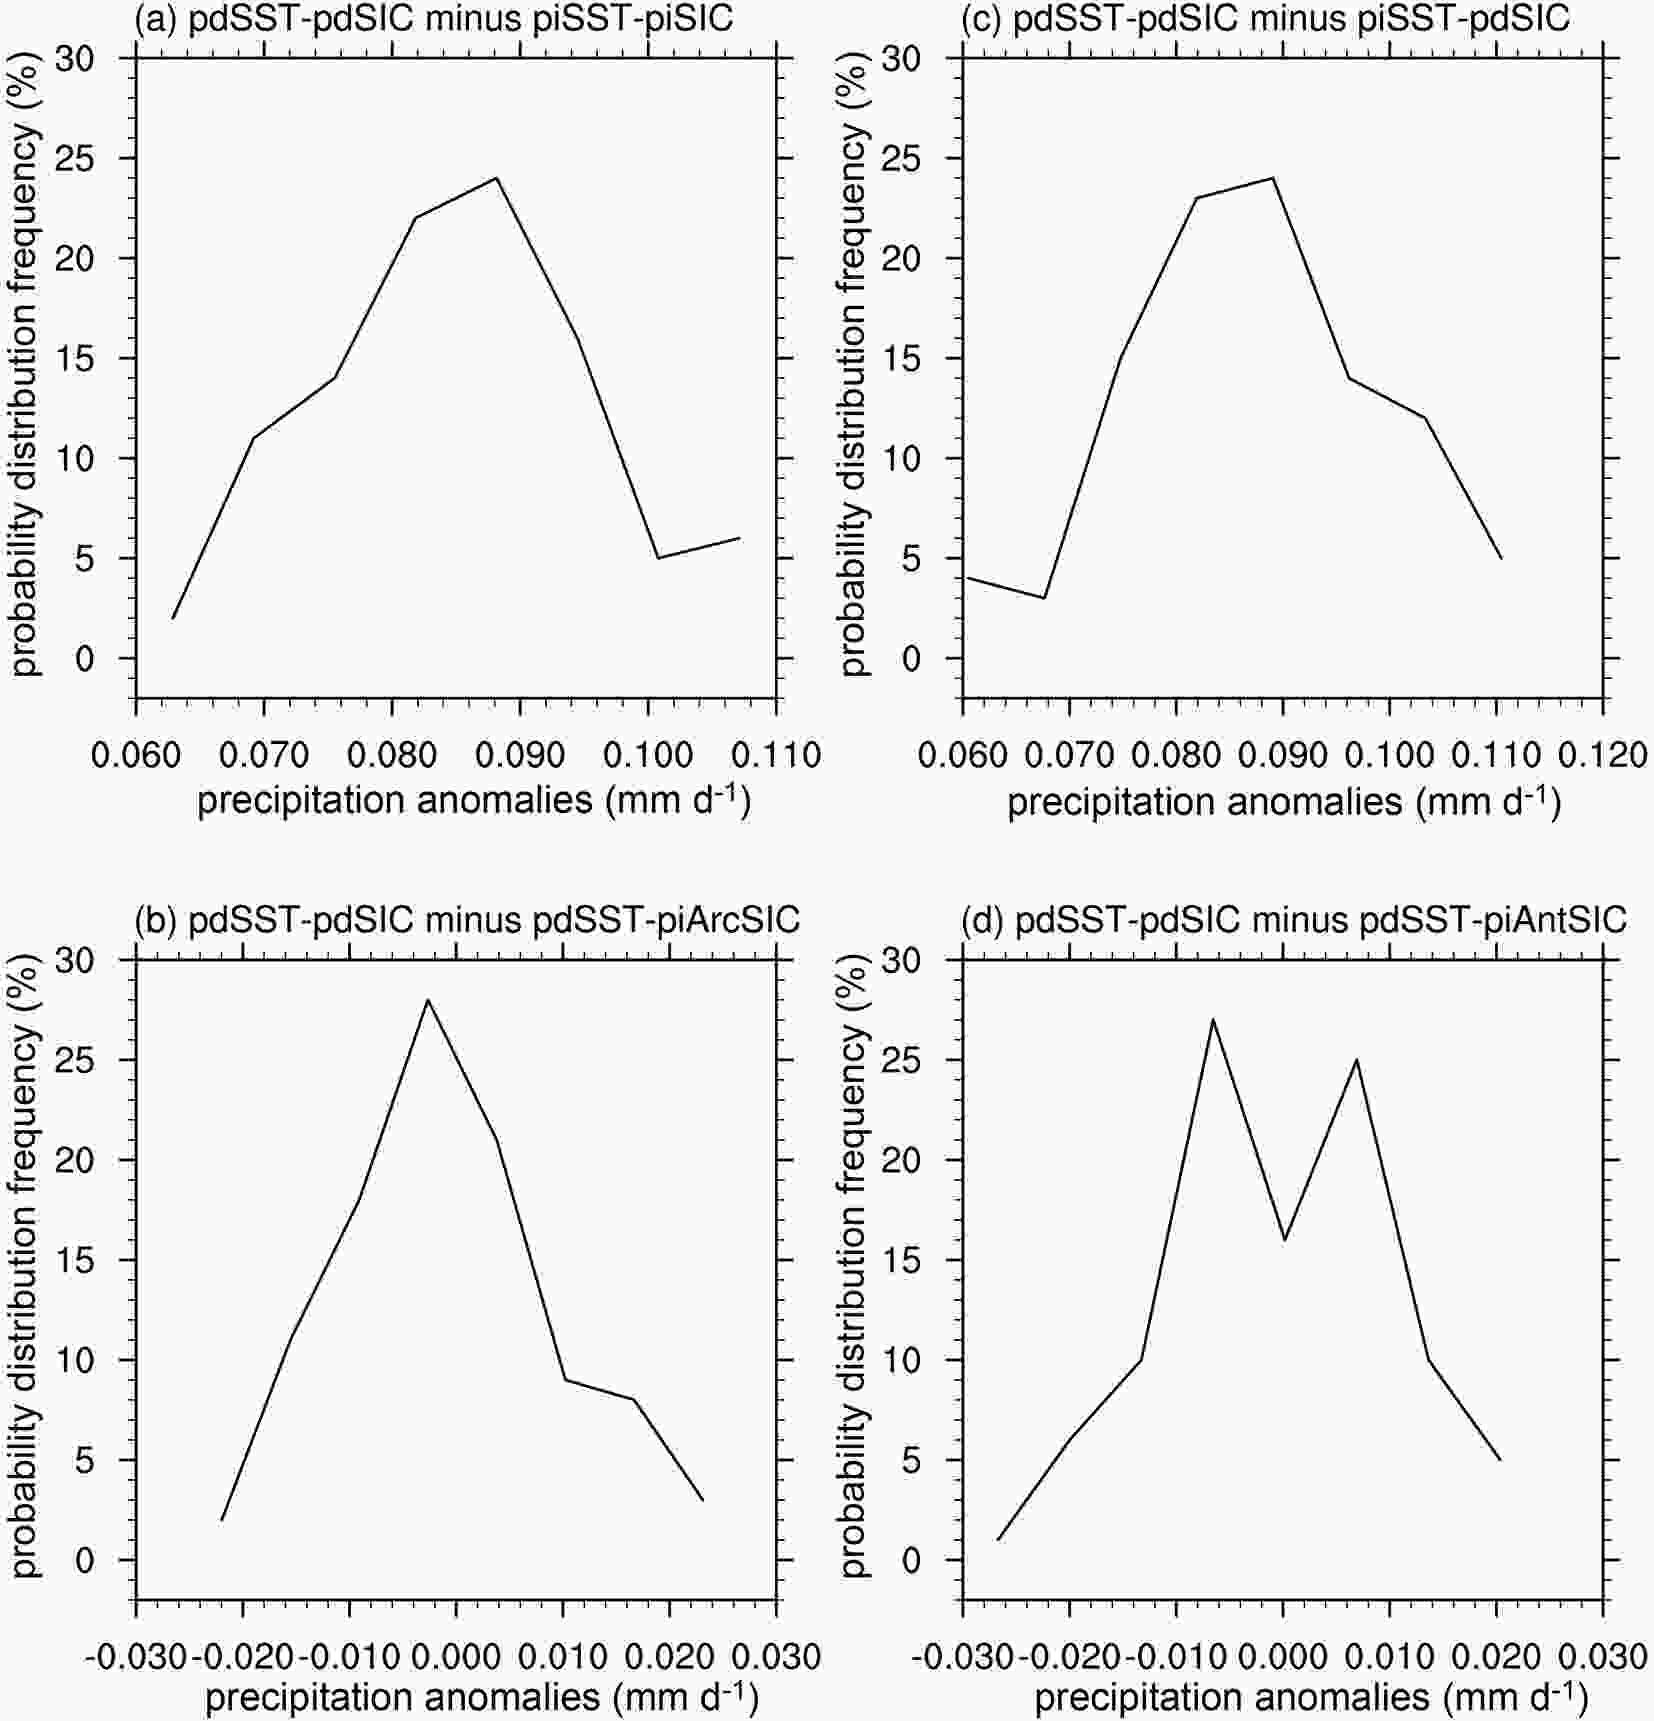 Figure9. Probability density distribution of regional mean (45°S–45°N) precipitation anomalies for the experiments of (a) pdSST-pdSIC minus piSST-piSIC, (b) pdSST-pdSIC minus piSST-piArcSIC, (c) pdSST-pdSIC minus piSST-pdSIC, and (d) pdSST-pdSIC minus piSST-piAntSIC. The abscissa denotes the precipitation anomalies (mm d?1), and the vertical coordinate denotes the associated probability density distribution.
It is worth noting that the precipitation anomalies are all positive in the above two pairs of experiments, which is mainly caused by surface warming in the low latitudes (Figs. 6a and 6b), but for the cases in pdSST-pdSIC minus pdSST-piArcSIC (Fig. 9b) and pdSST-pdSIC minus pdSST-piAntSIC (Fig. 9d), the sign of the precipitation anomalies remains uncertain. The PDF for both pairs of experiments appears to be a normal-like distribution, with almost 50% of cases negative and the other 50% of cases positive. Specifically, the precipitation anomalies range from ?0.02 mm d?1 to 0.02 mm d?1 due to Arctic SIC forcing (Fig. 9b) and range from ?0.028 mm d?1 to 0.02 mm d?1 due to Antarctic SIC forcing (Fig. 9d). Furthermore, the precipitation response is approximately ?0.01 mm d?1 for nearly 20% of cases and 0.01 mm d?1 for another 20% of cases under Antarctic SIC forcing, which is different from the cases under Arctic SIC forcing.
2
3.2. SAT and precipitation responses to future forcings
The design of future condition experiments in PAMIP aims to assess and understand the process of future climate variability and predictability. These experiments are also designed for comparison with the experiments forced by present-day changes to understand the atmospheric responses to different SST and SIC forcings. As shown in section 2, the future changes in SST and SIC are overall larger than the present-day (relative to pre-industrial) changes. This implies that the model responses to SST and SIC will be stronger under future forcing changes than under present-day forcing changes. We show the influence of future global SST changes on SAT in Fig. 10a. It is clear that the SAT anomaly exhibits a global warming pattern and is warmer than the differences between pdSST-pdSIC and piSST-pdSIC (Fig. 6b). Specifically, SAT increases 1.0°C to 1.2°C in most of the region and exceeds 1.8°C in Alaska, the central Asian mainland, eastern and southern Africa, and the Antarctic mainland.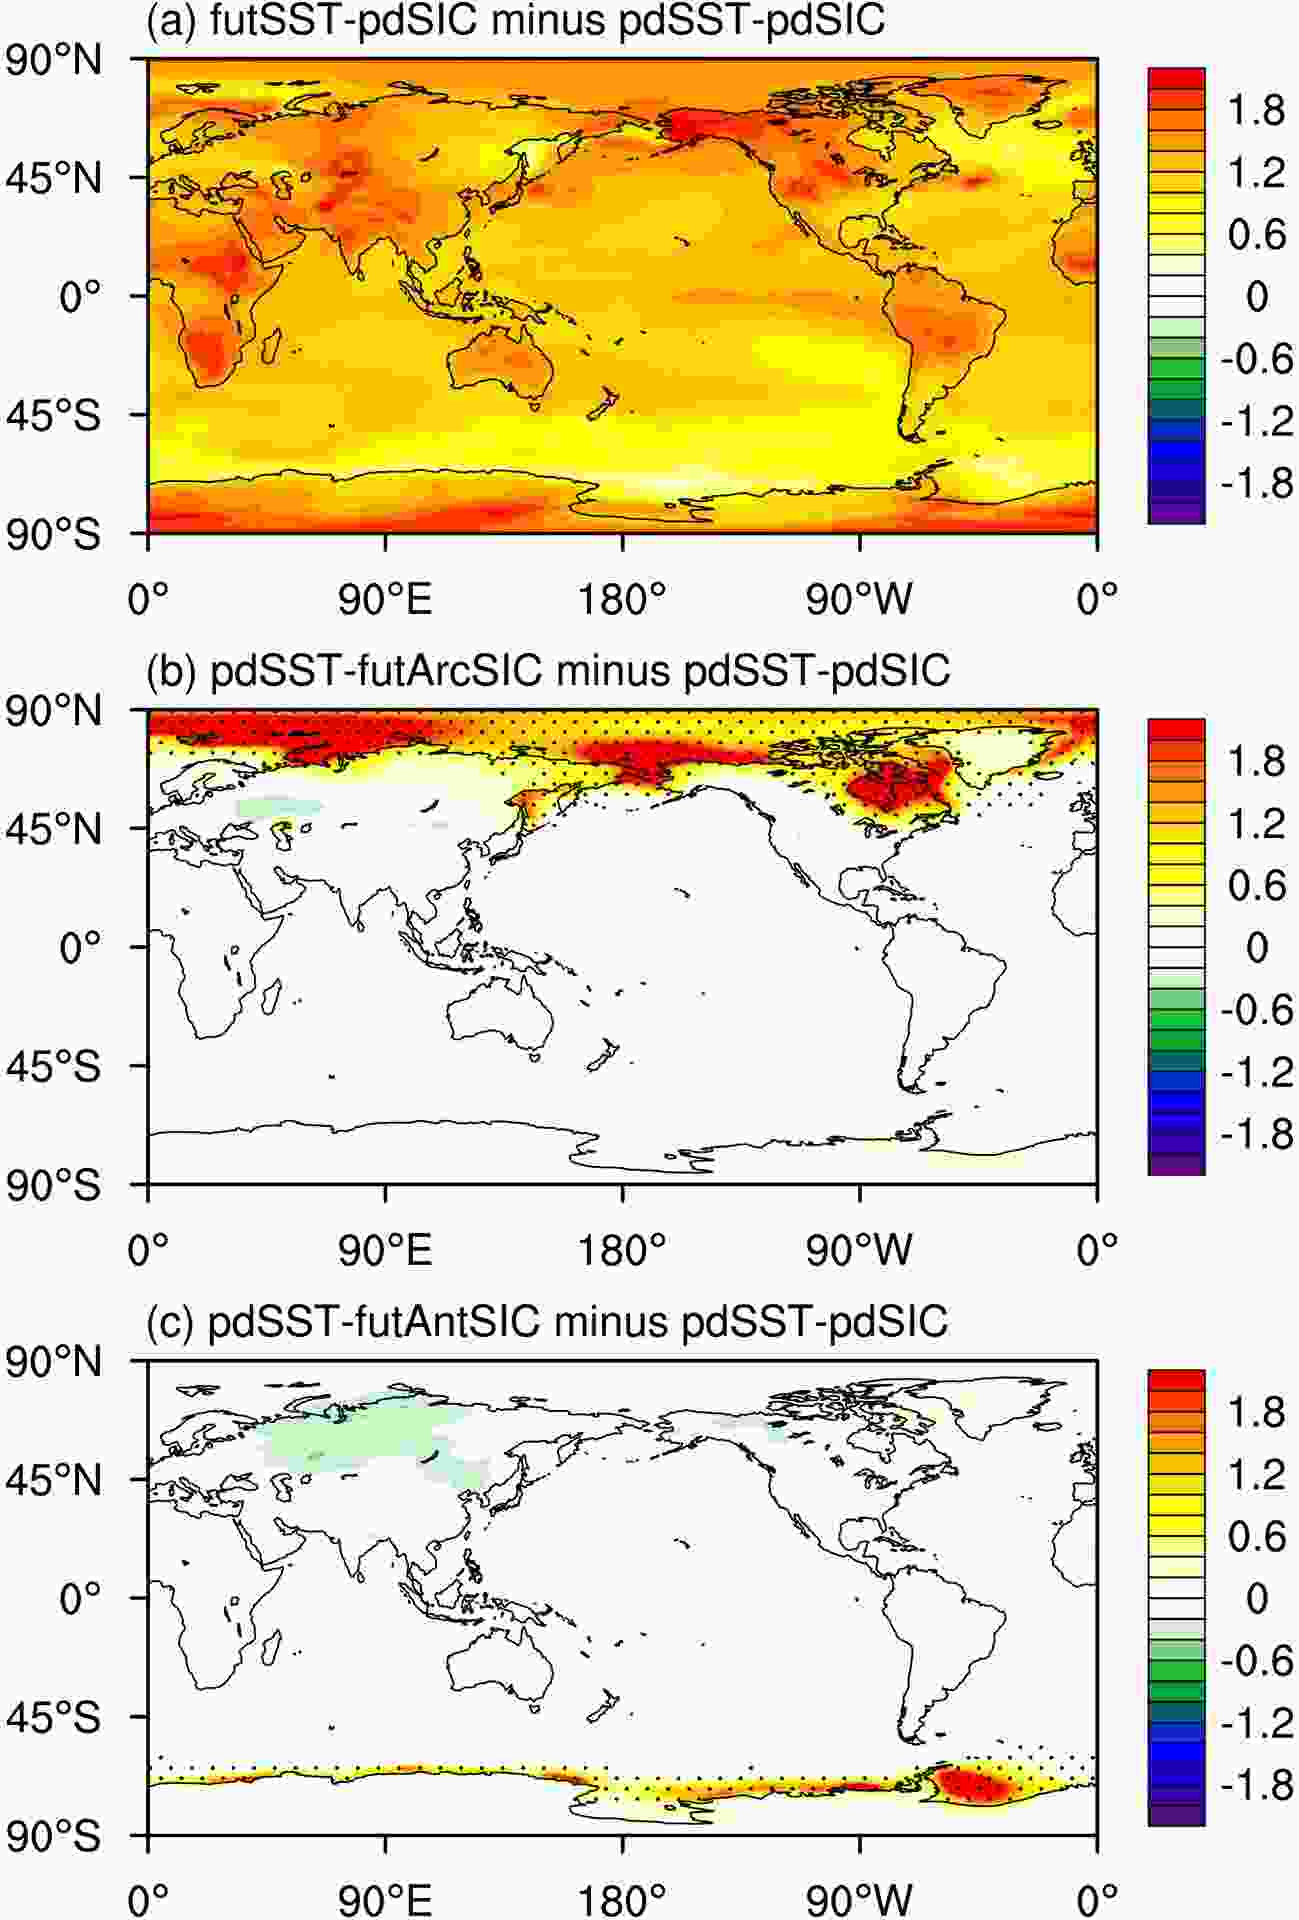 Figure10. Spatial pattern of ensemble mean differences in annual mean SAT (°C) response in the following experiments: (a) futSST-pdSIC minus pdSST-pdSIC, (b) pdSST-futArcSIC minus pdSST-pdSIC, and (c) pdSST-futAntSIC minus pdSST-pdSIC. All the SAT responses in (a) and the black dots in (b) and (c) are statistically significant at the 99% confidence level according to Student’s t test.
Interestingly, the Antarctic mainland is much warmer than the mid- and high-latitude oceans in the Southern Hemisphere, which is quite different from the response to present-day forcing (Fig. 6b). This result implies that SST warming could contribute to polar amplification in the Southern Hemisphere in the future. The SAT response to future changes in Arctic SIC forcing (pdSST-futArcSIC minus pdSST-pdSIC) is shown in Fig. 10b, which shows that SAT warming mainly occurs in the Arctic region where the prescribed SIC decreases (Fig. 4c). The increase in SAT exceeds 1.8°C over the Barents/Kara Sea, the Bering Strait, Hudson Bay, Baffin Bay, and the Greenland Sea, which contributes to Arctic amplification in future projections.
For the future Antarctic SIC decrease (Fig. 10c), the SAT anomaly increases mainly along the coast of the western Antarctic mainland, and a large warming area appears over the Weddell Sea. The surface warming also corresponds with the decrease in SIC in Fig. 4f but does not show a one-to-one correspondence: the SIC decreases 20%–25% over the Amundsen Sea and 5%–10% over the Weddell Sea. This result implies that atmospheric dynamics play an important role in surface warming in the Antarctic.
The precipitation responses to future changes in SST and SIC are shown in Fig. 11. For the future global SST forcing changes (Fig. 11a), precipitation mainly increases along the Intertropical Convergence Zone (ITCZ), middle latitudes in the South Pacific, and high latitudes in the northern Pacific. The precipitation also shows a weak decrease in South Asia, especially on the Indo-China peninsula. This pattern is generally similar to the precipitation response to the present-day SST forcing changes (Fig. 7b), but the positive precipitation anomaly over the tropical Indian Ocean and southeastern Pacific declines in the future projection (Fig. 11a). The precipitation responses to the future Arctic SIC changes (pdSST-futArcSIC minus pdSST-pdSIC) and the future Antarctic SIC changes (pdSST-futAntSIC minus pdSST-pdSIC) are shown in Figs. 11b and 11c, respectively. In these two pairs of experiments, the precipitation responses are weak and show only a small decrease on the Maritime Continent and a small increase over the middle Pacific. The above results indicate that the precipitation responses to the future SST and SIC forcings are more or less similar to the responses to the present-day forcings, although the magnitude of the future SST and SIC changes is larger than that of the present-day changes.
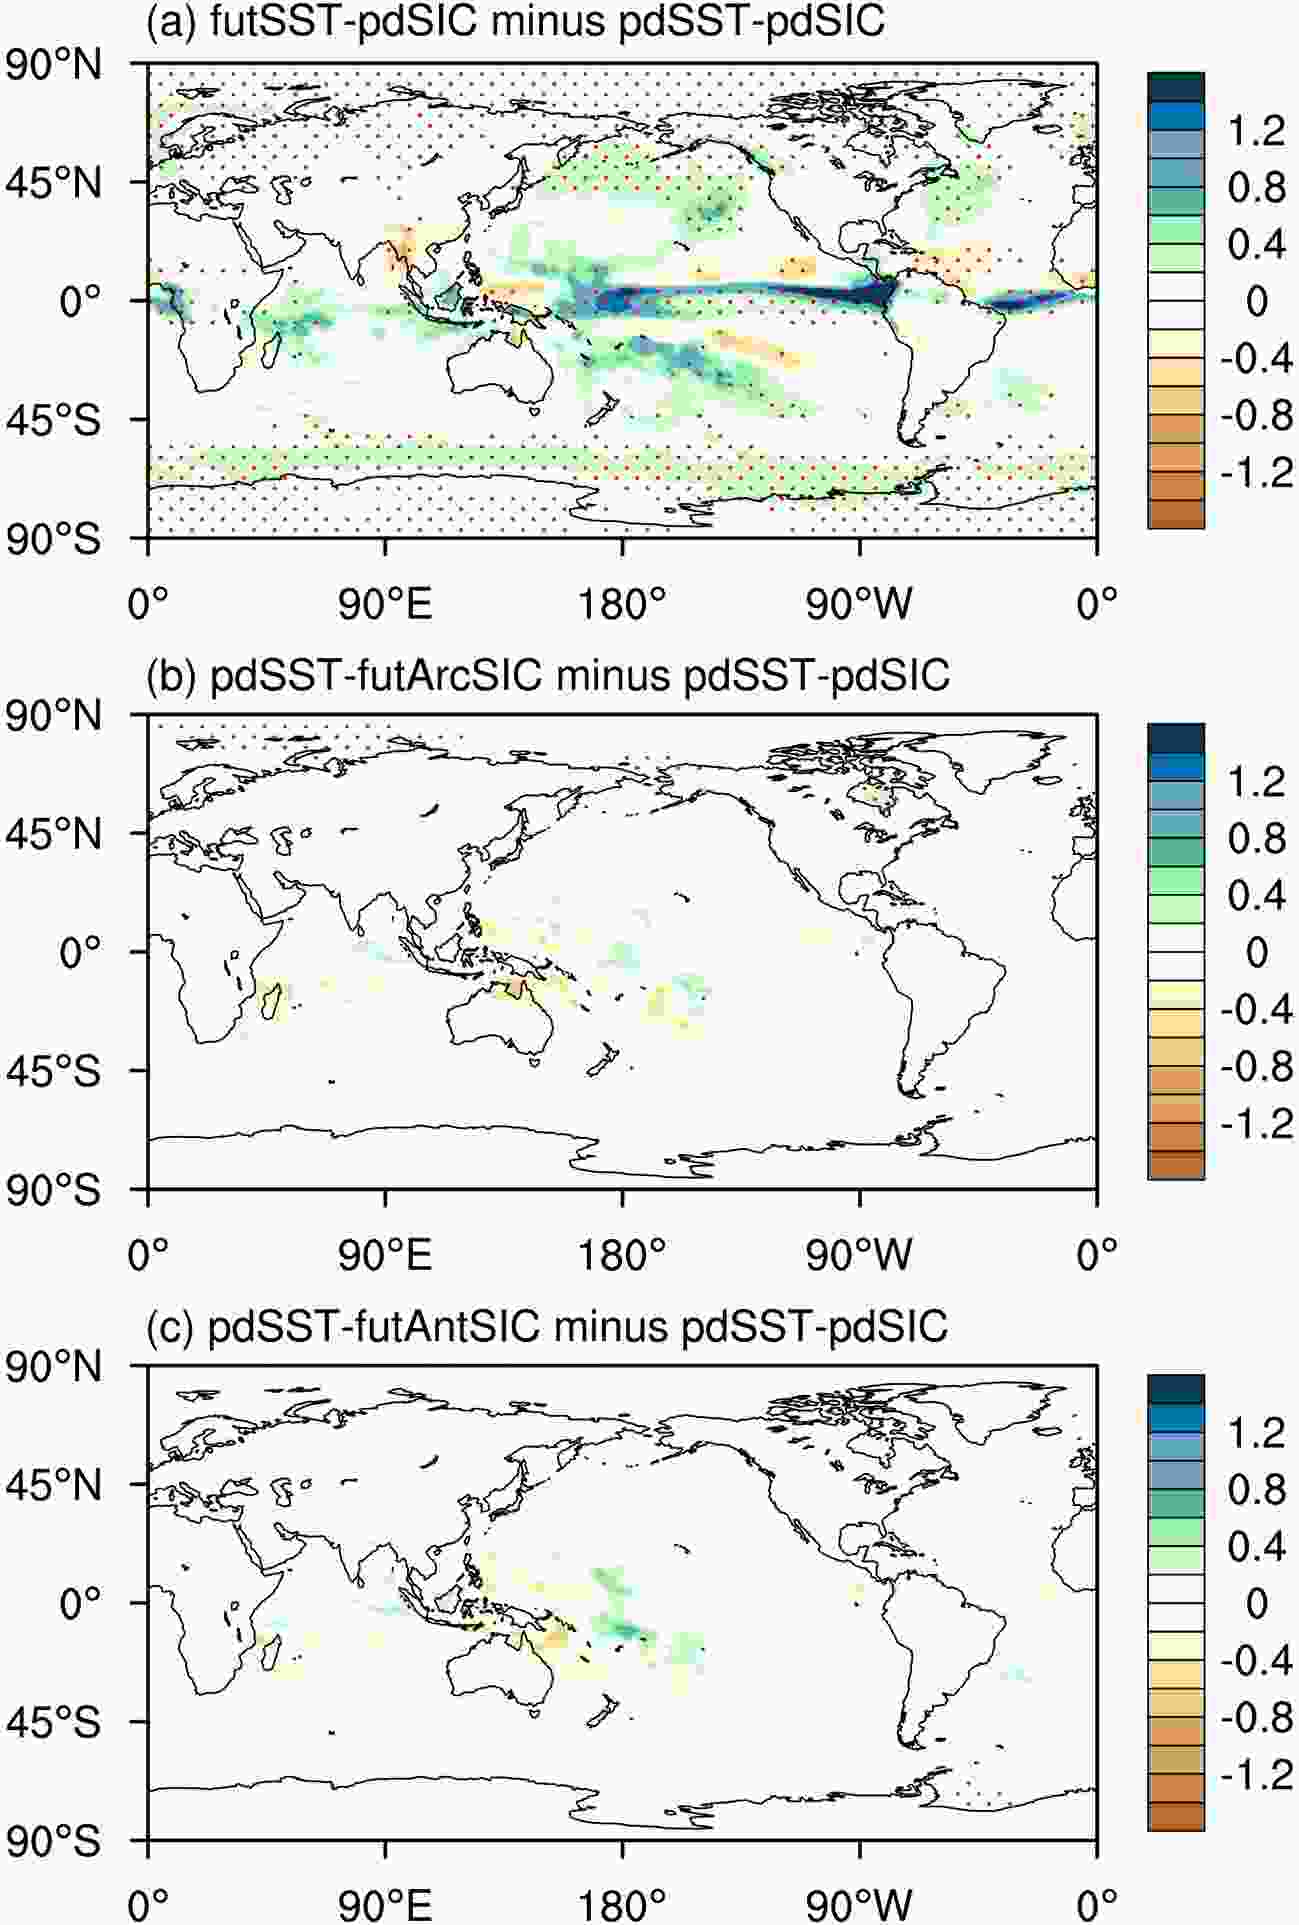 Figure11. Spatial pattern of ensemble mean differences in annual mean precipitation (mm d?1) response in the following experiments: (a) futSST-pdSIC minus pdSST-pdSIC, (b) pdSST-futArcSIC minus pdSST-pdSIC, and (c) pdSST-futAntSIC minus pdSST-pdSIC. The red dots denote the values that are statistically significant at the 99% confidence level according to Student’s t test.
To estimate the large-ensemble spread of the annual mean SAT and precipitation response to the future changes in global SST and SIC and to compare the future climate response with the present-day climate response, we show the PDF analysis for all the future experiments in Fig. 12. Under the future SST forcing changes (Fig. 12a, futSST-pdSIC minus pdSST-pdSIC), 30% of cases simulate an SAT increase of 1.22°C. The SAT anomaly maximum is approximately 1.38°C for 5% of cases, and the minimum is approximately 1.12°C for 2% of cases. These SAT responses are stronger overall than the large-ensemble simulations of the present-day responses (Fig. 8c).
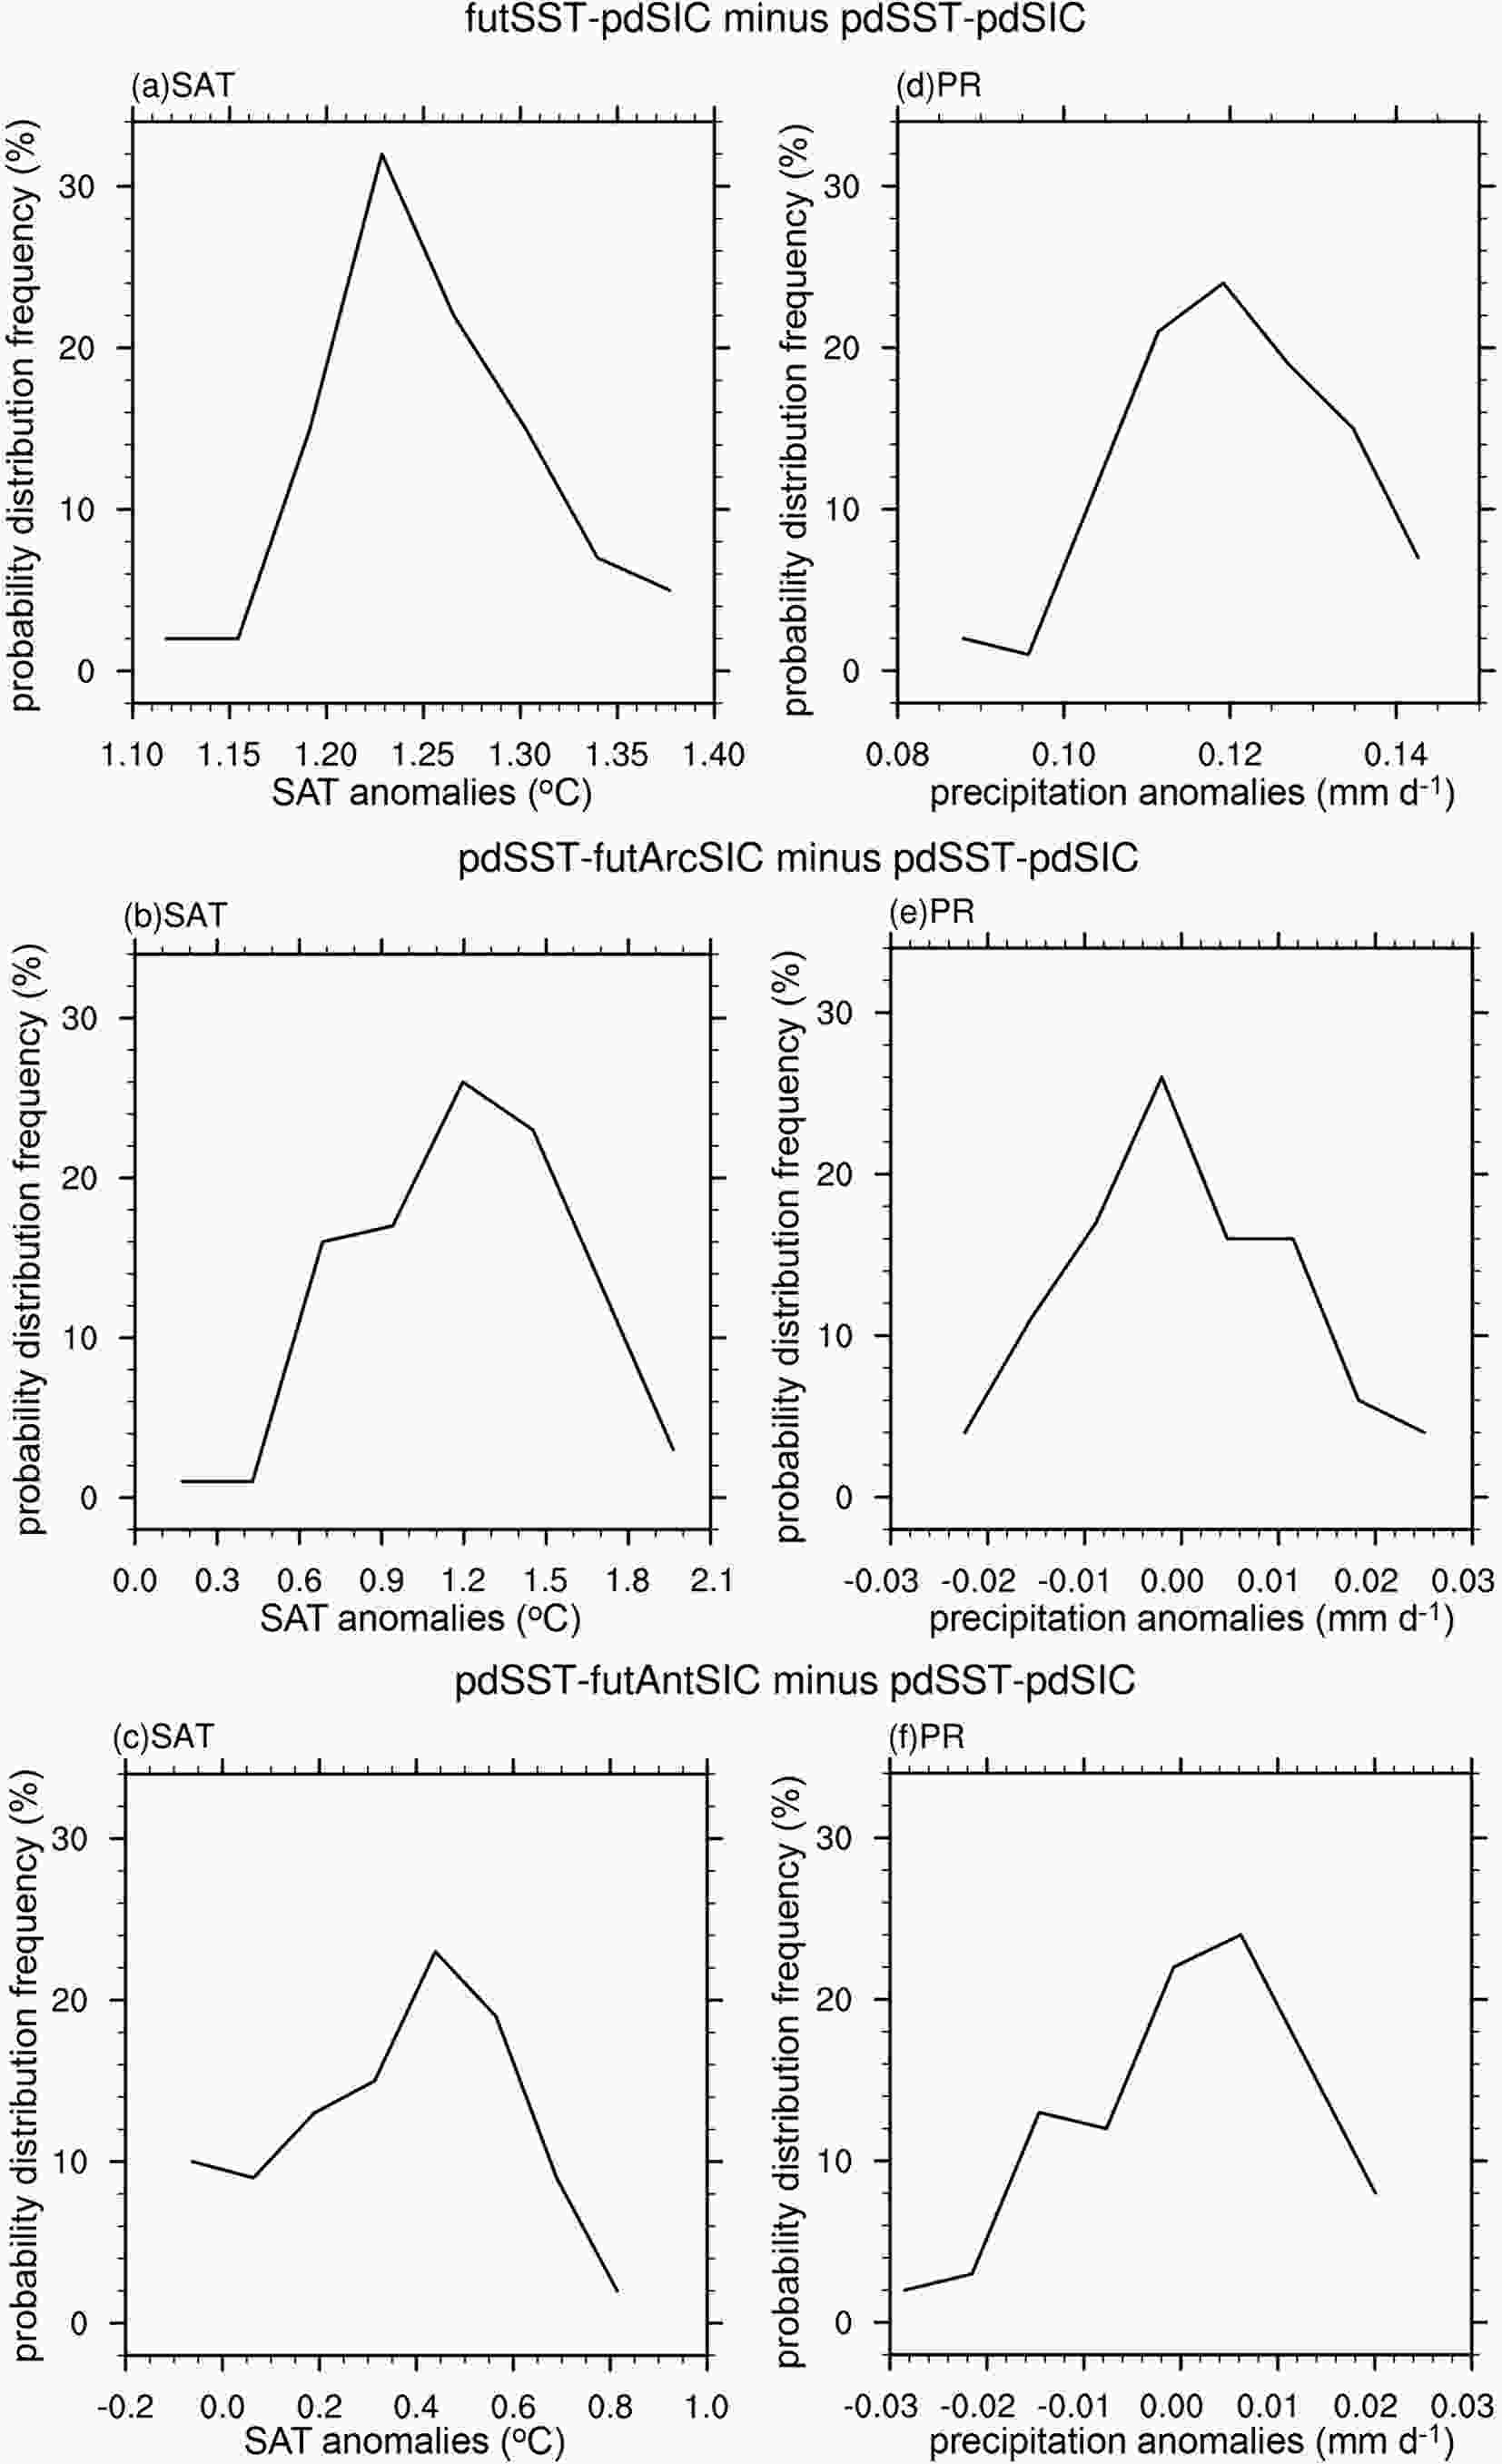 Figure12. Probability density distribution of (a) global mean SAT anomalies of futSST-pdSIC minus pdSST-pdSIC, (b) regional mean (60°–90°N) SAT anomalies of pdSST-futArcSIC minus pdSST-pdSIC, and (c) regional mean (60°–90°S) SAT anomalies of pdSST-futAntSIC minus pdSST-pdSIC. The abscissa denotes the SAT anomalies (°C), and the vertical coordinate denotes the associated probability density distribution. Probability density distribution of regional mean (45°S–45°N) precipitation anomalies for the experiments of (d) futSST-pdSIC minus piSST-pdSIC, (e) pdSST-futArcSIC minus pdSST-pdSIC, and (f) pdSST-futAntSIC minus pdSST-pdSIC. The abscissa denotes the precipitation anomalies (mm day?1), and the vertical coordinate denotes the associated probability density distribution.
The regional SAT responses over high latitudes in the Northern Hemisphere (60–90°N) to the future Arctic SIC changes (Fig. 12b) are approximately 1.2°C for 26% of cases, with a maximum of 2.0°C for 2% of cases and 0.2°C for 2% of cases. This PDF also supports our previous analysis of ensemble mean results showing that the SAT response to future forcing is higher overall than the present-day response (Fig. 8b). For the cases of pdSST-futAntSIC minus pdSST-pdSIC (Fig. 12c), the SAT responses to the Antarctic SIC forcing show an increase of 0.4°C for nearly 22% of cases, with a maximum of 0.8°C for 1% of cases and a minimum of ?0.1°C for another 10% of cases.
For the PDF of the precipitation responses to the future SST forcing changes (Fig. 12d), almost 24% of cases simulate an increase in low-latitude mean precipitation of 0.12 mm d?1, while nearly 8% of cases simulate 0.14 mm d?1 for the maximum and 2% of cases simulate 0.09 mm d?1 for the minimum. Compared to the present-day response (Fig. 9c), the precipitation anomaly is more strongly associated overall with the warmer SST in the future. The PDF for the precipitation response to the future Arctic SIC forcing changes shows that precipitation will decrease for nearly 50% of cases and increase for the other 50% of cases. This distribution is quite similar to the precipitation responses to the future Antarctic SIC forcing changes (Fig. 12f), which are both close to the present-day responses in Figs. 9b and 9d. These results suggest that the influence of global SIC forcing on precipitation remains largely uncertain. The reasons and the associated physical mechanisms need further study through the diagnosis of atmospheric dynamics.
The relative effects of SST and SIC and their combined effect on Arctic amplification are discussed here by using the large-ensemble simulations of No.1.1 (pdSST-pdSIC), No.1.2 (piSST-piSIC), No.1.3 (piSST-pdSIC), and No.1.5 (pdSST-piArcSIC). We define the present-day changes in SAT at high latitudes (60–90°N) calculated by the differences between pdSST-pdSIC and piSST-piSIC as SATall for the combined effect of global SST and Arctic SIC on Arctic amplification. The differences between pdSST-pdSIC and piSST-pdSIC are denoted by SATsst for the effect of global SST alone. The differences between pdSST-pdSIC and pdSST-piArcSIC are denoted by SATArc for the effect of Arctic SIC alone. Moreover, the sum of SATsst and SATArc is denoted by SATsum, which represents the linear effect of SST and SIC. The comparison of SATsum and SATall could serve as an estimate of the combined influence of SST and SIC on Arctic amplification.
We provide a scatter plot of the annual mean SAT responses by using the large-ensemble members in Fig. 13. The abscissa represents SATall, and the vertical coordinate denotes SATsst for red dots, SATArc for black five-pointed stars, and SATsum for blue asterisks. The linear regressions of SATsst, SATArc, and SATsum on SATall are also represented by the regression lines of the corresponding colors. The regression coefficients are shown in the upper left corner. The results suggest that the SAT responses to global SST alone (SATsst) could contribute to almost half of the SAT changes through the combined effects of SST and SIC (SATall), with regression coefficients of 0.43. The SAT responses to Arctic SIC alone (SATArc) could contribute to more than half of the SAT changes induced by the combined effects of SST and SIC (SATall), with regression coefficients of 0.60. The linear sum (SATsum) of SATsst and SATArc is compatible with SATall, and the regression coefficient is 1.02. This result also implies that the Arctic amplification featured by the accelerated surface warming rate in the Arctic regions can be roughly estimated by the direct sum of the SAT changes from the independent SST and SIC forcing experiments. Furthermore, the combined influence of SST and SIC tends to weaken their influence on Arctic amplification.
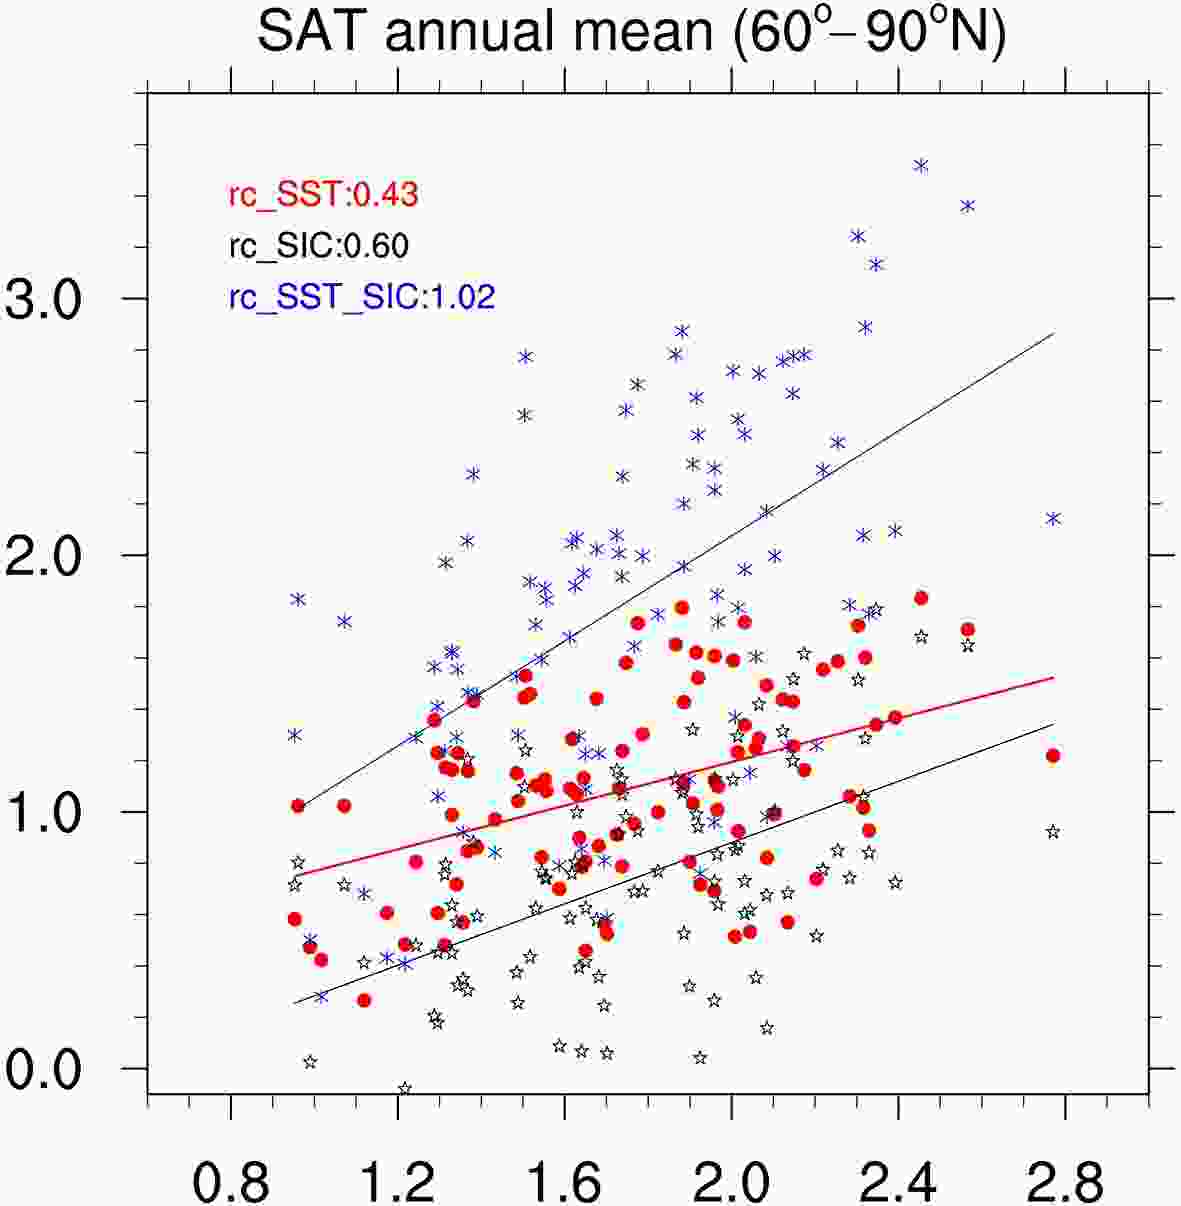 Figure13. Scatter plot of the annual mean SAT responses for the 60°–90°N mean by using the large-ensemble simulations of No.1.1 (pdSST-pdSIC), No.1.2 (piSST-piSIC), No.1.3 (piSST-pdSIC), and No.1.5 (pdSST-piArcSIC). The abscissa denotes SATall (pdSST-pdSIC minus piSST-piSIC), and the vertical coordinate denotes SATsst (pdSST-pdSIC minus piSST-pdSIC) for red dots, SATArc (pdSST-pdSIC minus pdSST-piArcSIC) for black five-pointed stars, and SATsum (SATsst plus SATArc) for blue asterisks. The linear regressions of SATsst, SATArc, and SATsum on SATall are also represented by the regression lines in the corresponding colors. The regression coefficients are shown in the upper left corner.
Finally, the main conclusions of this paper are as follows. The CAS FGOALS-f3-L climate model was used to carry out the atmosphere-only time-slice experiments of PAMIP from No.1.1 to No.1.8 and considers different combinations of global SST, Arctic SIC and Antarctic SIC for both present-day and future changes. The time-lag method was used for the generation of the initial fields for the large-ensemble simulations. Each group contained 100 members and was integrated from 1 April 2000 to 30 June 2001. The preliminary analysis of the SAT and precipitation responses to the present-day and future forcing suggests that Arctic amplification is dominantly controlled by changes in Arctic SIC. The SAT responses to Arctic SIC loss show a strong increase over high latitudes, which is similar to the results from the combined forcing of SST and SIC. However, the changes in global precipitation for the present day are dominated by the changes in global SST relative to the changes in SIC, partly because tropical precipitation is mainly driven by local SST forcing. The future model response is similar overall to the present-day response; in particular, the future response is stronger than the present-day response due to the larger forcing changes.
The uncertainty of the model responses was also investigated by the analysis of the large-ensemble members. The global SAT response to the present-day global SST and SIC forcing shows overall positive anomalies that range from 0.9°C (5% of cases) to 1.1°C (5% of cases), and SAT ranges from 1.12°C (2% of cases) to 1.38°C (5% of cases) for future forcing changes, while the low-latitude precipitation response shows a range of 0.062 mm d?1 (2% of cases) to 0.108 mm d?1 (5% of cases) for present-day forcing changes and 0.09 mm d?1 (2% of cases) to 0.14 mm d?1 (8% of cases) for future forcing changes. All of the above model experiments and results will contribute to the PAMIP multimodel analysis and improve the understanding of polar amplification.
It is necessary to note that the conclusions made in this study still remain model dependent from the perspective of both the model physics and experimental design. The atmosphere-only experiments in PAMIP can only diagnose the effects forced by SST and SIC alone. The roles of air-sea interactions and the interactions between the ocean and sea ice cannot be investigated with this kind of experiment. These interactions are important for the simulations of meridional atmospheric and oceanic heat transport and the associated climate feedback processes, which are also important for the understanding of polar amplification and the prediction of future climate change. Therefore, similar experiments using an air-sea coupled model will be performed in the future for comparison with the atmospheric model results.
Multimodel analysis is another approach used to reduce the uncertainties arising from individual model results. Multimodel ensemble analysis of all the PAMIP model outputs is also encouraged to be carried out for more robust conclusions in understanding the causes and effects of polar amplification. Finally, this paper presents the SAT and precipitation responses to SST and SIC forcing, but the associated physical processes are not fully discussed. In particular, how Arctic and Antarctic SIC influence low-latitude weather and climate change is the next topic we would like to address in future studies.
| short name | Long name | Frequency |
| rlut | TOA outgoing longwave radiation | Monthly |
| rsdt | TOA incident shortwave radiation | Monthly |
| rsut | TOA outgoing shortwave radiation | Monthly |
| rlutcs | TOA outgoing clear-sky longwave radiation | Monthly |
| rsutcs | TOA outgoing clear-sky shortwave radiation | Monthly |
| rlds | surface downwelling longwave radiation | Monthly, 3 h |
| rlus | surface upwelling longwave radiation | Monthly, 3 h |
| rsds | surface downwelling shortwave radiation | Monthly, 3 h |
| rsus | surface upwelling shortwave radiation | Monthly, 3 h |
| rldscs | surface downwelling clear-sky longwave radiation | Monthly, 3 h |
| rsdscs | surface downwelling clear-sky shortwave radiation | Monthly, 3 h |
| rsuscs | surface upwelling clear-sky shortwave radiation | Monthly, 3 h |
| tauu | surface downward eastward wind stress | Monthly |
| tauv | surface downward northward wind stress | Monthly |
| hfss | surface upward sensible heat flux | Monthly, 3 h |
| hfls | surface upward latent heat flux | Monthly, 3 h |
| pr | precipitation | Monthly, daily, 3 h |
| evspsbl | evaporation | Monthly |
| ts | surface skin temperature | Monthly |
| tas | near-surface air temperature | Monthly, daily, 3 h |
| tasmax | daily maximum near-surface air temperature | Monthly, daily |
| tasmin | daily minimum near-surface air temperature | Monthly, daily |
| uas | eastward near-surface wind | Monthly, 3 h |
| vas | northward near-surface wind | Monthly, 3 h |
| sfcWind | near-surface wind speed | Monthly |
| huss | near-surface specific humidity | Monthly, daily, 3 h |
| hurs | near-surface relative humidity | Monthly, daily |
| clt | total cloud fraction | Monthly, 3 h |
| ps | surface air pressure | Monthly, 3 h |
| psl | sea level pressure | Monthly, daily |
| prsn | snow fall flux | Monthly, 3 h |
| ta | air temperature | Monthly |
| ua | eastward wind | Monthly |
| va | northward wind | Monthly |
| wap | Vertical velocity | Monthly |
| hus | specific humidity | Monthly |
| hur | relative humidity | Monthly |
| zg | geopotential height | Monthly |
Table3. CAS FGOALS-f3-L output variables prepared for PAMIP.
Acknowledgements. The research presented in this paper was jointly funded by the Strategic Priority Research Program of the Chinese Academy of Sciences (Grant No. XDA19070404) and the National Natural Science Foundation of China (Grant Nos. 42030602, 91837101 and 91937302).
Open Access This article is distributed under the terms of the Creative Commons Attribution License which permits any use, distribution, and reproduction in any medium, provided the original author(s) and the source are credited. This article is distributed under the terms of the Creative Commons Attribution 4.0 International License (
