HTML
--> --> --> The long-term warming of the ocean is a critical indicator of both the past and present state of the climate system. It also provides insights about the changes to come, owing to the persistence of both decadal variations and secular trends, which the ocean records extremely well (Hansen et al., 2011; IPCC, 2013; Rhein et al., 2013; Trenberth et al., 2016; Abram et al., 2019). It is well established that the emission of greenhouse gasses by human activities is mainly responsible for global warming since the industrial revolution (IPCC, 2013; Abram et al., 2019). The increased concentration of heat-trapping greenhouse gases in the atmosphere has interfered with natural energy flows. Currently there is an energy imbalance in the Earth’s climate system of almost 1 W m?2 (Trenberth et al., 2014; von Schuckmann et al., 2016, 2020a; Wijffels et al., 2016; Johnson et al., 2018; Cheng et al., 2019a; von Schuckmann et al., 2020a). Over 90% of this excess heat is absorbed by the oceans, leading to an increase of ocean heat content (OHC) and sea level rise, mainly through thermal expansion and melting of ice over land. These processes provide a useful means to quantify climate change.The first global OHC time series by Levitus et al. (2000) identified a robust long-term 0?3000 m ocean warming from 1948?98. Since then, many other analyses of global and regional OHC data have been performed. Here, we provide the first analysis of recent ocean heating, incorporating 2020 measurements through 2020 into our analysis. These state-of-the-art data products are made available by the Institute of Atmospheric Physics (IAP), which is part of the Chinese Academy of Sciences (CAS) (Cheng et al., 2017) and the National Centers for Environmental Information (NCEI) of the National Oceanic and Atmospheric Administration (NOAA) (Levitus et al., 2012). Both datasets have corrected systematic errors and then use comprehensive mapping methods to convert discrete ocean measurements into a comprehensive picture of the ocean (see Methods).
The most recent data indicate that the OHC in the upper 2000 m layer of the world’s oceans has increased with a mean rate of 5.7 ± 1.0 ZJ yr?1 for the 1958?2020 period (IAP/CAS) (Fig. 1). There is a more rapid increase in OHC that began ~1980s and has continued unabated since then (Fig. 1). Since 1986, the average annual increase is 9.1 ± 0.3 ZJ yr?1 (1986 to 2020), almost eight times larger than the linear rate from 1958~1985 (1.2 ± 0.6 ZJ yr?1). Further, the uncertainty has decreased as improved instruments (e.g., Argo) and analysis methods have become available (Cheng et al., 2017; Argo, 2020) (Fig. 1). Moreover, each decade has been warmer than its preceding decade.
 Figure1. (Upper) Global upper 2000 m OHC from 1958 through 2020. The histogram presents annual anomalies relative to a 1981?2010 baseline, with positive anomalies shown as red bars and negative anomalies as blue. (Bottom) Global 0?500 m, 500?1000 m, 1000?1500 m, and 1500?2000 m OHC stripes from 1958 to 2020. Units: ZJ.
The 2020 OHC value is higher than the last year’s value, by 20 ± 8.3 ZJ using the IAP/CAS data, and by 1 ± 3.5 ZJ using NOAA/NCEI. Both are the highest on record (Table 1). Differences between the OHC analyses reflect the uncertainties in the calculation due to method and data coverage. OHC values herein are preliminary and will be augmented by ocean profile data which are not immediately available at the end of the year (but added later), and by calibration and quality control processes which also occur on longer time scales. Further quantification of the uncertainties in OHC will help to better specify the confidence in OHC assessment. Even taking into account these caveats, IAP and NCEI OHC values both indicate a continued warming of the ocean, even though a year marked by a prominent La Ni?a event. Efforts are underway to better understand the differences of OHC between IAP and NCEI, and between gridded analysis with other indirect measurements such as TOA data and sea level data.
| Rank | Year | IAP | NOAA/NCEI |
| 1 | 2020 | 234 | 211 |
| 2 | 2019 | 214 | 210 |
| 3 | 2017 | 202 | 189 |
| 4 | 2018 | 195 | 196 |
| 5 | 2015 | 186 | 180 |
Table1. Ranked order of the hottest five years of the ocean, since 1955. The OHC values are anomalies for the upper 2000 m in units of ZJ relative to the 1981?2010 average.
Figure 2 separately displays accumulated thermal energy in the layers 0–300-m, 300–700-m, 700–2000-m, and below-2000-m. We rely upon deep-ocean heating information (updated from Purkey and Johnson 2010) for heating rates below 2000 m and apply a linear rate of OHC increase of 1.15 ± 1.0 ZJ yr?1 after 1992. Prior to 1992, negligible deep-ocean heating is assumed (Cheng et al., 2017). The new results indicate a total full-depth ocean warming of 380 ± 81 ZJ (equal to a net heating of 0.39 ± 0.08 W m?2 over the global surface) from 1960 to 2020, with contributions of 40.3%, 21.6%, 29.2% and 8.9% from the 0–300-m, 300–700-m, 700–2000-m, and below-2000-m layers, respectively.
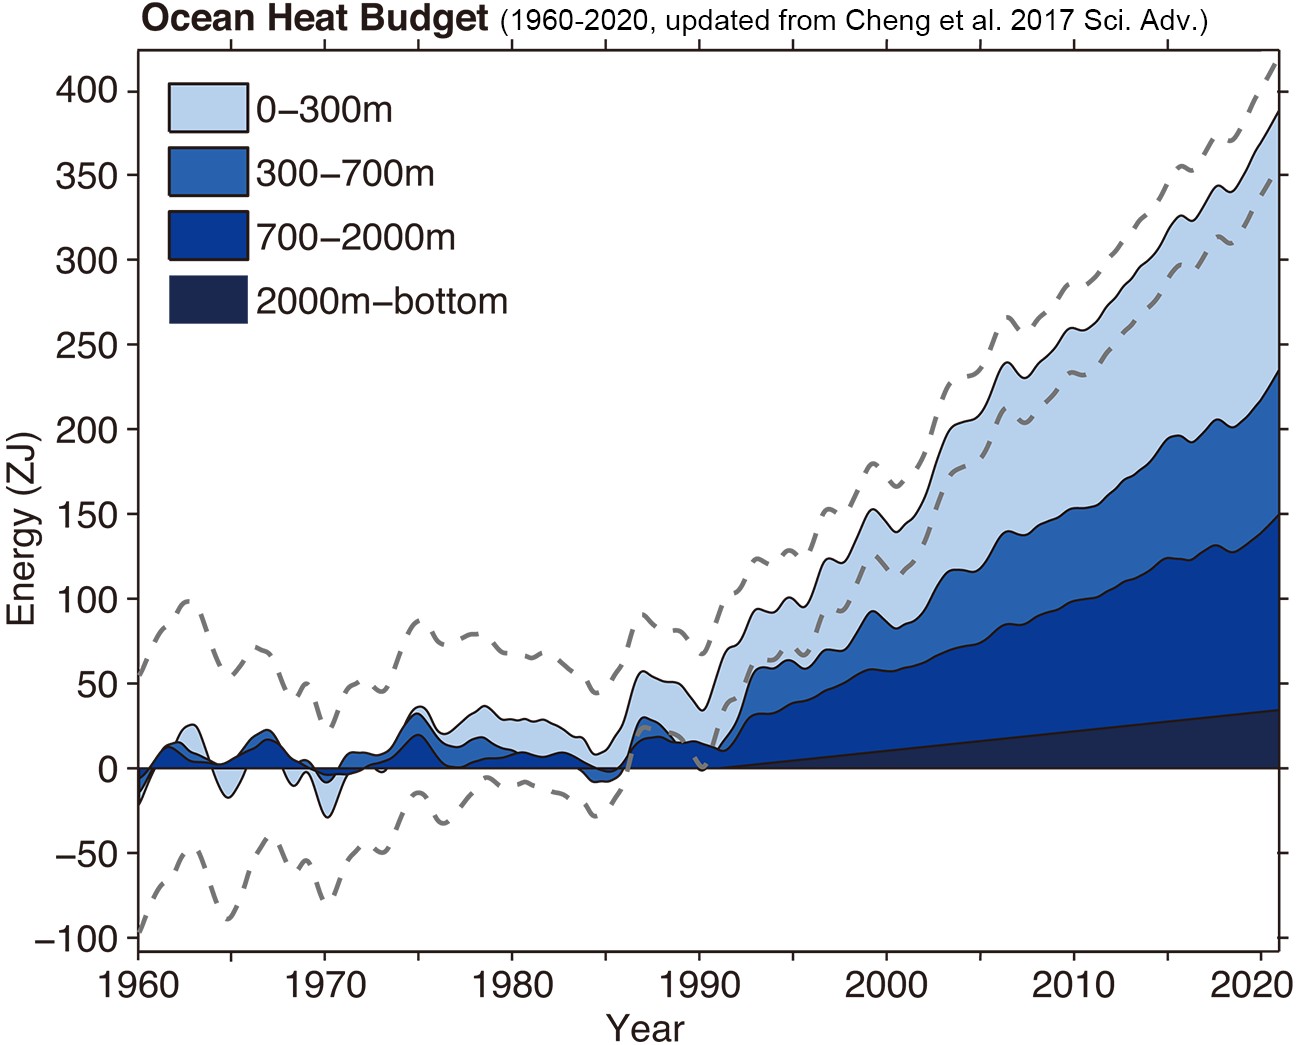 Figure2. Ocean heat budget from 1960 to 2020 based on IAP analysis data from 0 to 2000 m, and from Purkey and Johnson (2010) for deep ocean change below 2000 m (units: ZJ). Figure updated from Cheng et al. (2017). The anomalies are relative to 1958?62 baseline, and the time series are smoothed by LOWESS (locally weighted scatterplot smoothing) with span width of 24 months. The gray dashed lines are the 95% confidence interval of the total ocean heat budget.
A regional assessment of ocean warming (Figs. 3 and 4) is crucial and relevant to community risk assessment and societal adaptation more so than global metrics. The geographical pattern of 2020 OHC relative to 1981?2010 (Fig. 3a) shows warming throughout most of the world’s oceans with higher rates of warming in both the northern and southern Atlantic (except southeast of Greenland), and in localized zones of the Pacific, Indian and Southern Oceans. When compared with 2019 (Fig. 3b), the spatial pattern of OHC anomalies in 2020 is much less distinct because internal variability can overwhelm long-term trends. The Indo-Pacific basin changed from El Ni?o conditions in 2019 and the first six months of 2020 into a La Ni?a state during the last half of 2020. The steeper thermocline during La Ni?a in both the Indian and Pacific Oceans caused the eastern Pacific Ocean to be cooler in 2020 than in 2019. On the other hand, the western Pacific and eastern Indian Oceans were warmer in 2020 (Cheng et al. 2019b). Other warmer regions include the North Pacific and the middle-latitude Atlantic Oceans.
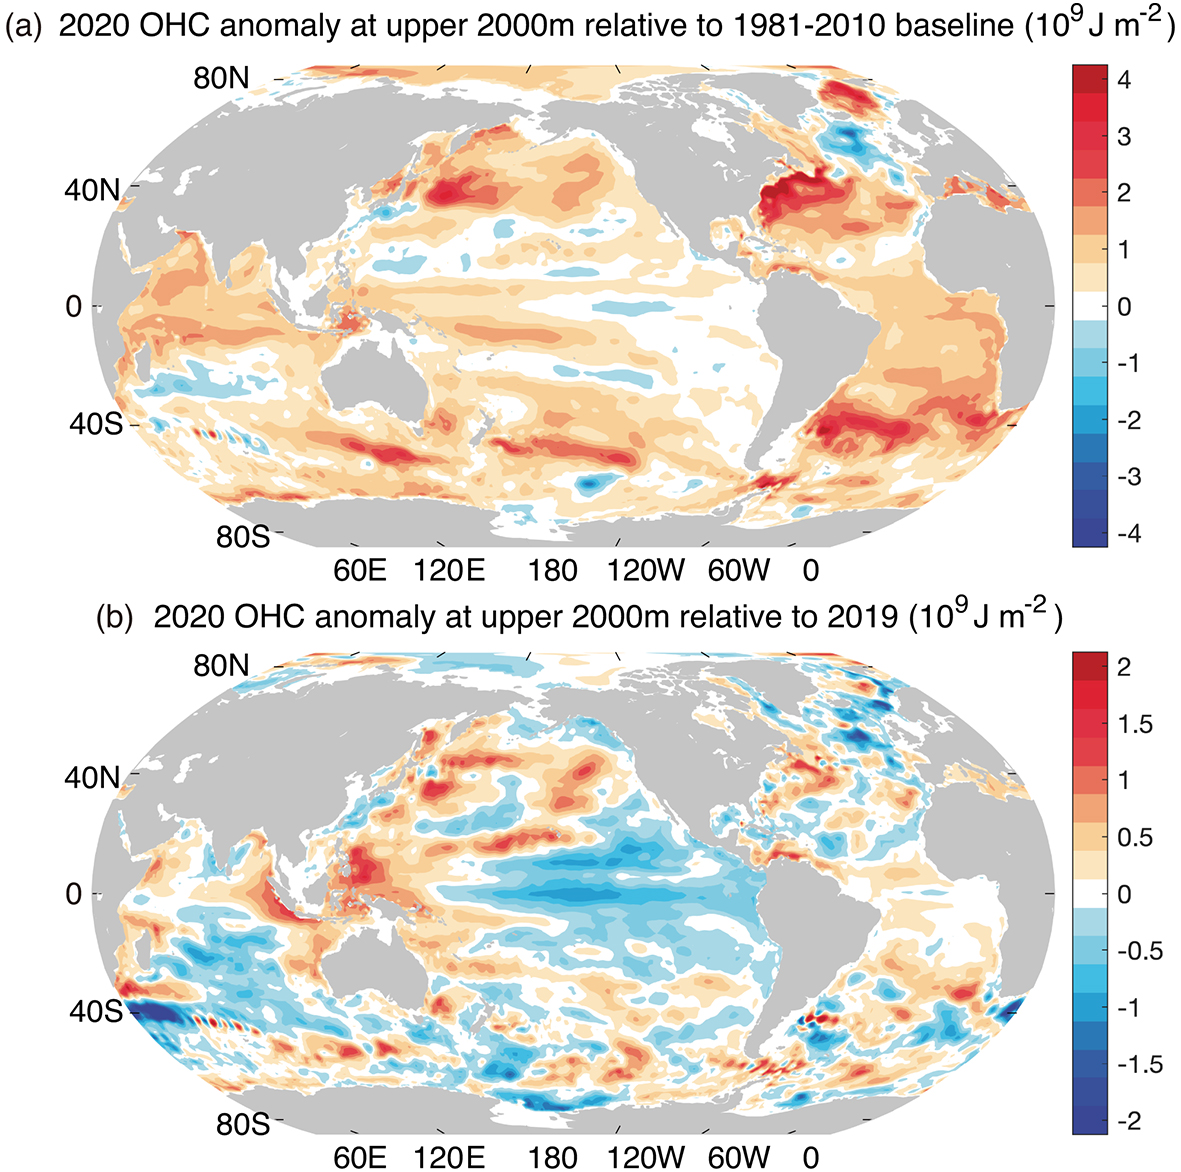 Figure3. (a) Ocean heat content anomaly in 2020 relative to 1981?2010 baseline. (b) difference of OHC at upper 2000 m between 2020 and 2019. Units: 109 J m?2. [Data updated from Cheng et al. (2017)]
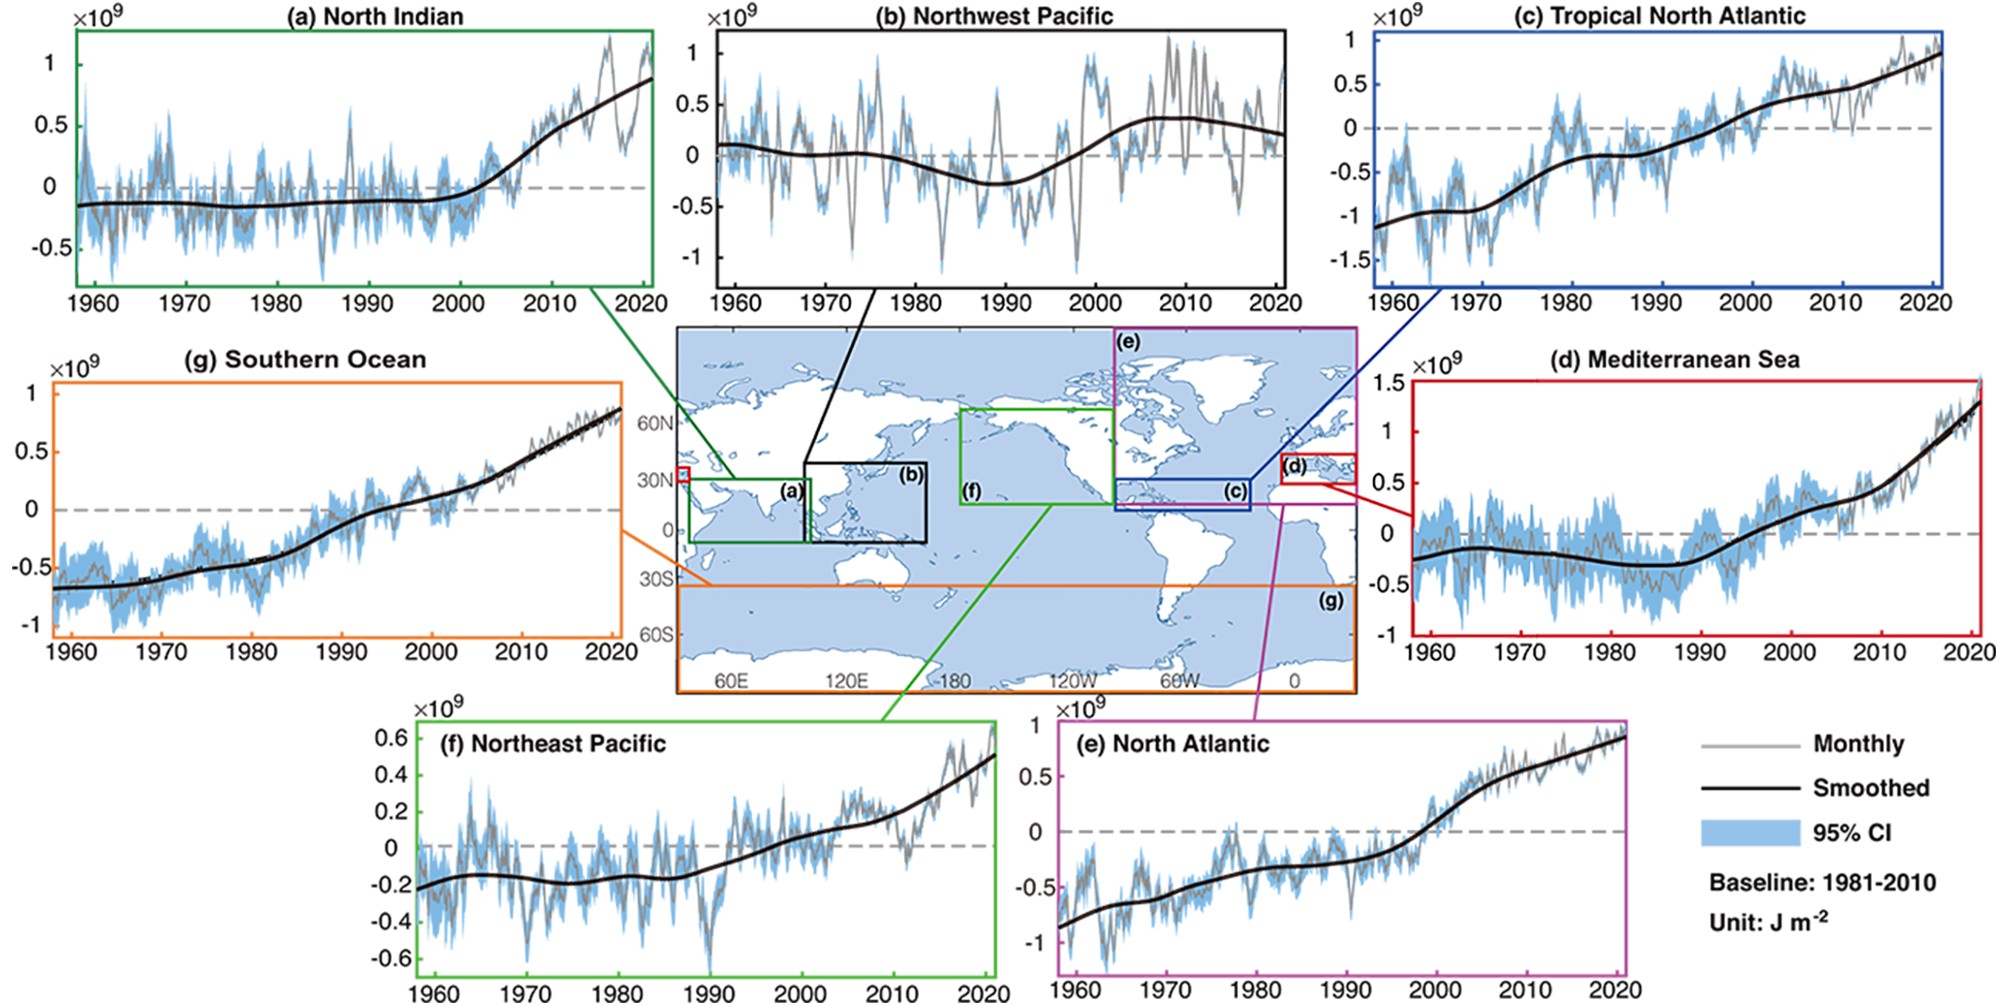 Figure4. Regional observed upper 2000 m OHC change from 1955 through 2020 relative to 1981?2010 baseline. The time series (black) are smoothed by LOWESS (locally weighted scatterplot smoothing) with span width of 24 months. The blue shadings are the 95% confidence interval. [Data updated from Cheng et al. (2017)]
In the North Indian Ocean, relevant to the Middle East and India, OHC started to rise after around 2000 (Fig. 4a).This warming is partially caused by increased heat input from the Pacific Ocean (Li et al., 2018). The Northwest Pacific Ocean is the most active basin for tropical storms on the planet, accounting for one-third of all tropical cyclones. Changes are directly relevant to the weather conditions and societies in East Asia. There (Fig. 4b), OHC shows strong inter-annual and decadal fluctuations, which are predominantly associated with internal climate variability (Cheng et al., 2019b; Wu et al., 2020; Xiao et al., 2020). Nevertheless, the mean OHC in the recent decade (2011?20) is higher than the 1981?2010 average.
In the tropical North Atlantic Ocean, where hurricanes generate and develop, OHC increases have been persistent since at least 1958 (Fig. 4c). The ocean heating supercharges these storms and exacerbates the risk of major flooding and damage (Trenberth et al., 2018). The Mediterranean Sea, surrounded by 22 countries, and an important waterway linking Europe, the Middle East and Asia, is a hotspot of climate change impacts because of the high density of coastal population. Its OHC has a robust increase from the 1990s and a steep increase in the last decade (Fig. 4d) (Storto et al., 2019; von Schuckmann et al., 2020b). The Mediterranean OHC positive anomalies are the largest reported in Fig. 4. The OHC in the North Atlantic Ocean also indicates an upward OHC trend since 1958 (Fig. 4e). However, in the subpolar regions south of Greenland, a long-term cooling trend in the upper 2000 m OHC is evident (the so-called the cold blob or North Atlantic warming hole, Fig. 3a). The cooling continued through 2020 compared with 2019 (Fig. 3b). This cooling is likely linked to changes in Atlantic currents and possibly a weakening Atlantic meridional overturning circulation (AMOC) (Caesar et al., 2018).
A series of marine heat waves developed in the northeast Pacific Ocean within the past decade. The whole ocean food web was severely impacted during these extremes (Cornwall, 2019). For example, according to stock assessment data, the level of mature, spawning cod was halved in the Gulf of Alaska from 2014 to 2017 (Barbeaux et al., 2019). The return of the northeast Pacific warm “blob” is another noticeable ocean condition that was observed in 2020 (Fig. 3b). The marine heat waves have been supported by significant ocean heating since the 1990s (Fig. 4f) and other local anomalies (Scannell et al., 2020). Persistent weather patterns, such as ENSO, lead to regional hot spots and marine heat waves that may last up to a year or so (e.g., in the Tasman Sea, Oliver et al., 2017, 2018), with huge impacts on marine ecosystems and subsequent weather, such as hurricanes (Trenberth et al., 2018; Trenberth and Zhang 2019). The Southern Ocean absorbed the majority of anthropogenic heat in the past century according to model simulations (Fr?licher et al., 2015), contemporaneous with a significant ocean warming since 1958 (Fig. 4g).
The thermal expansion due to ocean warming is the major contributor of sea level rise (SLR) since 1900 (Frederikse et al., 2020). A 380 ± 81 ZJ full-depth ocean warming since 1960 corresponds to about ~47 mm global SLR (thermosteric sea level). With the unequivocal worldwide sea level rise and the projections of unabated rise continuing into the foreseeable future, governments and infrastructure planning must adapt (Oppenheimer et al., 2019). This is particularly important for coastal communities, and is increasingly reflected by changes to engineering design, building codes, and modifications to coastal development plans (Abraham et al., 2015, 2017; Scambos and Abraham, 2015).
Warming of the oceans causes an amplification of the global hydrological cycle (Trenberth et al., 2003; Held and Soden, 2006; Min et al., 2011), which has a strong fingerprint in the ocean salinity field. Evaporation takes freshwater from the ocean and puts it into the atmosphere, increasing ocean salinity. Precipitation returns freshwater to the ocean, reducing the salinity. The ocean salinity shows a “fresh gets fresher, and salty gets saltier” pattern of change in the ocean’s upper 2000 m (Cheng et al., 2020b), which is quantified by a Salinity-Contrast metric (Fig. 5, upper panel). Added thermal energy to ocean waters also provides energy for storms, thereby increasing their precipitation, wind speed, and physical size (Karl and Knight, 1998; Trenberth et al., 2003, 2018; Groisman et al., 2005, 2012; Karl et al., 2009; Kunkel et al., 2013).
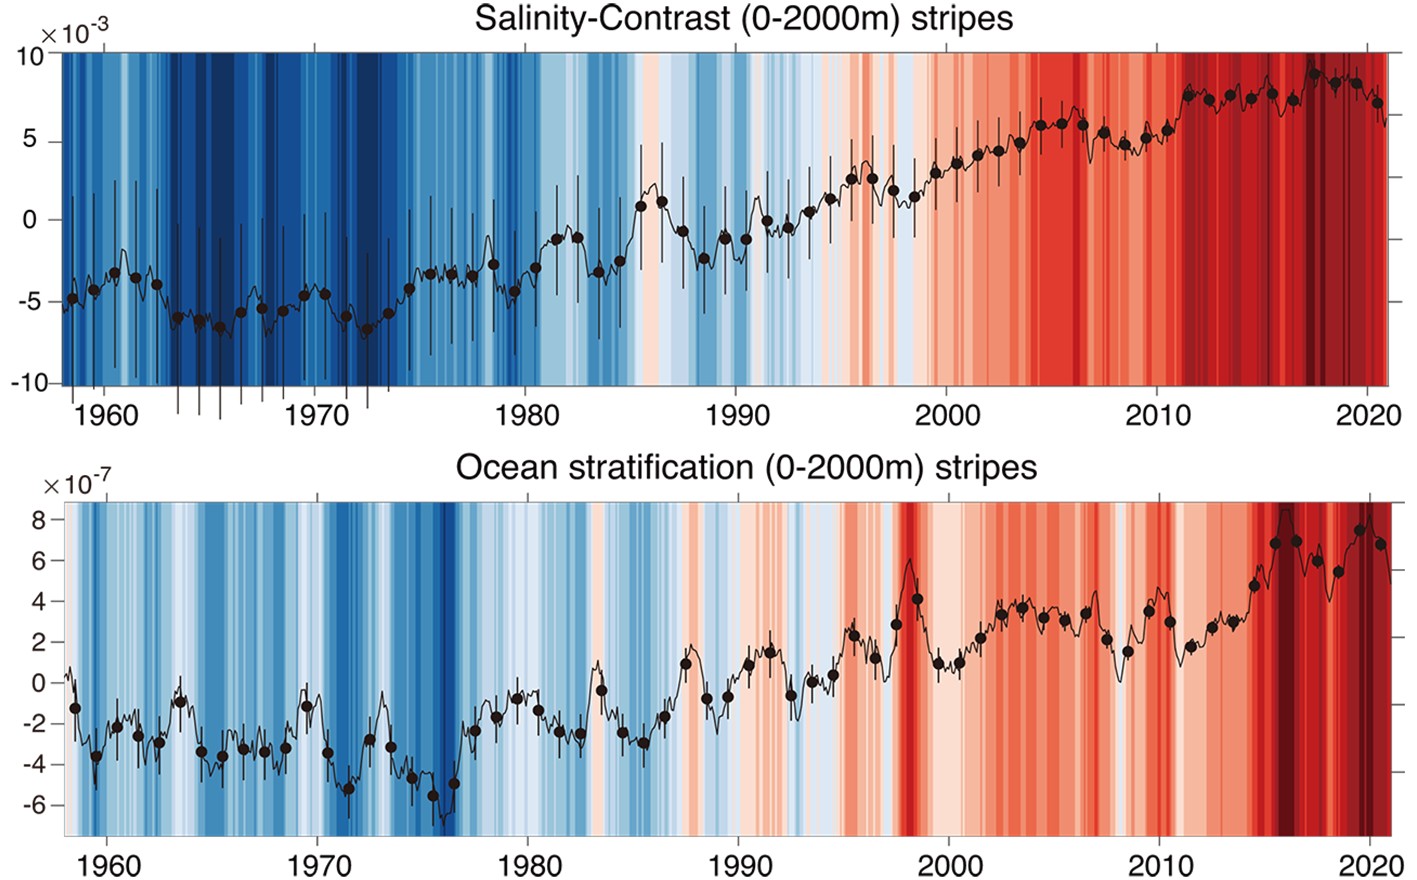 Figure5. Global 0?2000 m Salinity-Contrast (upper, Units: g kg?1) and stratification (below, units: s?2) stripes from 1958 to 2020. The black lines show the monthly means and the black dotted sticks show the annual anomalies with the 95% confidence interval. [Data updated from Cheng et al. (2020b) and Li et al. (2020)]
The stronger ocean warming within upper layers versus deep water has caused an increase of ocean stratification in the past half century (Li et al., 2020) (Fig. 5, bottom panel). With increased stratification, heat from climate warming less effectively penetrates into the deep ocean, which contributes to further surface warming. It also reduces the capability of the ocean to store carbon, exacerbating global surface warming (Kuhlbrodt and Gregory, 2012). Furthermore, climate warming prevents the vertical exchanges of nutrients and oxygen, thus impacting the food supply of whole marine ecosystems (Schmidtko et al., 2017).
By uptaking ~90% of anthropogenic heat and ~30% of the carbon emissions, the ocean buffers global warming (IPCC, 2019). However, the associated ocean response also poses a severe risk to human and natural systems. In 2020, as more countries pledge to achieve “carbon neutrality” or “zero carbon” in the coming decades, the ocean should receive special attention. Any activities or agreements to address global warming must be coupled with the understanding that the ocean has already absorbed an immense amount of heat, and will continue to absorb excess energy in the Earth’s system until atmospheric carbon levels are significantly lowered. In other words, the excess heat already in the ocean, and heat likely to enter the ocean in the coming years, will continue to affect weather patterns, sea level, and ocean biota for some time, even under zero carbon emission conditions (Cheng et al., 2019b; IPCC, 2019; von Schuckmann et al., 2020a). Reasoned decisions regarding mitigation and adaptation strategies for climate change, in addition to social, political, and economic constraints, must consider the current and future states of the world’s oceans.
Acknowledgements. The IAP analysis is supported by the National Key R&D Program of China (Grant No. 2017YFA0603202), the Strategic Priority Research Program of the Chinese Academy of Sciences (Grant No. XDB42040402), and Key Deployment Project of Centre for Ocean Mega-Research of Science, CAS (Grant No. COMS2019Q01). NCAR is sponsored by the US National Science Foundation. The efforts of Dr. FASULLO in this work were supported by NASA Award 80NSSC17K0565, and by the Regional and Global Model Analysis (RGMA) component of the Earth and Environmental System Modeling Program of the U.S. Department of Energy's Office of Biological & Environmental Research (BER) via National Science Foundation IA 1844590. The efforts of Dr. MISHONOV and Mr. REAGAN were partially supported by NOAA (grant NA14NES4320003 to CISESS-MD at the University of Maryland).
