HTML
--> --> --> Human-emitted greenhouse gases (GHGs) have resulted in a long-term and unequivocal warming of the planet (IPCC, 2019). More than 90% of the excess heat is stored within the world’s oceans, where it accumulates and causes increases in ocean temperature (Rhein et al., 2013; Abram et al., 2019). Because the oceans are the main repository of the Earth’s energy imbalance, measuring ocean heat content (OHC) is one of the best ways to quantify the rate of global warming (Trenberth et al., 2016; Von Schuckmann et al., 2016; Cheng et al., 2018). Following reports released in the previous two years (Cheng and Zhu, 2018; Cheng et al., 2019c), this article presents new OHC data for the year 2019. These data reveal that the world’s oceans (especially the upper 2000 m) in 2019 were the warmest in recorded human history. Specifically, the ocean heat anomaly (0?2000 m) in 2019 was 228 Zetta Joules (ZJ, 1 ZJ=1021 Joules) above the 1981?2010 average and 25 ZJ above 2018 (Table 1).| Rank | Year | IAP | NOAA/NCEI |
| 1 | 2019 | 228 | 217 |
| 2 | 2018 | 203 | 196 |
| 3 | 2017 | 193 | 189 |
| 4 | 2015 | 185 | 180 |
| 5 | 2016 | 180 | 164 |
Table1. Top five warmest years in the ocean since 1955 for both IAP (updated from Cheng et al., 2017 through 2019) and NOAA/NCEI data (updated from Levitus et al., 2012 through 2019). The OHC values are the anomalies (units: ZJ) relative to the 1981–2010 average.
The OHC values (for the upper 2000 m) were obtained from the Institute of Atmospheric Physics (IAP) ocean analysis (see “Data and methods” section, below), which uses a relatively new method to treat data sparseness and updates in the instruments that have been used to measure ocean temperature (Cheng et al., 2017). The evolution of OHC (Fig. 1) shows that the upper 2000 m OHC in 2019 was 228 ± 9 ZJ above the 1981–2010 average. The record-setting ocean warmth is also found in National Oceanic and Atmospheric Administration/National Center for Environmental Information (NOAA/NCEI) data, showing 217± 4 ZJ in 2019 above the 1981?2010 average (21 ZJ above 2018) (Table 1) (updated from Levitus et al. 2012). With these newly available IAP data, a ranking of the warmest years since the 1950s is now possible (Table 1). The past five years are the top five warmest years in the ocean historically with modern instruments, and the past ten years are also the top ten years on record. The same ranking also applies to NOAA/NCEI data (Table 1).
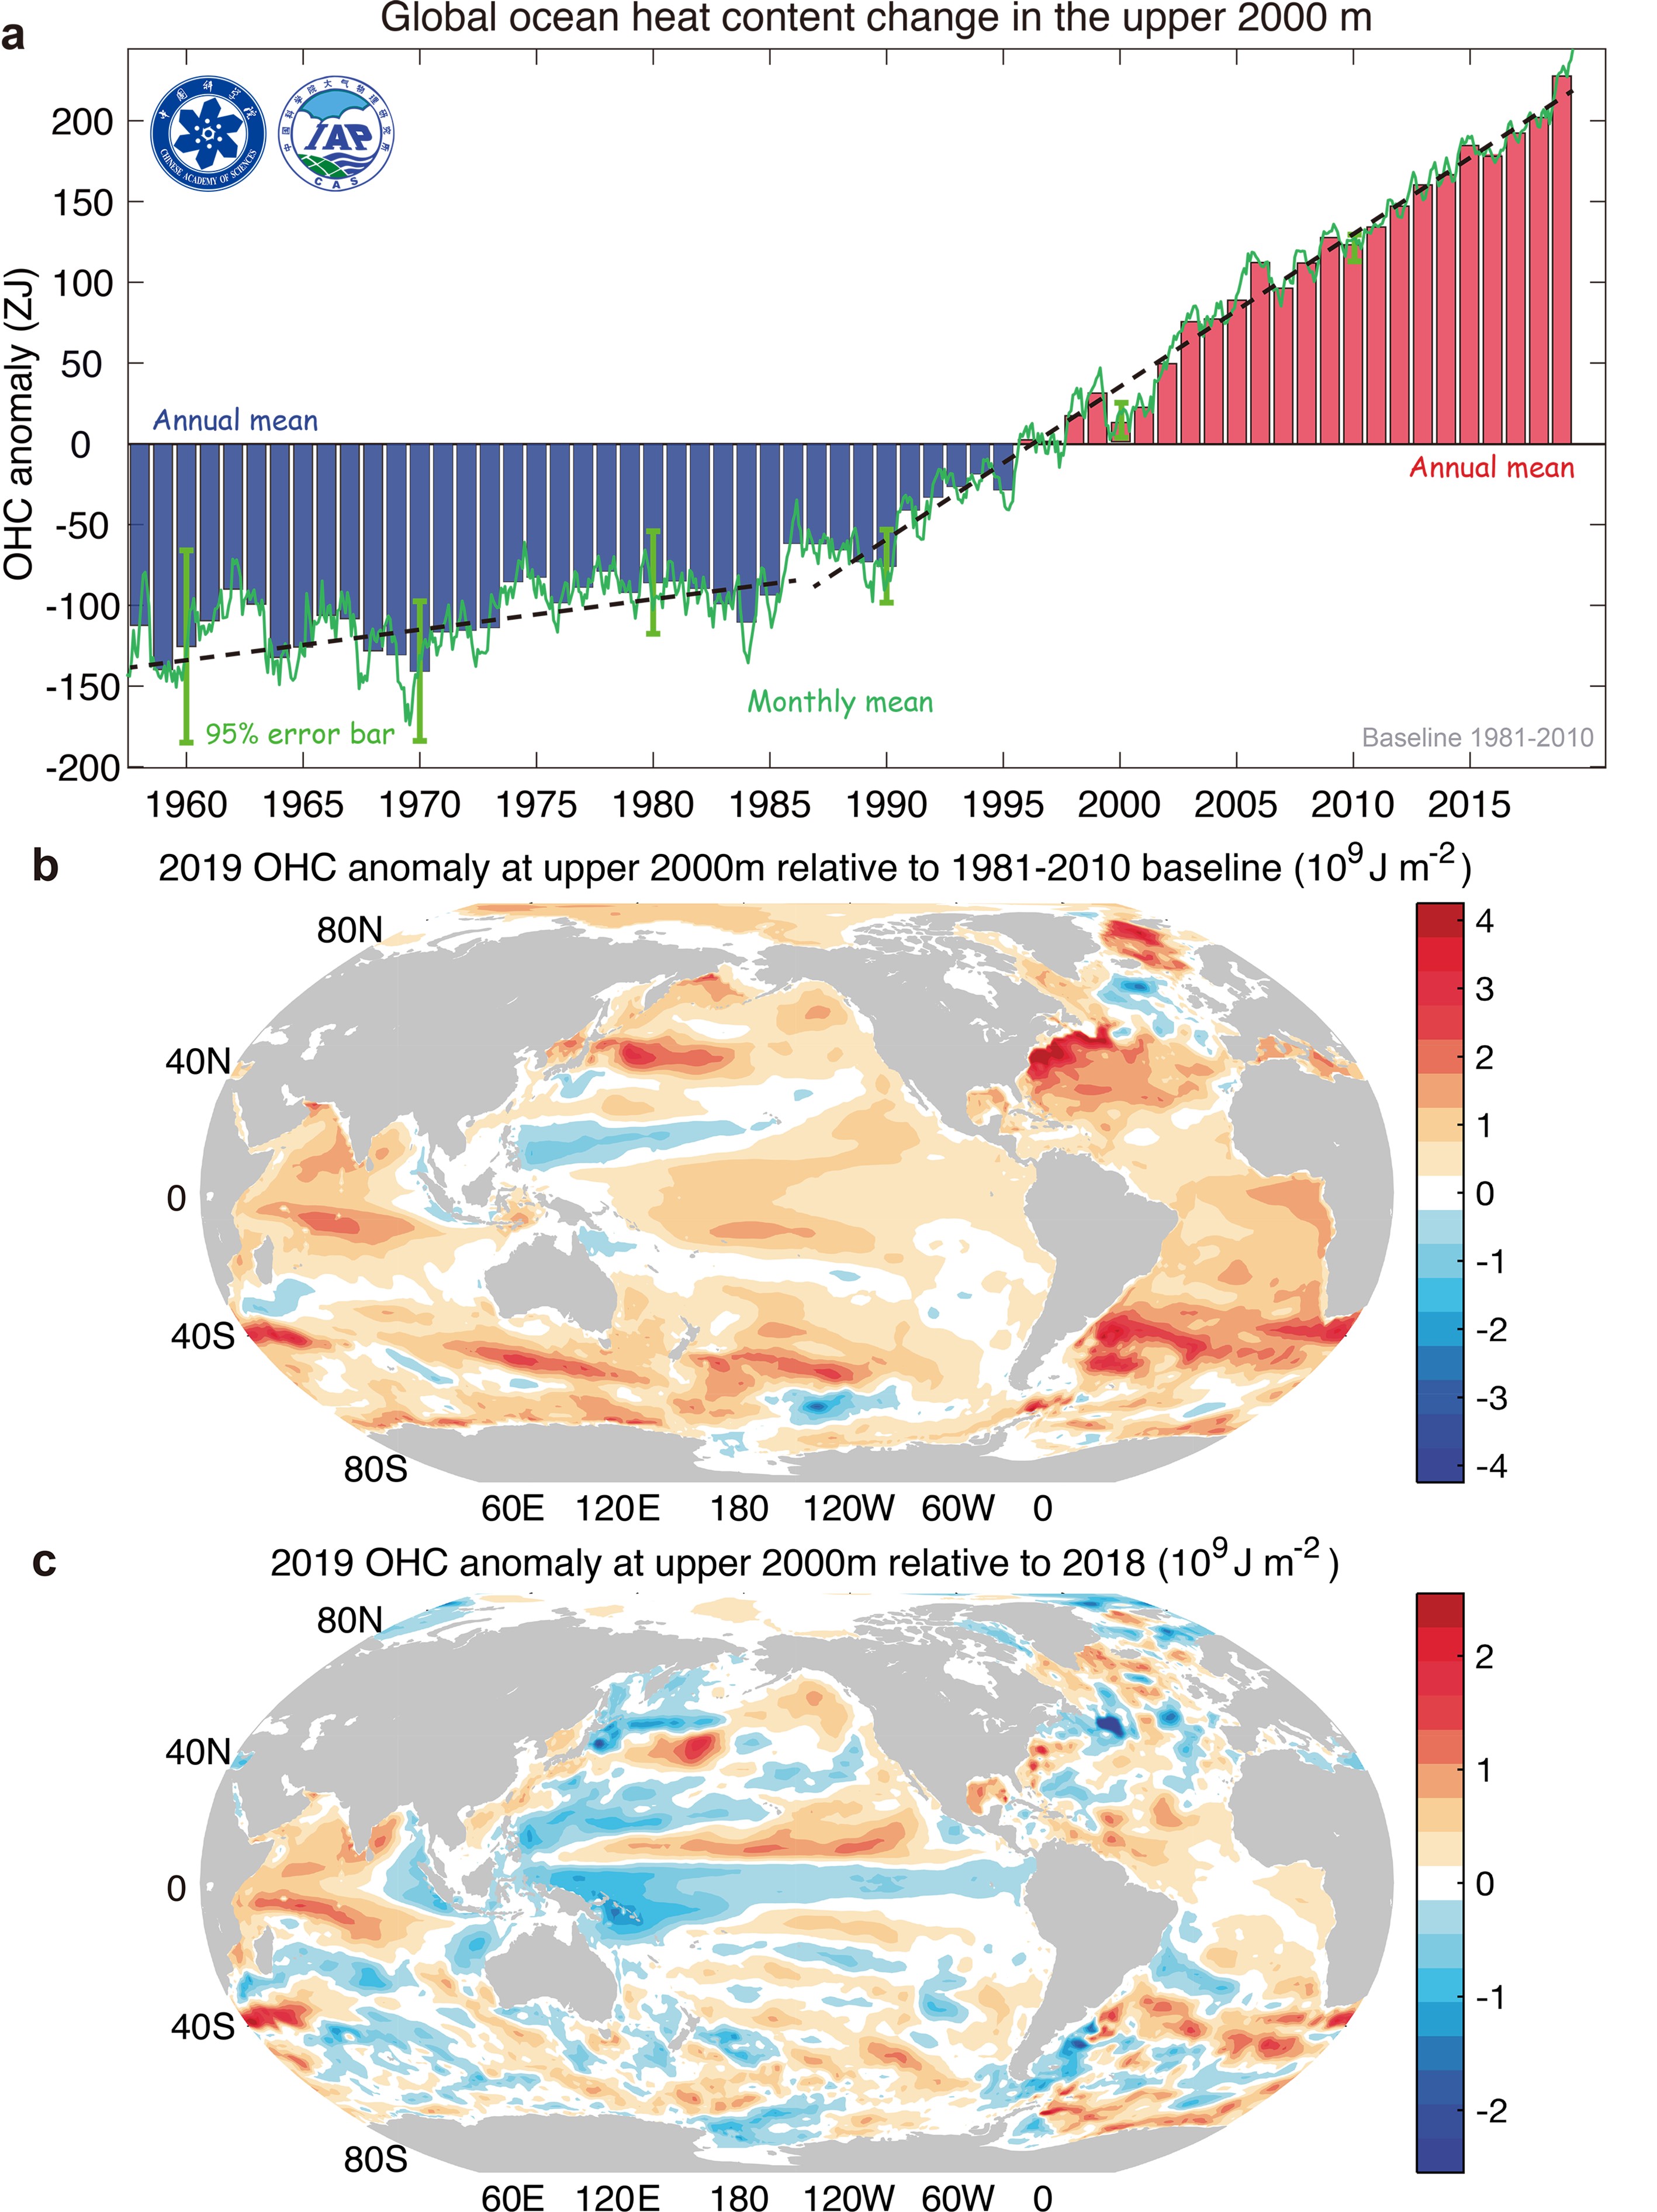 Figure1. (a) Upper 2000 m OHC from 1958 through 2019. The histogram represents annual anomalies (units: ZJ), wherein positive anomalies relative to a 1981?2010 baseline are shown as red bars and negative anomalies as blue. The two black dashed lines are the linear trends over 1955–86 and 1987?2019, respectively. (b) Ocean heat content anomaly in 2019 relative to the 1981?2010 baseline. (c) Difference in the OHC in the upper 2000 m between 2019 and 2018. Units: 109 J m?2. Source: IAP data.
Since a single annual OHC value can be impacted by internal variabilities (i.e., El Ni?o–Southern Oscillation, ENSO) or instrumental errors, long-term trends are much more important than any individual year for showing climate change; and such trends have been calculated in this work. Simple least-squares trend lines were created for two approximately equal-duration time periods (period 1 = 1955–86; period 2 = 1987–2019). The warming rates were obtained by the rate of change of the data in Fig. 1. For the first time period, the warming was relatively constant at ~2.1 ± 0.5 ZJ yr?1. However, the more recent warming was ~450% that of the earlier warming (9.4 ± 0.2 ZJ yr?1, equal to 0.58 W m?2 averaged over the Earth’s surface), reflecting a major increase in the rate of global climate change (Cheng et al., 2019a). Note that the selection of endpoints, the use of smoothing, and other factors may lead to slightly different rates of warming than those reported here, but in no way change the central findings of this report.
Based on the updated OHC data throughout 2019 from the IAP, a revised ocean energy budget from 0 m to the ocean bottom is provided (Fig. 2), along with the OHC below 2000 m adapted from Purkey and Johnson (2010) (using a linear increase of 1.15 ± 1.0 ZJ yr?1 after 1992). The deep OHC change below 2000 m was extended to 1960 by assuming a zero heating rate before 1991, consistent with Rhein et al. (2013) and Cheng et al., (2017). The new results indicate a total full-depth ocean warming of 370 ± 81 ZJ (equal to a net heating of 0.38 ± 0.08 W m?2 over the global surface) from 1960 to 2019, with contributions of 41.0%, 21.5%, 28.6% and 8.9% from the 0–300-m, 300–700-m, 700–2000-m, and below-2000-m layers, respectively. The uncertainty in the OHC record has been greatly reduced in recent decades through improvements in the ocean observation system (Meyssignac et al., 2019), which is represented by error bars in Fig. 1 (the calculation of the uncertainty range is presented in detail in Cheng et al. (2017). Furthermore, the penetration of heat into the deep oceans is evident (Figs. 2 and 3), primarily through the Atlantic Ocean and Southern Ocean (Fig. 3).
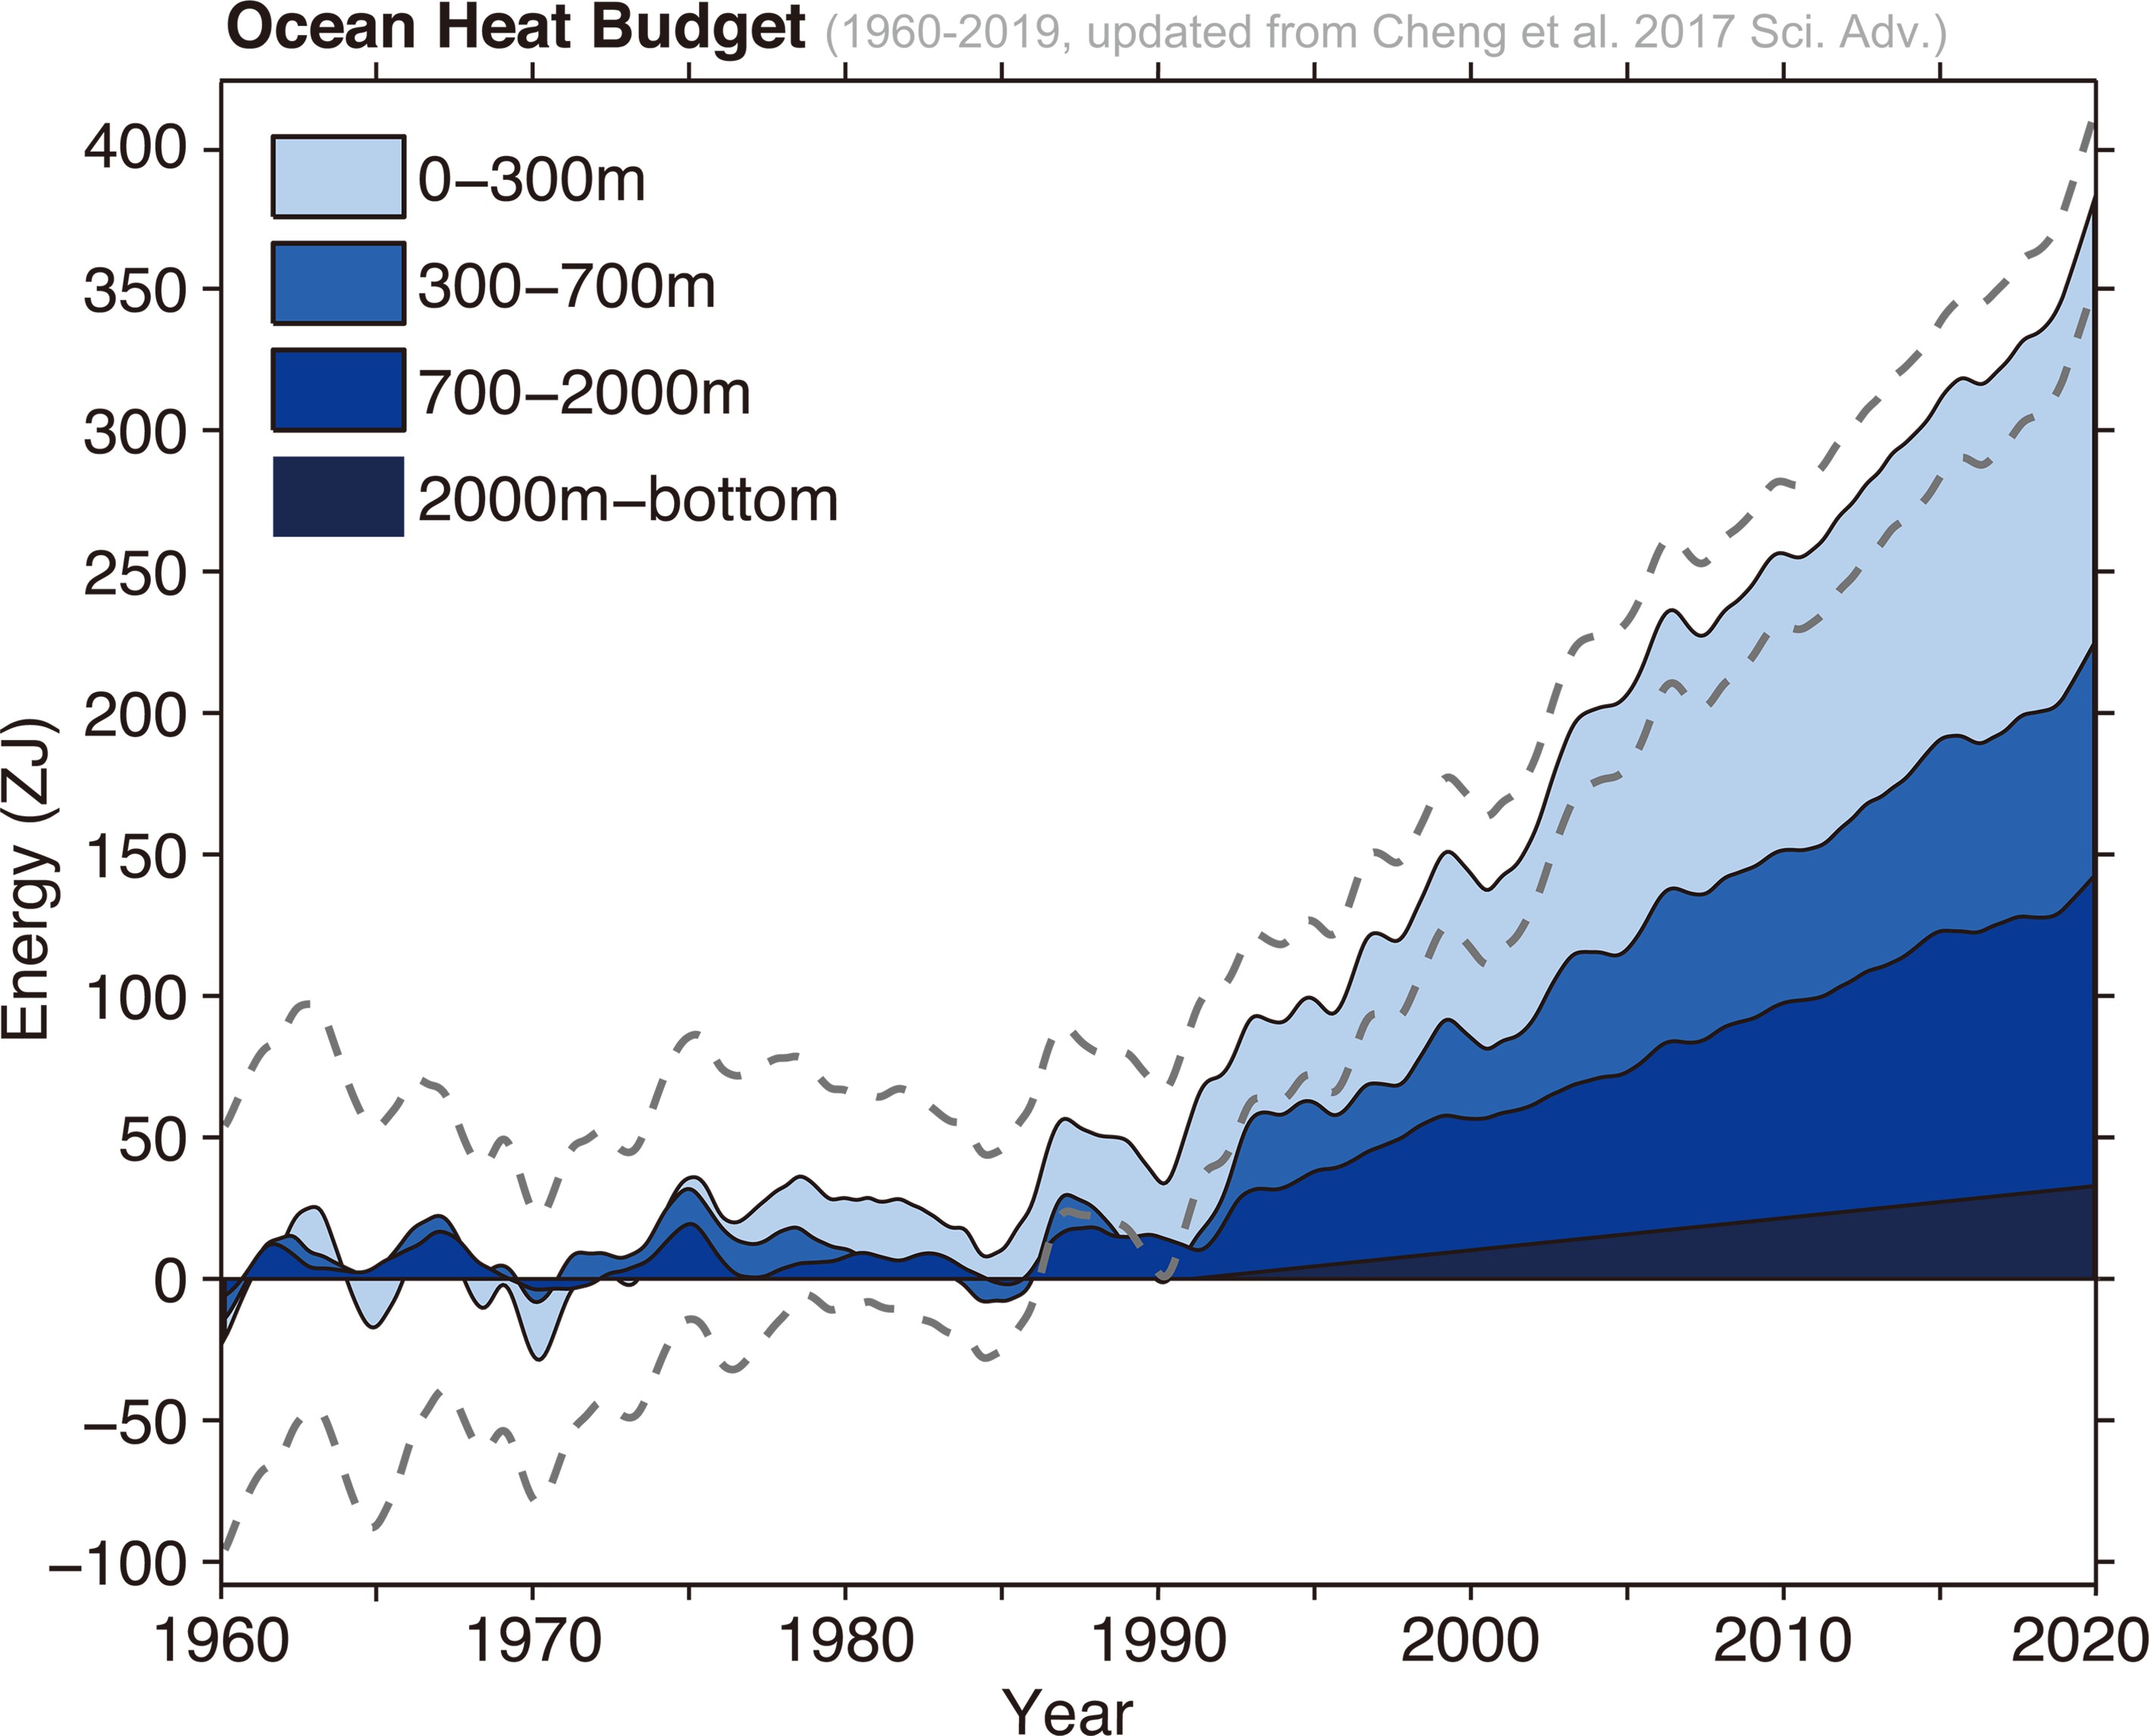 Figure2. Ocean heat budget from 1960 to 2019 based on IAP analysis data from 0 to 2000 m, and from Purkey and Johnson (2010) for deep ocean change below 2000 m (units: ZJ). Figure updated from Cheng et al. (2017). The anomalies are related to a 1958?1962 baseline, and the time series are smoothed by LOWESS (locally weighted scatterplot smoothing) with a span width of 24 months. The gray dashed lines are the 95% confidence interval of the total ocean heat budget.
 Figure3. Vertical section of the ocean temperature trends within 1960 to 2019 from the sea surface to 2000 m (60-year ordinary least-squares linear trend). Shown are the zonal mean sections in each ocean basin organized around the Southern Ocean (south of 60°S) in the center. Black contours show the associated climatological mean temperature with intervals of 2°C (in the Southern Ocean, 1°C intervals are provided in dashed contours). IAP gridded data are used.
The heating was distributed throughout the world’s oceans, with the vast majority of regions showing an increase in thermal energy (Figs. 1b and 3). The Atlantic Ocean and Southern Ocean (especially near the Antarctic Circumpolar Current, 40°–60°S) continued to show a larger warming compared to most of the other basins (Cheng et al., 2019c). It is well-established that the Southern Ocean has taken up most of the global warming heat since 1970: multiple observations show that the ocean south of 30°S at 0–2000 m was responsible for 35%–43% of the increase in global OHC within 1970–2017 (Meredith et al., 2019). Also, this is associated with a net northward heat transport by the oceans across the equator (Trenberth and Zhang, 2019). Such meridional oceanic heat transport has influenced recent marine heatwaves in the Tasman Sea, which imparts a profound influence on marine fisheries and ecosystems (Behrens et al., 2019; Trenberth and Zhang, 2019). Interestingly, many of the major marine heatwave events in recent years (Collins et al., 2019) have been located near the strong ocean heating regions, such as the Mediterranean Sea, North Pacific (nicknamed “The Blob”), equatorial central Pacific, Tasman Sea, and North Atlantic (> 40°N) (Fig. 1b, 3). Marine heatwaves and other stresses caused by ocean environmental changes clearly pose high risks to biodiversity and fisheries, and cause economic losses.
In the tropics, the spatial pattern of OHC anomalies in 2019 relative to 2018 (Fig. 1c) also reveals the impact of ENSO, which is the dominant mode of the Earth/ocean’s energy variability on interannual scales (Trenberth et al., 2002; Roemmich and Gilson, 2011; Cheng et al., 2019b). ENSO is associated with both heat redistributions within the ocean and heat exchange between the oceans and atmosphere. From late 2018 to early 2019, El Ni?o formed, and after the summer of 2019 the El Ni?o event decayed and a neutral phase persisted throughout the second half of the year. From La Ni?a (early 2018) to El Ni?o (later 2019), heat discharged from the equatorial and South Pacific Ocean (20°S–5°N) into the Northeast Pacific Ocean (5°–20°N), resulting in a cooling of the Pacific Ocean within 20°S–5°N and a warming of the Pacific/Indian Ocean within 5°–20°N on the OHC map in Fig. 1c.
The ocean heating is irrefutable, and a key measure of the Earth’s energy imbalance: the excess GHGs in the air trap more heat inside the climate system and drives global warming. More than 90% of the heat accumulates in the ocean because of its large heat capacity, and the remaining heating manifests as atmospheric warming, a drying and warming landmass, and melting of land and sea ice. There are no reasonable alternatives aside from anthropogenic emissions of heat-trapping gases (IPCC, 2001, 2007, 2013, 2019; USGCRP, 2017). Increased ocean temperatures lead to rising sea levels (thermal expansion of the ocean and added mass from melting land ice) (Oppenheimer et al., 2019). According to the altimetry satellite record, the past 10 years are also the highest in global mean sea level since 1900 (IPCC, 2019).
Increases in ocean temperature reduce dissolved oxygen in the ocean and significantly affect sea life, particularly corals and other temperature- and chemistry-sensitive organisms (Abram et al., 2019; Bindoff et al., 2019). The increasing heat increases evaporation, and the extra moisture in the warmer atmosphere nourishes heavy rains and promotes flooding (Trenberth et al., 2003; Held and Soden, 2006; Trenberth, 2011; Collins et al., 2019), leading to a more extreme hydrological cycle and more extreme weather (in particular hurricanes and typhoons) (Trenberth et al., 2018). It is one of the key reasons why the Earth has experienced increasing catastrophic fires in the Amazon, California, and Australia in 2019 (extending into 2020 for Australia).
It is important to note that ocean warming will continue even if the global mean surface air temperature can be stabilized at or below 2°C (the key policy target of the Paris Agreement) in the 21st century (Cheng et al., 2019a; IPCC, 2019), due to the long-term commitment of ocean changes driven by GHGs. Here, the term “commitment” means that the ocean (and some other components in the Earth system, such as the large ice sheets) are slow to respond and equilibrate, and will continue to change even after radiative forcing stabilizes (Abram et al., 2019). However, the rates and magnitudes of ocean warming and the associated risks will be smaller with lower GHG emissions (Cheng et al., 2019a; IPCC, 2019). Hence, the rate of increase can be reduced by appropriate human actions that lead to rapid reductions in GHG emissions (Cheng et al., 2019a; IPCC, 2019), thereby reducing the risks to humans and other life on Earth.
Acknowledgements. The IAP analysis is supported by the National Key Research and Development Program of China (Grant Nos. 2016YFC1401806 and 2017YFA0603202). Author contributions: LC and JZ are responsible for the IAP analysis; JA and LC drafted the initial manuscript. All coauthors provide continual and vital support to the IAP analysis and activities; plus, they contributed to refining this manuscript. NCAR is sponsored by the US National Science Foundation. TB, RL contribution funded in partnership with the NOAA OAR Ocean Observing and Monitoring Division. The efforts of Dr. Fasullo in this work were partially supported by the Regional and Global Model Analysis (RGMA) component of the Earth and Environmental System Modeling Program of the U.S. Department of Energy's Office of Biological & Environmental Research (BER) via National Science Foundation IA 1844590. The efforts of Dr. Fasullo in this work were also supported in part by NSF Award #AGS-1419571.
