HTML
--> --> -->The ENSO?SASM relationship is further complicated by the identification of a new type of El Ni?o event referred to as the central Pacific (CP) El Ni?o (Yu and Kao, 2007; Kao and Yu, 2009; Kug et al., 2009). While the conventional eastern Pacific (EP) ENSO event is characterized by significant SST anomalies concentrated in the eastern equatorial Pacific, CP ENSO is accompanied by SST anomalies confined to the central Pacific. Besides distinct SST anomaly patterns, these two different types of ENSO may also be differentiated by their physical processes, atmosphere?ocean coupling, temporal evolutions, and propagation directions (Rasmusson and Carpenter, 1982; Yasunari, 1985; Barnett et al., 1991; Yu and Kao, 2007; Kao and Yu, 2009). The mechanism responsible for the development and maintenance of canonical ENSO is Bjerknes feedback (Bjerknes, 1969), which describes a series of positive feedbacks in the atmosphere?ocean coupling induced by an initial SST anomaly. The transition between the warm and cold phases of traditional ENSO events can be explained by the delayed-oscillator theory (Schopf and Suarez, 1988; Suarez and Schopf, 1988). The changes in SST and subsurface temperature anomalies for EP ENSO are driven by thermocline variation, and the zonal wind stress anomaly is tightly coupled to the zonal gradient of the SST anomaly. In contrast, the Bjerknes positive feedback is relatively weak for CP El Ni?o, suggesting a weaker sensitivity of the wind stress anomaly to the SST-induced diabatic heating anomaly gradient (Zheng et al., 2014).
The different climate impacts of these two contrasting types of ENSO and the underlying physical mechanisms have been addressed by several previous studies. Corresponding to specific distributions of SST and diabatic heating anomalies, the anomalous atmospheric circulations and mid-tropospheric wave trains induced by the two types of El Ni?o may also exhibit contrasting features, and consequently lead to diverse patterns of climate anomalies in the Pacific rim countries (Weng et al., 2007, 2009). Yuan and Yang (2012) found different characteristics of anomalous precipitation patterns over East Asia associated with EP and CP El Ni?o from the developing to decaying phases [periods preceding and following the mature phase (November?December?January) of the event]. The physical mechanisms responsible for these anomalous features involve the variations of anomalous Walker and local Hadley circulations. During the El Ni?o decaying stage, differences in the position and seasonal evolution of the anomalous western Pacific subtropical high (WPSH) accompanied by typical El Ni?o and El Ni?o Modoki events contribute to different rainfall anomalies in China (Feng et al., 2011; Feng and Li, 2011). Chen et al. (2019) argued that the distinct impacts on the WPSH produced by the different types of El Ni?o can be interpreted in terms of the combined effects of the northwestern Pacific local air?sea coupling mechanism, the Indian Ocean capacitor mechanism, and the Maritime Continent mechanism. Yu et al. (2012) presented different spatial patterns of U.S. winter temperature anomalies associated with two types of El Ni?o, and attributed the different impact patterns to distinct atmospheric responses to specified SST anomalies. Wang et al. (2019, 2020) classified El Ni?o events into strong basin-wide, moderate EP, and moderate CP types, and revealed that these three types of El Ni?o exert distinctive impacts on the global hydroclimate, including the Indian summer monsoon precipitation. Although all these three types of El Ni?o significantly reduce Indian summer rainfall, the dry anomalies induced by different El Ni?o warming are remarkably different in locations and amplitudes.
It has been demonstrated that the responses of the SASM precipitation are strongly dependent on the details of SST anomaly patterns in the tropical Pacific (Krishna Kumar et al., 2006). Both empirical analysis and model simulations suggest that the central Pacific warming plays an essential role in producing subsidence anomalies and severe monsoon droughts over India. Although the connection between the canonical ENSO and SASM has been extensively examined, different influences of the recently recognized CP ENSO and canonical EP ENSO on the SASM during different periods have not been clearly identified. The primary purpose of this study is to distinguish and better understand the changing impacts of ENSO diversity on the SASM associated with the climate shift in the late 1970s. In particular, we intend to compare and interpret the different roles of the two types of ENSO on the monsoonal circulation, precipitation, and moisture flux convergence?divergence during the pre- and post-late 1970s, respectively.
To separate the EP and CP types of ENSO, we applied a previously derived procedure as a combination of linear regression and empirical orthogonal function (EOF) analysis (Kao and Yu, 2009; Yu and Kim, 2010; Yu et al., 2012). First of all, the monthly SST anomalies regressed with the Ni?o1+2 (0°?10°S, 80°?90°W) index or Ni?o-4 (5°S?5°N, 160°E?150°W) index were removed from the original data. We then performed the EOF analysis on the residual SST anomalies excluding the influence from the eastern Pacific Ni?o1+2 region (the central Pacific Ni?o-4 region) to extract the dominant pattern of the CP (EP) ENSO. The monthly EP and CP ENSO indices were defined as the leading principal component (PC) time series corresponding to the two leading EOF spatial patterns obtained from this combined regression-EOF method.
For the purpose of diagnosing the relative roles of the EP and CP types of ENSO governing the SASM, we produced correlation maps of monsoon-related atmospheric fields against these two types of ENSO indices. The correlation patterns of SST during the developing summer of ENSO events with the corresponding EP and CP ENSO indices are shown in Fig. 1. We also conducted composite analyses to examine the characteristics of circulation and precipitation corresponding to the two types of El Ni?o. Because there are arguments that the SST patterns between the two types of La Ni?a are much less distinctive (Kug et al., 2009; Kug and Ham, 2011), we focused on composite analyses for the two types of El Ni?o events. The El Ni?o events used for composite analyses were selected based on the criterion that a threshold of +0.5°C for the Oceanic Ni?o Index is met for at least five consecutive and overlapping three-month seasons from the developing summer to the decaying spring. The Ni?o-3.4 SST anomaly indices and the AIMR indices in the developing summer of these selected El Ni?o events are listed in Table 1. The El Ni?o events during the developing summer were classified into the EP type (CP type) when the JJAS-averaged EP (CP) ENSO index is greater than the CP (EP) ENSO index.
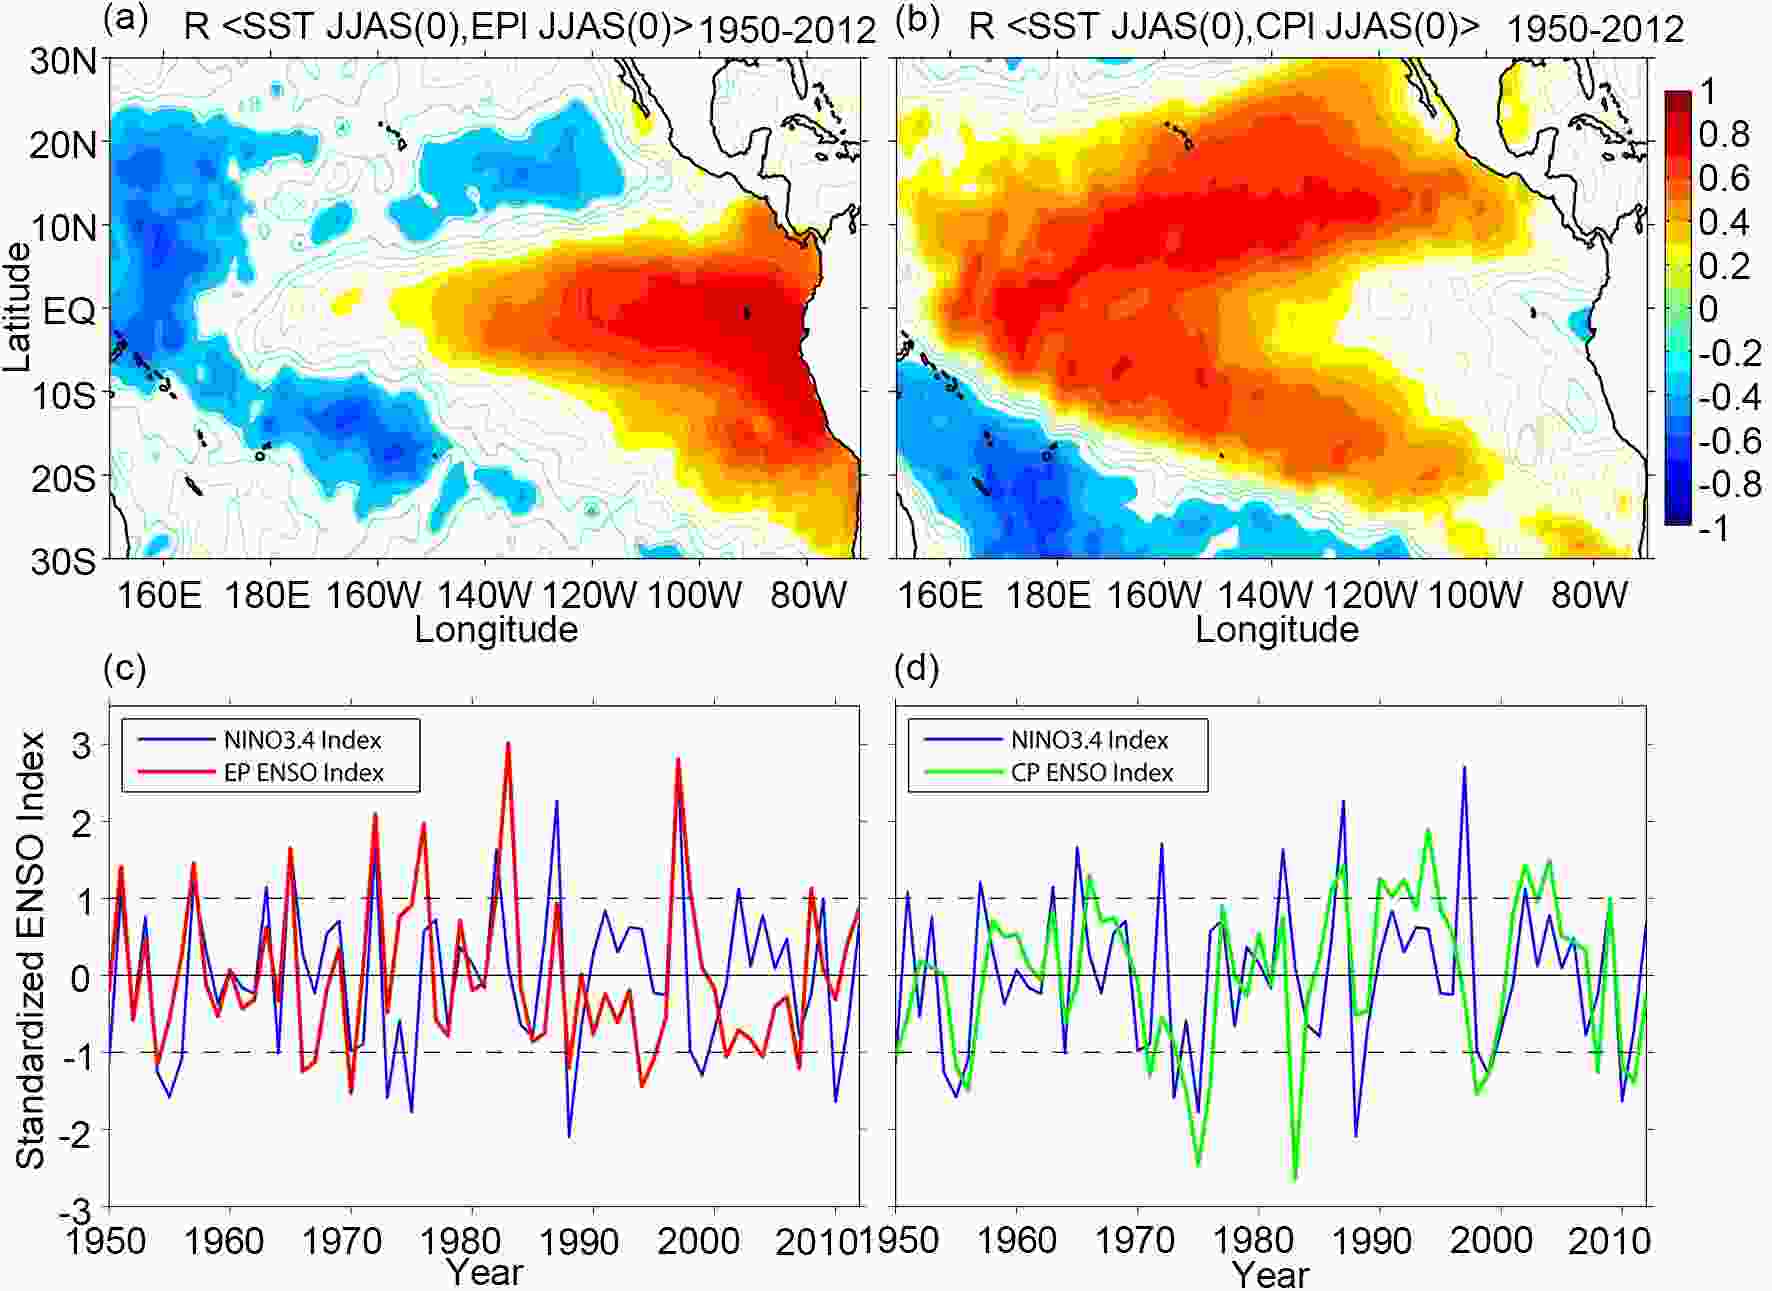 Figure1. Correlation patterns of SST (units: °C) with (a) the EP ENSO index and (b) the CP ENSO index in the summer season (JJAS) during the 1950?2012 period. Regions where the correlations are statistically significant at the two-tailed α = 0.05 level are filled with colors. Interannual time series of (c) the EP ENSO index (red) and (d) the CP ENSO index (green) compared with the Ni?o-3.4 SST anomaly index (blue) in the summer season during the 1950?2012 period. These series have been standardized to have zero mean and unit standard deviation.
| Years | Major El Ni?o Events (1950?2012) | ||||
| Ni?o-3.4 SST Anomaly (°C) | Standardized Ni?o-3.4 Index | Type | AIMR (mm) | Standardized AIMR Index | |
| 1951 | 0.71 | 1.08 | EP | 738.7 | ?1.20 |
| 1953 | 0.49 | 0.75 | EP | 922.8 | 0.98 |
| 1957 | 0.79 | 1.21 | EP | 788.5 | ?0.61 |
| 1958 | 0.22 | 0.33 | CP | 889.1 | 0.58 |
| 1963 | 0.75 | 1.14 | CP | 857.7 | 0.21 |
| 1965 | 1.08 | 1.65 | EP | 709.2 | ?1.54 |
| 1968 | 0.35 | 0.54 | CP | 754.5 | ?1.01 |
| 1969 | 0.46 | 0.71 | CP | 831.0 | ?0.10 |
| 1972 | 1.12 | 1.70 | EP | 652.8 | ?2.21 |
| 1976 | 0.37 | 0.57 | EP | 856.6 | 0.20 |
| 1977 | 0.47 | 0.72 | CP | 883.0 | 0.51 |
| 1979 | 0.24 | 0.36 | EP | 707.7 | ?1.56 |
| 1982 | 1.07 | 1.63 | EP | 735.1 | ?1.24 |
| 1986 | 0.31 | 0.47 | CP | 742.9 | ?1.15 |
| 1987 | 1.48 | 2.27 | CP | 697.0 | ?1.69 |
| 1991 | 0.55 | 0.84 | CP | 785.2 | ?0.65 |
| 1994 | 0.39 | 0.60 | CP | 952.7 | 1.34 |
| 1997 | 1.77 | 2.70 | EP | 871.4 | 0.37 |
| 2002 | 0.73 | 1.12 | CP | 661.9 | ?2.10 |
| 2004 | 0.51 | 0.78 | CP | 744.7 | ?1.12 |
| 2006 | 0.31 | 0.48 | CP | 869.9 | 0.36 |
| 2009 | 0.65 | 0.99 | CP | 667.6 | ?2.04 |
Table1. The Ni?o-3.4 SST anomaly indices and the AIMR indices in the developing summer (JJAS) of El Ni?o events during the 1950?2012 period. The El Ni?o types during the developing summer are identified based on the relative values of the EP and CP ENSO indices.
3.1. Lag?lead correlations
The lag?lead correlations of the monthly Ni?o SST anomalies and the two types of ENSO indices with reference to the AIMR index are illustrated in Fig. 2. It has been indicated by previous studies (Krishna Kumar et al., 1999; Wang et al., 2001) that the inverse relationship between ENSO and the SASM has substantially weakened in association with the climate shift in the Pacific Ocean (Trenberth, 1990; Mantua and Hare, 2002), which can be manifested by the apparent weakening of the correlations between the Ni?o-3.4 (5°S?5°N, 170°?120°W) SST anomaly index and the AIMR index after the late 1970s. We are particularly interested in identifying separate roles of the EP and CP types of ENSO in affecting the SASM during different periods. Splitting the 1950?2012 interval into two sub-periods (i.e., pre-1979 and post-1979), it is evident that the correlations between the two types of ENSO indices and the AIMR index are notably different between the earlier and later sub-periods (Figs. 2b and d). During the earlier (1950?78) sub-period, the simultaneous correlation between the EP ENSO index and the AIMR index is negative and statistically significant at the two-tailed α = 0.05 level [r = ?0.45 in JJAS(0)], indicating suppressed (enhanced) Indian monsoon precipitation in the developing phase of an El Ni?o (La Ni?a) event. This simultaneous relationship between EP ENSO and Indian monsoon rainfall has weakened dramatically [r = 0.03 in JJAS(0)] during the later (1979?2012) sub-period. By contrast, the AIMR index is significantly anticorrelated with the CP ENSO index in the concurrent summer and subsequent two seasons during the later sub-period, with negative correlation coefficients of r = ?0.36 to ?0.52. Compared with non-significant instantaneous correlation [r = ?0.21 in JJAS(0)] in the earlier sub-period, the relationship between CP ENSO and Indian monsoon rainfall has strengthened considerably in the later sub-period. It is also worth noting that the Ni?o indices defined as the regionally averaged SST anomalies located in the eastern equatorial Pacific (central equatorial Pacific) are more significantly correlated with the AIMR index in the earlier sub-period (later sub-period) (Figs. 2a and c).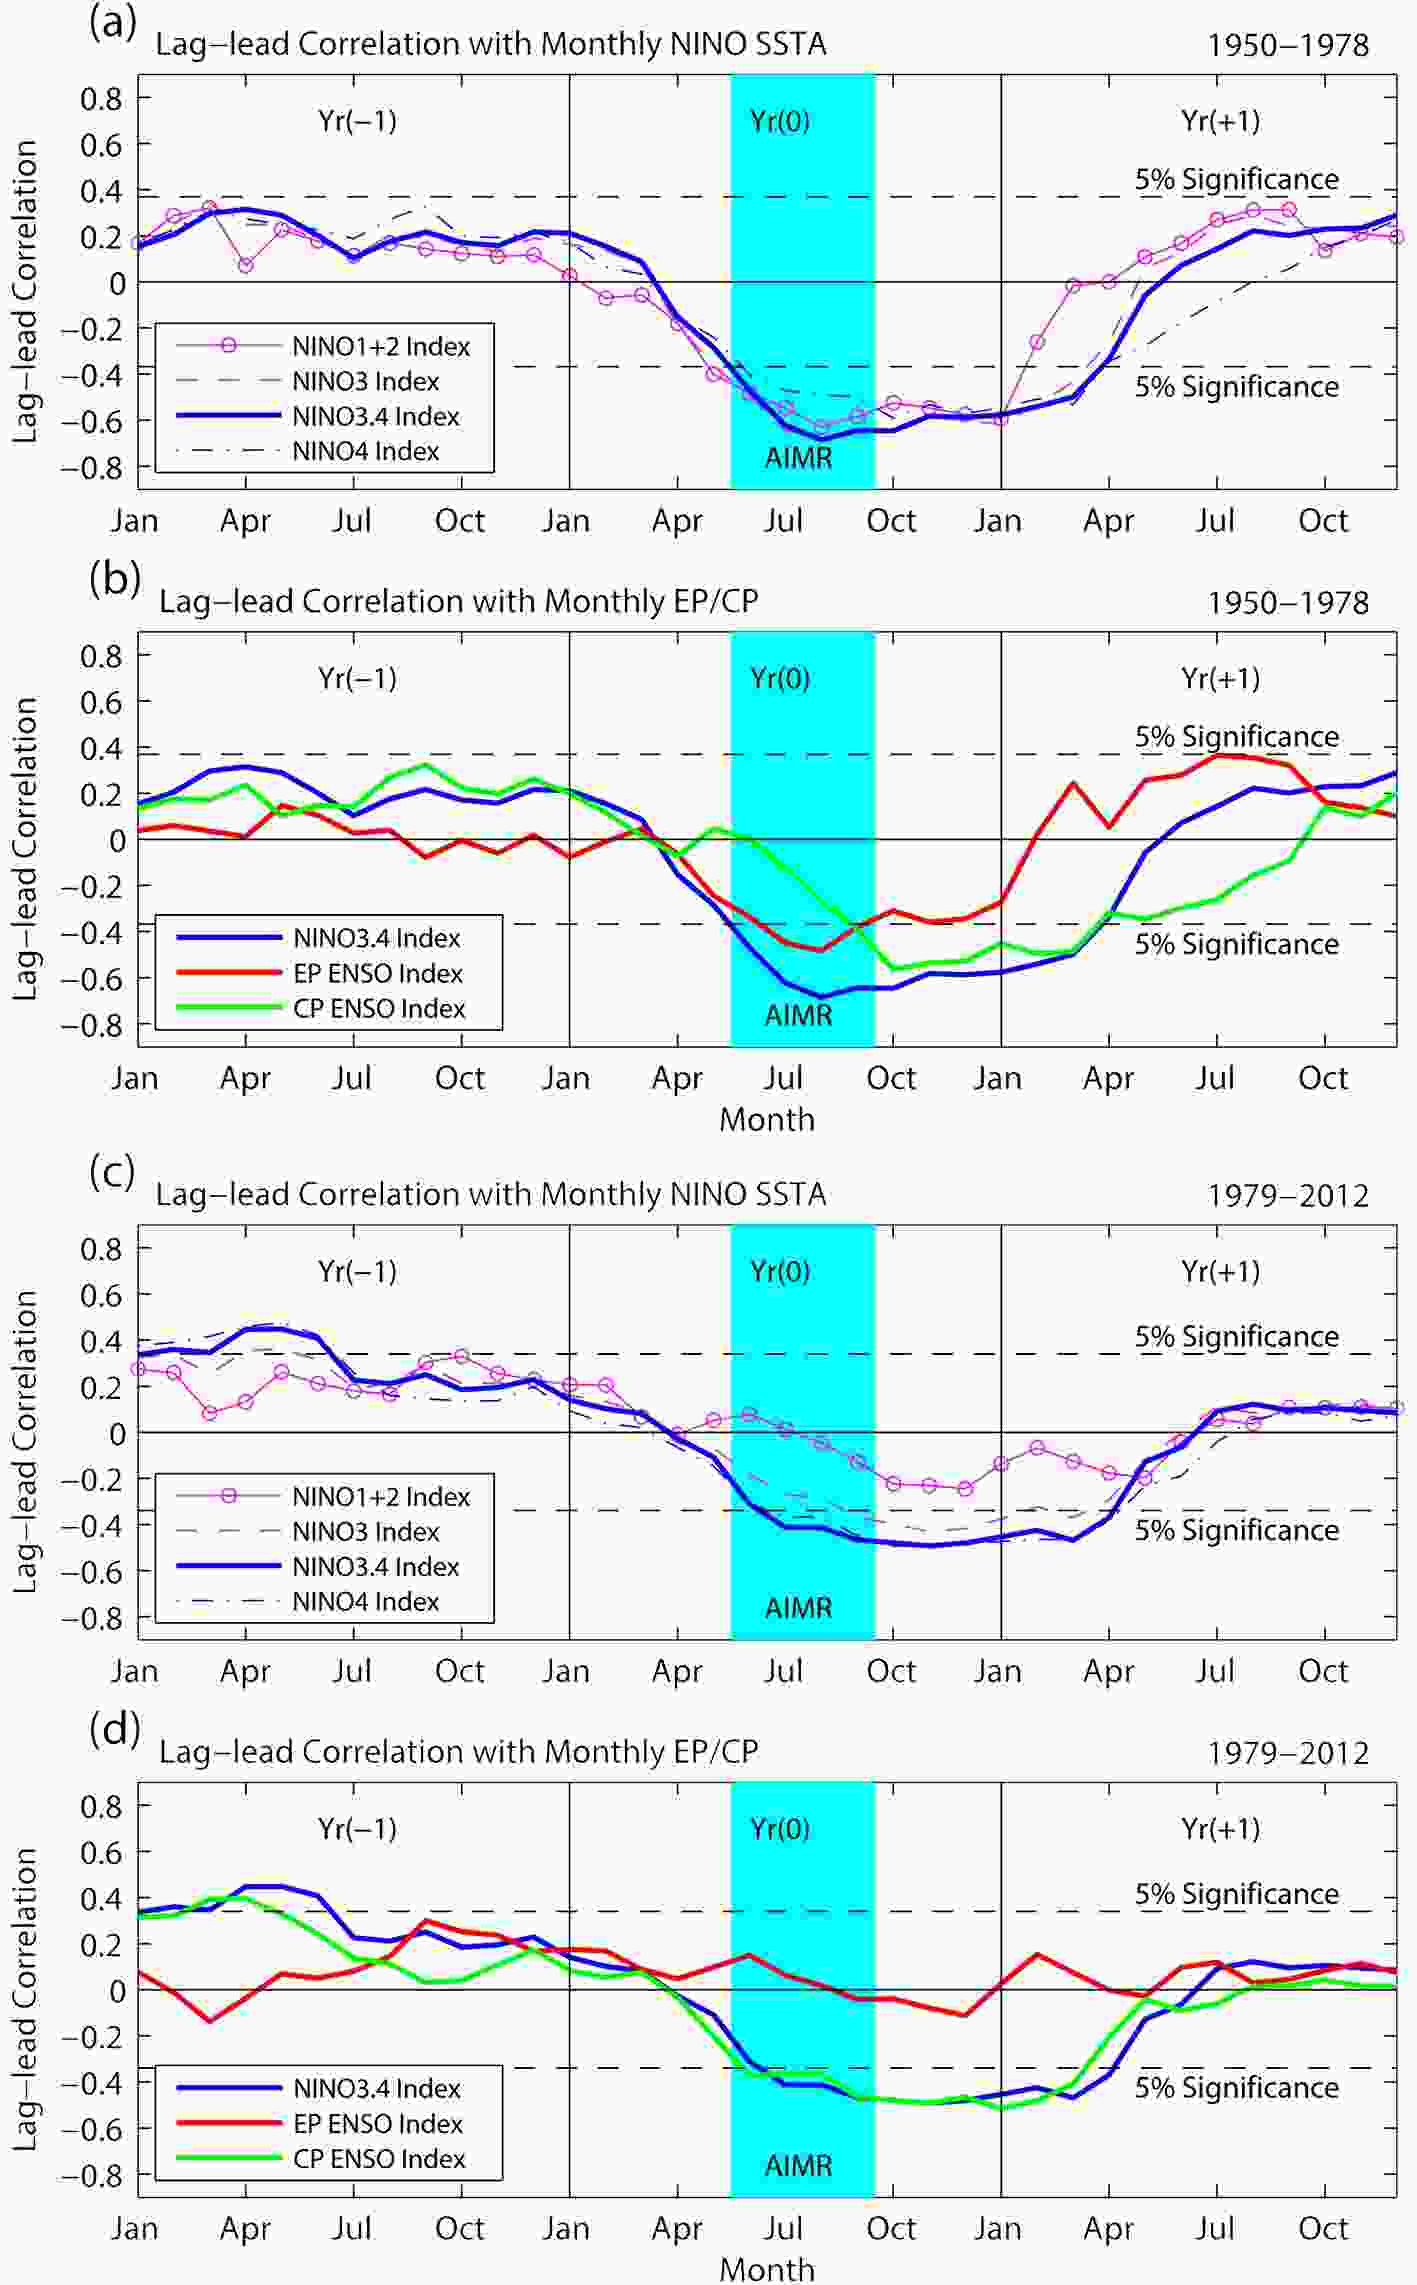 Figure2. Lag?lead correlations of the monthly mean (a, c) Ni?o SST anomaly indices and (b, d) the two types of ENSO indices with reference to the AIMR index during (a, b) the 1950?78 sub-period and (c, d) the 1979?2012 sub-period. The horizontal dashed lines indicate the two-tailed α = 0.05 significance level.
The aforementioned results imply that the Indian monsoon rainfall anomaly is more closely related to the development of the EP type of ENSO during the pre-1979 sub-period, whereas the CP type of ENSO plays a more dominant role in producing anomalous Indian monsoon rainfall during the post-1979 sub-period. These findings are also consistent with the results of a previous analysis by Fan et al. (2017), which revealed that while the typical EP type of El Ni?o events with warming signals extended to the dateline are responsible for the severe Indian monsoon droughts during the 1950?78 period, both the canonical EP type and the recently recognized CP type of El Ni?o warming patterns may lead to the Indian monsoon failure during the 1979?2012 period. Despite the concurrent correlation between the Ni?o-4 index and the AIMR index being slightly weaker, all four Ni?o SST anomaly indices have substantially significant instantaneous correlations (p < 0.01 for a two-sided Student’s t-test) with the AIMR index in the earlier sub-period, implying coherent variability of these different Ni?o indices. Because the coherent parts of SST variance with the Ni?o1+2 index or Ni?o-4 index are excluded in the definitions, the monthly EP ENSO index (CP ENSO index) is most highly correlated (r = 0.8) with the monthly SST anomaly averaged in the eastern Pacific Ni?o1+2 region (the central Pacific Ni?o-4 region) and uncorrelated (r ≈ 0) with that averaged in the Ni?o-4 region (the Ni?o1+2 region).
2
3.2. Spatial patterns of ENSO influences on monsoonal precipitation
We next examined the correlation patterns of monsoon-related precipitation with the two types of ENSO indices. Owing to the simultaneous influences of ENSO on the SASM through the displacement of the Walker circulation (Palmer et al., 1992; Krishna Kumar et al., 1999; Wang et al., 2001), the correlation analyses were performed using the summer (JJAS) mean EP and CP ENSO indices. The correlation patterns of precipitation associated with the warm phase of EP ENSO indicate substantially suppressed rainfall in central India during the earlier (1951?78) sub-period (Fig. 3a), whereas the correlations between the EP ENSO index and precipitation are non-significant over the entire Indian subcontinent during the later (1979?2007) sub-period (Fig. 3b). In contrast, while the impacts of the CP type of ENSO on Indian precipitation are barely discernible during the earlier sub-period (Fig. 3c), highly significant negative correlations between the CP ENSO index and precipitation are found in southern India during the later sub-period (Fig. 3d). We highlight the regions where the correlation coefficients are statistically significant at the two-tailed α = 0.05 level according to the Student’s t-test here and in similar subsequent figures. Figure3. Correlation patterns of precipitation (units: mm d?1) with (a, b) the EP ENSO index and (c, d) the CP ENSO index in the summer season (JJAS) during (a, c) the 1951?78 sub-period and (b, d) the 1979?2007 sub-period. Precipitation patterns are based on the APHRODITE precipitation dataset covering the period 1951?2007. Regions where the correlations are statistically significant at the two-tailed α = 0.05 level are filled with colors.
To further illustrate the spatial distributions of terrestrial and oceanic precipitation associated with these two types of ENSO, we expanded the range of areas to the eastern tropical Pacific and conducted correlation analyses based on the CMAP and GPCP globally gridded precipitation datasets (Fig. 4). Comparing correlation patterns of precipitation between Fig. 3 and Fig. 4 during the post-1979 sub-period, we found remarkable agreements over the Indian subcontinent. Comparisons of precipitation distributions associated with the ENSO phenomenon depicted by the CMAP and GPCP datasets also reveal reasonable consistency both over the landmass and tropical oceanic regions. As shown in Figs. 4a and c, the warm phase of EP ENSO during the 1979?2012 sub-period is associated with pronounced positive precipitation anomalies extending from the South American coast to the equatorial central Pacific, reflecting the eastward displacement of the rising branch of the Walker circulation. The impacts on summer precipitation produced by the CP type of El Ni?o are characterized by significantly enhanced precipitation concentrated in the western-to-central tropical Pacific spreading to the subtropical North Pacific and substantially suppressed precipitation stretching from the Maritime Continent to the South Asian region (Figs. 4b and d).
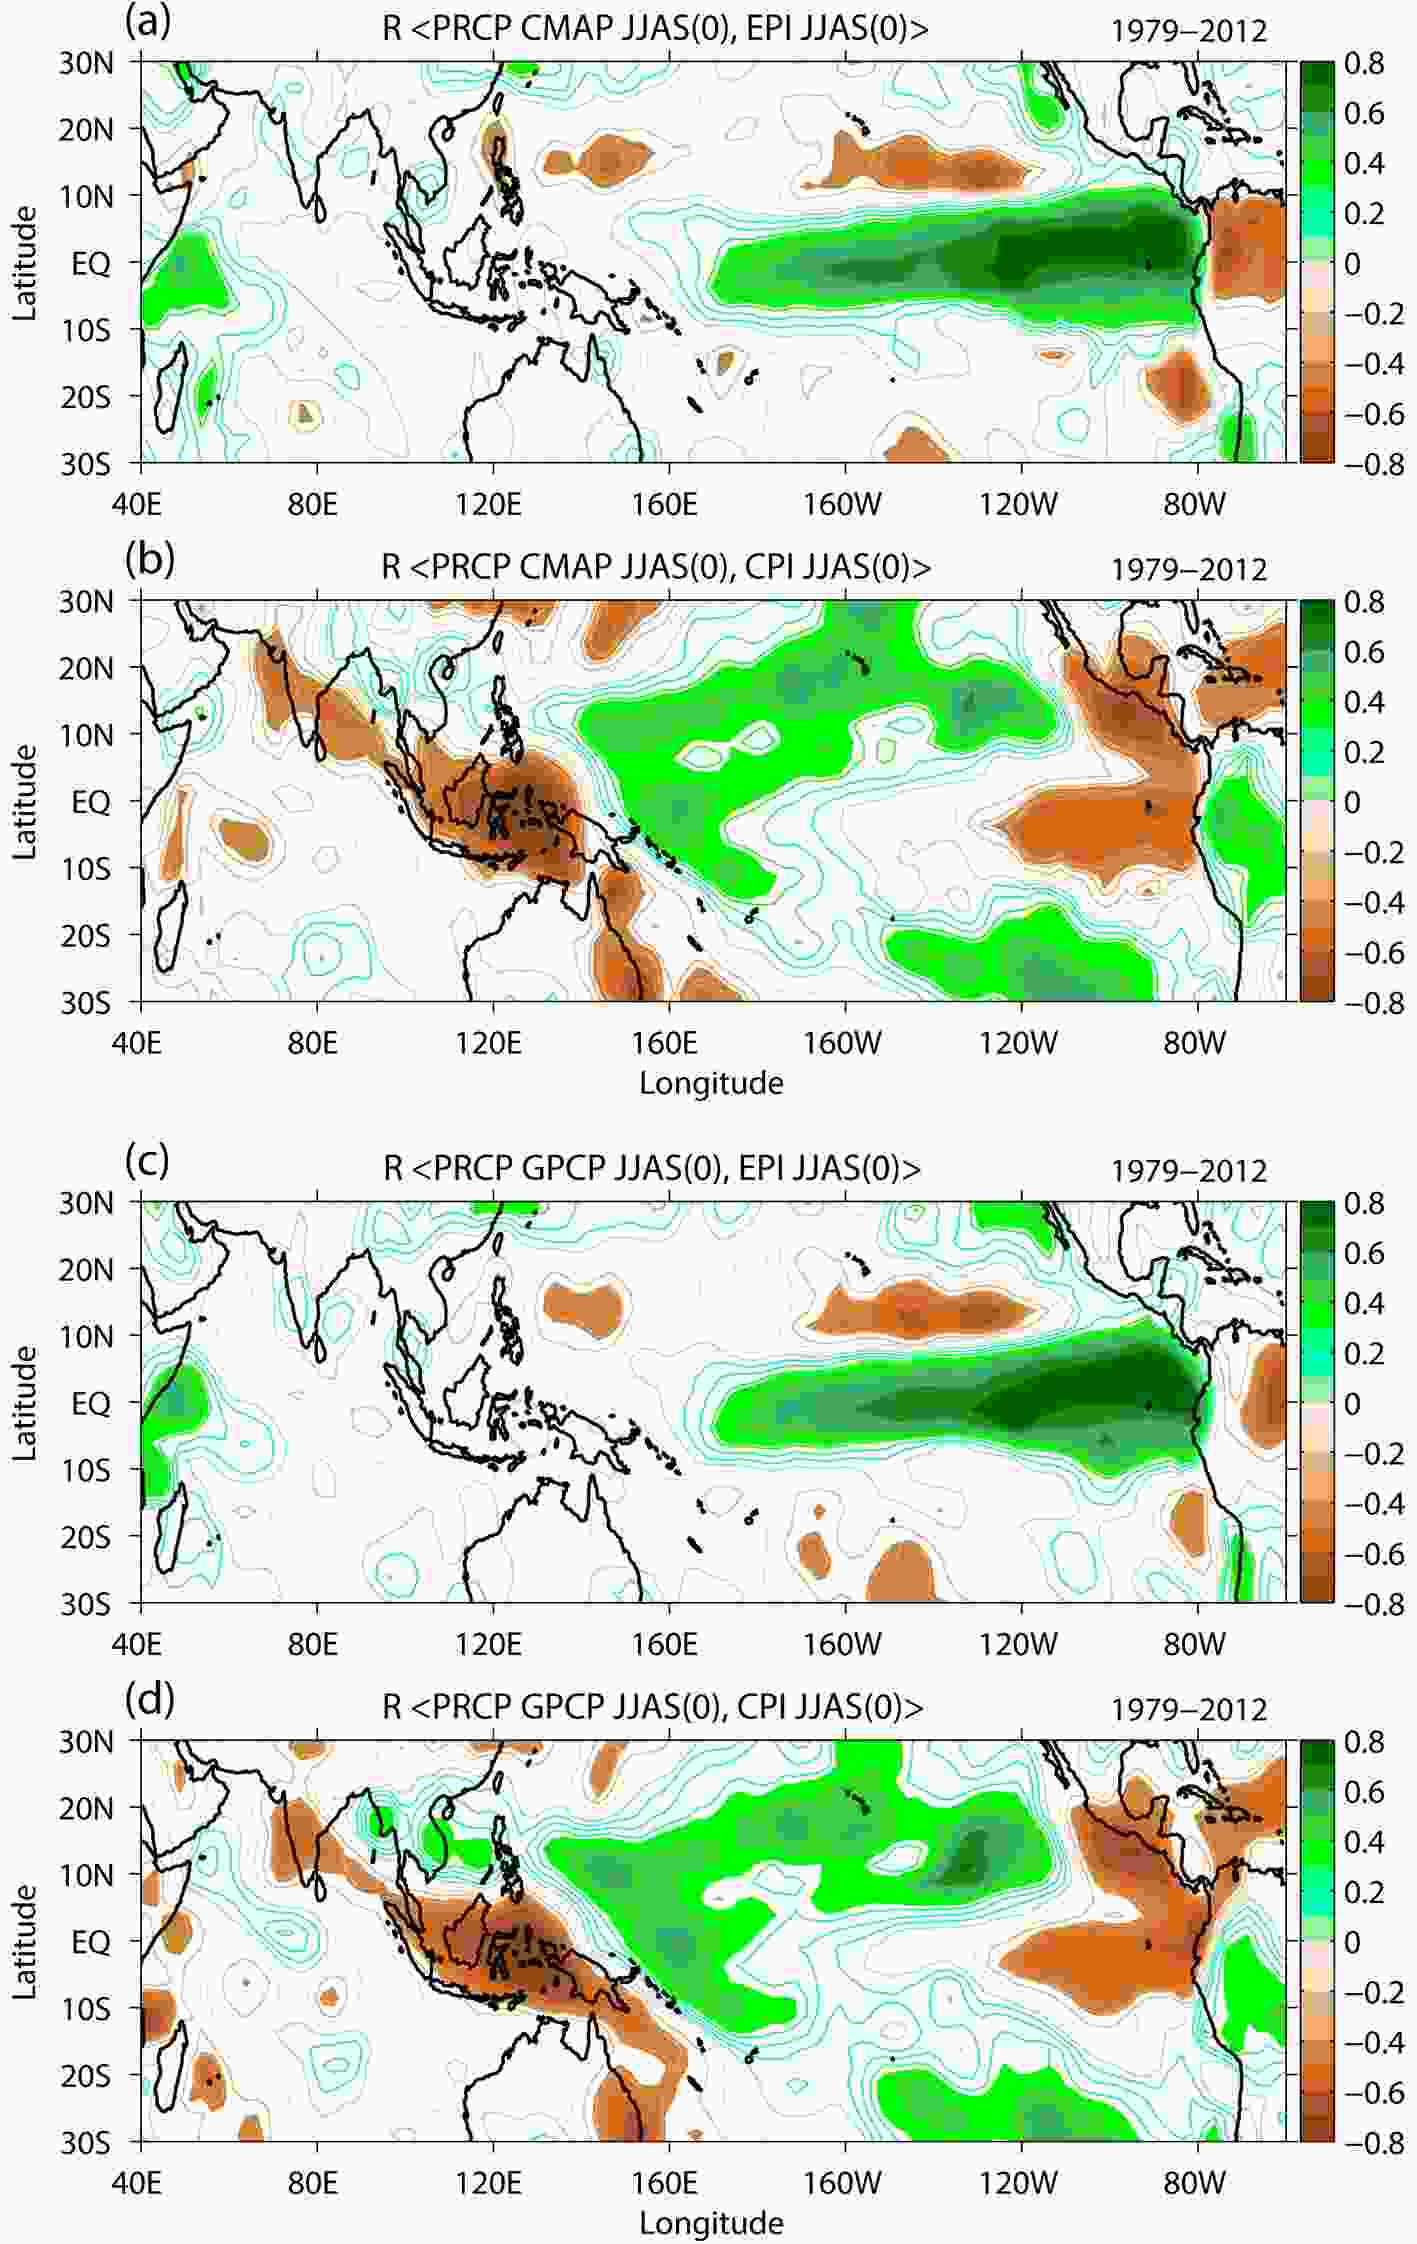 Figure4. Correlation patterns of precipitation (units: mm d?1) with (a, c) the EP ENSO index and (b, d) the CP ENSO index in the summer season (JJAS) during the 1979?2012 period. Precipitation patterns are based on (a, b) CMAP and (c, d) GPCP globally gridded precipitation datasets. Regions where the correlations are statistically significant at the two-tailed α = 0.05 level are filled with colors.
4.1. Responses of the low-level circulation and moisture flux
For the purpose of interpreting the precipitation anomalies over the South Asian region, we further examined the responses of horizontal wind at 850 hPa and vertically integrated moisture flux to the two types of ENSO (Figs. 5, 6 and 7). Changes in monsoonal precipitation may be attributed to dynamic effects related to variations in the strength of monsoonal circulation. The major characteristics of the low-level circulation related to the SASM include the cross-equatorial Somali jet originated from Mascrene high and flowing into the near-equatorial Arabian Sea (Findlater, 1969; Rodwell and Hoskins, 1995) and a low-level jet characterized by prevailing westerlies to transport moisture across the southern part of South Asia and the Bay of Bengal (Joseph and Raman, 1966). The low-level horizontal wind anomalies accompanied by the warm phase of EP ENSO during the earlier (1950?1978) sub-period (e.g., northeasterly anomalies along the eastern coast of Africa and easterly anomalies over the near-equatorial Arabian Sea) are opposite to the climatological low-level monsoon circulation (Fig. 5a), which are unfavorable for atmospheric moisture transport into the South Asian region. Therefore, the significant deficiency in the SASM precipitation (Figs. 2b and 3a) during the EP El Ni?o developing summer in the earlier sub-period can be explained by the anomalously less moisture transport from the tropical Indian Ocean source region into South Asia (Fig. 6a) and the anomalous moisture flux divergence over the Indian subcontinent (Fig. 7a).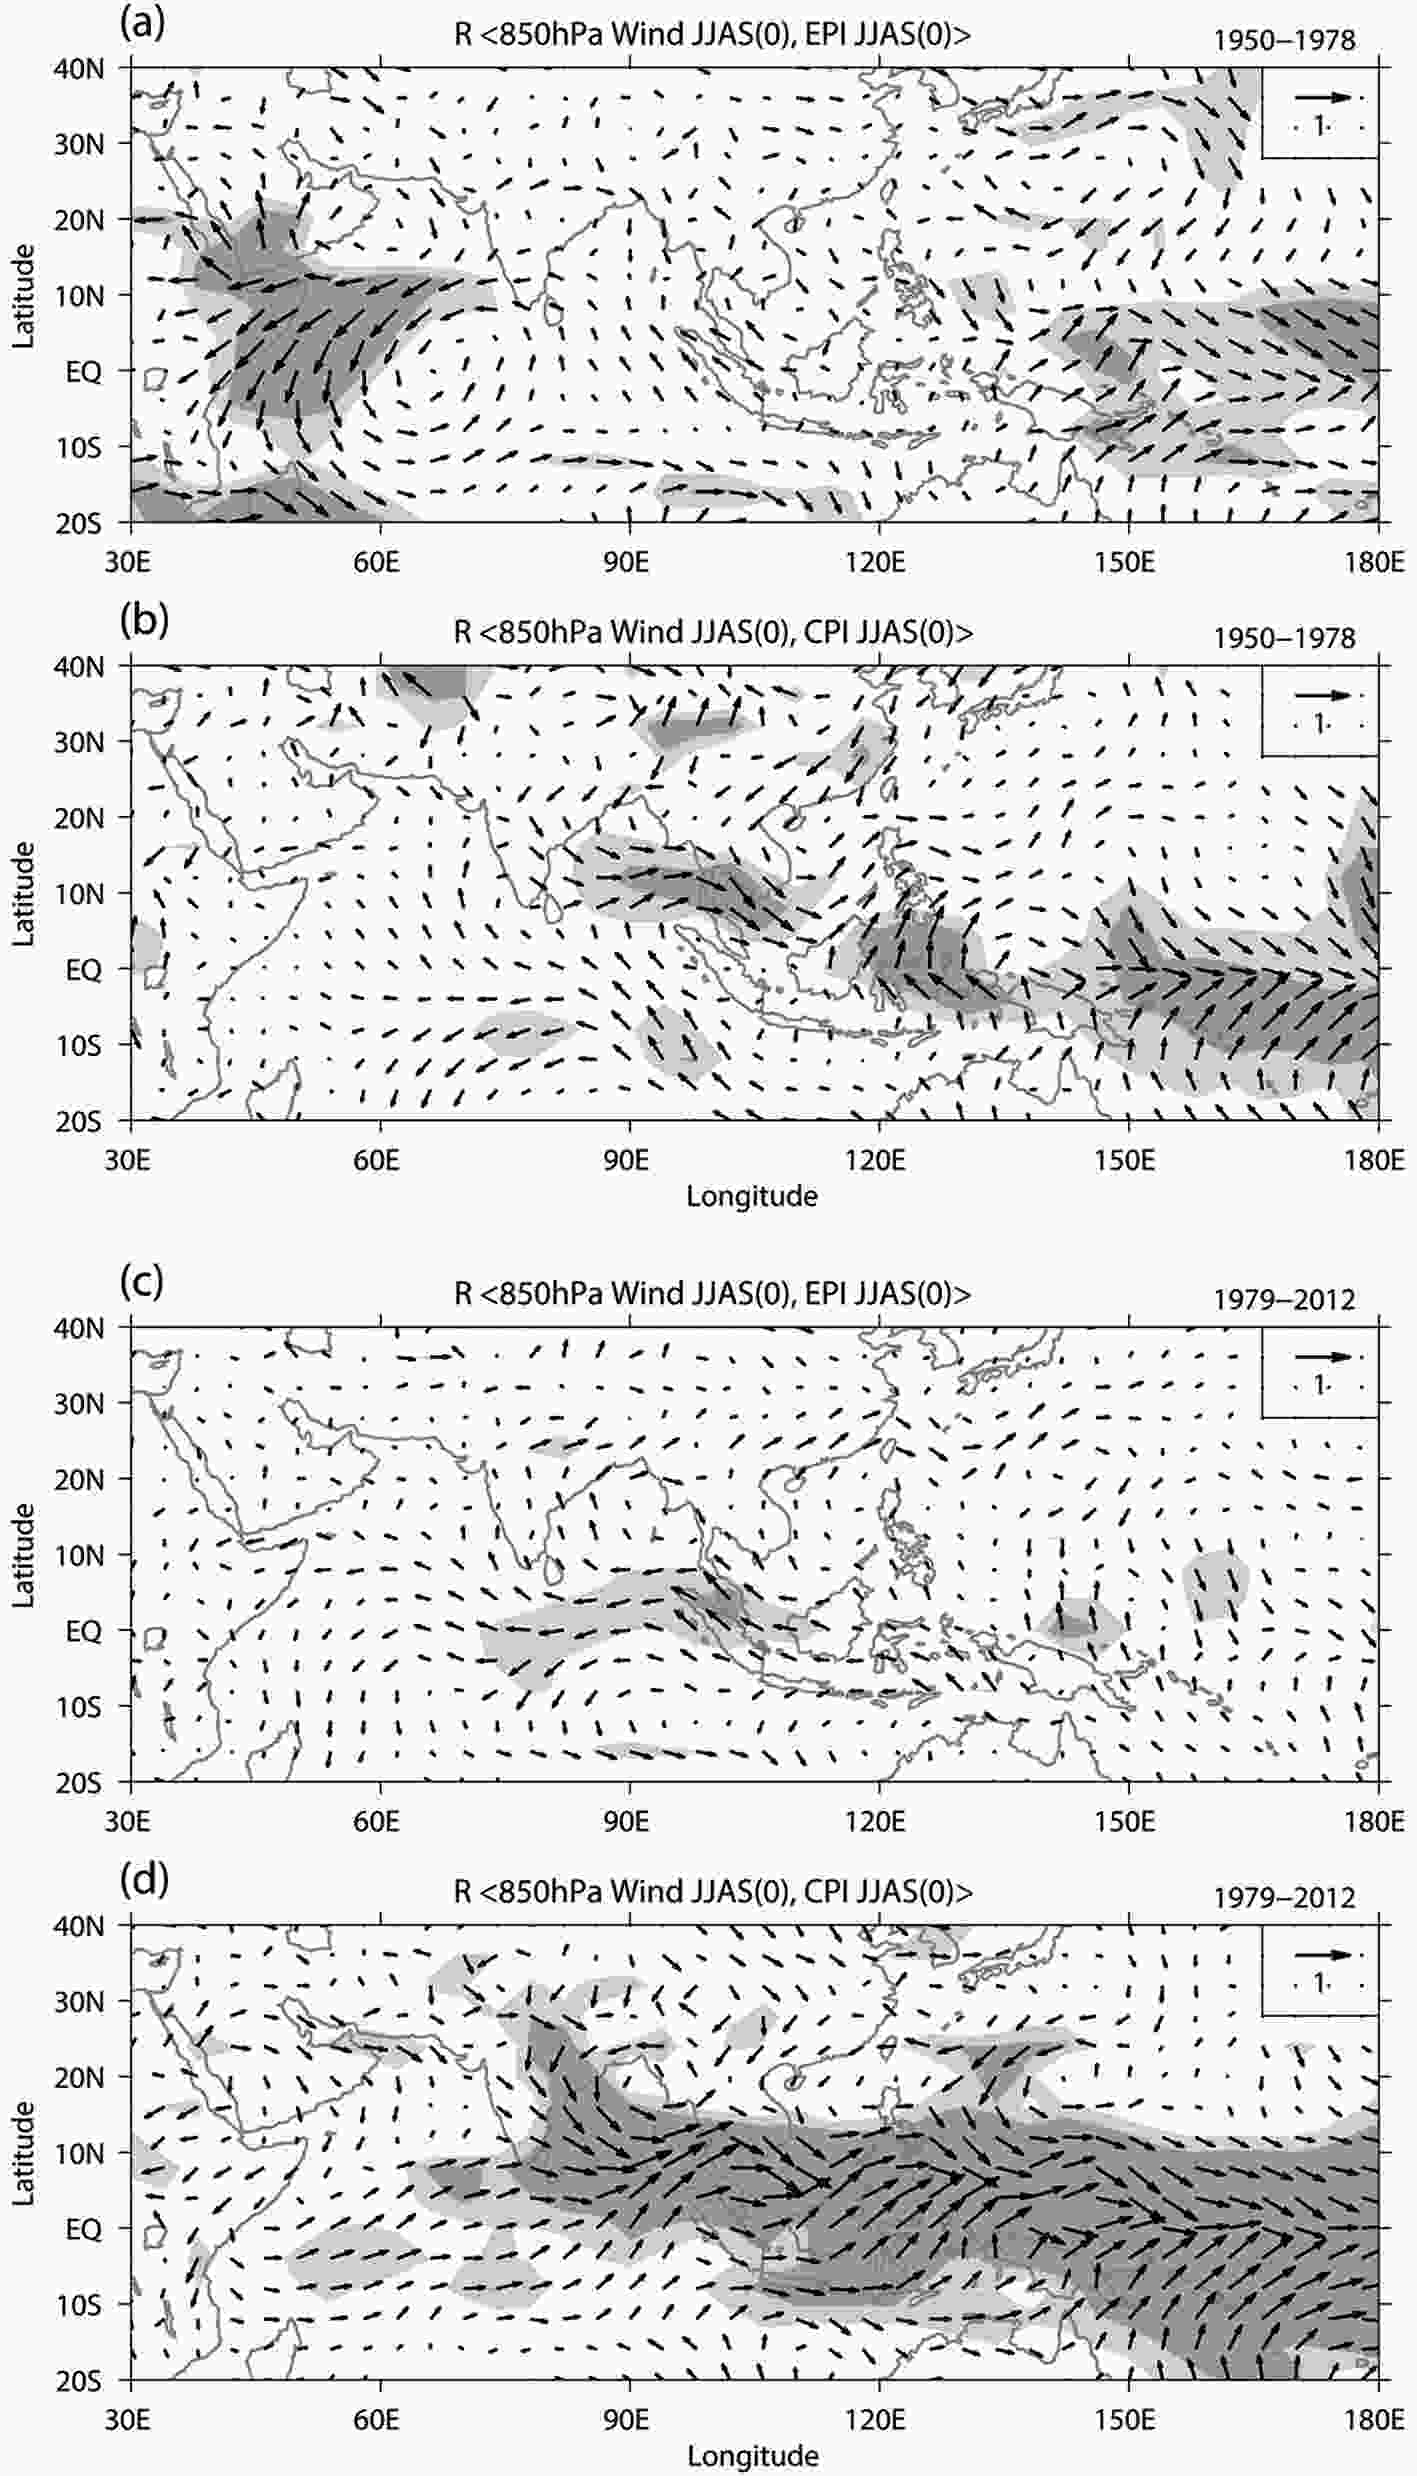 Figure5. Correlation patterns of horizontal wind at 850 hPa (units: m s?1) with (a, c) the EP ENSO index and (b, d) the CP ENSO index in the summer season (JJAS) during (a, b) the 1950?78 sub-period and (c, d) the 1979?2012 sub-period. Horizontal winds are obtained from the Twentieth Century Reanalysis dataset. Regions where the correlations are statistically significant with respect to at least one component of horizontal wind at the two-tailed α = 0.01 and α = 0.05 levels are heavily and lightly shaded in grey, respectively.
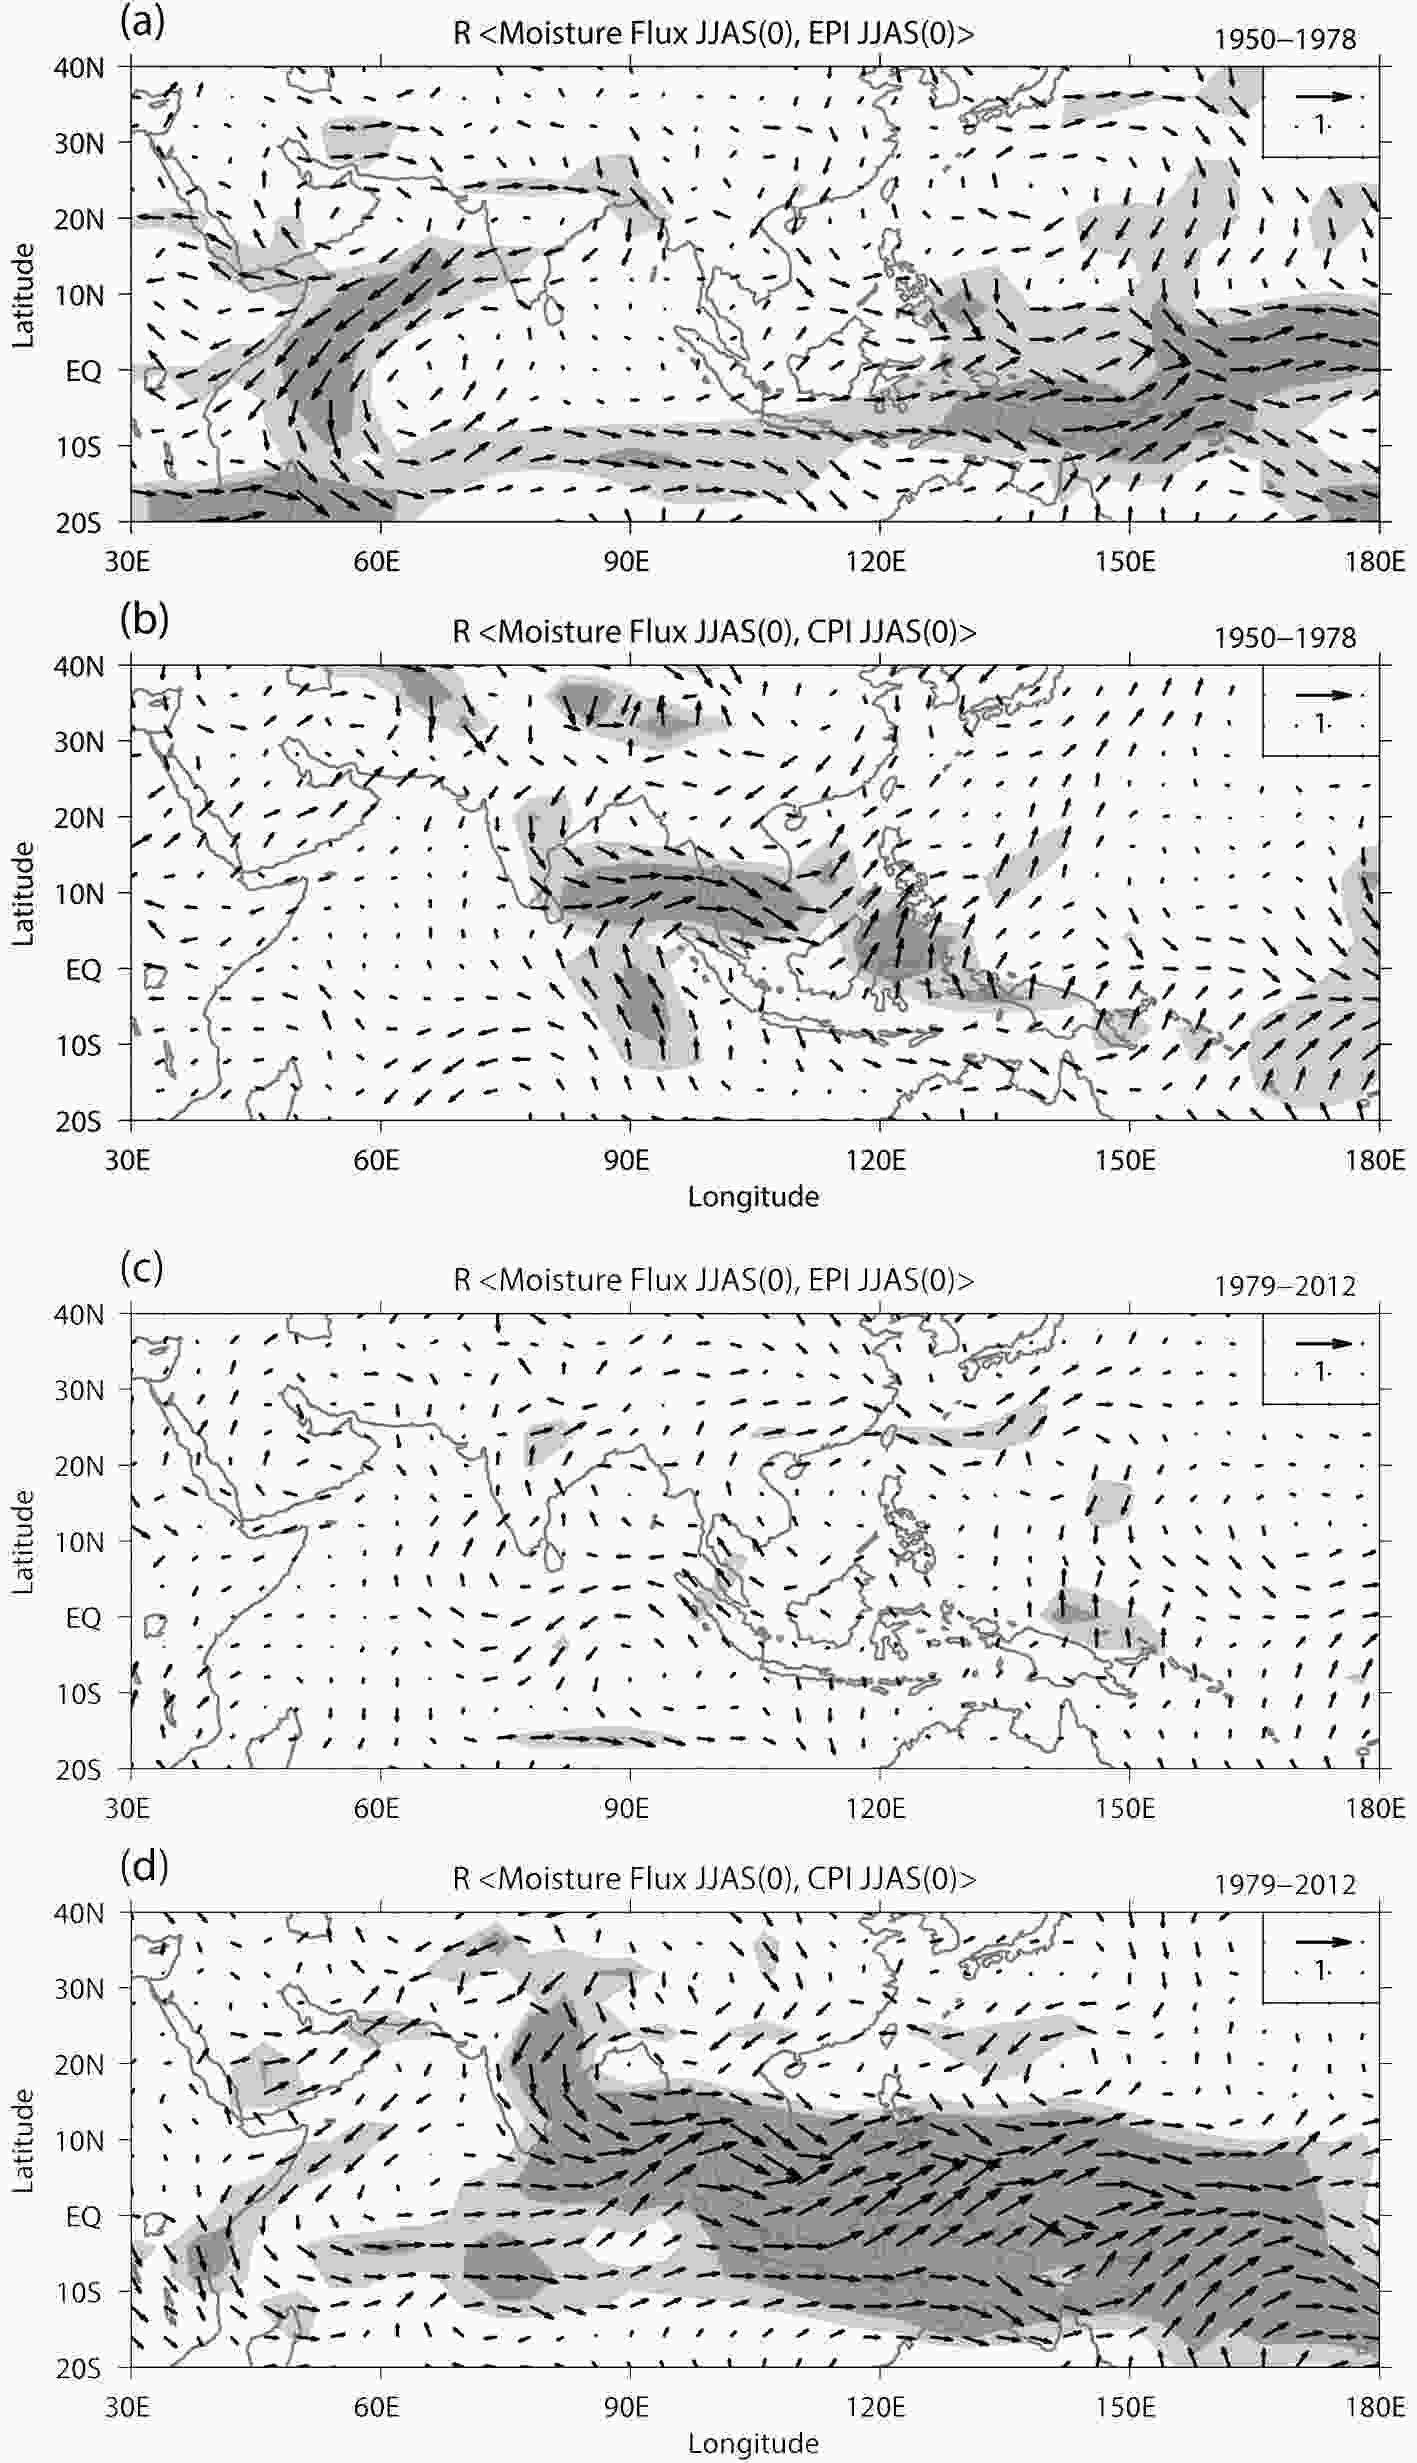 Figure6. As in Fig. 5 but for vertically integrated moisture flux (units: kg m?1 s?1). Moisture fluxes are calculated from the Twentieth Century Reanalysis dataset and integrated vertically from 1000 hPa to the top of the atmosphere.
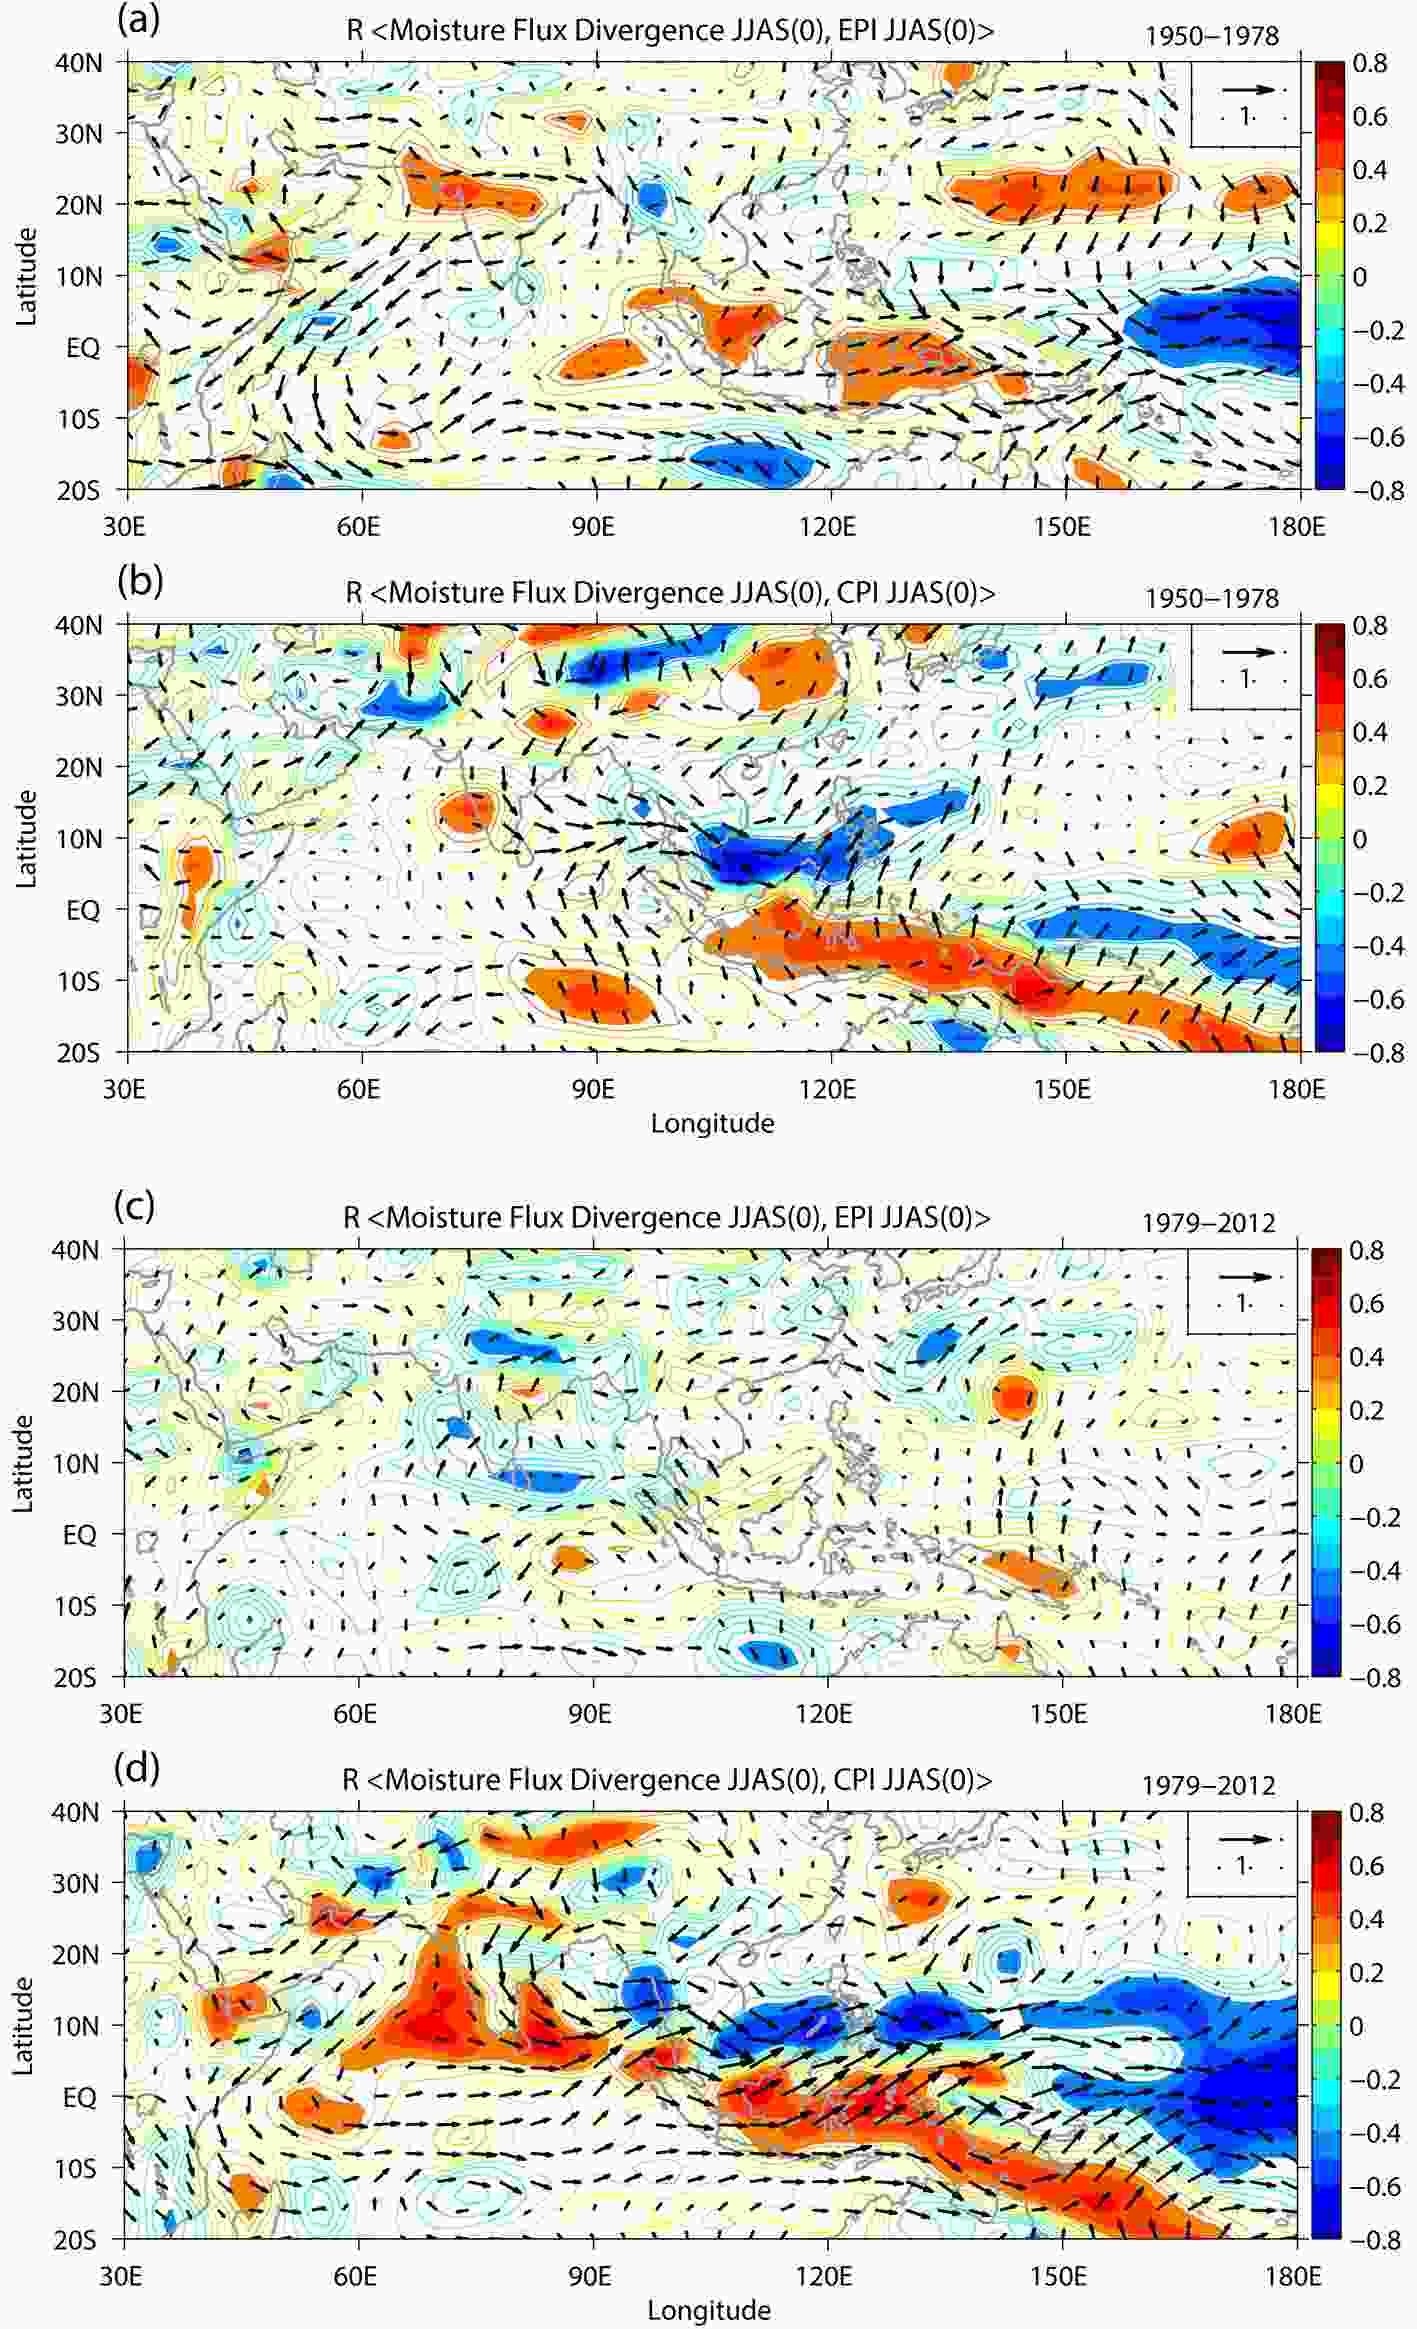 Figure7. Correlation patterns of vertically integrated moisture flux (vectors; units: kg m?1 s?1) overlaid on moisture flux convergence?divergence (contours; units: kg m?2 s?1) with (a, c) the EP ENSO index and (b, d) the CP ENSO index in the summer season (JJAS) during (a, b) the 1950?78 sub-period and (c, d) the 1979?2012 sub-period. Regions where the correlations between moisture flux convergence?divergence and ENSO indices are statistically significant at the two-tailed α = 0.05 level are filled with colors.
During the developing summer of CP El Ni?o in the later (1979?2012) sub-period, the significant northwesterly anomalies dominating over the southern part of South Asia may prevent atmospheric moisture from traveling through these regions (Figs. 5d, 6d and 7d), resulting in pronounced dry conditions over southern India and the southwestern part of the Bay of Bengal (Figs. 3d and 4d). Another prominent feature of the low-level horizontal wind anomalies over South Asia is an anomalous cyclonic circulation occupying the northern part of the Bay of Bengal (Fig. 5d). The strengthened moisture transport and enhanced moisture flux convergence associated with this anomalous low-level cyclone (Figs. 6d and 7d) contribute to anomalously wet conditions (Fig. 4d).
2
4.2. Roles of the Walker and regional Hadley circulations
During the earlier (1950?78) sub-period, the anomalous Walker circulation associated with the positive phase of EP ENSO is characterized by the anomalous rising motion over the equatorial eastern and central Pacific and the anomalous sinking motion over the equatorial western Pacific (Fig. 8a). The composite warming pattern of these developing EP El Ni?o is characterized by positive SST anomalies throughout the eastern-to-central equatorial Pacific extended to the dateline (Fig. 9a). The Walker circulation can also be represented by the velocity potential at 200 hPa, with a negative (positive) anomaly corresponding to anomalous ascending (descending) motion. The composite pattern of velocity potential anomalies at 200 hPa in response to the developing EP El Ni?o indicates rising anomalies centered over the equatorial central Pacific around 160°W, implying that the central Pacific warming is more effective in driving anomalous rising motion. The subsidence anomalies not only occur in the equatorial western Pacific, but also extend to the South Asian region (Fig. 10a). These subsidence anomalies suppress convection and lead to pronounced dry conditions dominating over the Maritime Continent and the Indian subcontinent. By comparison, the anomalous ascending branch of the Walker circulation induced by the EP type of El Ni?o in the later (1979?2012) sub-period (Fig. 9c) shifts eastward significantly (Figs. 8b and 10c). Accordingly, the compensatory subsidence anomalies also shift southeastward, leaving the Indian subcontinent less affected by the suppressed convection (Fig. 10c).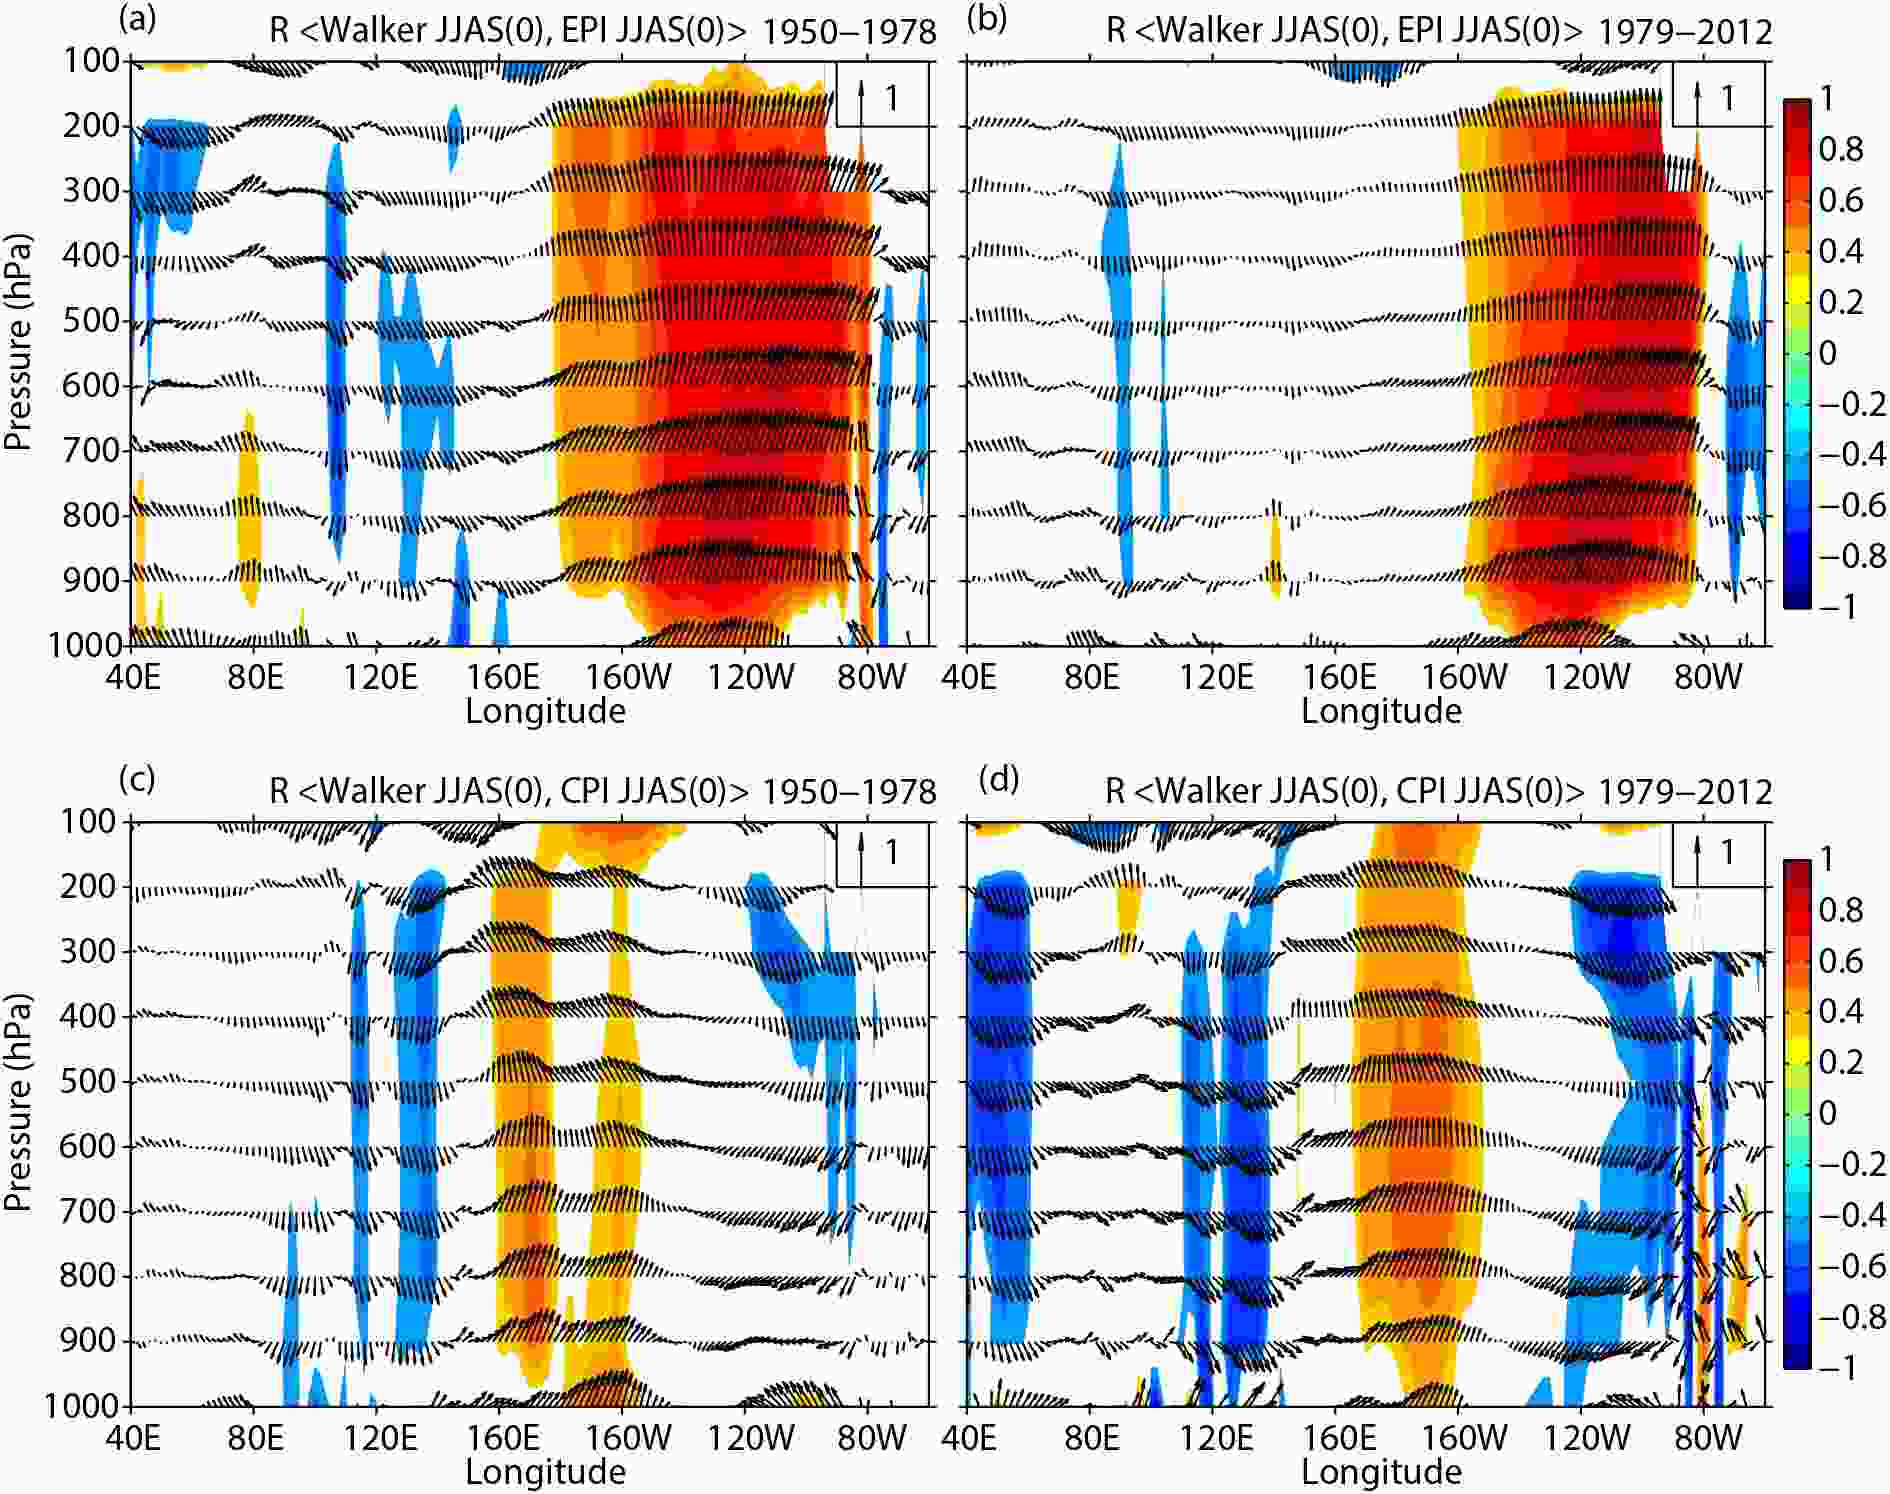 Figure8. Correlation patterns of anomalous Walker circulation averaged over 5°S?5°N with (a, b) the EP ENSO index and (c, d) the CP ENSO index in the summer season (JJAS) during (a, c) the 1950?78 sub-period and (b, d) the 1979?2012 sub-period. Zonal velocity (units: m s?1) and vertical velocity (units: m s?1) are obtained from the Twentieth Century Reanalysis dataset. Regions where the correlations between vertical velocity and ENSO indices are statistically significant at the two-tailed α = 0.05 level are filled with colors.
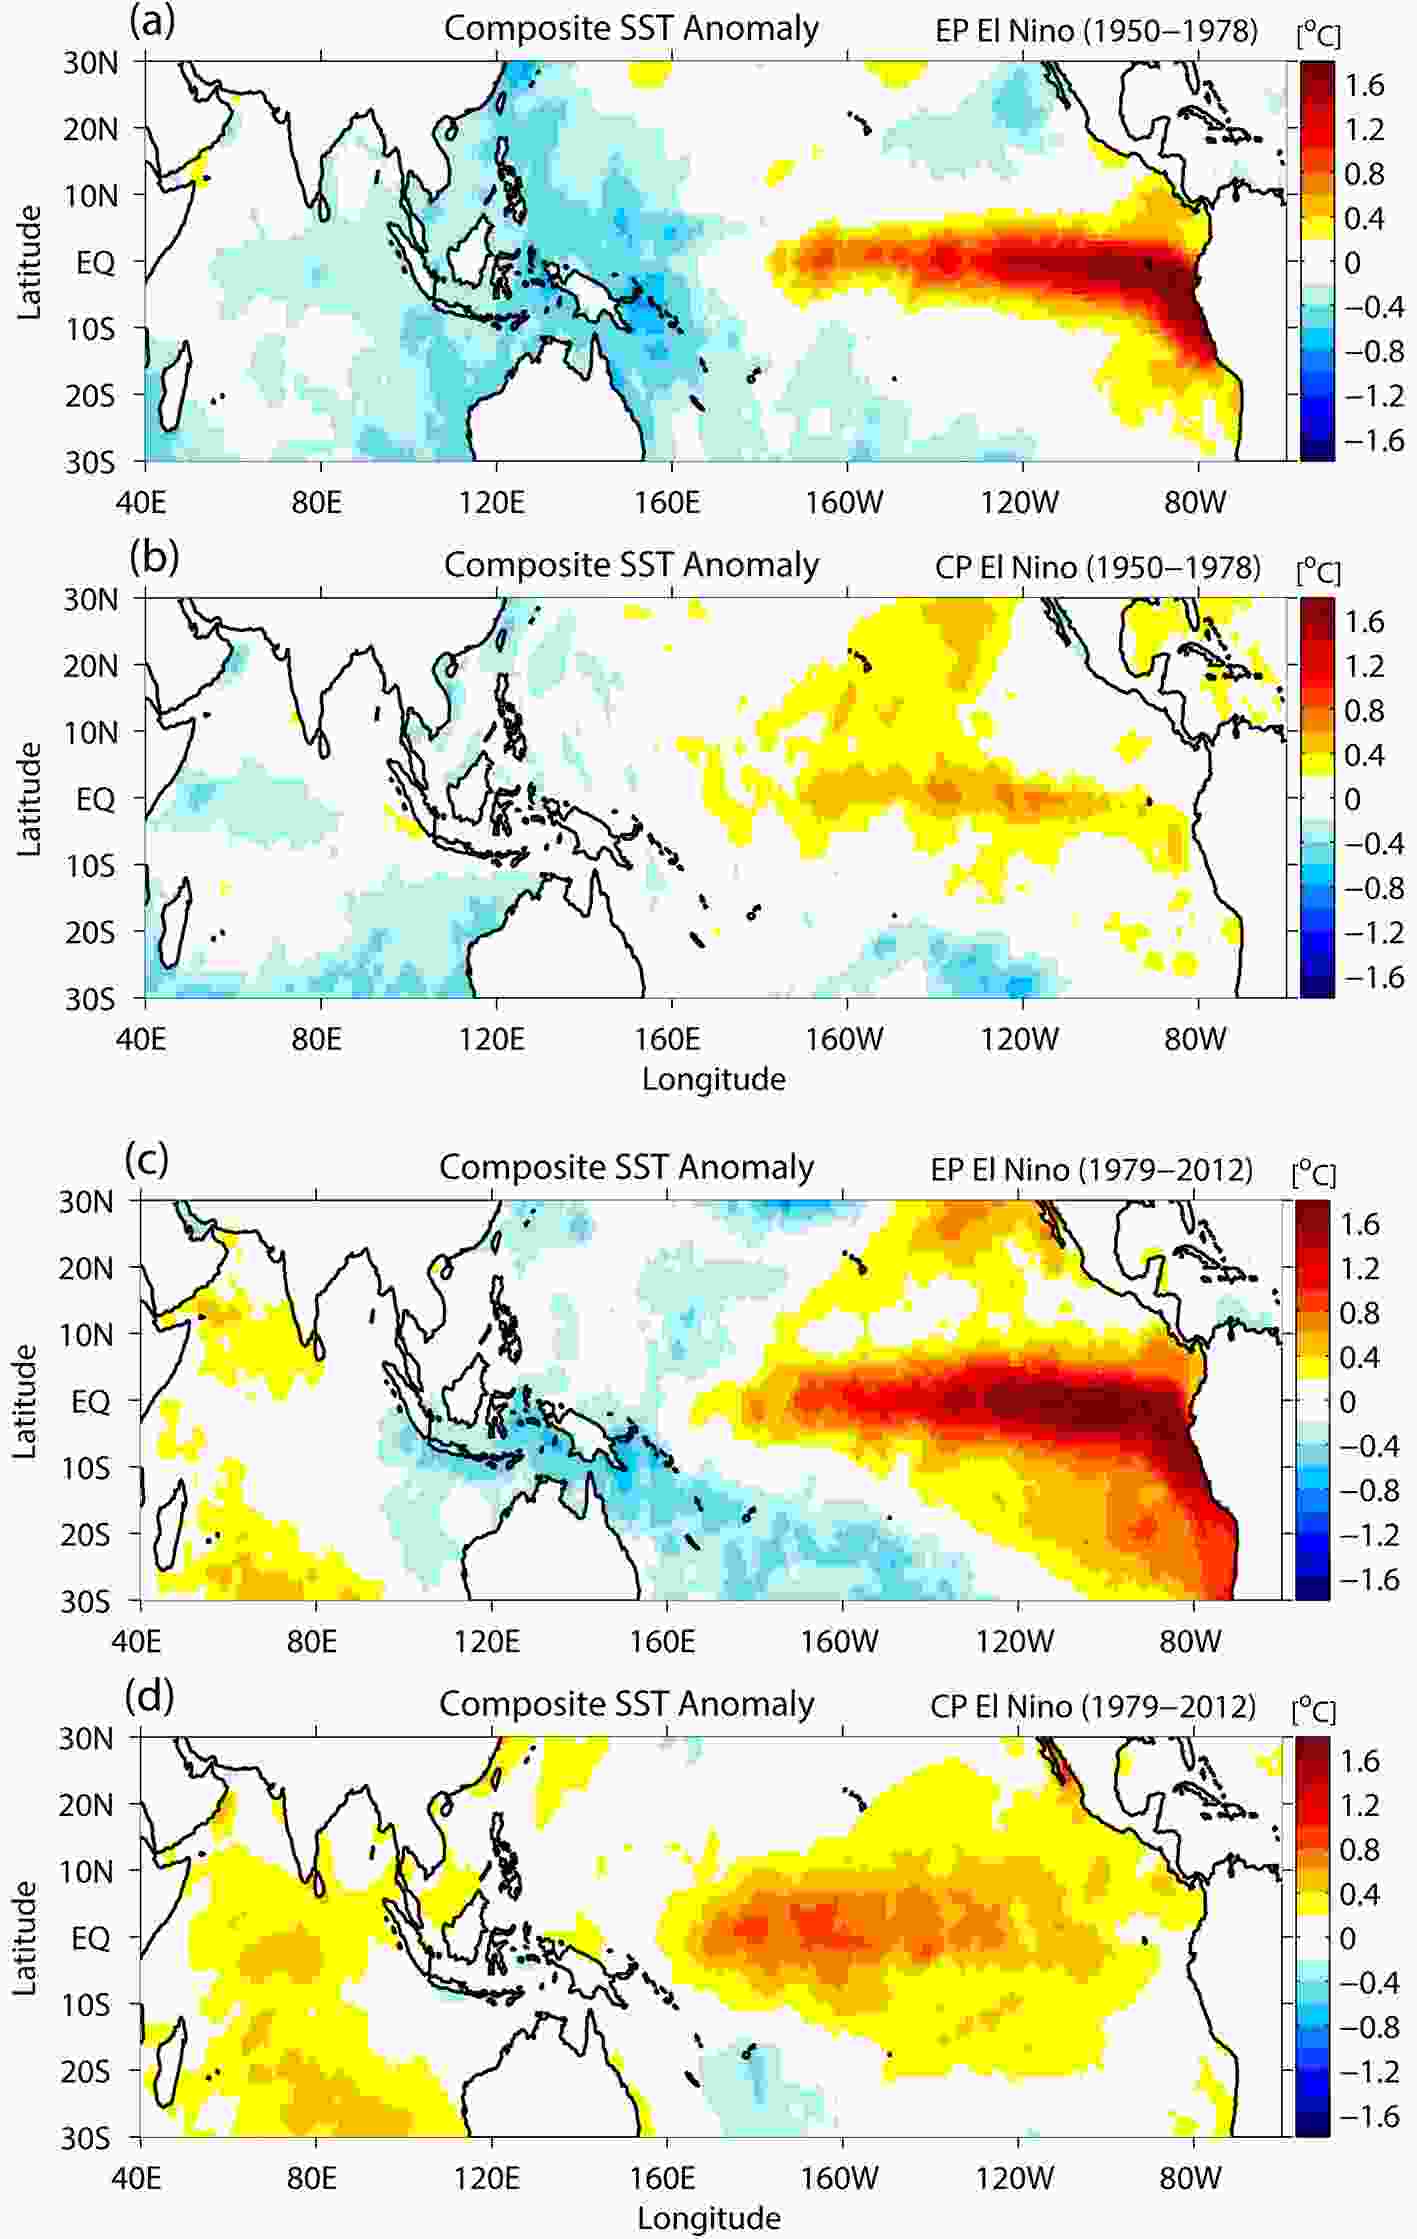 Figure9. Composite SST anomalies (units: °C) in the developing summer of (a, c) EP El Ni?o and (b, d) CP El Ni?o during (a, b) the 1950?78 sub-period and (c, d) the 1979?2012 sub-period.
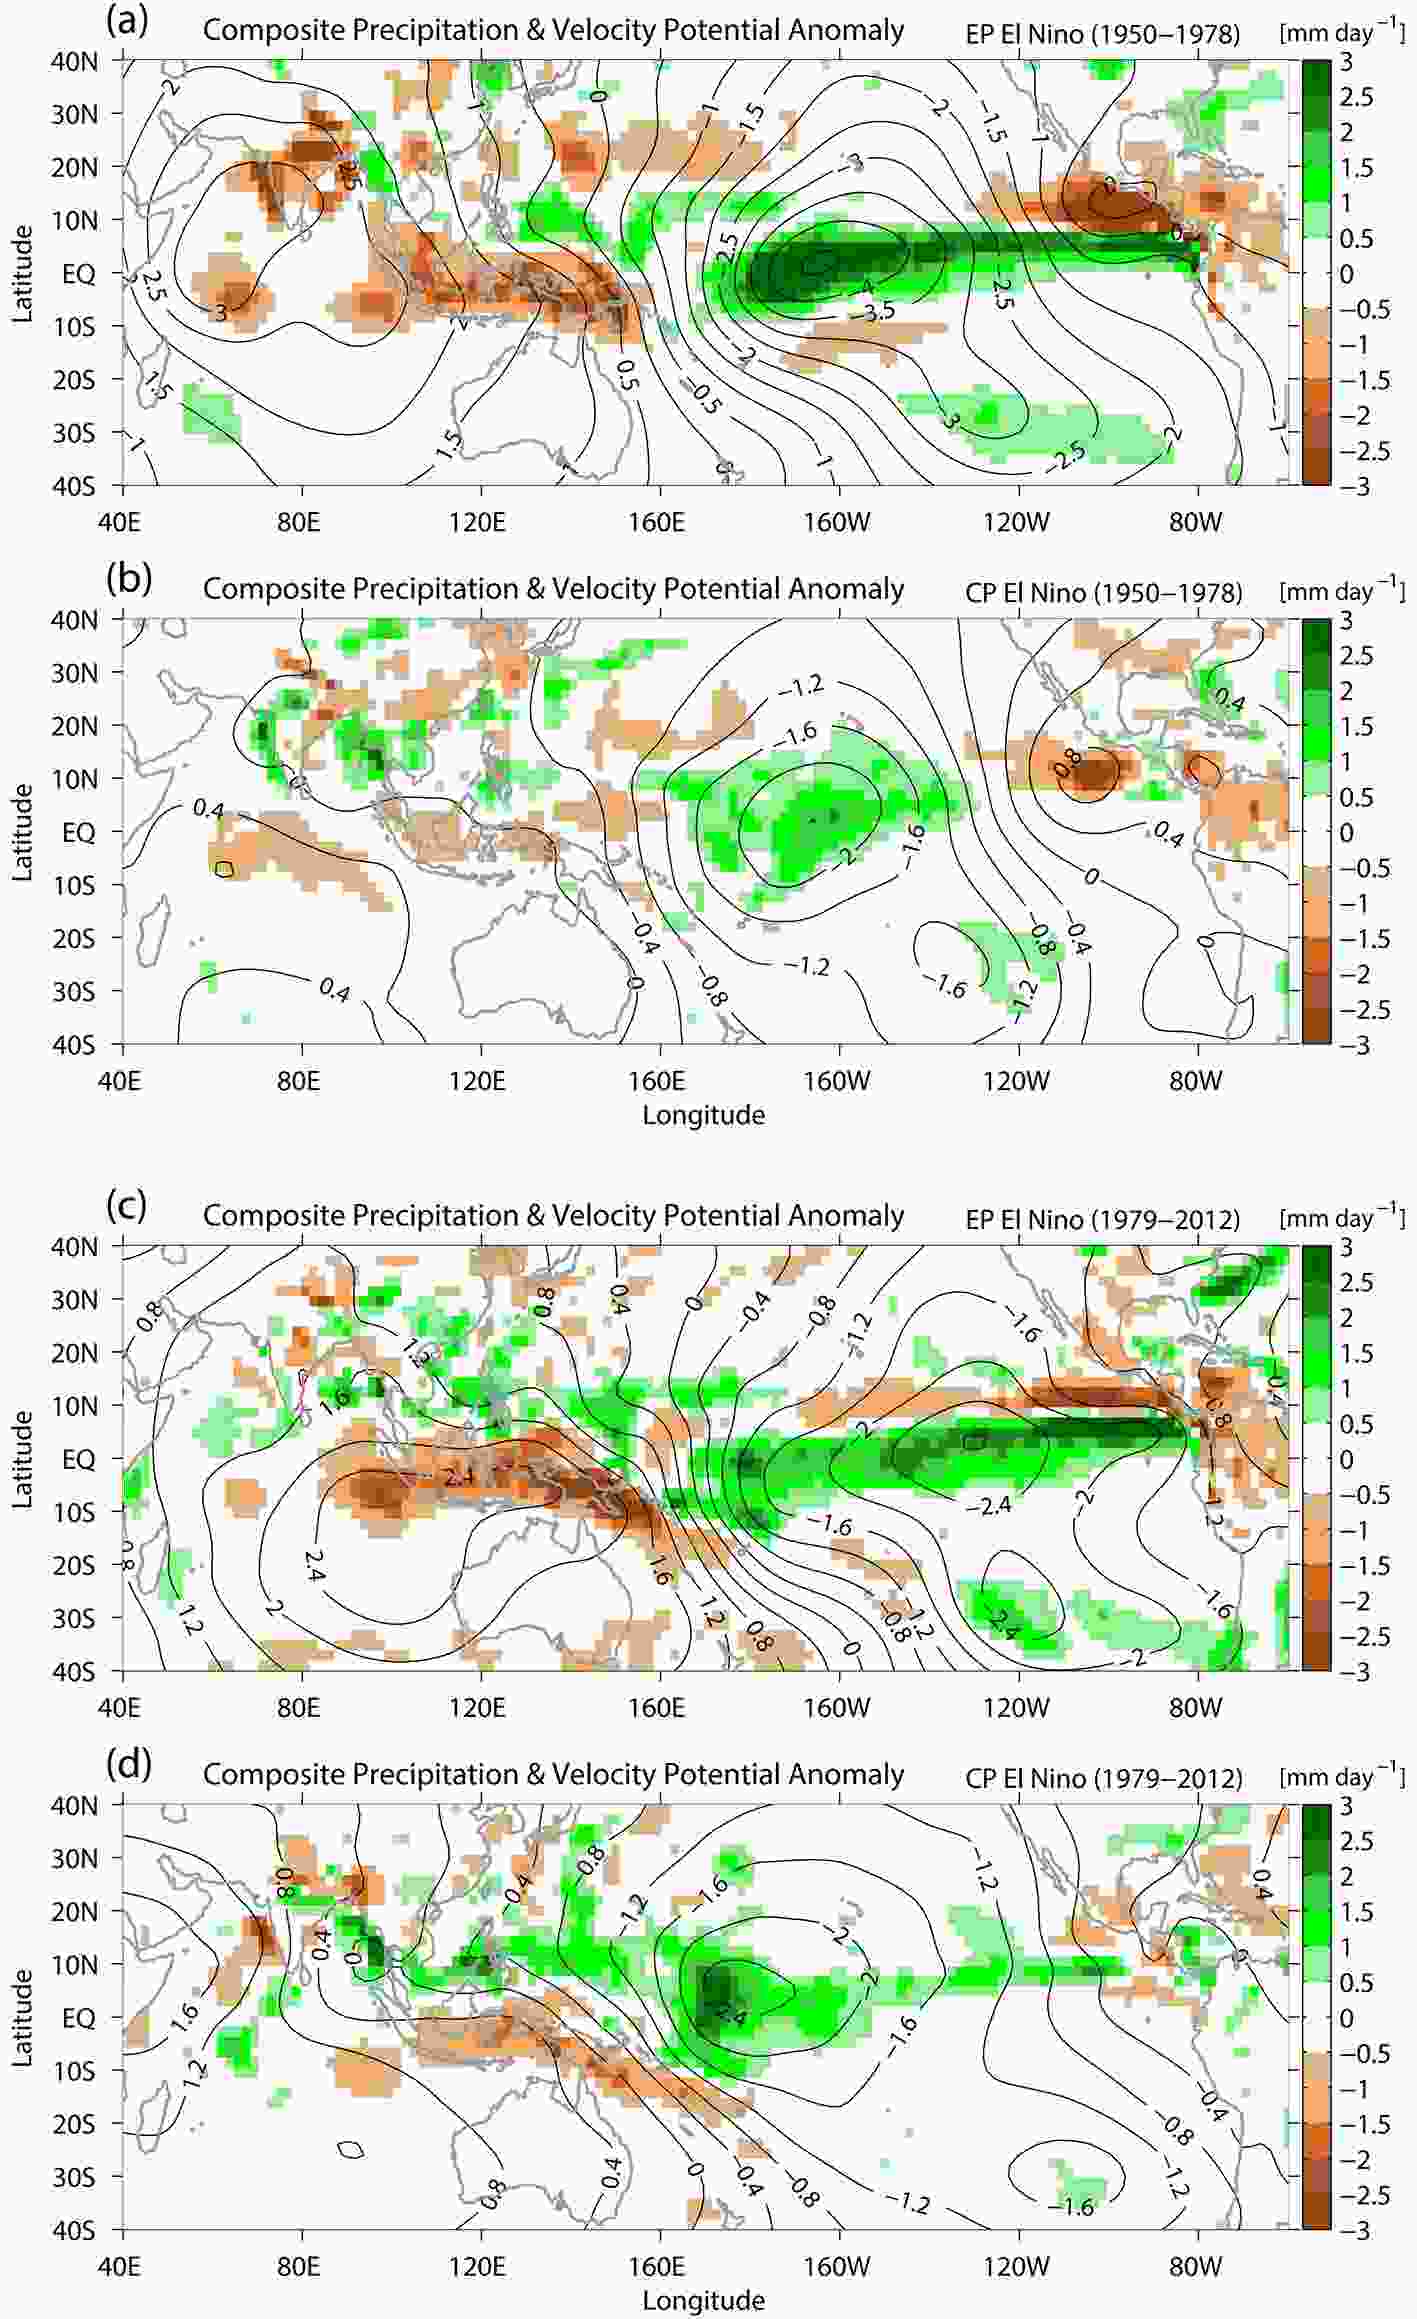 Figure10. Composite velocity potential anomalies at 200 hPa (contours; units: 106 m2 s?1) superimposed on precipitation anomalies (shaded; units: mm d?1) in the developing summer of (a, c) EP El Ni?o and (b, d) CP El Ni?o during (a, b) the 1950?78 sub-period and (c, d) the 1979?2012 sub-period. Precipitation and velocity potential are obtained from the Twentieth Century Reanalysis dataset.
The correlation and composite patterns of anomalous Walker circulation during the CP El Ni?o developing summer are substantially different from those during the EP El Ni?o developing summer. The center of anomalous rising motion corresponding to the developing CP El Ni?o during the earlier sub-period is located in the equatorial central Pacific around 170°W (Figs. 8c and 10b). However, the composites of anomalous subsidence associated with these CP El Ni?o events are quite weak and confined to Indonesia and the tropical Indian Ocean, resulting in normal monsoon rainfall over the Indian subcontinent (Fig. 10b). Compared to the earlier sub-period, the maximum positive SST anomalies of the developing CP El Ni?o during the later sub-period intensifies and shifts westward apparently (Figs. 9b and 9d). Correspondingly, the rising anomalies of the Walker circulation excited by sea surface warming intensifies and shifts westward slightly to the dateline (Figs. 8d and 10d). Consequently, the composite responses of anomalous sinking motion to CP El Ni?o warming strengthen considerably and are centered to the west of but very close to India, leading to suppressed convection and decreased precipitation over the Indian subcontinent (Fig. 10d).
It is also worth noting that the compensatory subsidence as a branch of anomalous Walker circulation may excite an anomalous regional Hadley circulation. During the CP El Ni?o developing summer, the anomalous local Hadley circulation averaged over 90°?130°E is excited, with anomalous descending motion dominating over the Maritime Continent and anomalous ascending motion around 5°?20°N (Figs. 11a and b). The substantially enhanced precipitation over the northern part of the Bay of Bengal and the Indochina Peninsula (Fig. 4d) can be explained by this anomalous rising motion, which is also consistent with the anomalous low-level cyclonic circulation and increased moisture flux convergence in the same region (Figs. 5d, 6d and 7d). Slightly positive SST anomalies in the Indian Ocean associated with the developing CP El Ni?o in the later sub-period (Fig. 9d) leads to increased surface air humidity, and thus may also contribute to enhanced monsoonal precipitation over the northern part of the Bay of Bengal (Fig. 4d). By contrast, no significant rising anomalies can be discerned in the northern subtropical region during the EP El Ni?o developing summer (not shown), and almost the entire South Asian region is controlled by the subsidence anomalies, especially in the earlier sub-period (Fig. 10a). These findings imply that the position and strength of the rising and sinking anomalies of large-scale circulations, which greatly affect rainfall patterns over the broader South Asian region, are quite sensitive to the detailed distributions of SST anomalies in the tropical Pacific.
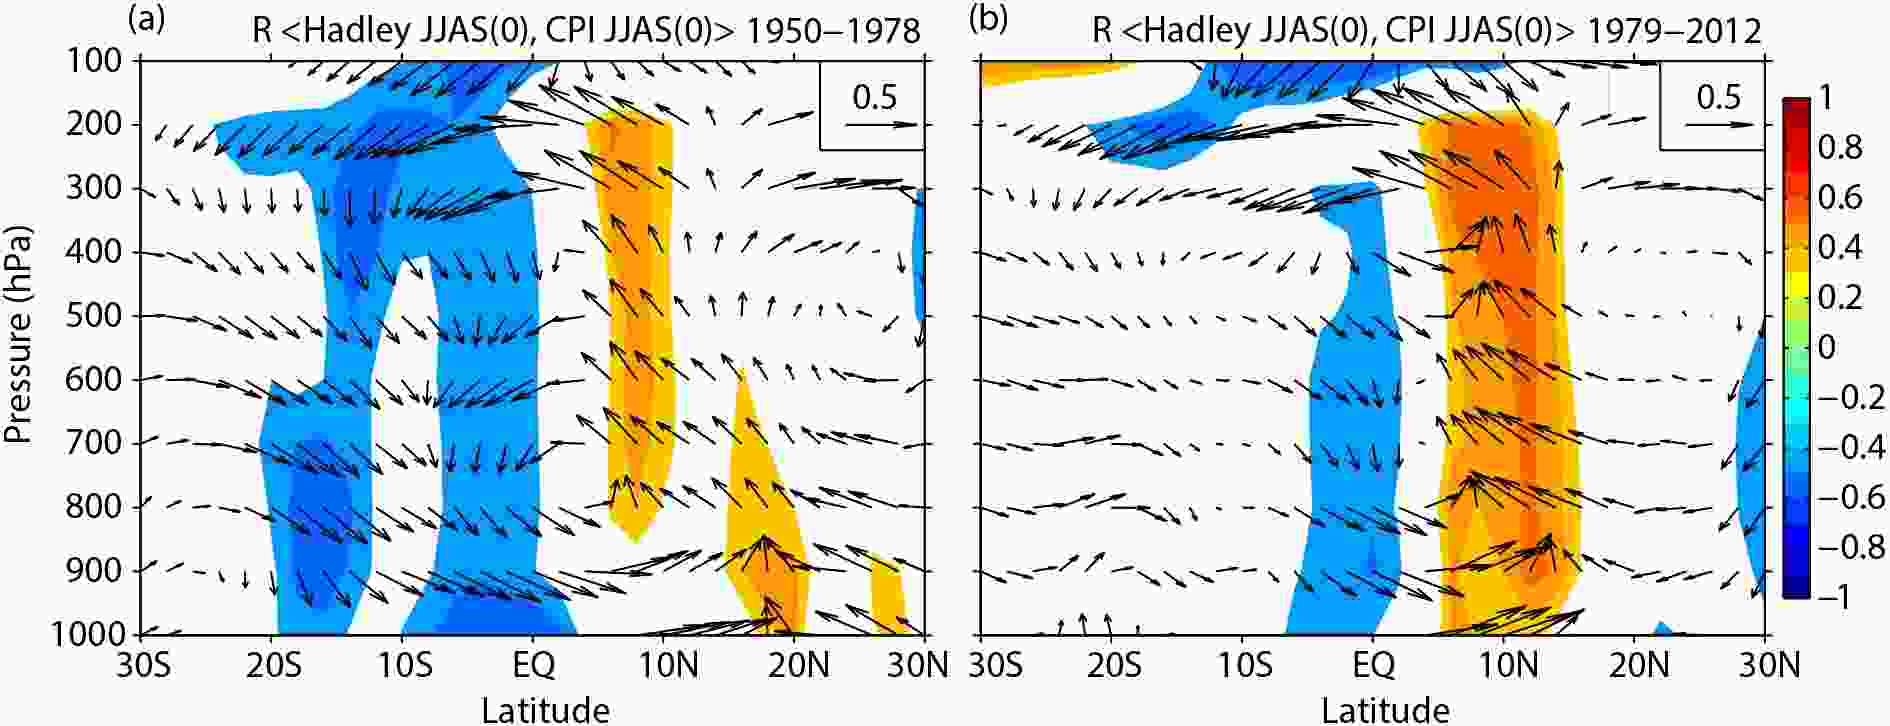 Figure11. Correlation patterns of anomalous Hadley circulation averaged over 90°?130°E with the CP ENSO index in the summer season (JJAS) during (a) the 1950?78 sub-period and (b) the 1979?2012 sub-period. Meridional velocity (units: m s?1) and vertical velocity (units: m s?1) are obtained from the Twentieth Century Reanalysis dataset. Regions where the correlations between vertical velocity and ENSO indices are statistically significant at the two-tailed α = 0.05 level are filled with colors.
The drought-producing El Ni?o warming patterns during the developing summer in the earlier (1950?78) sub-period are mainly of the canonical EP type (e.g., 1951, 1957, 1965, 1972). These El Ni?o warming patterns are characterized by positive SST anomalies in the eastern-to-central equatorial Pacific extended to the dateline. The anomalous rising motion of the Walker circulation excited by El Ni?o warming is centered over the equatorial central Pacific, though the maximum sea surface warming for these typical El Ni?o events is located in the equatorial eastern Pacific. Accordingly, the compensatory subsidence as a branch of anomalous Walker circulation extends from the equatorial western Pacific to the South Asian region, leading to suppressed convection and decreased precipitation over the Maritime Continent and the Indian subcontinent. Moreover, the anomalously less atmospheric moisture flux into the South Asian region coinciding with this anomalous sinking motion is also responsible for the substantially decreased Indian monsoon rainfall during the EP El Ni?o developing summer in the earlier sub-period.
With the change of El Ni?o onset regime from eastern Pacific origin to western Pacific origin as revealed by Wang et al. (2019), the EP (CP) type of El Ni?o events occurred less (more) frequently after the late 1970s. Because of less frequent occurrence, the EP type of El Ni?o events are less important in affecting the Indian monsoon rainfall after the late 1970s. In contrast, the CP type of El Ni?o plays a far more prominent role in producing Indian monsoon droughts (e.g., 1986, 1987, 1991, 2002, 2004, 2009) during the later (1979?2012) sub-period. Corresponding to the maximum warming located in the equatorial central Pacific, the anomalous Walker circulation is excited with anomalous ascending motion centered around the dateline and anomalous descending motion extending from Indonesia to the west of India. The pronounced dry conditions over the Indian subcontinent can be attributed to this anomalous sinking motion of the Walker circulation as well as the significant northwesterly anomalies prevailing over southern India. In addition, the anomalous rising motion of an anomalous regional Hadley circulation within 90°?130°E is excited, giving rise to enhanced precipitation over the northern part of the Bay of Bengal and the Indochina Peninsula. Although both the developing EP El Ni?o during the earlier sub-period and the developing CP El Ni?o during the later sub-period could produce consistent and significant droughts over India, the precipitation anomalies over the broader South Asian region may be distributed differently.
Our analyses in this study also confirm that the responses of the SASM precipitation and the associated circulation to the developing El Ni?o events are sensitive to the detailed spatial distributions of tropical Pacific SST anomalies. On the one hand, El Ni?o events with the same “flavor” (e.g., the EP or CP types) may not necessarily produce consistent rainfall anomalies over the Indian subcontinent. On the other hand, the similar Indian monsoon droughts can be induced by the different types of El Ni?o (e.g., the EP type of El Ni?o during the pre-1979 sub-period and the CP type of El Ni?o during the post-1979 sub-period), though the precipitation distributions over the broader South Asian region might be inconsistent. As the ENSO indices are widely used as base predictors for the SASM variability, not only the intensity but also the specific SST anomaly configuration of an ENSO event should be taken into consideration to improve forecasting skill. Numerical modeling studies would be helpful to further investigate the physical processes of the SASM responses to diverse SST patterns of ENSO forcing imposed on the tropical Pacific.
Acknowledgements. This work was supported by the National Natural Science Foundation of China (Grant Nos. 41405058 and 41861144015) and the National Key R&D Program of China (2017YFA0603201). Support for the Twentieth Century Reanalysis Project dataset is provided by the U.S. Department of Energy, Office of Science Innovative and Novel Computational Impact on Theory and Experiment (DOE INCITE) program, and Office of Biological and Environmental Research (BER), and by the National Oceanic and Atmospheric Administration Climate Program Office.
