HTML
--> --> -->Feldstein (2003) argued that the lifetime, i.e., the duration of the lifecycle, of composite observed NAO events is approximately two weeks. However, results shown in some studies indicate that the lifetimes of observed NAO events vary greatly from event to event. A number of NAO events persist for about a few days only [e.g., see Fig. 1 of Benedict et al. (2004)]. Meanwhile, some extreme NAO events can even last up to a month [e.g., see Fig. 3 of Riviève and Orlanski (2007)]. Thus, observed NAO events can be classified into long- and short-lived NAO events.
 Figure1. The peak day of each identified positive and negative NAO event in the three sets of reanalysis data.
 Figure3. The percentage of occurrence of positive and negative observed NAO events with a lifetime of 3, 4, 5, …, 21 days in NCEP1 (top row), ERA-40 (middle row) and ERA5 (bottom row).
Song (2019) examined the long- and short-lived NAO events in a perpetual-boreal-winter long-term run conducted with a simplified atmospheric model. Song’s results indicate that, unlike the canonical NAO, which is locally confined to the North Atlantic regions, the spatial structure of composite long-lived NAO events in the model is similar to the Northern Hemisphere annular mode (NAM; Wallace, 2000). Because at about the same latitudes the North Atlantic meridional dipole of the NAO coincides with a North Pacific meridional dipole (NPMD), Song (2019) further proved that the presence of the NPMD is a favorable preceding factor for the appearance of long-lived NAO events.
Note, however, that Song (2019) did not inspect long- and short-lived NAO events in observations. This is because, although the temporal evolutions of NAO events are primarily determined by tropospheric internal dynamics (Feldstein, 2003), in the real atmosphere the variations of the NAO can also be modulated by stratospheric states (Ambaum and Hoskins, 2002; Black, 2002) and many external circumstances (e.g., Ulbrich and Christop, 1999; Shindell et al., 2001; Czaja and Frankignoul, 2002; Stenchikov et al., 2002; Cassou, 2008; Li and Lau, 2012). To focus on the internal dynamics of the troposphere and avoid possible contaminations due to external factors, Song (2019) chose to analyze long- and short-lived NAO events in a simplified atmospheric model instead of in observations.
Undoubtedly, the properties of long- and short-lived observed NAO events and the anomalous atmospheric circulations that are conducive to their formation deserve a detailed examination. This paper, as a complementary work to Song (2019), reports analyses of long- and short-lived observed NAO events in three different sets of reanalysis data. Following this introduction, section 2 briefly introduces the data and the model employed in this study. Our definition of the NAO pattern and method to identify NAO events are also introduced in this section. Section 3 discusses the features of the lifetimes of the observed NAO events and the composite tropospheric and stratospheric circulation anomalies associated with the long- and short-lived observed NAO events. Section 4 presents the results of eight sets of modified stratospheric initial-value experiments to illustrate that the lifetimes of the NAO events can be influenced by the stratospheric circulation anomalies. Section 5 introduces a physical understanding about the modulations of the stratospheric circulation anomalies on the lifetimes of the NAO events. The main findings of the study are concisely summarized in the final section.
2.1. Data
Three sets of reanalysis daily data are employed in this study. They are: the National Centers for Environmental Prediction/National Center for Atmospheric Research (NCEP/NCAR) Reanalysis-1 data (Kalnay et al., 1996; denoted as NCEP1 hereafter); the 40-yr European Centre for Medium-Range Weather Forecasts (ECMWF) Re-analysis data (Uppala et al., 2005; denoted as ERA-40 hereafter); and the fifth generation of ECMWF atmospheric reanalyses of the global climate [Copernicus Climate Change Service (C3S), 2017; denoted as ERA5 hereafter]. The horizontal resolution of all three sets of data is 2.5° × 2.5°. In the vertical direction, NCEP1 (ERA-40 and ERA5) have 17 (23) levels spanning from 1000 to 10 (1) hPa. For calculation convenience, we remove 29 February of each leap year in these data. NCEP, ERA-40 and ERA5 cover 62 boreal winters (December–January) from 1948/49 to 2009/10 (5580 days), 45 boreal winters from 1957/58 to 2001/02 (4050 days), and 39 boreal winters from 1979/80 to 2017/18 (3510 days), respectively. The daily anomaly of each calendar day in NCEP1, ERA-40 and ERA5 is defined as the departure from their multi-year averaged value at that day in those 62, 45 and 39 boreal winters.2
2.2. Simplified model
This study also utilizes a modified version of the Geophysical Fluid Dynamics Laboratory dynamical core atmospheric model (Song, 2016). The observed storm tracks, background flows from troposphere to stratosphere, and the NAO’s dynamical properties in boreal winter can be realistically simulated in this model [see Figs. 1 and 2 of Song (2016)]. Using this model, an 8000-day perpetual-boreal-winter run① and some modified stratospheric initial-value experiments are conducted with a T42 horizontal resolution and vertical 20 evenly spaced sigma levels. Figure2. Time series of the daily NAO index (black thin curves) for individual positive and negative observed NAO events from lag ?10 to 10 day in NCEP1 (top row), ERA-40 (middle row), and ERA5 (bottom row). Red thick curves are their respective composite results. Sky blue dashed line denotes the value of 0.5 in the left-hand column and ?0.5 in the right-hand column.
2
2.3. NAO and NAO events
In this study, we define the NAO pattern in the reanalysis data and the model’s 8000-day perpetual-boreal-winter run as the first empirical orthogonal function mode (EOF1) of their daily sea level pressure (SLP) anomalies over the North Atlantic region (20°–85°N, 90°W–50°E). To account for grid area reductions toward the pole, before performing the EOF analysis, we perform an area-weight calculation by multiplying the square root cosine latitude by the SLP anomalies. The corresponding normalized first principal component (PC1) is the daily NAO index. Their explained variance is 19.38% for NCEP1, 19.11% for ERA-40, 18.99% for ERA5, and 22.86% for the model. In this study, besides the SLP-based NAO index, the daily NAM/NAO index at 1000–10 hPa is also employed. The 1000–10 hPa NAM index is defined as the normalized PC1 of the geopotential height anomalies of each level over the Northern Hemisphere (NH; 0°–360°, 20°–90°N). Meanwhile, the 1000–10 hPa NAO index is acquired by projecting the daily geopotential height anomalies onto the SLP-based NAO index regressed geopotential height anomaly patterns at each level.Based on the daily NAO index, we can identify the positive and negative NAO events in the reanalysis data by adopting a three-step procedure as employed in Song (2019):
(1) Search for the maximum (minimum) of the daily NAO index data in a boreal winter (11 December to 18 February). If the maximum (minimum) found is


(2) Remove the NAO index from lag ?10 to 10 day of this NAO event from the daily NAO index of that winter. Lag?/+ x day represents x days before/after the lag 0 day.
(3) Search for the next maximum (minimum) in the remaining daily NAO index data of that winter.
This three-step procedure is repeatedly cycled until no more maximum (minimum) found is


2
3.1. Lifetimes
The daily NAO index of each positive and negative NAO event identified in the three sets of data and their corresponding composite time series from lag ?10 to 10 day are shown in Fig. 2. In this study, the definition of the lifetime of an observed positive (negative) NAO event parallels that of Song (2019). It is the number of days in which the NAO index is contiguously

The lifetimes of the composite positive and negative NAO events in these three sets of data shown in Fig. 2 only stand for their respective averaged lifetime. To obtain more complete information about the lifetimes of the observed NAO events, as in Song (2019), we also examine the percentage of occurrence of the NAO events with a specified lifetime from 3–21 days in these three sets of data. These results are shown in Fig. 3. It is clear that the percentages of occurrence of the NAO events with a specified lifetime in the three sets of data are different. In both NCEP1 and ERA-40, NAO events with a lifetime of 3–4 days are most likely to occur. About 30% of the positive or negative NAO events have that kind of synoptic-scale lifetime. For the rest of the NAO events, generally speaking, the longer the lifetime the smaller the occurrence frequency. However, it is still the case that more than 15% of the NAO events’ lifetimes are no less than 14 days. Meanwhile, in ERA5, instead of synoptic-scale NAO events whose lifetimes are about 3–4 days, NAO events with a weekly (5–9 days) lifetime occur most frequently (around 50%). The lifetimes of about 18% of NAO events are no shorter than 14 days.
Accordingly, we can respectively select the long- and short-lived NAO events among the identified positive and negative NAO events in NCEP1, ERA-40 and ERA5 based on their lifetimes. First, the time series of the lifetimes of all of the positive NAO events in NCEP1, ERA-40 and ERA5 are respectively normalized. Then, 21, 15 and 12 (28, 22 and 14) positive NAO events are recognized as long-lived (short-lived) NAO events in NCEP1, ERA-40 and ERA5 if we take 0.8 (?0.8) standard deviations of the time series as a threshold. For the negative NAO events, we perform similar analyses and recognize 19, 13 and 9 (27, 19 and 14) long-lived (short-lived) negative NAO events in NCEP1, ERA-40 and ERA5, respectively. Hereafter, as in Song (2019), we abbreviate the long- and short-lived positive (negative) NAO events as NAO+_LE (NAO?_LE) and NAO+_SE (NAO?_SE).
Figure 4 illustrates the time series of daily NAO index (black thin lines) of every long- and short-lived NAO event in the three sets of data from lag ?10 to 10 day. To depict their averaged temporal evolution, we also show the corresponding composite results of the time series of daily NAO index (red thick lines). Clearly, the averaged lifetime of the long-lived NAO events is greater than two weeks; whereas, the averaged lifetime of the short-lived NAO events is only around 4–5 days.
 Figure4. As in Fig. 2 except for the NAO+_LE (leftmost column), the NAO+_SE (left-middle column), the NAO?_LE (right-middle column), and the NAO?_ SE (rightmost column).
2
3.2. Composite circulation anomalies
Next, we turn our attention to comparing and discussing the composite anomalous circulations associated with the long- and short-lived observed NAO events from the troposphere to stratosphere. Note that, in this subsection, we only show the composite anomalous circulations associated with the long- and short-lived NAO events in NCEP1, because the composite anomalous tropospheric and stratospheric circulations associated with the long- and short-lived NAO events in the three sets of data are highly similar.3
3.2.1. Troposphere
Figure 5 demonstrates the 300-hPa NH composite geopotential height anomalies associated with NAO+_LE and NAO+_SE from lag ?10 to lag 10 day. Unsurprisingly, the most conspicuous difference between NAO+_LE and NAO+_SE is that the duration and intensity of the meridional dipolar circulation anomalies of the NAO over the North Atlantic region are much longer and stronger, respectively, in NAO+_LE. Besides that, we notice that the composite geopotential height anomalies are similar in shape but opposite in sign in the early stage of NAO+_LE and NAO+_SE. For NAO+_LE (NAO+_SE), there are significant negative (positive) geopotential height anomalies located at the high latitudes of the North Atlantic region, accompanied by a significant anomalous anticyclone (cyclone) in the northeastern Pacific domain (see Figs. 5a, b and 5l, m). Drouard et al. (2013) pointed out that the presence of this northeastern Pacific anomalous anticyclone (cyclone) might favor the emergence of the positive (negative) phase of the NAO through modulating the downstream propagating synoptic waves. Thus, the northeastern Pacific anomalous anticyclone (cyclone) might act as a favorable condition for the formation of NAO+_LE (NAO+_SE). Figure5. Composite anomalies of 300-hPa geopotential height for (a–k) NAO+_LE and (l–v) NAO+_SE, from lag ?10 to 10 day. Solid (dashed) contours represent positive (negative) values; zero contours are omitted. The contour interval is 50 gpm and composite results at the 95% confidence level are dotted.
Figure 6 is similar to Fig. 5, but shows the 300-hPa NH composite geopotential height anomalies associated with NAO?_LE and NAO?_SE from lag ?10 to lag 10 day. Unlike the positive NAO events, no significant geopotential height anomalies are found over the high latitudes of the North Atlantic region in the early stage of NAO?_LE and NAO?_SE (see Figs. 6a and l). In fact, we observe anomalous positive geopotential height over the high latitudes of Eurasia to the North Pacific region in the initial stage of NAO?_LE (see Figs. 6a and b). Meanwhile, for NAO?_SE, a “south positive–north negative” NPMD is found just before the emergence of the meridional dipole of the negative NAO. Note that Song (2019) proved that a presence of the “south positive–north negative” NPMD is not conducive to the formation of the negative NAO-like circulation anomalies over the North Atlantic region on the following days. Therefore, probably, the existence of this NPMD is helpful for the formation of NAO?_SE.
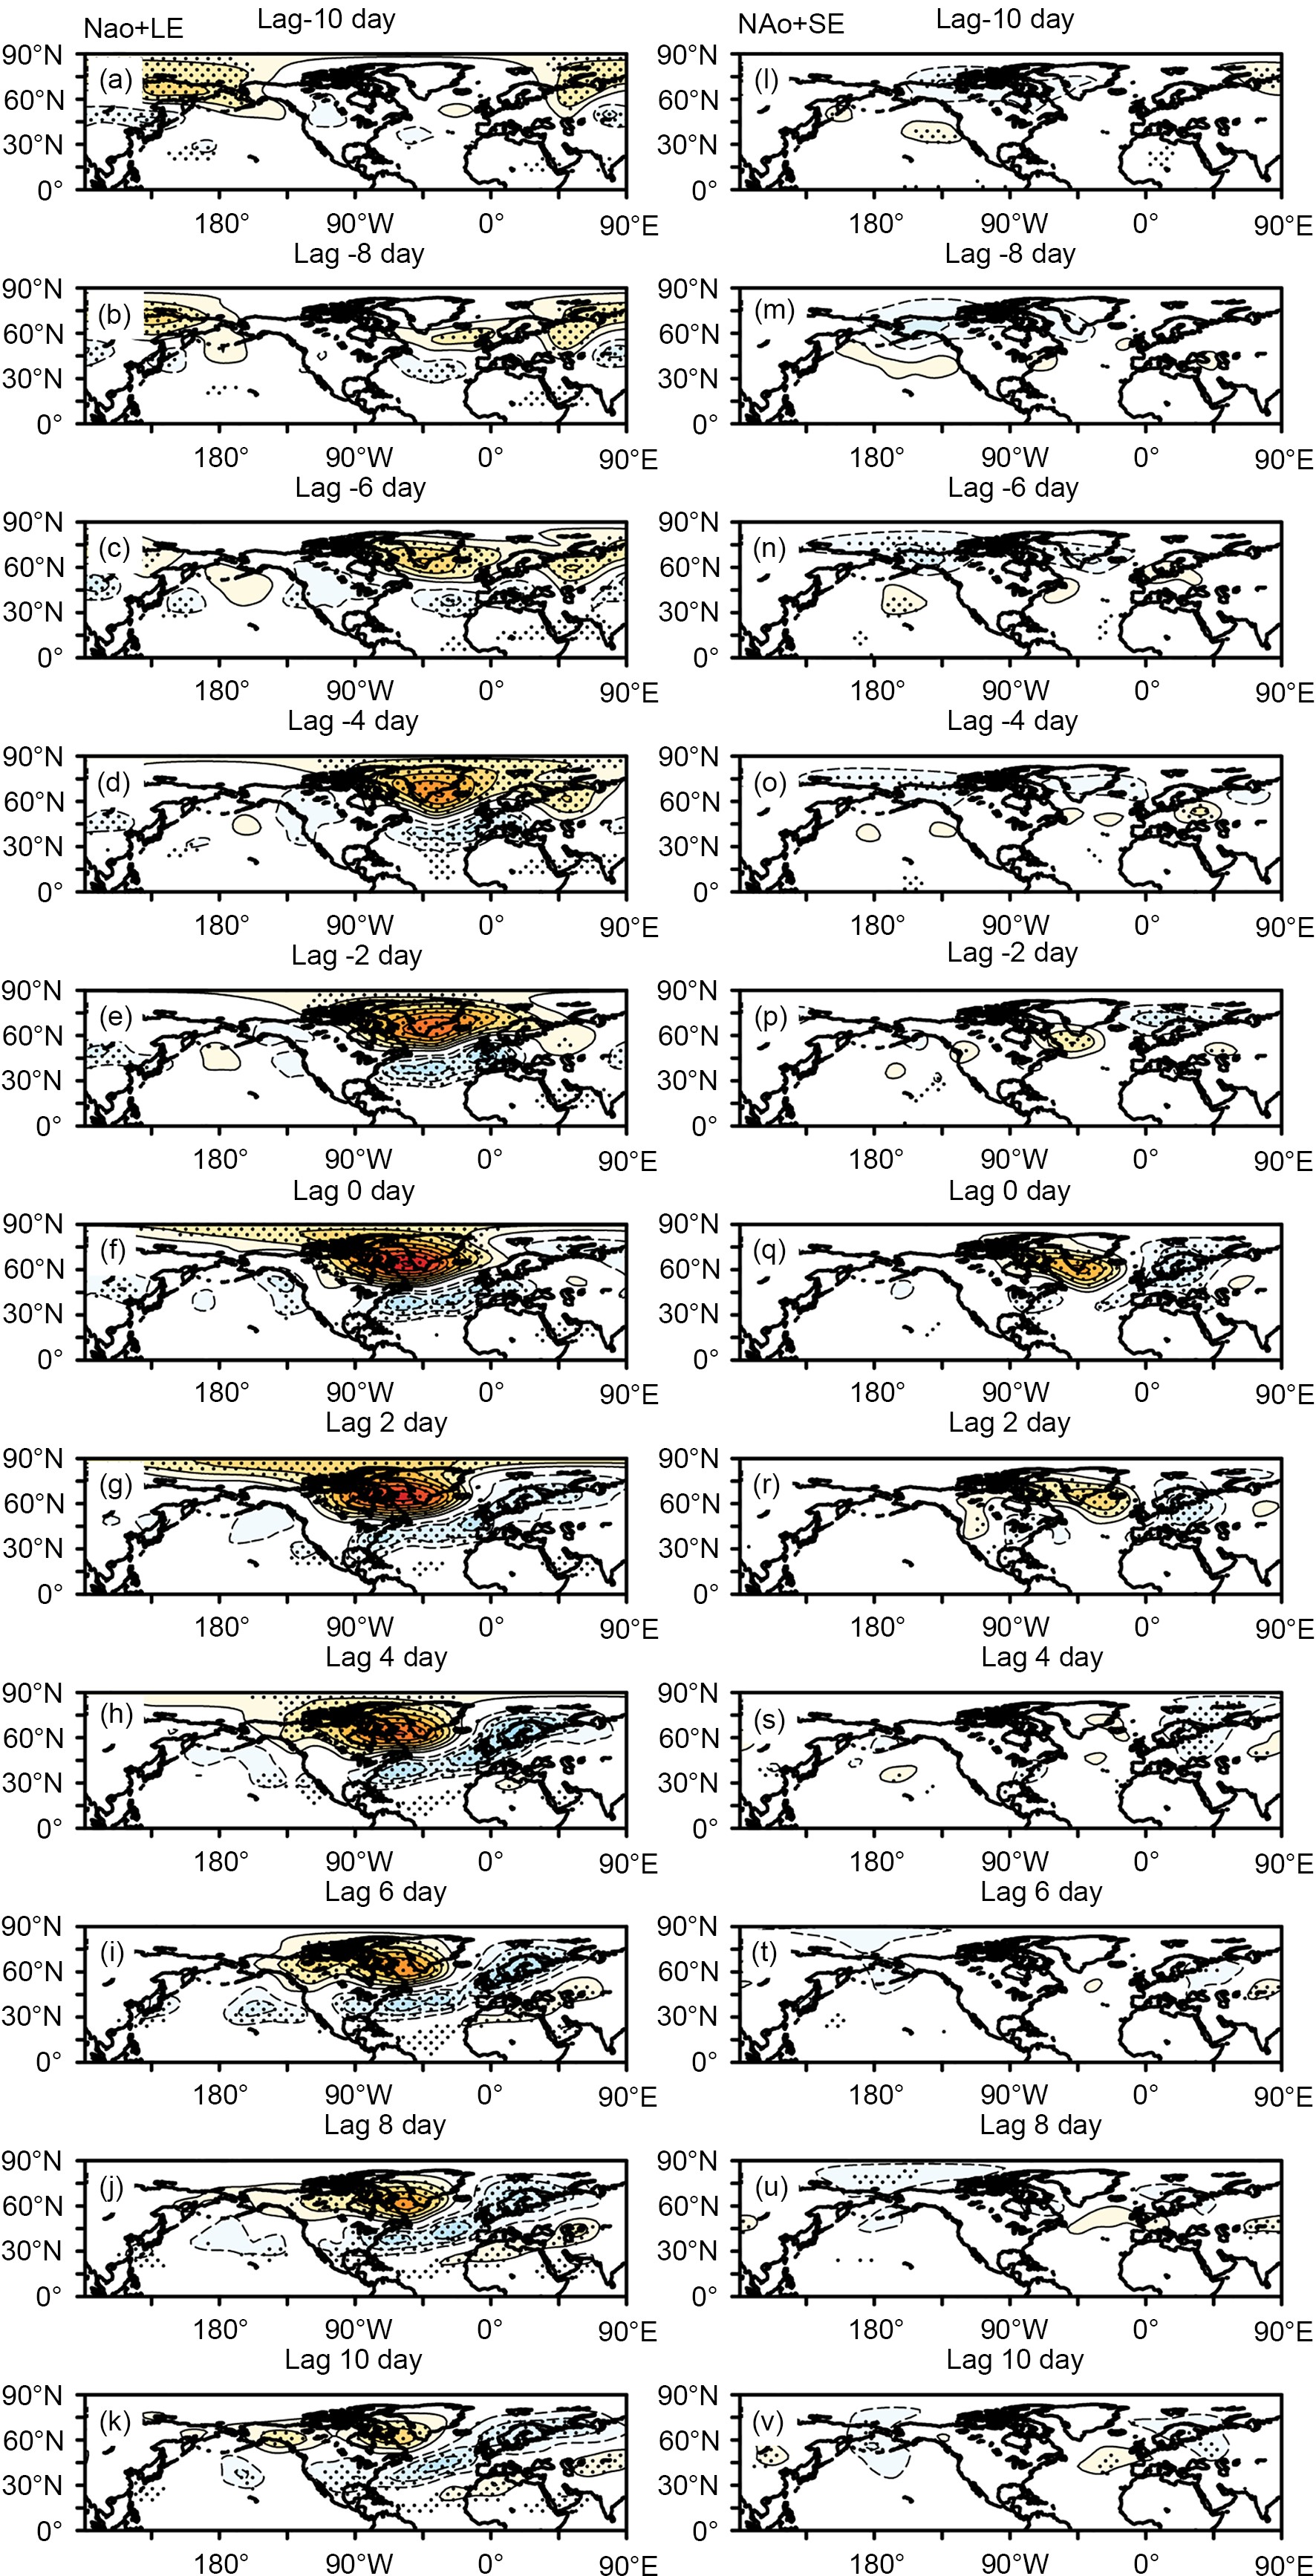 Figure6. As in Fig.5 but for (a–k) NAO?_LE and (l–v) NAO?_SE.
3
3.2.2. Stratosphere
In the last two decades, many studies have pointed out that the stratospheric circulation anomalies, especially for those related to the stratospheric polar vortex, can significantly impact the tropospheric circulation (Kidston et al., 2015; Waugh et al., 2017). Baldwin and Dunkerton (1999) showed that the signal of the stratospheric NAM/NAO could propagate downward to the surface in some circumstances, which might modulate the duration of the tropospheric NAM/NAO. This viewpoint is supported by results of some numerical experiments that, during the winter, the time scale of the annular mode in the troposphere is longer when the models have a dynamic active stratosphere (Gerber and Polvani, 2009; Simpson et al., 2011; Kim and Reichler, 2016). Thus, it is possible that the long- or short-lived NAO events are related to the states of the stratosphere.In order to compare the anomalous stratospheric circulations associated with the long- and short-lived NAO events, Fig. 7 shows the 20-hPa composite geopotential height anomalies associated with NAO+_LE and NAO+_SE from lag ?10 to lag 10 day in the NH. In the early stage of NAO+_LE, the spatial pattern of composite stratospheric geopotential height anomalies is a zonal wavenumber-1 structure, with positive anomalies over the North Pacific/North America and negative anomalies over the NH polar region (see Figs. 7a–c). On the following days, this zonal wavenumber-1 structure gradually evolves into a typical stratospheric positive NAO pattern, with a deeper NH polar vortex surrounded by midlatitude positive anomalies (see Figs. 7f–k). Meanwhile, the early stage of NAO+_SE corresponds to positive geopotential height anomalies over the North Atlantic region (see Figs. 7l–n), and then a large proportion of positive anomalies over the high latitudes of Eurasia and a small region of negative anomalies over North America are observed in the later stage. Similarly, Fig. 8 shows the 20-hPa composite geopotential height anomalies from lag ?10 to lag 10 day in the NH, but for NAO?_LE and NAO?_SE. Overall, the pattern and temporal evolution of the composite stratospheric geopotential height anomalies associated with NAO?_LE mirror the results of NAO+_LE but with reversed signs. In the early stage of NAO?_SE, there are negative stratospheric geopotential height anomalies over the high latitudes of North America and positive anomalies over the North Atlantic regions. Generally speaking, the composite stratospheric geopotential height anomalies associated with the later stage of NAO?_SE are relatively weak and less organized.
 Figure7. Composite anomalies of 20-hPa geopotential height for (a–k) NAO+_LE and (l–v) NAO+_SE, from lag ?10 to 10 day. Solid (dashed) contours represent positive (negative) values; zero contours are omitted. The contour interval is 50 gpm and composite results at the 95% confidence level are dotted.
 Figure8. As in Fig.7 but for (a–k) NAO?_LE and (l–v) NAO?_SE.
To demonstrate the vertical structure of anomalous circulations associated with long- and short-lived NAO events, we also show the 1000–10-hPa composite geopotential height anomalies zonally averaged from 90°W–0° (North Atlantic sector) for NAO+_LE and NAO+_SE in Fig. 9, and for NAO?_LE and NAO?_SE in Fig. 10. Prior to the onset of NAO+_LE (NAO+_SE), there are quasi-barotropic negative (positive) stratospheric geopotential height anomalies peaking at 20 hPa and extending to the lower troposphere in the region north of 60°N. Then, along with the temporal evolution of NAO+_LE, those negative geopotential height anomalies become stronger and gradually descend to the surface, accompanied by positive geopotential height anomalies at midlatitudes, forming the classical quasi-barotropic NAO-like dipolar mode in the troposphere. Meanwhile, as NAO+_SE evolves, the positive stratospheric geopotential height anomalies associated with NAO+_SE become weaker. In the mature stage of NAO+_SE, the geopotential height anomalies are positive in the stratosphere and negative in the troposphere, which composes a baroclinic structure with opposite signs in the stratosphere and troposphere (see Figs. 9q and r). Generally speaking, the vertical patterns of the anomalous geopotential height associated with NAO?_LE (NAO?_SE) and their evolutions shown in Fig. 10 are similar to the results of NAO+_LE (NAO+_SE) shown in Fig. 9 but with reversed signs. Nevertheless, we notice that the stratospheric anomalies are barely detectable in the mature stage of NAO?_SE (see Fig. 10q).
 Figure9. Composite zonally averaged (90°W–0°) geopotential height anomalies for (a–k) NAO+_LE and (l–v) NAO+_SE, from lag ?10 to 10 day in latitude–height cross sections. Solid (dashed) contours represent positive (negative) values; zero contours are omitted, and the contour interval is 50 gpm.
 Figure10. As Fig. 9 but for (a–k) NAO?_LE and (l–v) NAO?_SE.
3
3.2.3. 1000–10 hPa NAM/NAO index
The temporal evolution of the vertical structure of anomalous circulations associated with the long-lived NAO events shown in Figs. 9 and 10 remind us of the well-known downward propagation of stratospheric NAM/NAO-like circulation anomalies (Kidston et al., 2015; Waugh et al., 2017). One might argue that the long-lived NAO events are originated from the stratosphere. In order to provide a more comprehensive picture about the relationship between the stratospheric NAM/NAO and tropospheric NAM/NAO, we present the composite 1000–10 hPa NAM and NAO index during the lifecycle of long- and short-lived NAO events from lag ?10 to 10 day in Figs. 11 and 12, respectively. It is unsurprising to observe that the key results of Figs. 11 and 12 are highly similar, since the NAM index and the NAO index are closely related.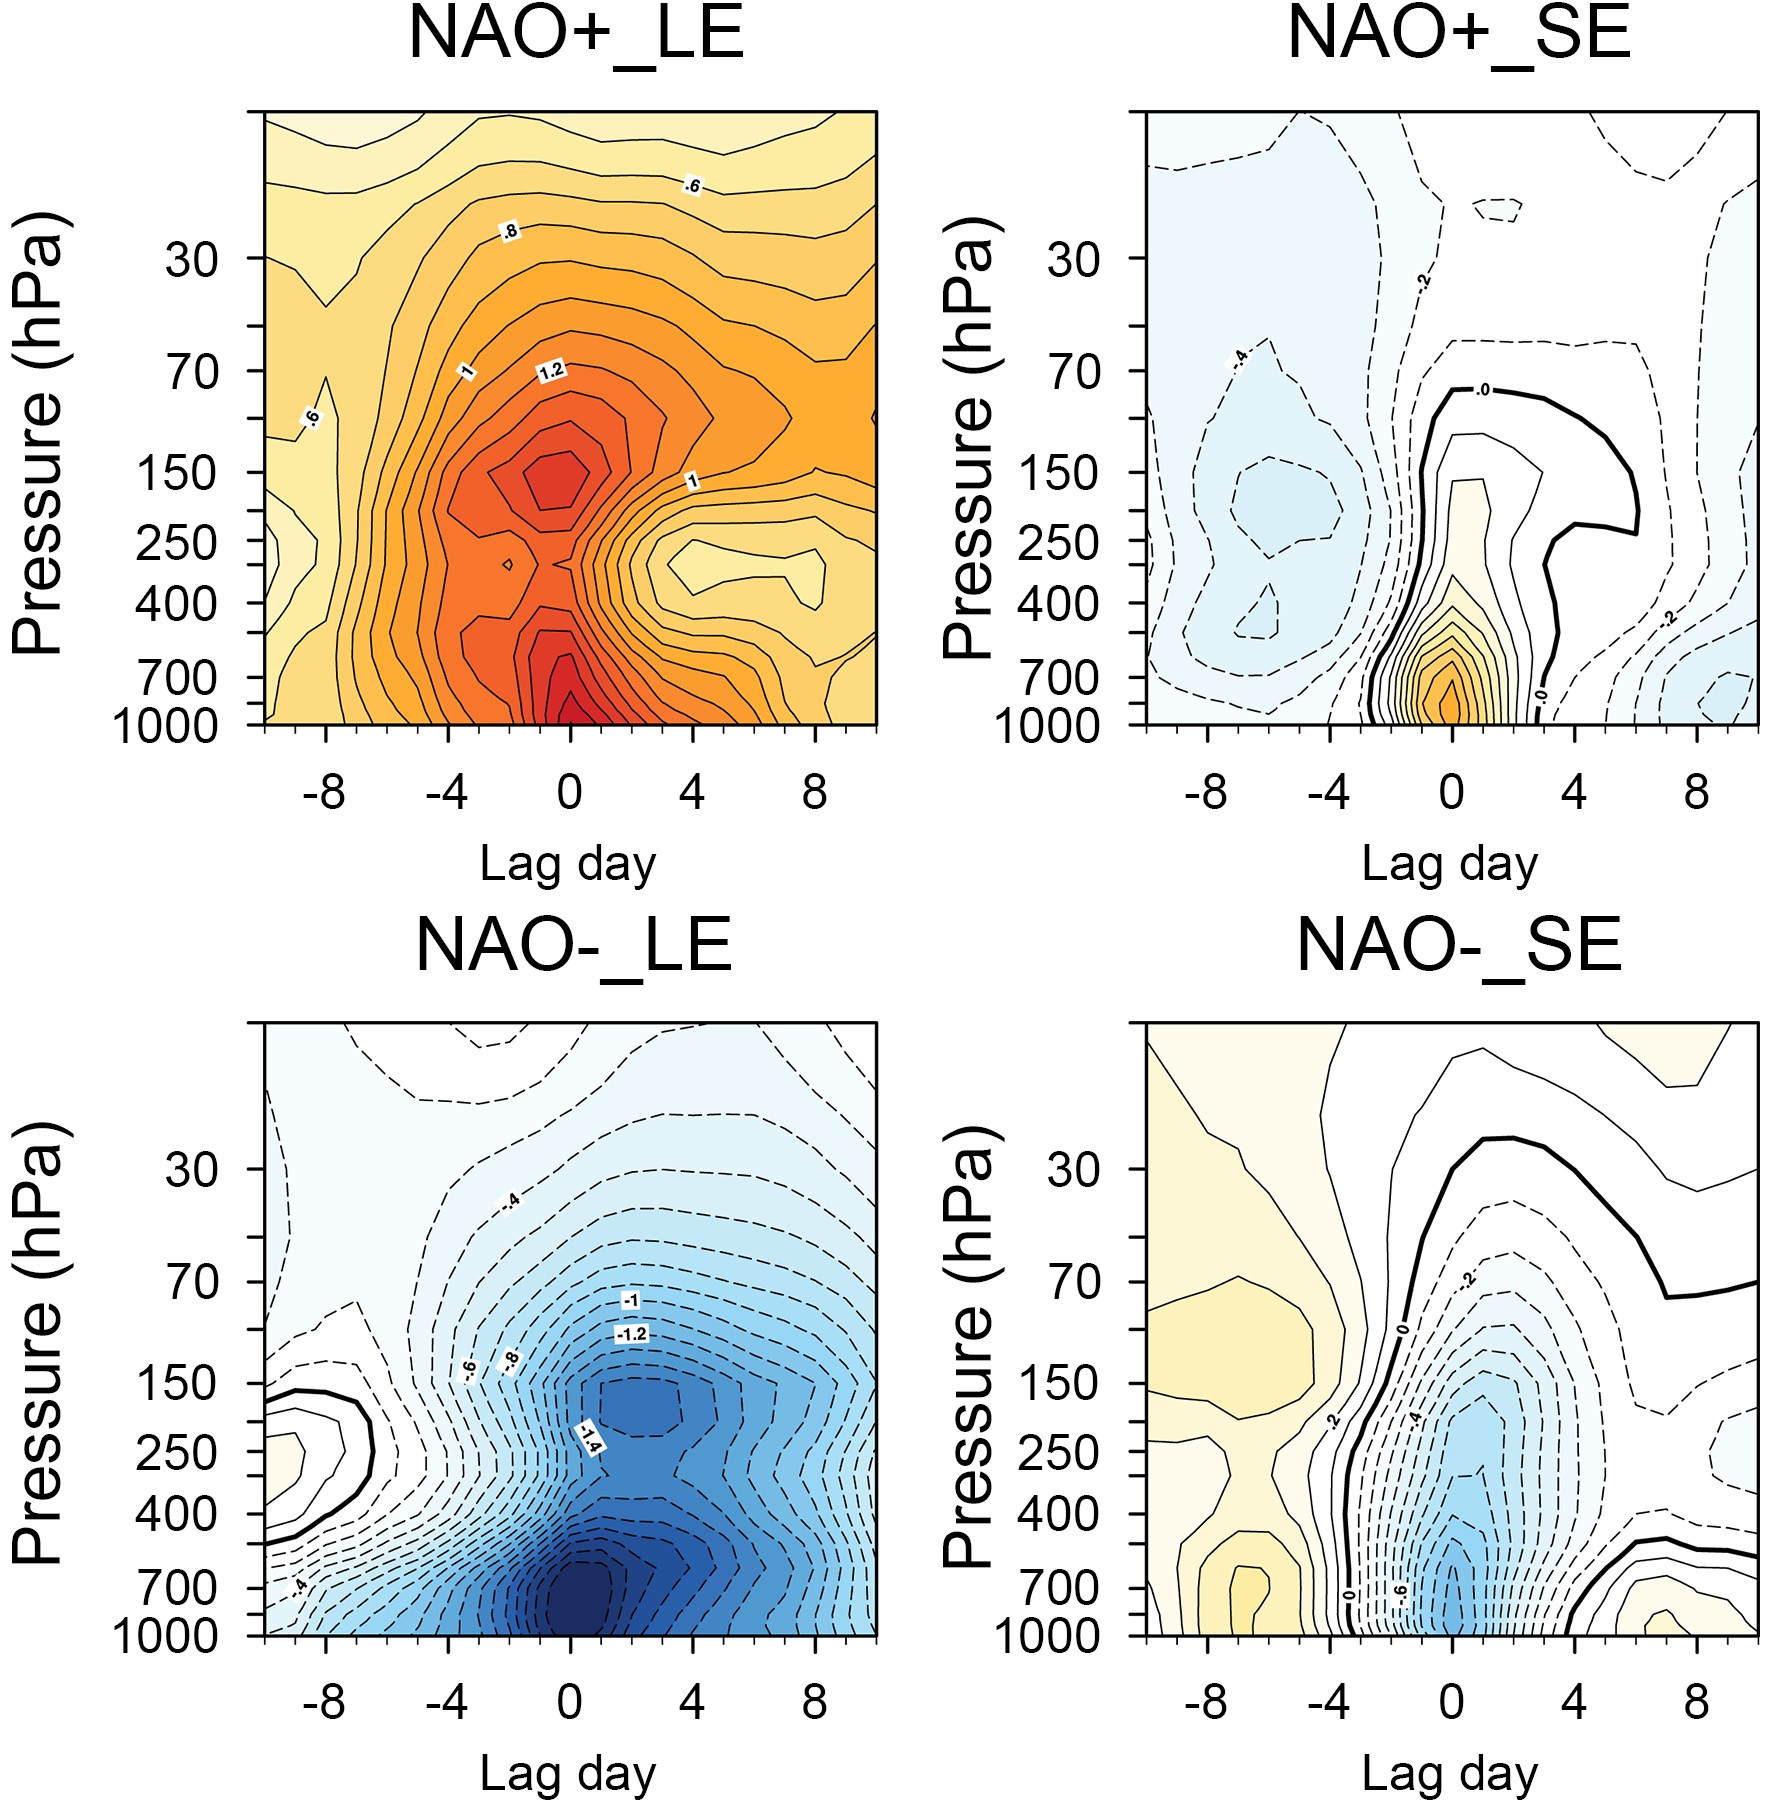 Figure11. Composite NAM index between 1000 hPa and 10 hPa for NAO+_LE, NAO+_SE, NAO?_LE, and NAO?_SE. Solid (dashed) contours represent positive (negative) values; zero contours are in bold, and the contour interval is 0.1.
 Figure12. As in Fig. 11 but showing the composite NAO index between 1000 hPa and 10 hPa.
We notice that the early stage (lag ?10 to lag ?4 day) of NAO+_LE and NAO+_SE (NAO?_LE and NAO?_SE) respectively corresponds to weak positive and negative (negative and positive) NAM/NAO index from the near-surface to the stratosphere. Thus, the results of Figs. 11 and 12 are closely consistent with the results of Figs. 9 and 10, in that the early stage of NAO+_LE and NAO?_SE (NAO+_SE and NAO?_LE) corresponds to stratospheric negative (positive) geopotential height anomalies over the North Atlantic region. Besides that, both NAO+_LE and NAO+_SE (NAO?_LE and NAO?_SE) are associated with evident positive (negative) NAM/NAO indices in their mature stage (lag ?3 to lag 3 day). However, the NAM/NAO indices associated with the observed long-lived NAO events can penetrate upward into the stratosphere. Meanwhile, the NAM/NAO indices associated with the observed short-lived NAO events tend to be confined to the troposphere. These results can also explain why there is a typical stratospheric NAO pattern in the later stage of the long-lived NAO events, while the geopotential height anomalies in the later stage of the short-lived NAO events are relatively weak and less organized. We might therefore refer to the long-lived NAO events as “stratosphere–troposphere-coupling” type events, and the short-lived NAO events as “pure tropospheric” type events.
Baldwin and Dunkerton (1999) had already pointed out that some tropospheric NAM events are connected to stratospheric NAM events. However, there are still many pure tropospheric NAM events that are independent to the stratosphere [see Plate 1 of Baldwin and Dunkerton (1999)]. However, they did not discuss the difference in persistence between the stratosphere–troposphere-coupling events and the pure tropospheric events.
More importantly, instead of an evident feature of downward propagation of stratospheric NAM/NAO index, Figs. 11 and 12 show an immediate (zero time delay) connection between stratospheric and tropospheric NAM/NAO index and/or a slight upward propagation characteristic of the tropospheric NAM/NAO index during the lifecycle of the long- and short-lived NAO events. Thus, the long-lived NAO events are not originated from the stratosphere. However, the better (worse) coupling/connection of stratospheric and tropospheric circulation anomalies in the long-lived (short-lived) NAO events might play a role in their formation.
In order to corroborate this supposition, four sets of modified initial-value experiments for the model’s positive and negative NAO events were set up and performed.
In the first three sets of experiments, we introduced 0.5 times, 1 times, and 2 times the magnitude of the composite 150–10-hPa 3D anomalous circulations of the North Atlantic region at lag ?8 day of the observed NAO+_LE (NAO?_LE) into the initial-value fields at lag ?7 day of the model’s individual positive (negative) NAO events artificially③. After that manipulation, three sets of modified stratospheric initial-value fields that contained additional local negative (positive) stratospheric geopotential height anomalies over the North Atlantic region with different magnitudes for the model’s positive (negative) NAO events were generated. Then, the 119 positive (114 negative) modeled NAO events were re-run with the newly generated modified stratospheric initial-value fields. For positive (negative) NAO events in the model, those three sets of modified stratospheric initial-value re-run experiments are abbreviated to NAO+_0.5x_NEG_STR_NA, NAO+_1.0x_NEG_STR_NA and NAO+_2.0x_NEG_STR_NA (NAO?_0.5x_POS_STR_NA, NAO?_1.0x_POS_STR_NA and NAO?_2.0x_POS_STR_NA), respectively. The integration period of these re-run experiments was 20 days, which was able to cover most of the lifetimes of the original model’s NAO events. Differences between the original model’s NAO events and the re-run model’s NAO events could then be used to demonstrate the effects of the additionally introduced local negative (positive) stratospheric geopotential height anomalies over the North Atlantic region on the lifetimes of the positive (negative) NAO events.
Figure 13 presents the projected daily NAO index of each re-run NAO event (thin dashed lines) and their composite results (sky-blue dashed lines) from integration day 1 to day 20, which is a convenient way to illustrate the influences of the modified stratospheric initial-value fields on the subsequent developments of the re-run NAO events. To compare, we also show the projected daily NAO index of each corresponding original NAO event (thin solid lines) and their composite results (red thick lines) from lag ?7 to 12 day in Fig. 13. The daily projected NAO index of the re-run or original NAO events was obtained by projecting their daily SLP anomalies onto the NAO pattern. Obviously, the re-run NAO events have a stronger peak intensity and a longer lifetime. The lifetimes of the re-run positive (negative) NAO events seem to be dependent on the magnitude of the additionally introduced stratospheric negative (positive) geopotential height anomalies over the North Atlantic region in the initial-value fields. The duration of the re-run NAO events becomes longer when the additionally introduced stratospheric geopotential height anomalies are stronger. Therefore, the re-run NAO events results shown in Fig. 13 confirm the first part of our supposition that the local negative (positive) stratospheric geopotential height anomalies over the North Atlantic region tend to elongate the lifetimes of the positive (negative) NAO events.
 Figure13. From integration day 1 to day 20, the daily projected NAO indexof each re-run positive NAO event (thin dashed lines) in (a) NAO+_0.5x_NEG_STR_NA, (b) NAO+_1x_NEG_STR_NA, (c) NAO+_2x_NEG_STR_NA, and (d) NAO+_1x_POS_STR_NA; and each re-run negative NAO event (thin dashed lines) in (e) NAO?_0.5x_POS_STR_NA, (f) NAO?_1x_POS_STR_NA, (g) NAO?_2x_POS_STR_NA, and (h) NAO?_1x_NEG_STR_NA. The projected NAO indexof each original positive and negative long-lived NAO event (thin solid lines) from lag ?7 to 12 day are also shown, in (a–d) and (e–h), respectively. Sky blue (red) thick lines denote the composite time series of the projected NAO indexof the re-run (original) NAO events.
Next, to concisely verify the second part of our supposition is also correct, i.e., the positive (negative) stratospheric geopotential height anomalies over the NA region are capable of reducing the lifetimes of the positive (negative) NAO events, another similar set of modified stratospheric initial-value experiments were performed. This time, we artificially introduced the reversed signed composite 150–10 hPa 3D anomalous circulation of the North Atlantic region at lag ?8 day of the observed NAO+_LE (NAO?_LE) into the initial-value fields at lag ?7 day of the model’s individual positive (negative) NAO events. Thus, the modified stratospheric initial-value fields contained additional local positive (negative) stratospheric geopotential height anomalies over the North Atlantic region for positive (negative) NAO events in the model. Likewise, the 119 positive (114 negative) model NAO events with this set of modified stratospheric initial-value fields were re-integrated for 20 days. For the model’s positive (negative) NAO events, this set of modified stratospheric initial value re-run experiments is denoted as NAO+_1x_POS_STR_NA (NAO?_1x_NEG_STR_NA). The daily projected NAO index of NAO+_1x_POS_STR_NA (NAO?_1x_NEG_STR_NA) from integration day 1 to day 20 is demonstrated in Fig. 13d (Fig. 13h). It is clear that the additionally introduced positive (negative) local stratospheric geopotential height anomalies over the North Atlantic region tend to reduce the lifetimes of the positive (negative) NAO events, which proves that the second part of our supposition is also reasonable.
To sum up, the results of four sets of modified stratospheric initial-value experiments demonstrate that the additionally introduced negative (positive) local stratospheric geopotential height anomalies over the North Atlantic region in the initial-value fields are capable of elongating the lifetimes of the positive (negative) NAO events and reducing the lifetimes of the negative (positive) NAO events in the model. Thus, a better (worse) coupling/connection of stratospheric and tropospheric circulation anomalies in the initial-value fields are, at least partly, responsible for the emergences of the observed long-lived (short-lived) NAO events.
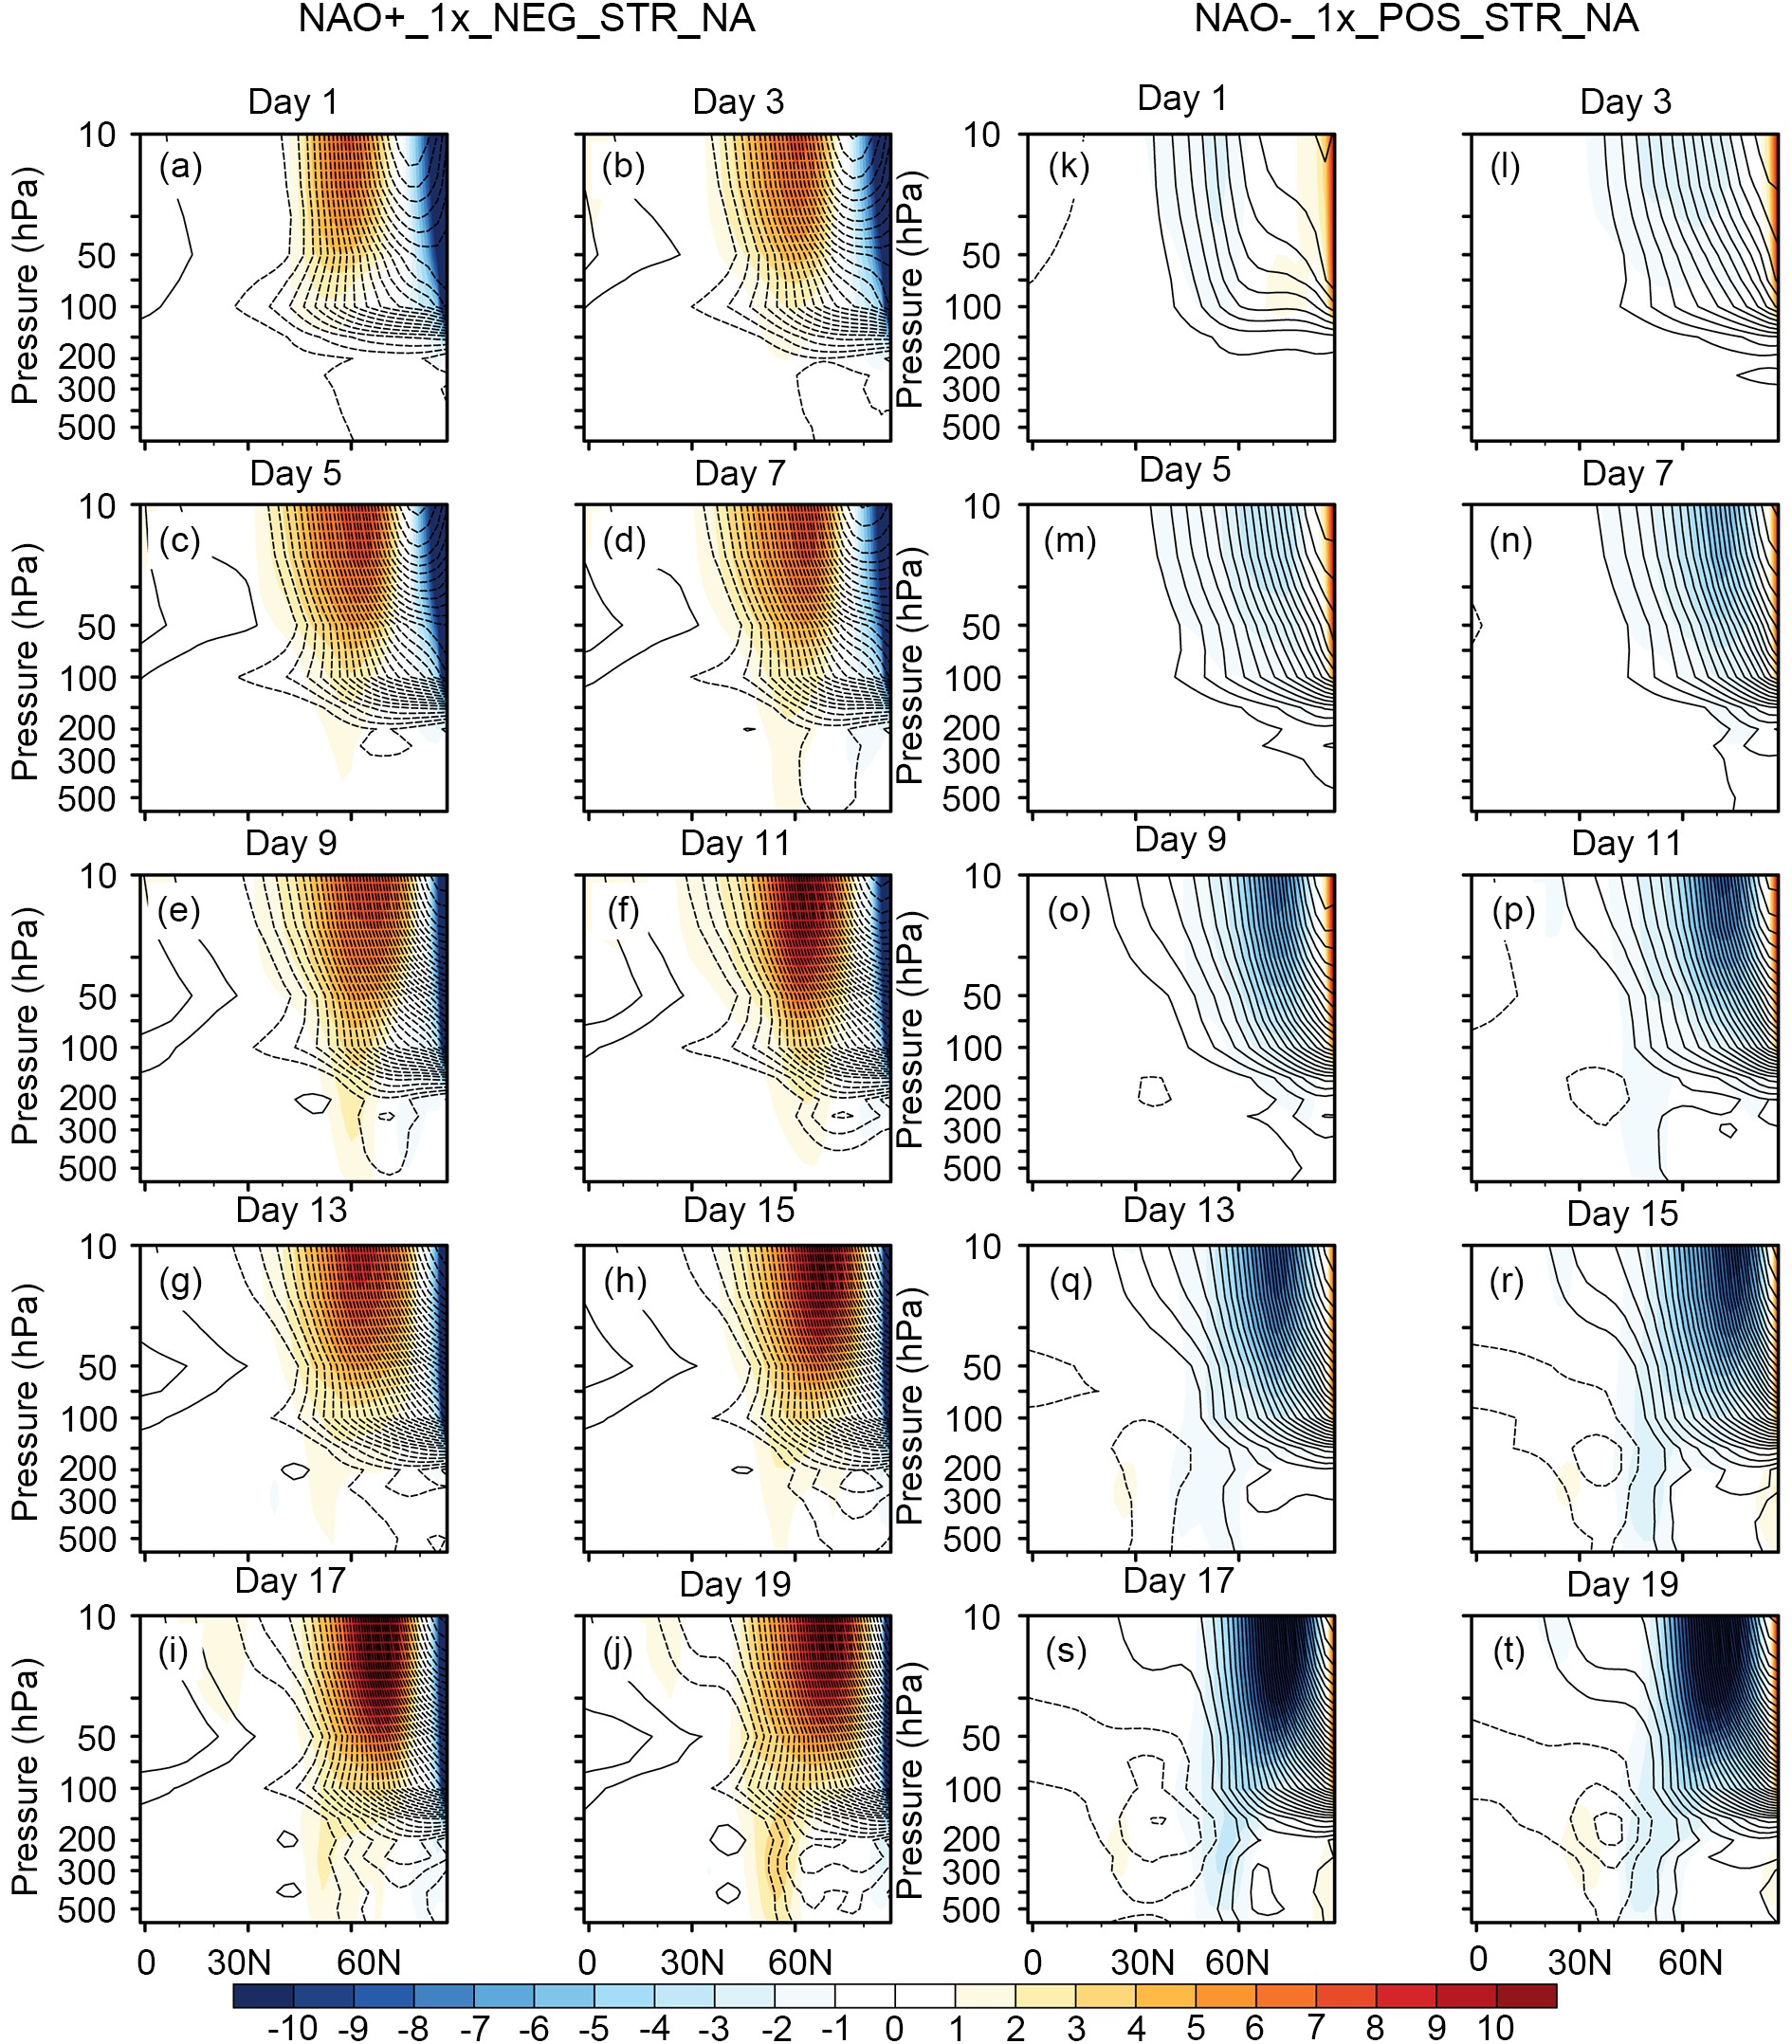 Figure14. (a–j) Composite differences of zonally averaged (90°W–0°) streamfunction (colored) and zonal wind (contours) between the re-run positive NAO events of NAO+_1x_NEG_STR_NA and the original positive NAO events from integration day 1 to day 19. (k–t) As in (a–j) but showing the composite differences between the re-run negative NAO events of NAO?_1x_POS_STR_NA and the original negative NAO events. Solid (dashed) contours represent positive (negative) values; zero contours are omitted. The contour interval is 1×10⁶ m2 s–1 for streamfunction and 1 m s?1 for zonal wind.
It is widely recognized that the NAO-like meridional dipolar circulation anomalies are principally forced by the nonlinear synoptic eddy fluxes in the troposphere [e.g., Feldstein, (2003), and many others]. Thus, we hypothesize that the tropospheric NAO-like circulation anomalies induced by the stratospheric geopotential height anomalies in the initial-value fields are also principally forced by the tropospheric synoptic eddy fluxes.
Figure 15 shows the vertical distributions of zonally averaged (90°W–0°) composite differences of 1000–10-hPa anomalous synoptic-scale④ eddy vorticity forcing (SCEVF,


 Figure15. (a–j) Composite differences of zonally averaged (90°W–0°) SCEVF in terms of streamfunction tendency between the re-run positive NAO events of NAO+_1x_NEG_STR_NA and the original positive NAO events from integration day 1 to day 19. (k–t) As in (a–j) but showing the composite differences between the re-run negative NAO events of NAO?_1x_POS_STR_NA and the original negative NAO events. Solid (dashed) contours represent positive (negative) values; zero contours are omitted. The contour interval is 2.5 m2 s–2.
A meridional dipole of the SCEVF differences with a “south positive–north negative” (“south negative–north positive”) structure confined to the troposphere gradually emerges to the north of 30°N after integration day 7 (day 11) for NAO+_1.0x_NEG_STR_NA (NAO?_1.0x_POS_STR_NA). Obviously, the meridional dipole of SCEVF differences collocate well with the meridional dipolar NAO-like circulation differences shown in Fig. 14. Therefore, we believe that through modulating the tropospheric synoptic eddies and generating anomalous SCEVF, that the additionally introduced stratospheric geopotential height anomalies drive the tropospheric NAO-like circulation anomalies gradually on the subsequent days.
Many studies have pointed out that the stratospheric anomalous circulations can directly or indirectly impact the synoptic eddies in the troposphere via many mechanisms. Section 6 of Song (2019) provides a concise review about those mechanisms. To avoid unnecessary repetition, the mechanisms through which the stratosphere affects the troposphere are not introduced here. All we need to know is that those mechanisms are inseparable in observations. It is also difficult/perhaps impossible to set up numerical experiments to distinguish the individual roles of these mechanisms in the impact of the stratospheric anomalous circulations on the tropospheric synoptic eddies. Therefore, how the stratospheric anomalous circulations modulate the tropospheric synoptic eddies is not investigated in this study, but requires further work in the future.
Taking 0.8 (?0.8) standard deviations of the normalized time series of the lifetimes of all positive or negative NAO events in NCEP1, ERA-40 and ERA5 as a threshold, we identify the long-lived (short-lived) observed positive or negative NAO events in NCEP1, ERA-40 and ERA5, separately. The composite geopotential height anomalies from the troposphere to stratosphere and the 1000–10-hPa NAM/NAO index associated with NAO+_LE, NAO+_SE, NAO?_LE and NAO?_SE, show that the most conspicuous circulation difference between the long- and short-lived NAO events is that the NAO-like circulation anomalies associated with the long-lived NAO events can reach the stratosphere, while the NAO-like circulation anomalies associated with the short-lived NAO events are basically confined to the troposphere. Thus, the coupling/connection of stratospheric and tropospheric circulation anomalies is much closer in the long-lived NAO events. We might therefore refer to the long-lived NAO events as “stratosphere–troposphere-coupling” type events, and the short-lived NAO events as “pure troposphere” type events.
It is hypothesized that a better (worse) connection between stratospheric and tropospheric circulation anomalies in the initial-value fields is helpful for the formation of long-lived (short-lived) NAO events. To corroborate this hypothesis, four sets of modified initial-value experiments for the model’s positive and negative NAO events were respectively conducted. In these initial-value experiments, additional positive or negative local stratospheric geopotential height anomalies with different magnitudes were introduced in the initial-value fields over the North Atlantic region to mimic the better or worse connection between stratospheric and tropospheric circulation anomalies. The results of these experiments showed that the additionally introduced negative (positive) stratospheric anomalies over the North Atlantic region in the initial-value fields are able to gradually induce the positive (negative) NAO-like tropospheric circulation anomalies on the subsequent days by altering the tropospheric SCEVF over the North Atlantic region. Therefore, negative (positive) stratospheric geopotential height anomalies are able to strengthen the original circulation anomalies associated with the positive (negative) NAO events or dissipate the original circulation anomalies associated with the negative (positive) NAO events, and naturally, elongate the lifetimes of the positive (negative) NAO events or reduce the lifetimes of the negative (positive) NAO events.
Acknowledgements. This work was supported by National Natural Science Foundation of China (Grant No. 41790473).
