 ,1, 党海燕,1, 黄婷苗1, 侯赛宾1, 王朝辉,1,2
Evaluation of Farmers’ Fertilizer Application and Fertilizer Reduction Potentials in Major Wheat Production Regions of China
HUANG QianNan,1, DANG HaiYan,1, HUANG TingMiao1, HOU SaiBin1, WANG ZhaoHui,1,2通讯作者:
责任编辑: 李云霞
收稿日期:2020-05-30接受日期:2020-07-31网络出版日期:2020-12-01
| 基金资助: |
Received:2020-05-30Accepted:2020-07-31Online:2020-12-01
作者简介 About authors
黄倩楠,E-mail:
党海燕,E-mail:

摘要
关键词:
Abstract
Keywords:
PDF (943KB)元数据多维度评价相关文章导出EndNote|Ris|Bibtex收藏本文
本文引用格式
黄倩楠, 党海燕, 黄婷苗, 侯赛宾, 王朝辉. 我国主要麦区农户施肥评价及减肥潜力分析[J]. 中国农业科学, 2020, 53(23): 4816-4834 doi:10.3864/j.issn.0578-1752.2020.23.009
HUANG QianNan, DANG HaiYan, HUANG TingMiao, HOU SaiBin, WANG ZhaoHui.
开放科学(资源服务)标识码(OSID):

0 引言
【研究意义】施肥是保障作物高产稳产的关键措施之一,其对作物产量的贡献率达30%—50%,但不合理施肥则会影响作物产量与品质[1,2]。据统计,从1970年到2018年,我国化肥用量增长率是粮食产量增长率的8.7倍[3]。化肥不合理施用现象较为严重[4,5,6,7,8,9,10],施肥过量和不足现象普遍存在[11,12,13,14,15,16]。2015年,我国农业部提出“到2020年实现化肥农药零增长”。小麦作为我国主要粮食作物之一,种植面积占全国粮食作物播种面积的20.7%[3],其中44.8%的小麦播种面积对应的施氮量达250—300 kg·hm-2,而处于此施肥范围的水稻和玉米面积分别占相应播种面积的9.6%和12.1%[17]。因此,实现小麦化肥的科学减施至关重要,而要达到此目标必须全面了解我国农户的小麦施肥现状,明确其减肥潜力。【前人研究进展】2003年,覆盖我国17省、1万多个农户的施肥调研发现,75%的小麦种植户施肥过量[15]。华北平原小麦平均施氮325 kg·hm-2,远超过其平均产量5.7 t·hm-2对应的160 kg·hm-2的需氮量,其中河北曲周分别有91.5%、93.8%和41.8%的农户氮、磷、钾肥施用过量,河南全省小麦减氮潜力在16.4%— 36.7%[18,19,20]。江苏农户小麦平均施氮量323 kg·hm-2,超过50%的农户过量施氮[16]。黑龙江水稻生产中有约70%的农户施肥不合理,节肥潜力在20%以上[21]。这些研究多针对我国某一省份或某一区域,从大尺度上对我国主要麦区农户的施肥评价与减肥潜力的研究相对较少。张灿强等[22]的研究表明我国小麦的化肥使用量可削减36.9%,但是其在计算减肥潜力时是以省份为单位进行计算的,并未充分考虑由于种植制度、气候等原因造成的同一省份麦区不同的情况。目前对于如何确定肥料合理用量有大量研究,如丰缺指标法[23,24,25]、目标产量法[26]、衡量监控法[27]、养分专家系统[28,29]等。但是已有研究在进行区域施肥评价与减肥潜力计算时,多以区域合理施肥量来进行评价和计算,而不同****制定的区域合理施肥量不同,如在黄土高原旱地,刘芬等[30]提出小麦氮、磷、钾肥施用量应分别介于75—105、60—90和45— 75 kg·hm-2,赵护兵等[8]认为适宜氮肥用量为120— 160 kg·hm-2、磷肥100—140 kg·hm-2、钾肥80—100 kg·hm-2。这些区域评价方法多使用某一固定范围进行评价,忽略了因光温水、土壤肥力、品种和栽培管理等差异造成的农户或田块的小麦产量水平和养分需求差异。【本研究切入点】本文通过连续3年对我国主要麦区农户施肥情况进行调研,提出了基于不同农户田块小麦产量、养分需求量和土壤养分的施肥量推荐方法,并使用该方法计算出各个农户的推荐施肥量,以该推荐施肥量来评价农户的施肥状况及减肥潜力,最终得到我国主要麦区农户的施肥状况及减肥潜力。【拟解决的关键问题】通过明确我国不同麦区农户的施肥现状、存在问题和减肥潜力,为实现我国小麦生产科学合理减肥提供理论基础和依据。1 材料与方法
1.1 采样点及分布
2015—2017年,依托于国家小麦产业技术体系分布在全国主要麦区的50个综合试验站,由当地各个示范县协助进行典型农户的调研与采样。通过3年调研共得到1 030个农户的小麦播种、产量、施肥等信息,同时在调研农户的田块中采集了小麦植株样品和0—20 cm土层土样,其中春麦区66户、旱作区406户、麦玉区402户、稻麦区156户。各麦区降雨量和麦田0—20 cm土层土壤理化性状见表1,其中麦区具体划分参见文献[31],降雨数据来自中国气象数据网(Table 1
表1
表1我国主要麦区降雨量及调研农户麦田0—20 cm土层土壤理化性状
Table 1
| 区域 Region | 降雨量 Precipitation (mm) | pH | 有机质 Organic matter (g·kg-1) | 全氮 Total N (g·kg-1) | 硝态氮 Nitrate N (mg·kg-1) | 铵态氮 Ammonium N (mg·kg-1) | 速效磷 Available P (mg·kg-1) | 速效钾 Available K (mg·kg-1) | |
|---|---|---|---|---|---|---|---|---|---|
| 全年 Annual | 生育期 Growing season | ||||||||
| 春麦区SW | 461—577 | 172—202 | 8.3±0.1 | 19.4±1.2 | 1.1±0.1 | 23.6±5.1 | 4.2±0.4 | 34.2±3.4 | 191.4±10.4 |
| 旱作区DW | 487—525 | 236—256 | 8.3±0.01 | 12.6±0.2 | 0.8±0.01 | 14.1±1.3 | 2.4±0.1 | 13.7±0.5 | 133.4±2.6 |
| 麦玉区WM | 580—614 | 263—287 | 7.9±0.05 | 19.7±0.3 | 1.1±0.02 | 25.6±1.6 | 4.6±0.3 | 31.3±1.2 | 171.9±4.6 |
| 稻麦区RW | 1124—1164 | 431—463 | 7.0±0.1 | 23.8±0.8 | 1.3±0.04 | 12.9±1.6 | 7.7±0.7 | 22.6±1.3 | 130.5±4.9 |
| 全国ALL | 718—764 | 290—308 | 8.0±0.02 | 17.5±0.3 | 1.0±0.01 | 19.1±0.9 | 4.2±0.2 | 23.3±0.7 | 151.7±2.4 |
新窗口打开|下载CSV
1.2 样品采集与测定
1.2.1 植物样品采集与测定 于小麦收获前5 d左右,在农户田块小麦长势均匀的区域确定一块5 m×10 m的样区。在样区内随机选取3个位置,分别数相邻2行小麦的1 m穗数,并测量这2行小麦间的距离,以确定穗数和行距。随后采用“盲抽法”在样区内随机采集包含100穗的小麦全株[32],在根茎结合处剪除小麦根部,风干后将地上部分为茎叶和穗,分别称重,手工脱粒后称量风干籽粒重。取籽粒和剪碎混匀的茎叶各50 g、颖壳30 g,分别用自来水和蒸馏水快速漂洗3次,装入标记好的信封,65℃烘干至恒重,测定风干茎叶、颖壳、籽粒的含水量。烘干的籽粒、茎叶、颖壳用组织混合研磨仪(MM400,德国莱驰,氧化锆研磨罐和研磨球)磨细,作为化学分析样。准确称取粉碎后的样品0.2000— 0.2500 g,用浓H2SO4-H2O2法红外消解,连续流动分析仪(AA3,德国)测定消解液中的氮和磷含量,火焰光度计(M410,英国Sherwood)测定消解液中的钾含量。千粒重采用数粒板法测定。千粒重和氮磷钾含量均以烘干重表示。
1.2.2 土壤样品的采集与测定 在样区内小麦行间均匀选取3个点,采集0—20 cm土层样品,混匀后取500 g装入样品袋,作为1个分析样品。
土壤样品风干后分别过1 mm和0.15 mm筛。过1 mm筛的土样用于测定pH、硝铵态氮、速效磷、速效钾。用pH计测定土壤酸碱度。硝铵态氮用1 mol·L-1的KCl浸提,速效磷用0.5 mol·L-1的NaHCO3浸提,浸提液中的氮、磷含量分别用连续流动分析仪(AA3,德国)测定。有效钾用1 mol·L-1的NH4OAc浸提,火焰光度计测定[33]。过0.15 mm筛的土样用来测定有机质和全氮含量,有机质用重铬酸钾外加热法测定,全氮用浓硫酸加混合催化剂(K2SO4:CuSO4=10:1)消煮、连续流动分析仪(AA3,德国)测定。
1.3 数据计算与统计分析
1.3.1 产量计算及等级划分 农户小麦的产量(取样测定产量)由公顷穗数、穗粒数和千粒重求得。收获指数由其籽粒和地上部生物量计算求得。测定产量除以收获指数计算出农户小麦生物量。产量、生物量均以烘干重表示。对调研获得的农户小麦产量和取样所得的测定产量按麦区进行方差分析(SPSS 17,P<0.05),若两者差异不显著,文中产量数据采用取样测定产量,否则,以各地调研所得产量为基准矫正取样测定的产量(式1),并用矫正后产量进行相关计算分析。
式(1)中,产量单位均为t·hm-2。
由于麦区间产量差异较大,对各麦区产量等级的划分也因地而异,划分标准为:以该麦区的平均产量为中心,分别上下浮动10%、30%,形成高产、偏高产、中产、偏低产、低产5级[31],在本文中,产量较高包含高产和偏高产,产量较低包含低产和偏低产。
1.3.2 推荐施肥量计算 施肥不仅是为了满足作物生产的养分需求,以维持或提高产量,也是培肥土壤的关键措施,即通过肥料投入调控和提高土壤供应养分的能力。因此,确定不同产量水平的农户合理施肥量,应在考虑作物产量形成对养分需求的基础上,结合维持农田土壤养分平衡和肥力提升的需求。因此,小麦的推荐施肥量应为:
式(2)中,目标产量养分需求量为农户产量(见1.3.1)、1 000 kg籽粒养分需求量和养分转换系数(N为1;P转换为P2O5系数为2.29;K转换为K2O系数为1.2)三者的乘积。小麦的1 000 kg籽粒产量的养分需求量随产量、施肥量、品种、区域环境而变化[34,35,36,37,38,39,40],本文中采用的小麦1 000 kg籽粒产量养分需求量为农户产量在相应麦区所处产量等级养分需求量的均值[31]。施肥系数根据各麦区土壤养分供应能力确定。
研究表明,小麦收获后残留在土壤中的肥料氮会以硝态氮的形式累积,残留量较高时,将威胁环境安全[18,41]。在我国西北旱地的研究表明,小麦收获期0—100 cm土层硝态氮残留应小于55 kg·hm-2[42]。对于我国华北平原小麦玉米轮作体系,不同****研究认为作物收获后0—90 cm土层硝态氮残留应控制在150 kg·hm-2以内[43,44]。欧盟提出,作物收获后土壤耕层的硝态氮含量控制在30—50 kg·hm-2,才能避免发生硝态氮淋溶[45,46]。因此,考虑环境安全和土壤氮素平衡,本文结合各个麦区表层土壤硝态含量,提出了土壤硝态氮含量分级标准,并给出了相应的施氮系数。考虑到目前我国的小麦生产中,农户氮肥投入普遍过量,且残留在土壤中的氮素易随水向深层淋溶,造成损失,因此,当0—20 cm土层硝态氮处于中等水平时,施氮系数为1,即氮肥投入量只需补充作物带走的氮素即可[47],土壤硝态氮处于较高水平时,需减施氮肥,反之增加。
在一定的气候下,土壤有效磷达到一定的临界值后,增施磷肥不再增加作物产量[48]。在我国黄淮地区,小麦收获后土壤速效磷为13.1 mg·kg-1时,产量可达最大产量的95%[49]。位于我国北方的多点长期定位试验表明,小麦响应的土壤有效磷含量临界值平均为16.3 mg·kg-1[50]。位于杨凌、重庆的试验表明,小麦的土壤有效磷阈值分别为14.6、11.1 mg·kg-1[51]。因此,基于磷的恒量监控施肥原则[52,53],提出了我国主要麦区的土壤有效磷分级标准及相应的施磷系数。由于磷在土壤中移动性较差,且容易被固定[54],当土壤中的有效磷处于中等水平时,本文的推荐施磷量为目标产量需磷量的1.3倍。
对各麦区0—20 cm土层有效钾含量分析发现,我国农田表层土壤速效钾量平均高达151.7 mg·kg-1(表1),且多数地区有逐年增加的趋势,原因在于农户钾肥投入量逐步提高[33],再者,目前小麦收获后秸秆普遍还田,而作物吸收的钾素70%以上累积在秸秆[23,42]。因此,施用钾肥仅需补充作物籽粒携出的钾素。本文结合各麦区土壤有效钾水平,参考《测土配方施肥技术》制定的土壤钾素丰缺指标[53],基于钾恒量监控施肥原则[52,53],提出了我国各麦区土壤有效钾分级标准与对应的施钾系数,土壤供钾水平中等时,推荐施钾量仅为目标产量需钾量的0.3倍。
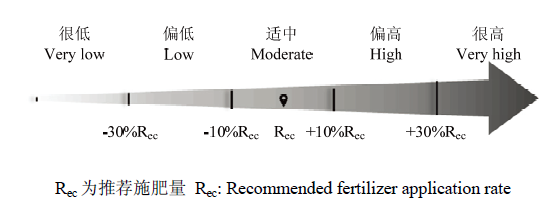
1.3.3 农户小麦施肥评价方法 考虑到各个麦区不同农户的产量水平不同,因而目标产量的养分需求存在差异,参考基于产量的农户施肥评价方法[47],在研究中以每个农户的推荐施肥量(1.3.2)为中心,分别上下浮动10%和30%,分为很高、偏高、适中、偏低和很低5个施肥量评价等级,对农户施肥情况进行评价(图1),下文中施肥过量指很高和偏高,施肥不足指很低和偏低。
数据处理方法:用 Microsoft Excel 2013 整理数据,SigmaPlot 12.5作图,SPSS Statistics 17.0 统计分析。
图1
 新窗口打开|下载原图ZIP|生成PPT
图1农户施肥量分级标准与等级划分
Fig. 1Grading standard and grade divisions for Famers’ fertilizer application
2 结果
2.1 我国不同麦区农户小麦产量与生物量的关系
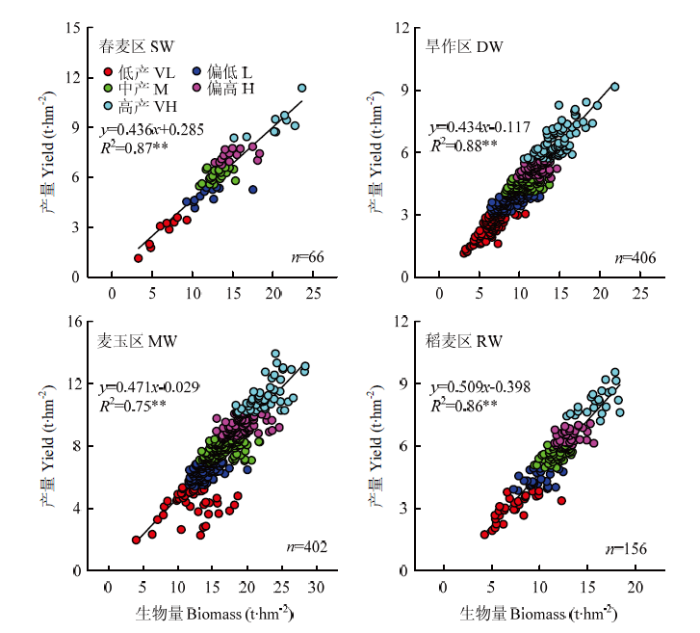
我国各主要麦区,农户产量均与生物量呈极显著的线性关系(图2)。全国小麦产量介于1.1—13.9 t·hm-2,均值6.0 t·hm-2,生物量介于3.1—28.4 t·hm-2,平均为13.2 t·hm-2。春麦区,小麦产量和生物量平均分别为6.1和13.4 t·hm-2,生物量每增加1 t,产量增加0.44 t;在低产、偏低、中产、偏高和高产5个产量等级的农户分别占16%、18%、43%、18%和15%。旱作区,产量和生物量均值分别为4.4和10.3 t·hm-2,生物量每增加1 t,产量增加0.43 t;5个产量等级的农户分别为22%、17%、23%、18%和21%。麦玉区,产量和生物量平均分别为7.8和16.6 t·hm-2,生物量增加1 t,产量增加0.47 t;产量在各等级的占比分别为11%、23%、32%、23%和12%。稻麦区,产量和生物量均值分别为5.5和11.5 t·hm-2,生物量每增加1 t,产量增加0.51 t;产量在各等级分别占17%、16%、32%、20%和14%。图2
 新窗口打开|下载原图ZIP|生成PPT
图2我国不同麦区农户小麦产量与生物量的关系
VL为低产,L为偏低,M为中产,H为偏高,VH为高产
Fig. 2Relationships of farmers’ grain yield to biomass in major wheat production regions of China
VL: Very low yield; L: Low yield; M: Medium yield; H: High yield; VH: Very high yield
可见,我国不同麦区小麦产量波动范围较大,但整体上看,各麦区较高产量的农户基本上占1/3左右,生物量高低是决定小麦产量的一个主要因素。
2.2 我国不同麦区农户小麦产量与施肥量的关系
对我国主要麦区1 030个农户分析发现(图3),小麦产量与氮、磷、钾肥用量没有显著的相关关系。全国小麦氮、磷、钾肥用量分别介于0—591.0、0—517.5和0—315.0 kg·hm-2,平均分别为191.1、112.8和53.4 kg·hm-2。春麦区,农户氮、磷、钾肥用量平均分别为171.7、108.9和10.6 kg·hm-2,在低于平均施肥量的农户中有11%—21%的产量达到较高水平,高于平均施肥量的农户中有8%—9%的产量处于较低水平。旱作区,氮、磷、钾平均施肥量分别为154.3、111.8和32.6 kg·hm-2,施肥量低于平均值时,有21%—22%的农户产量达较高水平,高于平均值时,有11%—26%的农户产量为较低水平。麦玉区,3种肥料用量均值分别为236.4、128.1、74.0 kg·hm-2,施肥量低于均值的农户中有18%的农户产量处于较高水平,高于平均值时,有9%—18%的农户产量较低。稻麦区,三种肥料平均用量分别为177.5、77.0、71.8 kg·hm-2,施肥量低于平均时,有12%—17%的农户产量处于较高水平,高于平均时,有15%—17%的农户产量处于较低水平。图3
 新窗口打开|下载原图ZIP|生成PPT
图3我国不同麦区农户氮肥、磷肥和钾肥施用量与小麦产量的关系
图中实线代表平均产量,虚线代表平均施肥量
Fig. 3Relationships of farmers’ grain yield to application rates of N, P and K fertilizers in major wheat production regions of China
The full line represents mean value of wheat grain yield. The dotted line represents mean values of fertilizers rates used by farmers, respectively
可见,在我国各麦区,农户小麦产量高低与施肥量多少与并无显著关系,施肥量低时,小麦产量依然可达较高水平,施肥量高时也存在产量较低的情况。
2.3 我国不同麦区农户小麦产量与土壤养分的关系
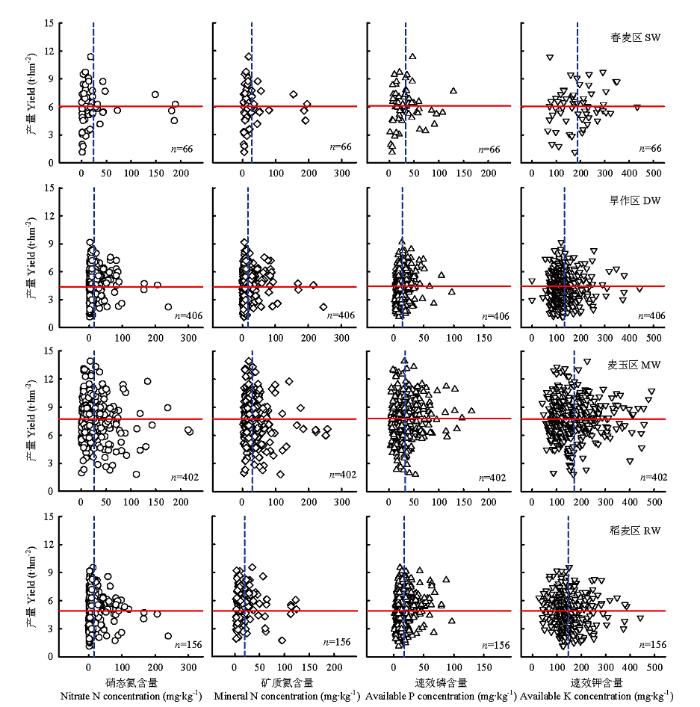
对土壤养分的分析发现,不同麦区小麦产量与0—20 cm土层硝态氮、矿质态氮、速效磷、速效钾含量均无显著相关关系(图4)。不同麦区0—20 cm土层的硝态氮、矿质态氮、有效磷、有效钾含量分别介于0—253.5、0—256.8、1.0—166.1和27.0—695.9 mg·kg-1,平均分别为19.1、23.3、23.1和151.1 mg·kg-1。春麦区,0—20 cm土层硝态氮、矿质态氮、有效磷、有效钾含量平均分别为23.6、27.9、34.2和191.4 mg·kg-1,当土壤养分含量低于平均值时,有18%—29%的农户可达较高产量,高于均值时,有5%—15%的农户产量较低。旱作区,土壤养分含量平均分别为14.1、16.5、13.7和133.4 mg·kg-1,土壤养分低于均值时,有20%—25%的农户产量达较高水平,高于均值时,有2%—16%的农户产量为较低水平。麦玉区,土壤养分含量均值分别为25.6、30.3、31.3和171.9 mg·kg-1,土壤养分含量低于均值时,有17%—26%的农户产量处于较高水平,高于均值时,有10%—13%的农户为较低产量。稻麦区,土壤养分含量平均分别为12.9、20.6、22.6和130.5 mg·kg-1,当土壤养分含量低于平均水平时,有18%—23%的农户产量较高,高于平均水平时,有9%—11%的农户产量处于较低水平。图4
 新窗口打开|下载原图ZIP|生成PPT
图4我国不同麦区农户小麦产量与0—20 cm 土壤养分的关系
图中实线代表平均产量,虚线代表养分平均含量
Fig. 4Relationships of farmers’ grain yield to soil nutrients of 0-20 cm layer in major wheat production regions of China
The full line represents mean value of wheat grain yield. The dotted line represents mean concentration of soil nutrient
说明,在我国各麦区,目前农户小麦产量高低与0—20 cm土层的土壤硝态氮、矿质态氮、有效磷、有效钾含量多少并无显著关系,土壤养分含量低时,小麦并非绝对低产,土壤养分含量高时,也未必能获得高产。
2.4 我国不同麦区农户小麦施氮量评价及减肥潜力分析
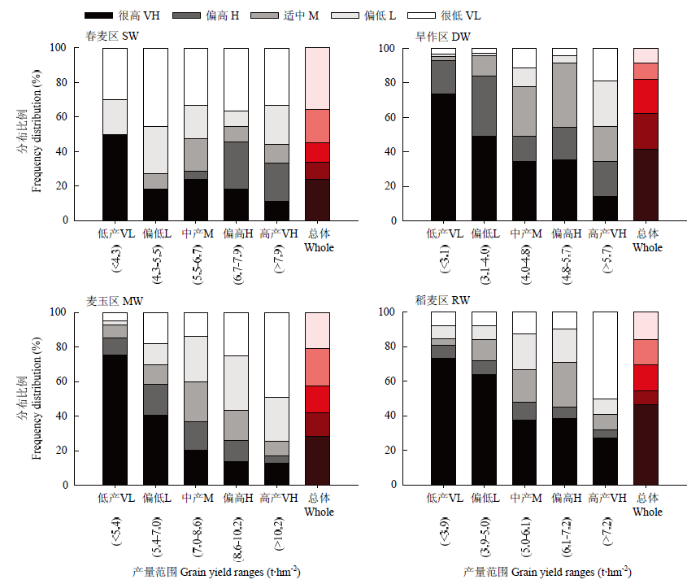
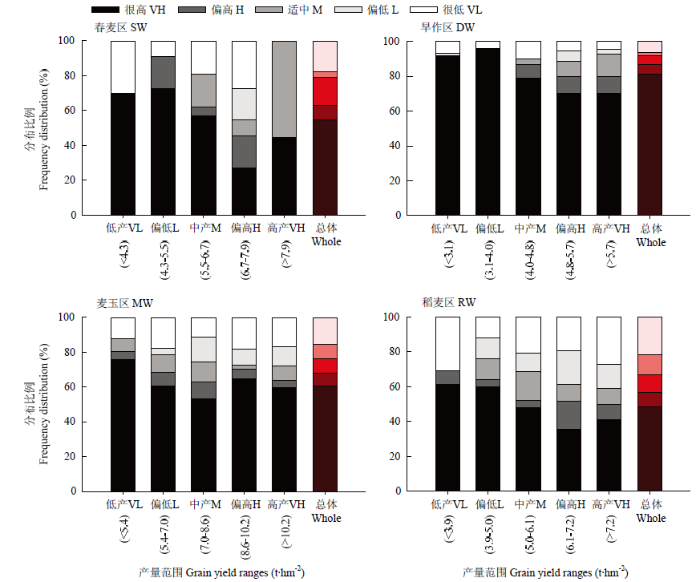
2.4.1 农户小麦施氮量评价 对不同小麦产量水平农户的施氮量分析表明(图5),随着产量增加,各麦区过量施氮的农户比例逐渐减少,施氮不足的比例逐渐增加。春麦区,当产量由低产至高产变化时,过量施氮的农户由50%降至33%,施氮不足的由50%增至56%,施氮量很低、偏低、适中、偏高和很高的农户平均分别占35%、19%、11%、10%和24%。旱作区,产量由低产增至高产时,过量施氮的农户由93%降至35%,施氮不足的由5%增至45%,各施氮等级的农户平均分别占9%、9%、20%、21%和42%。麦玉区,产量水平由低到高时,过量施氮的农户由85%降到17%,施氮不足的由7%增至74%,各施氮等级的农户平均分别占21%、22%、16%、14%和28%。稻麦区,产量由低产增至高产水平时,过量施氮的农户由81%降至32%,施氮不足的由15%增至59%,各施氮等级的农户比例平均分别为16%、14%、15%、8%和47%。图5
 新窗口打开|下载原图ZIP|生成PPT
图5我国不同麦区农户小麦施氮量在各产量等级的分布
图中颜色由深至浅表示施肥量由高至低。下同
Fig. 5Distributions of farmers with different N inputs at different grain yield levels in major wheat production regions of China
The color from dark to light indicates the fertilizer rates from high to low. The same as below
在我国春麦区,过量施氮的农户较少,为34%,在旱作、麦玉和稻麦区过量施氮的农户较多,分别为63%、42%和55%,处于中低产水平的农户过量施氮问题更为严重,产量较高的农户应重视施氮不足的问题,特别是在麦玉区和稻麦区。
2.4.2 农户氮肥减施潜力 基于0—20 cm土层的硝态氮和矿质态氮含量,确定施氮系数,并分别计算出推荐施氮量。由于0—20 cm土层中铵态氮含量较低(表1),基于两个指标计算得出的推荐施氮量无显著差异(P≤5%)。考虑到实际应用方便,选择基于硝态氮含量的推荐施氮量,通过比较农户的施氮量与推荐施氮量发现(表2),氮肥减施潜力因麦区和农户产量水平而异。产量较低的农户减氮数量多、潜力大,产量较高的农户减氮数量相对较少,甚至还需要增施一定数量的氮肥。春麦区,低产和偏低水平的农户平均减氮2.3—20.8 kg·hm-2,中产至高产水平的农户需增氮10.5—37.7 kg·hm-2,其中低产水平农户减肥潜力最大,为25.8%,整体来说,需增肥17.7%。旱作区,产量由低产至高产变化时,农户平均需减氮3.5—59.1 kg·hm-2,随产量增加,减氮量逐渐减小,各产量水平农户均有较大减肥潜力,平均减肥潜力为12.8%。麦玉区,产量由低产至中产时,农户平均减氮量由135.5降至2.1 kg·hm-2,其中低产农户减肥潜力为43.6%,产量为偏高和高产水平时,农户分别需增施氮肥29.7和70.5 kg·hm-2。稻麦区,由低产至偏高产量水平时,农户平均减氮量由87.1 kg·hm-2降至26.4 kg·hm-2,减肥潜力由39.4%降至4.8%,高产农户则平均需增氮25.0 kg·hm-2。
Table 2
表2
表2我国主要麦区不同产量水平的农户施氮量和推荐施氮量
Table 2
| 区域 Region | 产量等级 Yield level (t·hm-2) | 硝态氮 Nitrate (mg·kg-1) | 农户施肥量 FP (kg N·hm-2) | 推荐施肥量 Rec (kg N·hm-2) | 减肥量 Reduction (kg N·hm-2) | 减肥潜力 Reduction potential (%) |
|---|---|---|---|---|---|---|
| 春麦区 SW | 低产VL(<4.3) | 8.4±3.6a | 109.4±30.6b | 88.6±7.9d | -20.8±28.4 | -25.8±13.7 |
| 偏低L(4.3—5.5) | 27.7±16.5a | 163.1±32.5ab | 160.8±7.5c | -2.3±36.8 | 29.1±16.5 | |
| 中产M(5.5—6.7) | 32.5±11.2a | 171.5±32ab | 182.0±7.1c | 10.5±30.0 | 17.3±17.2 | |
| 偏高H(6.7—7.9) | 25.3±10.9a | 186.4±40.7ab | 224.1±8.9b | 37.7±39.2 | 1.1±18.2 | |
| 高产VH(>7.9) | 12.6±3.7a | 233.7±38.3a | 269.3±12.1a | 35.6±41.7 | 53.4±30.3 | |
| 均值 Mean | 23.6±5.1A | 171.7±16.1BC | 183.3±7.8B | 11.6±15.6 | 17.7±9.3 | |
| 旱作区 DW | 低产VL(<3.1) | 10.3±3.1bc | 141.1±6.1b | 82.0±2.0d | -59.1±6.2 | -37.1±2.6 |
| 偏低L(3.1—4.0) | 8.1±1.3c | 144.5±5.2b | 104.6±1.3c | -37.9±5.5 | -25.0±2.1 | |
| 中产M(4.0—4.8) | 17.4±3.4ab | 150.2±6.6b | 127.1±1.4b | -20.8±7.1 | -5.3±4.0 | |
| 偏高H(4.8—5.7) | 15.7±2.4abc | 155.9±7.7b | 127.5±1.7b | -31.1±7.2 | -10.7±4.8 | |
| 高产VH(>5.7) | 18.2±2.4a | 179.3±8.7a | 175.9±3.2a | -3.5±9.1 | 11.8±4.6 | |
| 均值Mean | 14.1±1.3B | 154.3±3.2C | 122.6±1.9D | -31.3±3.4 | -12.8±1.9 | |
| 麦玉区 WM | 低产VL(<5.4) | 37.9±5.4a | 267.8±13.4a | 129.7±6.2e | -135.5±16.5 | -43.6±5.6 |
| 偏低L(5.4—7.0) | 29.9±4.9ab | 221.4±8.8b | 188.6±2.9d | -31.9±10.0 | 3.6±6.3 | |
| 中产M(7.0—8.6) | 22.1±1.9b | 229.8±6.4b | 226.5±2.7c | -2.1±7.3 | 6.8±3.7 | |
| 偏高H(8.6—10.2) | 21.4±2.4b | 243.7±8.6ab | 271.9±3.7b | 29.7±10.1 | 24.7±5.4 | |
| 高产VH(>10.2) | 23.8±3.7b | 240.5±13.8ab | 311.0±7.4a | 70.5±17.5 | 48.7±8.9 | |
| 均值Mean | 25.6±1.6A | 236.4±4.1A | 227.5±3.1A | -7.7±5.5 | 10.0±2.8 | |
| 稻麦区 RW | 低产VL(<3.9) | 9.0±2.9a | 171.5±18.2a | 84.3±3.6e | -87.1±17.2 | -39.4±7.0 |
| 偏低L(3.9—5.0) | 10.8±3.1a | 177.8±13.2a | 117.4±2.8d | -61.2±14.0 | -27.6±6.2 | |
| 中产M(5.0—6.1) | 15.2±3.6a | 171.9±11.1a | 143.9±2.6c | -26.5±11.4 | -9.3±5.3 | |
| 偏高H(6.1—7.2) | 14.4±3.4a | 191.6±14.8a | 165.2±3.3b | -26.4±15.5 | -4.8±6.8 | |
| 高产VH(>7.2) | 13.9±4.1a | 177.0±16.2a | 202.0±4.5a | 25.0±16.5 | 37.3±14.1 | |
| 均值Mean | 12.9±1.6B | 177.5±6.3B | 142.1±3.3C | -35.1±7.0 | -9.5±3.9 |
新窗口打开|下载CSV
可见,产量处于中低产水平的农户减氮潜力较大,尤其是麦玉和稻麦区的低产农户,而高产和偏高产的农户则需增施适量氮肥。
2.5 我国不同麦区农户小麦施磷量评价及减肥潜力分析
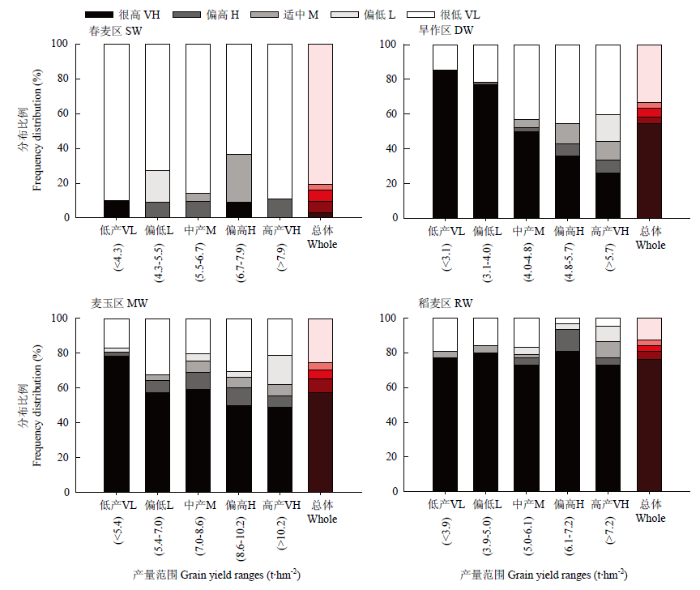
2.5.1 农户小麦施磷量评价 分析各产量水平的施磷量发现(图6),各麦区过量施磷的农户较多。春麦区,产量由偏低至偏高时,过量施磷的农户由91%降至45%,施磷不足的由9%增至45%,总体来看,施磷量很低、偏低、适中、偏高和很高的农户平均分别占18%、3%、16%、8%和55%。旱作区,产量由低产增至高产时,过量施磷的农户由92%降至80%,施磷不足的农户占10%左右,各施磷等级的农户平均分别占7%、2%、5%、6%和81%。麦玉区,产量水平由低到高时,过量施磷的农户由80%降到64%,施磷不足的由12%增至28%,各施磷等级的农户平均分别占15%、9%、8%、7%和61%。稻麦区,产量由低产增至高产水平时,过量施磷的农户由69%降至50%,而施磷不足的由31%增至41%,各施磷等级的农户比例平均分别为22%、11%、11%、8%和49%。图6
 新窗口打开|下载原图ZIP|生成PPT
图6我国不同麦区农户施磷量在各产量等级的分布
Fig. 6Distributions of farmers with different P inputs at different grain yield levels in major wheat production regions of China
因此,我国主要麦区农户过量施磷情况较为严重,4个麦区过量施磷农户分别为63%、87%、68%和57%,且产量处于较高水平时,各麦区过量施磷的农户仍占50%—80%,表明即使是产量较高的农户也依然存在过量施磷的现象。因此,各产量等级的农户均需减施磷肥。
2.5.2 农户小麦磷肥减施潜力分析 比较农户施磷量与推荐施磷量发现(表3),各麦区磷肥减施潜力因产量水平而异,且减磷量随产量增加呈降低趋势。春麦区,低产农户磷肥减施潜力最大,为46.9%,产量由低产至高产时,平均减磷量由45.6 kg·hm-2降至36.4 kg·hm-2。旱作区,产量由低产至高产水平时,平均减磷量由76.6 kg·hm-2减至67.0 kg·hm-2,整体减磷潜力高达55.6%。麦玉区,产量从低产增至高产时,平均减磷量由59.0 kg·hm-2降至29.7 kg·hm-2,其中低产农户减磷潜力为46.3%。稻麦区,由低产至高产时,平均减磷量由23.6 kg·hm-2减至4.3 kg·hm-2,减磷潜力逐渐减小。
总体来看,不同麦区各产量水平的农户均需减施磷肥,旱作区农户减磷潜力最大,为55.6%,平均减磷量达70.5 kg·hm-2,其次为麦玉区、春麦区和稻麦区,平均减磷量分别为39.2、35.1和14.2 kg·hm-2。
Table 3
表3
表3我国主要麦区不同产量水平农户平均施磷量和推荐的平均施磷量
Table 3
| 区域 Region | 产量等级 Yield level (t·hm-2) | 速效磷 Available P (mg·kg-1) | 农户施肥量 FP (kg P2O5·hm-2) | 推荐施肥量 Rec (kg P2O5·hm-2) | 减肥量 Reduction (kg P2O5·hm-2) | 减肥潜力 Reduction potential (%) |
|---|---|---|---|---|---|---|
| 春麦区 SW | 低产VL(<4.3) | 28.7±10.6a | 78.7±21.3b | 33.0±4.2d | -45.6±22.4 | -46.9±18.2 |
| 偏低L(4.3—5.5) | 41.7±10.1a | 110.6±20.9a | 67.7±8.2bc | -42.9±19.7 | -27.6±10.0 | |
| 中产M(5.5—6.7) | 34.5±4.2a | 105.6±16.2a | 67.1±6.8c | -38.5±14.8 | -39.9±6.7 | |
| 偏高H(6.7—7.9) | 37.5±9.5a | 103.1±22.9a | 92.6±12.6ab | -10.4±17.7 | -18.1±12.2 | |
| 高产VH(>7.9) | 25.3±5.2a | 155.3±26.9a | 118.9±16.8a | -36.4±16.5 | -15.7±7.7 | |
| 均值Mean | 34.2±3.4A | 108.9±9.4A | 73.7±5.3B | -35.1±8.0 | -31.0±4.7 | |
| 旱作区 DW | 低产VL(<3.1) | 12.1±1.0b | 103.3±6.2b | 26.8±1.0d | -76.6±6.2 | -69.5±2.4 |
| 偏低L(3.1—4.0) | 11.7±1.5b | 128.9±8.4a | 36.0±1.0c | -91.1±8.6 | -67.7±1.9 | |
| 中产M(4.0—4.8) | 13.8±1.0ab | 103.9±6.6b | 39.9±1.3c | -64.8±7.1 | -57.1±2.6 | |
| 偏高H(4.8—5.7) | 15.1±1.3ab | 100.1±7.0b | 45.9±1.7b | -53.5±7.1 | -42.6±4.9 | |
| 高产VH(>5.7) | 15.8±1.1a | 124.8±8.3a | 57.8±2.0a | -67.0±8.6 | -41.2±3.8 | |
| 均值Mean | 13.7±0.5C | 111.8±3.3A | 41.1±0.8D | -70.5±3.4 | -55.6±1.7 | |
| 麦玉区 WM | 低产VL(<5.4) | 22.8±2.0b | 121.8±12.1a | 56.5±4.6d | -59±11.3 | -46.3±7.2 |
| 偏低L(5.4—7.0) | 30.2±2.8ab | 114.9±8.0a | 79.6±3.5c | -35.7±8.7 | -33.8±5.4 | |
| 中产M(7.0—8.6) | 29.1±2.1b | 129.0±6.9a | 89.6±3.1bc | -37.4±7.4 | -20.7±4.1 | |
| 偏高H(8.6—10.2) | 35.9±2.7a | 138.9±8.6a | 95.9±4.4ab | -40.2±9.8 | -17.8±6.9 | |
| 高产VH(>10.2) | 38.2±3.9a | 136.8±7.2a | 107.1±8.0a | -29.7±10.4 | -17.0±7.2 | |
| 均值Mean | 31.3±1.2A | 128.1±3.8A | 87.2±2.1A | -39.2±4.2 | -25.0±2.7 | |
| 稻麦区 RW | 低产VL(<3.9) | 16.1±2.3b | 69.7±8.5a | 46.1±3.6c | -23.6±9.1 | -33.2±9.3 |
| 偏低L(3.9—5.0) | 20.2±2.2ab | 73.3±6.0a | 51.5±3.5c | -23.1±6.9 | -21.5±9.1 | |
| 中产M(5.0—6.1) | 24.5±2.6a | 80.4±5.6a | 64.5±3.9b | -15.7±7.3 | -13.3±8.6 | |
| 偏高H(6.1—7.2) | 22.8±2.9ab | 74.4±5.2a | 70.6±4.5ab | -3.8±6.8 | 3.7±10.4 | |
| 高产VH(>7.2) | 28.9±4.7a | 86.1±6.6a | 81.8±7.3a | -4.3±9.3 | 2.6±12.4 | |
| 均值Mean | 22.6±1.3B | 77.0±2.9B | 63±2.2C | -14.2±3.6 | -11.6±4.6 |
新窗口打开|下载CSV
2.6 我国不同麦区农户小麦施钾量评价及减肥潜力分析
2.6.1 农户小麦施钾量评价 对各麦区农户的施钾量分析发现(图7),施钾情况因麦区和产量等级而异。春麦区,以施钾不足为主,产量由低产至高产时,施钾不足的农户介于64%—90%,各产量等级过量施钾的农户仅10%左右,不同产量水平下施钾很低、偏低、适中、偏高和很高的农户比例分别为81%、3%、6%、6%和3%。旱作区,产量由低产增至高产时,施钾过量的农户由85%降至33%,不足的由15%增至56%,各施钾等级的农户分别占33%、3%、5%、4%和55%。麦玉区,产量水平由低到高时,施钾过量的农户由80%降到55%,不足的由20%增至38%,各施钾等级的农户分别占25%、4%、5%、8%和57%。稻麦区,不同产量等级施钾过量的农户介于77%—94%,不足的农户介于6%—19%,各施钾等级的农户比例分别为13%、3%、3%、5%和76%。说明,春麦区农户施肥的主要问题是钾肥投入不足,旱作、麦玉和稻麦区施钾过量的农户较多,分别占59%、65%和81%,且大多为中低产水平的农户,因此,春麦区农户应适当的增施钾肥,其他麦区钾肥减施的重点是中低产水平的农户。
图7
 新窗口打开|下载原图ZIP|生成PPT
图7我国不同麦区农户施钾量在各产量等级的分布
Fig. 7Distributions of farmers with different K inputs at different grain yield levels in major wheat production regions of China
2.6.2 农户小麦钾肥减肥潜力分析 对比农户施钾量与推荐施钾量发现(表4),各麦区不同产量水平的农户钾肥减肥潜力存在差异,春麦区需增施钾肥,且增肥量随产量提高而增加,其他3个麦区均需减施钾肥,且减钾量随产量增加而降低。春麦区,产量由低产至高产水平时,平均增施钾肥量由17.7 kg·hm-2增至38.5 kg·hm-2。旱作区,低产水平农户减钾潜力可达72.3%,产量由低产至中产水平时,平均减钾量由32.2 kg·hm-2减至1.3 kg·hm-2,当产量处于偏高和高产时,平均需增钾2.3和6.7 kg·hm-2。麦玉区,产量从低产增至高产时,平均减钾量由44.1 kg·hm-2降至14.5 kg·hm-2,整体减钾潜力25.7%。稻麦区,当农户产量由低产升至偏高产时,平均减钾量由45.9 kg·hm-2降至41.6 kg·hm-2,高产农户平均需减钾49.2 kg·hm-2,不同产量水平的农户平均减钾潜力均超过49.0%。
可见,春麦区需增施钾肥,平均需增钾22.8 kg·hm-2,旱作、麦玉和稻麦区均需减施钾肥,平均分别需减钾11.2、26.0和44.2 kg·hm-2,稻麦区减钾潜力最高可达56.0%。
Table 4
表4
表4我国主要麦区不同产量水平农户平均施钾量和推荐的平均施钾量
Table 4
| 区域 Region | 产量等级 Yield level (t·hm-2) | 速效钾 Available K (mg·kg-1) | 农户施肥量 FP (kg K2O·hm-2) | 推荐施肥量 Rec (kg K2O·hm-2) | 减钾量 Reduction (kg K2O·hm-2) | 减肥潜力 Reduction potential (%) |
|---|---|---|---|---|---|---|
| 春麦区 SW | 低产VL(<4.3) | 149.8±18.2b | 3.6±3.6a | 21.3±5.2b | 17.7±6.8 | -25.4±37.2 |
| 偏低L(4.3—5.5) | 197.5±25.7a | 11.6±4.7a | 30±6.2ab | 18.4±4.5 | 100.6±54 | |
| 中产M(5.5—6.7) | 192.9±18.2a | 11.6±5.7a | 34.8±5.1ab | 23.2±6.8 | -2.7±45.7 | |
| 偏高H(6.7—7.9) | 188.7±24.6a | 17.6±9.1a | 36.1±6.2ab | 18.5±9.6 | -14.5±12.7 | |
| 高产VH(>7.9) | 230.4±29.8a | 6.0±4.2a | 44.5±12.9a | 38.5±14.4 | 17.9±34.6 | |
| 均值 Mean | 191.4±10.4A | 10.6±2.7C | 33.4±3.1B | 22.8±3.8 | 24.6±22.2 | |
| 旱作区 DW | 低产VL(<3.1) | 130.1±5.6a | 44.8±3.7a | 12.5±0.7d | -32.2±3.7 | -72.3±1.8 |
| 偏低L(3.1—4.0) | 139.9±6.8a | 48.7±5.3a | 14.7±0.9d | -33.3±5.3 | -67.1±2.8 | |
| 中产M(4.0—4.8) | 133.1±5.8a | 22.1±2.3b | 21.2±1.0c | -1.3±2.7 | -47.9±3.3 | |
| 偏高H(4.8—5.7) | 131.4±6.3a | 24.6±3.0b | 26.2±1.4b | 2.3±3.4 | -2.2±17.8 | |
| 高产VH(>5.7) | 133.5±5.4a | 25.3±2.8b | 32.0±1.6a | 6.7±3.3 | -8.4±7.1 | |
| 均值Mean | 133.4±2.6C | 32.6±1.6B | 21.3±0.6C | -11.2±1.9 | -43.2±3.9 | |
| 麦玉区 WM | 低产VL(<5.4) | 165.9±11.6a | 69.8±6.6a | 26.6±2.5d | -44.1±6.6 | -57.3±9.6 |
| 偏低L(5.4—7.0) | 168.5±8.8a | 69.4±6.2a | 38.9±2.5c | -31.7±6.4 | -46.0±5.9 | |
| 中产M(7.0—8.6) | 167.4±8.6a | 80.8±4.4a | 50.8±2.6b | -30.4±5 | -32.1±4.8 | |
| 偏高H(8.6—10.2) | 186.1±10.0a | 68.3±4.8a | 57.6±3.9ab | -11.1±6.1 | -4.9±9.9 | |
| 高产VH(>10.2) | 169.0±15.3a | 79.7±6.6a | 65.2±5.4a | -14.5±8.6 | 8.1±16.6 | |
| 均值Mean | 171.9±4.6B | 74.0±2.5A | 48.6±1.6A | -26.0±2.9 | -25.7±4.0 | |
| 稻麦区 RW | 低产VL(<3.9) | 123.8±9.3a | 65.2±9.0a | 19.4±2.2b | -45.9±9.5 | -69.4±4.9 |
| 偏低L(3.9—5.0) | 117.2±10.1a | 67.9±6.8a | 28.3±2.5a | -42.9±8.1 | -49.2±8.8 | |
| 中产M(5.0—6.1) | 133.9±10.1a | 71.9±5.5a | 28.3±2.4a | -43.2±6.7 | -54.8±6.6 | |
| 偏高H(6.1—7.2) | 129.0±11.8a | 73.8±5.0a | 32.2±3.2a | -41.6±6.2 | -55.3±5.0 | |
| 高产VH(>7.2) | 147.8±11.6a | 81.1±6.7a | 31.9±4.0a | -49.2±8.4 | -53.9±7.8 | |
| 均值Mean | 130.5±4.9C | 71.8±2.9A | 28.1±1.3B | -44.2±3.4 | -56.0±3.1 | |
新窗口打开|下载CSV
3 讨论
3.1 我国主要麦区小麦产量与施肥及土壤养分的关系
对我国主要麦区小麦产量和生物量的分析表明,各麦区小麦产量波动大,33%—39%农户的小麦产量达到较高水平,小麦产量平均为6.0 t·hm-2、生物量平均为13.2 t·hm-2,两者呈极显著正相关,生物量每增加1 t,小麦产量增加0.43—0.51 t。与本研究结果相似,陕西、山西和甘肃三省的农户调研发现,生物量每增加1 t,产量增加0.4 t[32]。华北平原的田间试验发现,拔节期灌水后小麦生物量增加114%,相应的籽粒产量增加225%[54]。渭北旱塬的田间试验表明,优化施肥时期及栽培模式的小麦产量较农户施肥模式提高了6%—17%,生物量相应的增加8%—29%[55]。但在20世纪80年代,籽粒产量增加时,生物量基本维持在一定水平[56],或者略微增加[57],甚至是降低[58]。与之相比,近年来产量和生物量的增加主要得益于优质小麦品种的选育及施肥与田间管理技术的改善。在目前品种产量潜力普遍提高的情况下,小麦产量的进一步提高主要取决于生物量增加[59,60,61,62]。因此,优化水肥与栽培管理,提高小麦生物量,是进一步提高小麦产量的关键。研究表明,我国各麦区农户小麦产量与氮磷钾肥施用量、土壤硝态氮、矿质态氮、有效磷、有效钾均无显著相关关系。在同一麦区,土壤养分条件接近的情况下,农户施肥量处于很低或偏低水平时,小麦产量仍可达到高产水平,当农户施肥量较高时,也有许多农户产量处于低产水平。如在旱作区,当农户施肥量低于平均水平时,有超过20%的农户产量高于5.7 t·hm-2,在春麦区,有些农户不施肥,小麦产量仍可达7.0 t·hm-2以上。可能的原因是土壤本身肥力水平较高,或长期过量施肥导致土壤养分大量累积,即使少施或不施肥的情况下,也可满足养分需求,使作物产量达到高产。不少研究表明,作物产量与施肥量呈二次抛物线或线性加平台的模型关系[63,64],当作物产量达到最大值时,继续增施肥料,产量将不再增加甚至降低,说明过量施肥会影响作物正常生长,降低产量和品质[65]。土壤肥力是影响作物产量的关键因素[66]。本研究表明,在各麦区,当土壤养分含量低于平均水平时,仍有17%—29%的农户产量处于高产水平。其原因主要是目前我国农田土壤养分含量普遍偏高(表1,表3—5)。大量研究也表明,近年来我国农田土壤氮素盈余量逐年增加[67,68,69],有效磷含量也有大幅提升[30]。对于钾肥而言,尽管目前复合肥的普及使得钾肥投入逐渐增加,但过去农户大多持有土壤钾素较丰富的观点,长期忽视钾肥投入,导致一些地区土壤钾一直处于消耗状态,如春麦区。土壤养分供应不平衡时,化肥盲目投入会加重小麦减产的风险。因此,农户施肥时,应结合土壤养分测试结果,在明确土壤养分供应能力的前提了,优化肥料养分投入,避免过量施肥。
3.2 我国主要麦区农户小麦施肥问题及减肥潜力
研究表明,我国主要麦区小麦施氮不合理现象普遍存在,其中春麦区过量施氮的农户相对较少,为34%,其次麦玉区为42%,稻麦区为55%,旱作区过量施肥农户最多,为63%,且产量越低,农户过量施氮情况越严重,如在旱作区,低产中有93%的农户过量施氮,而在产量较高的麦玉区,处于高产水平时,有74%的农户施氮不足。渭北旱塬的调研表明,旱作区有64%—69%的农户小麦施氮过量[8,47],与本研究结果一致。也有研究发现,旱作区89%的农户小麦施氮过量[30],较本研究结果偏高。原因主要是评价标准不一致,本文采用了曹寒冰等的方法,基于农户的产量水平高低对其施肥情况进行评价,反映了不同产量水平对养分需求的差异,较为客观。如果以一个固定的标准,如赵护兵等以120—160 kg·hm-2、刘芬等以75—105 kg·hm-2作为合适施氮量的标准[8,30],来评价不同农户的施肥情况,忽略了农户产量不同、对养分的需求数量高低也会有差异这一问题,可能会导致对高产农户养分需求的低估,使评价结果中过量施肥的农户比例升高。我国农户过量施磷问题也比较突出,各麦区过量的农户分别占63%、87%、68%和57%,且即使产量处于高产时,仍有50%—80%的农户施磷过量。据统计,目前我国磷肥年消耗量高达729万吨,1980—2018年磷肥用量增加了167%,同期粮食产量仅增加105%[3]。不少研究表明,施磷过量会导致小麦减产[70],这一问题应引起更多重视。我国小麦施钾情况因麦区而异,春麦区主要问题是农户施钾不足,占84%,旱作、麦玉和稻麦区过量施钾的农户较多,分别为59%、65%和81%,且大多为中低产水平的农户。春麦区施钾不足,可能与该区土壤钾较为丰富(表1),且长期受土壤不缺钾观念的影响,忽视了钾肥施用。渭北旱塬的农户调研表明,该区域有70%的农户施钾不足[47],较本研究中41%的农户施钾不足的结果偏高,主要原因可能是近年来越来越多的农户开始施用复合肥,从而增加了钾的投入量。虽然钾肥对作物抗逆增产有着重要作用,但我国钾肥资源不足,有61.0%需要通过从国际市场进口来满足[71],2018年我国仅氯化钾进口量即达746万吨,且钾肥(K2O)价格较高,目前均价为2.6元/kg,平均比氮肥(N)和磷肥(P2O5)高52%和14%[72,73,74],过量施钾不仅增加作物生产成本,同时也会增加国家和社会的经济压力。本文针对各麦区不同田块的产量水平、养分需求和土壤养分状况,分析评价了农户小麦的氮、磷和钾施肥问题,发现施肥过量和不足的问题因农户的产量水平高低而异。氮肥减施的重点是产量水平较低的农户,春麦区需减氮2.3—20.8 kg·hm-2,旱作区需减氮3.5—59.1 kg·hm-2,麦玉区需减氮2.1—135.5 kg·hm-2,稻麦区需减氮26.4—87.1 kg·hm-2;同时产量较高农户的施氮不足问题,也需引起重视,春麦区需增氮10.5—35.6 kg·hm-2,麦玉区需增氮29.7—70.5 kg·hm-2,稻麦区需增氮25.0 kg·hm-2。不同麦区各产量等级的农户均需减施磷肥,春麦区、旱作区、麦玉区、稻麦区平均减磷潜力分别达31.0%、55.6%、25.0%、11.6%。钾肥的问题因麦区而异,春麦区主要是施钾不足,农户平均需增施钾肥22.8 kg·hm-2,旱作、麦玉和稻麦区减钾潜力平均分别为43.2%、25.7%和56.0%,其中中低产水平农户是钾肥减施的重点。对江苏水稻的研究表明,通过优化管理等方法可将氮肥减量31%,同时实现水稻高产高效[75],与本文研究结果类似。豫北平原小麦-玉米轮作高产区,小麦的减氮潜力高于40%,减磷潜力约40%,需增加60%左右的钾肥[76],其钾肥潜力与本文有出入,原因可能与该文计算推荐施钾量的方法未考虑土壤供钾能力和秸秆还田带入的钾有关,故推荐钾肥用量偏高。
4 结论
不同区域连续3年的调研表明,我国主要麦区小麦平均产量6.0 t·hm-2,生物量13.2 t·hm-2,二者极显著正相关,生物量每增加1 t,小麦产量增加0.43—0.51 t,氮、磷、钾肥平均施用量分别为191.1、112.8和53.4 kg·hm-2,小麦产量与农户施肥量和表层土壤速效氮磷钾养分无显著相关关系。农户施肥状况和减肥潜力因麦区而异。总体来看,中低产农户过量施肥问题较为严重,应注意根据产量适量减少施用氮、钾肥,所有农户均需警惕磷肥过量投入问题。相对而言,春麦区过量施肥问题较轻,平均需增施氮、钾肥11.6和22.8 kg·hm-2,减施磷肥35.1 kg·hm-2;旱作区过量施氮农户高达63%,氮、磷、钾肥减施潜力分别为12.8%、55.6%和43.2%;麦玉区小麦整体产量高于其他麦区,施肥量整体也较高,低产农户氮、磷、钾肥减施潜力分别为43.6%、46.3%和57.3%,高产农户平均应增施氮肥70.5 kg·hm-2;稻麦区过量施钾问题最为严重,减钾潜力为56.0%,氮磷肥过量施用问题主要集中在中低产农田。农户应根据具体田块常年产量确定适宜的施肥量。(责任编辑 李云霞)
参考文献 原文顺序
文献年度倒序
文中引用次数倒序
被引期刊影响因子
DOI:10.11674/zwyf.2006.0501URL [本文引用: 1]

本文根据相关文献资料,综述了化肥在保障我国粮食安全中的作用与贡献,分析和预测了实现2010、2015、2020年粮食总产目标所需新增化肥的数量。根据近6年来我国粮食生产中出现的问题,指出要保障我国粮食安全,除了继续发展化肥工业,增加化肥用量之外,国家应采取其他相应措施,包括稳定粮食作物的种植面积(至少应维持在11000万公顷水平);调整粮食价格,保护农民种粮积极性;改善农田基本生产条件,推行节水灌溉技术,促进粮食均衡增产;适度提高粮食净进口份额等等。单纯依靠增加化肥的投入,实现国内粮食供需平衡,不仅代价太大(包括资源、环境和成本代价),市场和农民也不一定能够接受。
DOI:10.11674/zwyf.2006.0501URL [本文引用: 1]
本文根据相关文献资料,综述了化肥在保障我国粮食安全中的作用与贡献,分析和预测了实现2010、2015、2020年粮食总产目标所需新增化肥的数量。根据近6年来我国粮食生产中出现的问题,指出要保障我国粮食安全,除了继续发展化肥工业,增加化肥用量之外,国家应采取其他相应措施,包括稳定粮食作物的种植面积(至少应维持在11000万公顷水平);调整粮食价格,保护农民种粮积极性;改善农田基本生产条件,推行节水灌溉技术,促进粮食均衡增产;适度提高粮食净进口份额等等。单纯依靠增加化肥的投入,实现国内粮食供需平衡,不仅代价太大(包括资源、环境和成本代价),市场和农民也不一定能够接受。
DOI:10.1038/ngeo325URL [本文引用: 1]
URL [本文引用: 3]
DOI:10.1038/nature19368URL [本文引用: 1]
URL [本文引用: 1]
对陕西省3个不同生态区、17个市、县的1500多位农户近年来粮食作物产量、肥料施用量及施肥时期进行了现状调查,同时在5个示范村示范和推广了小麦、玉米和水稻平衡施肥技术。结果表明,粮食作物生产中氮肥用量和变幅都很大,一季作物氮施用量范围为106-636 kg·ha-1;与试验结果和推荐量比较,过量施氮在陕北川道地灌溉玉米为128 kg·ha-1,陕南水稻21 kg·ha-1、关中小麦55 kg·ha-1、玉米56 kg·ha-1。按照这个结果陕西省每年可能损失的化肥氮为1 2.2万t。因此,平衡施肥在陕北和关
URL [本文引用: 1]
对陕西省3个不同生态区、17个市、县的1500多位农户近年来粮食作物产量、肥料施用量及施肥时期进行了现状调查,同时在5个示范村示范和推广了小麦、玉米和水稻平衡施肥技术。结果表明,粮食作物生产中氮肥用量和变幅都很大,一季作物氮施用量范围为106-636 kg·ha-1;与试验结果和推荐量比较,过量施氮在陕北川道地灌溉玉米为128 kg·ha-1,陕南水稻21 kg·ha-1、关中小麦55 kg·ha-1、玉米56 kg·ha-1。按照这个结果陕西省每年可能损失的化肥氮为1 2.2万t。因此,平衡施肥在陕北和关
URL [本文引用: 1]
How to increase fertilizer use efficiency (FUE)and decrease environment pollution caused by nutrient losses has been concerned by the whole world for a long time. It is very important to increase FUE in China for its low FUE and serious losses of nutrient. The recent advances of the technologies to increase FUE are reviewed in this article, which include applying site-specific nitrogen management and real-time nitrogen management to fertilizer management, development of new style slowly release and controlled release fertilizer to control nutrient release,technology of site specific nutrient management and using urease inhibitor or nitrification inhibitor to decrease nitrogen losses. And some technologies to increase FUE are previewed in the future.
DOI:10.11674/zwyf.2013.0409URL [本文引用: 1]
为明确我国西北旱地小麦施肥现状,在西北旱地冬小麦典型种植区选取3个区/县连续4年进行农户养分投入调查。调查结果分析表明, 调查区域小麦产量低而不稳;氮肥投入农户31.7%适中、 21.0%偏高、 41.9%很高、 1.7%偏低、 3.7%很低;10.6%的农户磷肥投入量适中,偏低和很低的分别占41.7%和9.6%,偏高和很高的占28.3%和9.8%;钾肥投入量适中的农户占1.5%,偏低的2.1%,很低的88.3%,偏高的2.9%,很高的5.2%。氮、 磷、 钾肥的偏生产力(PFP)分别为21.7、 36.2和88.9 kg/kg。在肥料投入总量中有机肥分别占氮肥总量的3.1%,磷肥总量的2.3%,钾肥总量的53.8%。作基肥投入的氮肥占96.2%,磷肥占100%,钾肥占100%。显然,氮肥施用过量,磷肥偏多和不足并存,钾肥重视不足, 化肥偏多、 有机肥偏少, 基肥偏多、 追肥偏少问题是目前西北旱地小麦养分投入中存在的主要问题。
DOI:10.11674/zwyf.14243URL [本文引用: 4]
【目的】明确陕西省小麦施肥现状,对陕西省小麦养分资源管理进行科学指导。【方法】选取2个小麦主产区一年一熟区渭北旱塬和一年两熟区关中平原连续5年进行农户施肥调查。【结果】渭北旱塬小麦产量由于年季间降水不均表现出低而不稳的趋势,年均产量3473 kg/hm2; 关中平原由于补灌小麦产量年季间波动较小,年均5882 kg/hm2。渭北和关中绝大多数农户施氮过量,渭北20.2%农户施氮偏高,43.5%很高,施氮合理的仅占29.7%,偏低的占4.6%,很低的仅有2.0%,氮肥平均用量为N 197.6 kg/hm2; 关中20.3%农户施氮偏高,37.5%很高,施氮合理的仅占17.5%,偏低的占14.2%,很低的仅有10.5%,平均施氮量为N 199.2 kg/hm2。陕西省农户磷肥投入总量基本合理,但投入偏低和偏高并存,渭北磷肥平均投入量适中的农户占12.0%,偏低的占41.5%,很低的10.7%,偏高的26.7%,很高的9.2%,磷肥投入平均P2O5123.4 kg/hm2; 关中磷肥平均投入量适中的农户占14.3%,偏低的占27.2%,很低的13.8%,偏高的31.0%,很高的13.7%,平均为P2O5 141.6 kg/hm2。渭北旱塬小麦钾投入平均K2O 32.9 kg/hm2,关中平原为K2O 37.3 kg/hm2,渭北和关中超过90%农户钾肥投入不足。陕西省冬小麦养分投入以基施为主,追施为辅,渭北和关中冬小麦氮素平均基施量为N 189.9和185.4 kg/hm2,占氮素总投入的96.1%和93.1%,追施量N 7.7和13.8 kg/hm2,仅占3.9%和6.9%。陕西省冬小麦氮磷养分投入以化肥为主,有机肥为辅,渭北和关中有机肥投入的氮素平均仅有N 4.7和3.1 kg/hm2,仅占全部氮素投入的2.4%和1.6%,P2O5平均2.4和1.7 kg/hm2,占1.9%和1.2%,而化肥投入的氮、 磷相对较大,渭北和关中氮素平均N 192.9和196.0 kg/hm2,P2O5平均120.8和139.9 kg/hm2来自化肥。渭北N、 P2O5 和 K2O平均PFP(化肥偏生产力)分别为20.0 kg/kg、 33.3 kg/kg和83.5 kg/kg; 关中PFP分别为36.8 kg/kg、 53.9 kg/kg和131.8 kg/kg。陕西省渭北旱塬冬小麦基肥中尿素和碳铵是农户较为喜欢的氮肥品种,平均有55.7%和47.2%的农户选用; 而关中农户较为喜欢的氮肥品种为尿素,有42.8%农户选用。普钙是渭北农户较为喜欢的磷肥品种,平均有50.2%的农户施用; 而关中农户较为喜欢的磷肥品种为磷酸二铵,有40.2%的农户施用。复合肥施肥面积逐年增加,渭北和关中平均有30.8%和40.2%的农户施用。有机肥施肥农户较少且在逐年下降,渭北和关中由2008~2009年的10.0%和11.7%减少到2012~2013年的0.8%和0.8%。【结论】陕西省农户小麦施肥存在氮肥过量,磷肥施用过量和不足并存,钾肥重视不足,有机肥投入偏少,追肥偏少等问题。
DOI:10.2134/jeq2013.05.0173URLPMID:24216346 [本文引用: 1]
Managing agricultural nutrients to provide a safe and secure food supply while protecting the environment remains one of the great challenges for the 21st century. The fourth International Nutrient Management Symposium (INMS), held in 2011 at the University of Delaware, addressed these issues via presentations, panel sessions, and field tours focused on latest technologies and policies available to increase nutrient use efficiency. Participants from the United States, Europe, Canada, and China discussed global trends and challenges, balancing food security and the environment in countries with struggling and emerging economics, nutrient management and transport at the catchment scale, new technologies for managing fertilizer and manure nutrients, and adaptive nutrient management practices for farm to watershed scales. A particular area of interest at the fourth INMS was nutrient management progress and challenges in China over the past 40 years. China's food security challenges and rapidly growing economy have led to major advances in agricultural production systems but also created severe nutrient pollution problems. This special collection of papers from the fourth INMS gives an overview of the remarkable progress China has made in nutrient management and highlights major challenges and changes in agri-environmental policies and practices needed today. Lessons learned in China are of value to both developing and developed countries facing the common task of providing adequate food for an expanding world population, while protecting air and water quality and restoring damaged ecosystems.
DOI:10.1038/nature13609URL [本文引用: 1]
Agriculture faces great challenges to ensure global food security by increasing yields while reducing environmental costs(1,2). Here we address this challenge by conducting a total of 153 site-year field experiments covering the main agro-ecological areas for rice, wheat and maize production in China. A set of integrated soil-crop system management practices based on a modern understanding of crop ecophysiology and soil biogeochemistry increases average yields for rice, wheat and maize from 7.2 million grams per hectare (Mg ha(-1)), 7.2 Mg ha(-1) and 10.5 Mg ha(-1) to 8.5 Mg ha(-1), 8.9 Mg ha(-1) and 14.2 Mg ha(-1), respectively, without any increase in nitrogen fertilizer. Model simulation and life-cycle assessment(3) show that reactive nitrogen losses and greenhouse gas emissions are reduced substantially by integrated soil-crop system management. If farmers in China could achieve average grain yields equivalent to 80% of this treatment by 2030, over the same planting area as in 2012, total production of rice, wheat and maize in China would be more than enough to meet the demand for direct human consumption and a substantially increased demand for animal feed, while decreasing the environmental costs of intensive agriculture.
DOI:10.7668/hbnxb.2008.S1.053URL [本文引用: 1]
Aiming to the status which grain yield of wheat wasn??t increase by increasing fertilizer and water quantity,a farmers fertilization inquiry coupled with soil and grain yield analysis was conducted to analyze the central factors influencing grain yield of wheat in Huimin county, Shandong province. The results showed that, the farmer applied about 424kg/ ha N, 226 kg/ ha P2O5 and 88 kg/ ha K2O included organic fertilizer to wheat in invest igated sites, and the amount of N and P fertilizer applied was more than crop N and P uptake. Significant farmer-to-farmer differences in fertilizer ratewere found. Under farmers fert ilization and soil fertility condit ion, grain yield of wheat had close relation with soil organicmatter and spike number per acreage, weak relation with soil Olsen-P and seed number per spike and no relationwith soil exchanged K and weight per thousand seeds. Added increment of fertilizer didn??t increase grain yield of wheat with the farmers fertilization practice because of high N and P fertilizer applied and high soil exchanged K content.
DOI:10.1038/nature15743URLPMID:26595273 [本文引用: 1]
Improvements in nitrogen use efficiency in crop production are critical for addressing the triple challenges of food security, environmental degradation and climate change. Such improvements are conditional not only on technological innovation, but also on socio-economic factors that are at present poorly understood. Here we examine historical patterns of agricultural nitrogen-use efficiency and find a broad range of national approaches to agricultural development and related pollution. We analyse examples of nitrogen use and propose targets, by geographic region and crop type, to meet the 2050 global food demand projected by the Food and Agriculture Organization while also meeting the Sustainable Development Goals pertaining to agriculture recently adopted by the United Nations General Assembly. Furthermore, we discuss socio-economic policies and technological innovations that may help achieve them.
DOI:10.1016/j.njas.2011.09.004URL [本文引用: 1]
URL [本文引用: 1]
【Objective】 An experiment was carried out to study the effects of fertilization on wheat yield increase and nutrient efficiency in different agro-ecological regions of China and further to explore approaches of increasing wheat yield and improving fertilizer nutrient efficiency. 【Method】 The indexes, such as partial factor productivity (PFP) and agronomic efficiency (AE), were calculated based on the field experimental data from National Program of Soil-Testing and Fertilizer Recommendation of China, and the historical changes of the wheat yield increase from fertilization and nutrient efficiencies were analyzed in different agro-ecological regions of China.【Result】 The results showed that there were significant differences of applied fertilizer rate in different regions. The highest value was 383 kg•hm-2 in Huanghuaihai Plain and the lowest value was 233 kg•hm-2 in Northern Plateau. Yield increasing results from fertilization in Northwest and Middle and Lower Reaches of the Yangtze River were higher than that in Northern Plateau and Huanghuaihai Plain. The highest value of partial factor productivity (PFP) was 23.9 kg•kg-1 in Northwest and the lowest value of PFP was 17.4 kg•kg-1 in Huanghuaihai Plain. The highest value of agronomic efficiency (AE) was 9.7 kg•kg-1 in Northwest, and the lowest value was 4.2 kg•kg-1 in Huanghuaihai Plain. Compared with 1980s, AEN in Middle and Lower Reaches of the Yangtze River and Northwest increased by 21.0% and 5.68%, respectively, while that in Huanghuaihai Plain and Northern Plateau decreased by 46.0% and 12.4%. respectively. Meantime, AEP in Northern plateau and Northwest increased by 13.7% and 10.4%, respectively, while that in Huanghuaihai Plain and Middle and Lower Reaches of the Yangtze River decreased by 38.6% and 6.24%, respectively. 【Conclusion】 There were clearly increasing in amount of applied fertilizer of wheat in different regions and the difference was remarkable. The wheat yield increases from fertilization were still significant, and the effects were different among various regions. The regions with low level fertilizer rate was not always the area with the high level nutrient efficiency. It is a very effective approach to optimize fertilization and improve the fertilizer use efficiency for yield increase of wheat in the future.
[本文引用: 2]
[本文引用: 2]
[D].
[本文引用: 2]
[D].
[本文引用: 2]
[D].
[本文引用: 1]
[D].
[本文引用: 1]
DOI:10.1073/pnas.0813417106URLPMID:19223587 [本文引用: 2]
Excessive N fertilization in intensive agricultural areas of China has resulted in serious environmental problems because of atmospheric, soil, and water enrichment with reactive N of agricultural origin. This study examines grain yields and N loss pathways using a synthetic approach in 2 of the most intensive double-cropping systems in China: waterlogged rice/upland wheat in the Taihu region of east China versus irrigated wheat/rainfed maize on the North China Plain. When compared with knowledge-based optimum N fertilization with 30-60% N savings, we found that current agricultural N practices with 550-600 kg of N per hectare fertilizer annually do not significantly increase crop yields but do lead to about 2 times larger N losses to the environment. The higher N loss rates and lower N retention rates indicate little utilization of residual N by the succeeding crop in rice/wheat systems in comparison with wheat/maize systems. Periodic waterlogging of upland systems caused large N losses by denitrification in the Taihu region. Calcareous soils and concentrated summer rainfall resulted in ammonia volatilization (19% for wheat and 24% for maize) and nitrate leaching being the main N loss pathways in wheat/maize systems. More than 2-fold increases in atmospheric deposition and irrigation water N reflect heavy air and water pollution and these have become important N sources to agricultural ecosystems. A better N balance can be achieved without sacrificing crop yields but significantly reducing environmental risk by adopting optimum N fertilization techniques, controlling the primary N loss pathways, and improving the performance of the agricultural Extension Service.
[本文引用: 1]
[本文引用: 1]
DOI:10.3864/j.issn.0578-1752.2018.14.012URL [本文引用: 1]
【Objective】 Nitrogen (N) demand and saving potential under recommendation fertilization for the wheat and maize in Henan province were estimated to provide the basis for the policy of zero growth of chemical fertilizer in China.【Method】Based on the statistical data and the field trials, this paper studied the production and N consumption, estimated the N demand and furthermore the saving potential for the wheat and maize production of the whole province under the rational N fertilizer rate according to methods of fertilizer response mode, aboveground N accumulation and N requirements per 1000 kg grain yield.【Result】The N consumption for wheat and maize in Henan province was increased continuously, with the single N fertilizer consumption declining while the N fertilizer in compound and mixed fertilizer increasing. In 2015, the total N consumption for wheat and maize in the total province were 133.0×10⁴ t and 60.9×10⁴ t, respectively. The aboveground N accumulation for wheat and maize were averagely 209.4 and 183.7 kg·hm-2, respectively, and N requirement per 1 000 kg grain were 29.1 and 23.0 kg, respectively. The regional mean optimal N fertilizer rate for wheat and maize were 171.0 and 202.5 kg·hm-2 under the highest yield while 155.1 and 172.8 kg·hm-2 under the highest economic profit, respectively. The N demand for wheat was 57.8×10⁴-67.7×10⁴ t, with N saving potential of 21.8×10⁴-48.8×10⁴ t or 16.4%-36.7% in Henan province; while the N demand for maize was 42.7×10⁴-67.7×10⁴ t, with the highest N saving potential 18.2×10⁴ t or 30.0%. 【Conclusion】The N consumption and demand for wheat and maize in Henan province were increased continuously, however, the actual N consumption exceeded the demand, representing a great potential for fertilizer saving under rational N fertilization in further.
DOI:10.3864/j.issn.0578-1752.2019.12.007URL [本文引用: 1]
【Objective】Heilongjiang has a paddy field of more than 3.2 million hectares, it is the largest province in China with rice fields. In the past ten years, rice production in Heilongjiang Province has been hovering at 7 000 kg·hm -2, while it was the province with the lowest amount of fertilizer in paddy fields in China. Under the background of “fertilizer zero increase”, whether is there potential for fertilizer saving in Heilongjiang Province remains to be studied. 【Method】We investigated paddy field fertilization across different farms in the main rice producing areas in Heilongjiang Province. In 2005, the survey areas were Wuchang, Fangzheng, Mulan, Ning'an, Qing'an, Tieli, Shangzhi and Acheng; in 2008, the survey areas were Mishan, Hulin, Qing'an, Wuchang, Ning'an, Fangzheng, Luobei, Huachuan, Fujin and Shangzhi; the survey areas in 2015 were Wuchang, Fangzheng, Ning'an, Hulin and Qing'an. From each county, a random township was selected, and 2 or 3 villages were randomly selected from each township, then 10 households were surveyed in each village. From 2009 to 2010, more than 80,000 soil samples from the main rice producing areas in Heilongjiang Province were collected, and the phosphorus and potassium nutrient contents in 0-20 cm soil layer were determined. The nitrogen application rate was estimated through theoretical appreciate application rate method. Based on the crop nutrient demand and the soil nutrient status of the paddy field, phosphorus and potassium application rate was evaluated. Fertilizer reduction potential was analyzed in Heilongjiang Province.【Result】According to the research data, the average rice yields in 2005, 2008 and 2015 were 6 427, 7 593 and 7 142 kg·hm -2, respectively, and the average annual output was 7 104 kg·hm -2. The crop yield differed between farms with a range of nearly 5 000 kg·hm -2. The average amount of N, P2O5 and K2O in paddy fields were 141.0, 56.6 and 51.6 kg·hm -2, respectively, and the difference in the amount of NPK fertilizers was more than 300 kg·hm -2. Therefore, the results showed that fertilization variation among farmers was large, so the problem of blind fertilization was prominent. The content of available phosphorus and available potassium in the paddy soil of Heilongjiang Province were about 26 mg·kg -1 and 138 mg·kg -1, respectively. The variation of available phosphorus in soil exceeded 40%, and soil fertility varied greatly among different regions. High level phosphorus and potassium accounted for above 70% samples. To reach rice production levels of 7 500 kg·hm -2, the theoretical suitable nitrogen application rate was 105 kg·hm -2. Only 20% of farmers achieved high yield and high nitrogen efficiency, and 70% of the farmers had fertilizer-saving potential with nitrogen reduction of 26%. Through fertilizer saving, the grain produced per kilogram of nitrogen could be increased from 50 kg to 70 kg. According to the current yield and soil nutrient status, the appropriate amount of phosphate and potassium fertilizer in paddy fields was only 41.6 and 35.9 kg·hm -2, which could be reduced by about 30%. Among the surveyed households, farmers whose fields had the potential for phosphorus and potassium-saving accounted for 71% and 72% of the total, respectively, among which the low-yield and low-efficiency farmers accounted for 30% of the total farmers, where the fertilizer-saving potential was the largest.【Conclusion】Although Heilongjiang was the province with the lowest fertilization rate in China, about 70% of farmers were high-yield but low efficiency, or low-yield and low efficiency, so the problem of excessive fertilization was prominent, and the fertilizer-saving potential was more than 20% in Heilongjiang Province.
DOI:10.18402/resci.2016.04.20URL [本文引用: 1]
China is the largest fertilizer producer and consumer and its fertilizer consumption has exceeded 59.96 million tons,almost one third of the world's total volume. A critical task is to improve agricultural sustainable development while ensuring food security and reducing unreasonable fertilizer usage. Soil Testing and Fertilization Recommendation(STFR)is a scientific method that ensures food security and ecological security. Based on national STFR data for grain crops as a reasonable volume of fertilizer input,we systematically calculated the potential reduction of fertilizer input on three main grain crops,wheat,maize and rice. The results indicated that the total reduction amount of fertilizer input for wheat,maize and rice can be 8.141 million tons,accounting for 27.6% of the amount of total fertilizer use in three main crop production areas while grain productivity can meet current levels. The percentage of fertilizer reduction for wheat,rice and maize is 36.9%,28.1% and 16.7% respectively. Synthetic fertilizers are highly energy- and carbon-intensive products. The volume of carbon emissions was also assessed using China greenhouse gases emission factors. The result showed that 10.459million tons of carbon emissions could be reduced due to fertilizer input decreases using STFR. Huge potential in carbon emission reductions are concentrated mainly in major provinces of grain production located on the North China plain and Northeast plain. These results imply that policy-makers and government should widely spread STFR,establish a service center for STFR produce,increase the subsidy for using STFR,create new promotion methods,and establish a national STFR big-data platform.
DOI:10.1016/j.fcr.2013.02.015URL [本文引用: 2]
Estimating balanced nutrient requirement for wheat (Triticum aestivum L.) in China is essential to manage nutrient application more effectively for increasing crop yields and reducing risk of negative environmental impact. Datasets from 2000 to 2011 dealing with nitrogen (N), phosphoruS (P) and potassium (K) treatments across the winter and spring wheat growing regions in China were collected to assess the relationship between grain yield and nutrient uptake, and to estimate N, P and K optimal nutrient requirements for a target yield using the QUEFTS (Quantitative Evaluation of the Fertility of Tropical Soils) model. In the QUEFTS model, two boundary lines described the minimum and maximum internal efficiencies (IEs, kg grain per kg nutrient in above-ground plant dry matter) of N, P and K. The minimum and maximum IEs for wheat were 28.8 and 62.6 kg grain per kg N, 98.9 and 487.4 kg grain per kg P, and 23.0 and 112.9 kg grain per kg K. The QUEFTS model predicted a linear-parabolic-plateau curve for balanced nutrient uptake with target yield increasing. The linear part continued until the yield was approximately at 60-70% of the potential yield, and 22.8 kg N, 4.4 kg P and 19.0 kg K were required to produce 1000 kg grain. The corresponding N:P:K ratio was 5.18:1:4.32, and the corresponding IEs were 43.9, 227.0 and 52.7 kg grain per kg N, P and K, respectively. The QUEFTS model simulated balanced N, P and K removal by 1000 kg grain were 18.3, 3.6 and 3.5 kg, respectively, with a N:P:K ratio of 5.08:1:0.97. Approximately 80%, 82% and 18% of N, P and K in total above-ground plant material were presented in the grain and removed from the field. The relationship between grain yield and nutrient uptake was also estimated to suggest fertilizer application avoiding excess or deficient nutrient supply. Field experiment validation confirmed that the QUEFTS model could be used as a practical tool for the Nutrient Expert decision support system to make fertilizer recommendation. (C) 2013 Elsevier B.V.
DOI:10.3321/j.issn:1000-7091.1988.02.008URL [本文引用: 1]
A large number of soil fertility analysis and field trials were carried out in different regions of China.Results confirmed that soil nitrogen fertility in 20 tested soil types is low.The crop relative yield in N treatment is 69% in average,of which 65% accounts for"low nitrogen level",35% for"medium level",and none is"high"in nitrogen.Soil phosphorus fertility in these soils medium.The crop relative yield in-P treatment is 86.4% in average,of which 32% accounts for"high level"59% for"medium level",and 9% is"low"Soil potassium ferility in these soils is from medium to high.The crop relative yield in-K treatment 93.7% in average of which 41% accounts for"high level",56% for"medium level",and only 3% is"low".Soil fertility index for the 20 soil types have been worked out in accordance with soil test results and crop relative yields.
DOI:10.11674/zwyf.2009.0129URL [本文引用: 1]
以山东省冬小麦为例,对应用“3414”完全或部分实施试验结果建立磷、钾施肥技术指标体系的技术环节进行探讨,并就当前建立指标体系中遇到的问题进行解析。本研究以相对产量75%、90%和95%为标准将山东省土壤有效磷、速效钾划分为低、中、高和极高4级;并分别用三元二次、一元二次和线性加平台模型对不同土壤养分分级范围内施肥量与产量关系进行模拟,计算最佳肥料用量。结果表明,当山东省土壤有效磷、速效钾含量处于低等级(Olsen-P<10 mg/kg;NH4OAc-K<50 mg/kg)时,磷、钾肥(P2O5和K2O)用量分别应为100~130和120~150 kg/hm2;中等级(Olsen-P, 10~30 mg/kg; NH4OAc-K, 50~100 mg/kg)时,磷、钾肥用量为80~100和100~120 kg/hm2;高等级(Olsen-P, 30~50 mg/kg; NH4OAc-K, 100~140 mg/kg)时,磷、钾肥用量为60~80和60~80 kg/hm2;当土壤有效磷高于50 mg/kg,速效钾高于140 mg/kg 时,无需磷钾肥施用。
DOI:10.2134/agronj1973.00021962006500030026xURL [本文引用: 1]
[本文引用: 1]
[本文引用: 1]
[本文引用: 1]
[本文引用: 1]
[本文引用: 1]
[本文引用: 4]
[本文引用: 4]
DOI:10.3864/j.issn.0578-1752.2018.14.010URL [本文引用: 3]
【Objective】It is of great significance to clarify relationships of NPK requirement to farmers’ wheat grain yield for reasonable fertilization and decreasing fertilizer application rates.【Method】A 2 years long on-farm survey combined with sample collection and analysis related to wheat production were carried out in the Spring Wheat (SW), Dryland Wheat (DW), Wheat-Maize (WM), Rice-Wheat regions (RW) of China, to study the relationships of NPK requirement to wheat grain yield of farmers.【Result】The mean grain yield of wheat was observed to be 6.4 t·hm-2, and the differences were significant among the yield averages of different regions, with the grain yield average of 6.0, 4.0, 7.7, 5.5 t·hm-2 in SW, DW, WM and RW region, respectively. The high yield regions usually had higher above-ground biomass and spike numbers, and harvest indexes increased with grain yields. The average N requirement was 28.1 kg·Mg-1, with the average of 28.6, 28.3, 29.3 and 25.0 kg·Mg-1 in SW, DW, WM and RW region, respectively, and the N requirement average decreased significantly by16.9% and 16.4% in DW and WM, tending to decrease but being not significant in SW and RW regions, when the yield was increased from the very low to the very high levels. The average P requirement was 4.0 kg·Mg-1, with the average of 4.5, 3.2, 4.1 and 4.1 kg·Mg-1 in SW, DW, WM and RW region, respectively. P requirement average decreased significantly by 11.4% and 17.8% in WM and RW, decreased by 8.6% but not significantin DW region, when the yield was increased from the very low to the very high levels, and even though the lowest P requirement of 3.7 kg·Mg-1 occurred at the very low wheat yield level, it was still significantly decreased by 21.4%, when the yield was increased from the lower to the very high level. The average K requirement was 21.5 kg·Mg-1, with the average of 26.5, 17.1, 23.3 and 18.8 kg·Mg-1 respectively and significantly different in the four regions, and the K requirement average significantly decreased by 4.0%, 4.4%, 12.7% and 19.9% in SW, DW, WM and RW region, respectively, when the yield was increased from the very low to the very high levels, although the difference was only significant in the RW region. 【Conclusion】Wheat grain yield of farmers were significantly different among the main wheat production regions in China, relationships of NPK requirements to grain yields were also different with regions, and generally they tended to decrease with the grain yield increase. Therefore, fertilizer application recommendation should determine the reasonable nutrient requirement based on the yield levels, the crop nutrient requirement characteristics and the land soil nutrient supply capacities of farmers, in order to avoid over or insufficient fertilizer application in different regions of China.
DOI:10.3864/j.issn.0578-1752.2016.24.008URL [本文引用: 2]
【Objective】In drylands of northwestern China, we have a serious problem in winter wheat production such as huge amount of and widely distributed low-yielding fields and remarkable yield variations among land parcels of farmers, therefore, it is of great importance to explore the key factors affecting the yield for the purpose of closing the yield variations and increasing the average yield levels of winter wheat universally.【Method】A survey on 180 farmers’ fertilizer application in winter wheat production with the collection and analysis of their 0-100 cm deep soil samples in the corresponding fields was carried out in Shanxi, Shaanxi and Gansu provinces, the typical dryland wheat producing areas of the Loess Plateau in Northwest China, to study the relationship between the dryland wheat yield variations and cultivation, fertilization, as well as the main soil fertility factors.【Result】Observed winter wheat yields in the three provinces were in the ranges of 2 529-8 419, 1 344-8 073 and 2 984-7 145 kg·hm-2, respectively. Compared with traditional cultivation, the wheat yield under plastic film mulching cultivation increased by 9.4%. Under traditional cultivation, the average yield of the high-yielding farmer group was respectively 37.5% and 77.2% higher than that of the middle- and low-yielding groups, and the corresponding average yield differences were 25.4% and 66.2% under plastic film mulching cultivation. For fertilizer application, under traditional cultivation the average nitrogen (N) rate in the high-yielding group was respectively 44.4% and 74.4% higher than that in the middle- and low-yielding groups, and it was also 9.9% and 13.5% higher in the high-yielding group than that in the middle- and low-yielding groups under plastic film mulching cultivation. Average phosphorus (P) rate in the high-yielding group was 31.1% higher than the average rate of the middle- and low-yielding groups under traditional cultivation, and it was correspondingly 35.4% higher under plastic film mulching cultivation. Under traditional cultivation the average potassium (K) rate in the high-yielding group was 62.1% lower than that of the low-yielding group, but it was 96% higher in the high-yielding group than that of the low-yielding group under plastic film mulching cultivation. For soil fertility factors, no significant difference was observed in the organic matter content in 0-100 cm soil layers among yield levels in traditional cultivation, but it was 20.8% higher in 0-20 cm soil layers of the high-yielding group than that in low-yielding group under plastic film mulching cultivation. Significant differences were found in the soil total nitrogen in 40-80 cm depth under traditional cultivation, of which that in 40-60 cm soil depth was 7.5% and 18.6% higher in the high-yielding group than in the middle- and low-yielding groups, and under plastic film mulching cultivation, total N was significantly different in 0-60 cm soil layers, of which that in 0-20 cm soil layers was 3.2% and 14.2% higher in the high-yielding group than in the middle- and low-yielding groups, respectively. The mineral nitrogen showed no significant difference among yield groups under traditional cultivation, but that in 80-100 cm soil layers of the high-yielding group was 1.6 times higher than that of the low-yielding group under plastic film mulching cultivation. The available P in 0-40 cm soil layers was significantly different among yield groups in traditional cultivation, and that in the high-yielding group was 74.3% and 86.9% higher than that in the middle- and low-yielding group, respectively, but no significant difference was found in the available soil P under plastic film mulching cultivation. Under traditional cultivation, the available soil K in the high-yielding group was 37.5% and 77.2% higher than that in the middle- and low-yielding groups, respectively, and that was not significantly different among yield levels under plastic film mulching cultivation. Soil pH showed no significant difference at different yield levels and among cultivations.【Conclusion】Main causes for yield variation were found to be the differences in cultivation, fertilizer application rates, and soil fertility factors as soil organic matter content and available P level. Therefore, in northwest drylands, keys to narrow the farmers’ winter wheat yield variations and increase its levels are to strengthen the management of soil water and employ water retention cultivations, reasonably increase N and P fertilizer input, control K fertilizer use in the middle- and low-yielding fields under traditional cultivation, increase P and K fertilizer application apart from stabilization of N input in the middle- and low-yielding fields under plastic film mulching cultivation, strengthen organic fertilizer application to increases soil organic matter content, water holding capacity and nitrogen supply capacity, and meanwhile enhance soil available P supply capacity in the middle- and low-yielding fields especially under the traditional cultivation, in order to realize the purpose of promoting wheat growth and increasing their grain yield in drylands.
DOI:10.1016/j.fcr.2015.01.003URL [本文引用: 2]
[本文引用: 1]
[本文引用: 1]
[本文引用: 1]
[本文引用: 1]
DOI:10.2134/agronj2012.0232URL [本文引用: 1]
Overestimates of N requirements have led to excessive N application and serious environmental pollution in intensively managed agricultural systems. A database comprising 1395 measurements was developed from 2000 to 2011 using 88 on-farm and station experiments conducted in five key winter wheat (Triticum aestivum L.) domains in northern China. The database was created to evaluate the relationship between aboveground N uptake and grain yield with different N treatments and to quantify N requirements per Mg grain at different grain yield levels. Across all sites, wheat grain yield ranged from 1.6 to 11.8 Mg ha(-1). The nitrogen requirement per megagram grain yield (N-req.) increased with N supply from 20.8 kg under the treatment without N fertilizer to 25.7 kg under the excess N treatment. For the optimal N fertilizer treatment, the average N-req. was 24.3 kg and it declined with increasing grain yield. For the yield ranges between <4.5 and 6.0 to 7.5 Mg ha(-1), N-req, decreased from 27.1 to 24.5 kg due to increasing harvest index (HI; from 0.39-0.46) and decreasing grain N concentration (from 2.41 to 2.21%). For the yield ranges between 6.0 to 7.5 and 9.0 to 10.5 Mg ha(-1), N-req. decreased from 24.5 to 22.7 kg due to decreasing grain N concentration (from 2.21 to 2.00%). For the yield ranges between 9.0 to 10.5 and >10.5 Mg ha(-1), N-req. changed little due to stability in grain N concentrations and HI. In conclusion, the N requirement of a crop was affected by both the amount of N supplied and the grain yield.
[D].
[本文引用: 1]
[D].
[本文引用: 1]
DOI:10.2134/agronj15.0089URL [本文引用: 1]
DOI:10.1016/j.fcr.2016.04.001URL [本文引用: 1]
DOI:10.1093/jxb/ert023URLPMID:23382547 [本文引用: 1]
The adaptations of root morphology, physiology, and biochemistry to phosphorus supply have been characterized intensively. However, characterizing these adaptations at molecular level is largely neglected under field conditions. Here, two consecutive field experiments were carried out to investigate the agronomic traits and root traits of wheat (Triticum aestivum L.) at six P-fertilizer rates. Root samples were collected at flowering to investigate root dry weight, root length density, arbusular-mycorrhizal colonization rate, acid phosphatase activity in rhizosphere soil, and expression levels of genes encoding phosphate transporter, phosphatase, ribonucleases, and expansin. These root traits exhibited inducible, inhibitory, or combined responses to P deficiency, and the change point for responses to P supply was at or near the optimal P supply for maximum grain yield. This research improves the understanding of mechanisms of plant adaptation to soil P in intensive agriculture and provides useful information for optimizing P management based on the interactions between soil P dynamics and root processes.
DOI:10.3864/j.issn.0578-1752.2013.15.010URL [本文引用: 1]
【Objective】Nitrogen is essential to human life, environment quality and ecosystem sustainability; Chemical fertilizer is becoming a dominant source of human’s nitrogen supply, therefore, its role and development strategy are core issues for China’s sustainability. 【Method】This study analyzed the sources of nitrogen in ecosystem, its contribution to crop production and protein production, and nitrogen balance through food chain model. Finally, This study drafted a strategy for nitrogen fertilizer development from fertilizer production to field consumption. 【Result】After half a century development, China’s nitrogen fertilizer production and consumption have both ranked the first in the world since 1991, and in the past two decades (1990-2009) 61% of the world’s increase of nitrogen production and 52% of the world’s increase of nitrogen consumption occurred in China. Results of this study show that 72% of nitrogen in terrestrial ecosystem, and about 56% of human protein consumption come from nitrogen fertilizer. According to its role in crop yield improvement, a kilogram of nitrogen fertilizer is equivalent to 0.016 hm2 cultivated land, and per capita cultivated land area increased by 6.5-fold through technologies innovation including N fertilizer between 1960 and 2009. This is why China survived 20% of world’s population by using 10% of world’s land and 21% of world’s irrigated area. Currently, China’s nitrogen fertilizer production exceeds its consumption, and nitrogen fertilizer application rate exceeds crop demand for maximum yield. The nitrogen surplus in agro-ecosystem is more than 175 kg•hm-2, which has been a main factor of environmental pollution. 【Conclusion】Therefore, nitrogen fertilizer management has to be transformed from solely high yield to both high yield and high resources use efficiency. The strategy is to balance nitrogen input and output in crop land, to update fertilizer products, to improve energy use efficiency in fertilizer production.
[D].
[本文引用: 2]
[D].
[本文引用: 2]
DOI:10.11674/zwyf.2006.0301URL [本文引用: 1]
通过田间试验研究了华北地区冬小麦/夏玉米轮作体系对氮素的环境承受力。结果表明,冬小麦和夏玉米达到最高产量时的施氮量分别是112和180.kg/hm2。氮肥利用率和农学利用率随施氮量的增加而降低,生理利用率表现出抛物线的趋势。在农户习惯施氮条件下,冬小麦和夏玉米的氮肥利用率分别是10%和6%,每千克氮肥分别增产2和3千克。灌水和集中降雨是引起土壤硝态氮明显下移的主要因素。氮素平衡计算的结果表明,低施氮量时,氮素盈余以残留Nmin为主,高量施氮则以表观损失为主。将收获后0—90.cm土壤中的硝态氮的量控制到150kg/hm2,可以在兼顾环境的前提下获得较高的产量;此时冬小麦季的施氮量是122.kg/hm2,产量(干物重)达到最高产量4331.kg/hm2;夏玉米季的施氮量是145.kg/hm2,产量(干物重)是7965.kg/hm2,达到最高产量的97%。
URLPMID:18163302 [本文引用: 1]
A field experiment with 12-level N fertilization in winter wheat growth season and zero-N in summer maize growth season was conducted to study the appropriate soil nitrate N content for a winter wheat/summer maize rotation system in North China Plain. The results showed that when the soil mineral N content before sowing was higher, a split application of 150 kg N x hm(-2) in winter wheat growth season could meet the N demand of both winter wheat and summer maize in the rotation system. The N use efficiency of winter wheat in different N treatments was only from 11% to 23%, while the residual N use efficiency of summer maize ranged from 30% to 52%. When the nitrate N content in top 90 cm soil layer before maize sowing was up to 82 and 151 kg x hm(-2), respectively, the N demand of summer maize at its ten-leaf stage and in its whole growth season could be met with no N application. However, when the nitrate N content in top 90 cm soil layer was less than 46 and 65 kg x hm(-2) at maize ten-leaf stage and after harvest, respectively, no N application could impact maize growth, and decrease its grain yield. With the maize yield and environmental protection considered comprehensively, the nitrate N content in top 90 cm soil layer should be maintained at an appropriate level from 65 to 151 kg x hm(-2) during maize growth season.
[本文引用: 1]
DOI:10.1016/j.eja.2005.12.001URL [本文引用: 1]
Abstract
From all plant nutrients N fertilizer rates deserve highest attention as too high rates may result in nitrate leaching, volatilisation of N2O (greenhouse gas) and affect the farmers’ profit. Too low rates will also depress the profit. The problem is accentuated by the fact that crops not only feed from soil inorganic but also from organic soil N. Most soil N tests do not consider the available organic soil N. The Electro-Ultra-Filtration (EUF) method applied by us takes into account the EUF extractable inorganic and organic soil N for calculating the N fertilizer rate. This method developed at the Liebig University Giessen is called Giessen model (sampling in autumn out of the upper soil layer, 0–30 cm). We compared it with the standard soil N test the “Nmin method” recommended by German officials which method does not consider the available organic soil N (sampling in spring out of three or two soil layers, depending on soil depth). The investigation was carried out on farmers’ fields on five different sites with winter cereals (wheat, barley) in 1989/1990, 1990/1991 and 1991/1992. Recommended fertilizer application rates differed somewhat for both methods. Of the 23 cases, significantly higher grain yields were obtained five times by Nmin and four times by EUF; otherwise grain yields did not differ significantly between both methods. Grain yield and crude protein concentration were increased by fertilizer N compared with the plots without N fertilizer. On the site Giessen, however, there were some cases in which the N fertilizer did not increase grain yield. The soil of the Giessen site was rich in interlayer NH4+ which is not recovered by the EUF and Nmin method, but which obviously contributed to the N supply of the crop, and therefore the N rates were too high. Grain crude protein concentration were higher with Nmin for Wernborn and Bruchkobel sites because of higher N fertilizer rates. For the Giessen site in 1989/1990 the reverse was true. Nitrogen agronomic efficiency (AE) ranged from 0 to 35.6. Apparent N recovery (ANR) ranged from 0 to 111. The gross profit differed from −88 to 489 Euro/ha. Negative values (three cases out of 23) were found on the Giessen site where no yield increase was obtained by the N fertilizer because of interlayer NH4+. This interpretation is supported by the finding that interlayer NH4+ significantly decreased from autumn to spring. Apart from the results found in 1 year on the Giessen site, the gross profit calculation showed that a precise N fertilizer application based on soil analysis yields a high profitability of cereal production.DOI:10.3864/j.issn.0578-1752.2017.14.012URL [本文引用: 4]
【Objective】It is of great significance to clarify the farmers’ nutrient input situation for the realization of stable yield, high yield, and high nutrient use efficiency in dryland wheat production.【Method】A 5-yr long farm survey of 1 261 farmers was carried out to analyze and evaluate their fertilizer applications and the fertilizer reduction potential in Weibei dryland, based on the nutrient requirement determined by the corresponding wheat grain yields and sustainable development of dryland wheat production.【Result】Obtained results showed the farmers’ wheat yields ranged from 750 to 9 000 kg hm-2, with the average of 4 243 kg·hm-2, and they were allocated into five groups as: very low (<2 640 kg·hm-2), low (2 640-3 780 kg·hm-2), moderate (3 780-4 920 kg·hm-2), high (4 920-6 060 kg·hm-2) and very high (>6 060 kg·hm-2), respectively, accounting for 22.0%, 22.2%, 19.3%, 22.8% and 13.6% of the total. Farmers’ nitrogen (N) application rates ranged from 33 to 454 kg N·hm-2 with an average of 188 kg N·hm-2, phosphorus (P) ranged from 0 to 435 kg P2O5·hm-2 with an average of 125 kg P2O5·hm-2, and potassium ranged from 0 to 201 kg K2O·hm-2 with an average of 19 kg K2O·hm-2. However, farmers’ yields showed no significant correlations with the N, P, and K rates, respectively. With the increase of grain yield levels, the proportion of N over application farmers decreased from 97.8% in the very low yield group to 18.0% in very high group, but that of N deficient application farmers increased from 0.7% to 45.9%, correspondingly. Similar to N, the proportion of P over application farmers decreased from 99.3% in very low yield group to 70.9% in very high yield group, and this means P over application was practiced by more than 70.0% of farmers in each yield group. Different from N and P, K deficient application was practiced by more than 60.0% of farmers in each yield group. Therefore, for N, farmers in very low and low yield groups were recommended to reduce 24-144 kg N·hm-2, 28%-73% from their high or very high N application rates, and farmers in moderate, high and very high yield groups were recommended to reduce 50-181 kg N·hm-2, 26%-51% of their high or very high N rates and add 38-134 kg N·hm-2, 41%-345% more to the low or very low N rates. For P, farmers in different yield groups should reduce 7-31 kg P2O5·hm-2, 23%-33% from the high P rates, and reduce 85-118 kg P2O5·hm-2, 61%-85% from the very high P rates. For K, farmers with no or very low K input in different yield groups were suggested to use 13-50 kg K2O·hm-2, and add 7-18 kg K2O·hm-2, 35%-78% for those with low K rates. 【Conclusion】 Compared with the conventional method, which adopted an uniform fertilization rate as the criterion to evaluate the famers’ fertilizer application with variable yields, the present work proposed a yield based approach. This approach is proved to be suitable for the small scale household farming in China, and enable to objectively and accurately understand the arbitrary and over application of fertilizer, and to provide a scientific basis for the effective regulation of farmers’ fertilizer application.
DOI:10.3864/j.issn.0578-1752.2017.14.012URL [本文引用: 4]
【Objective】It is of great significance to clarify the farmers’ nutrient input situation for the realization of stable yield, high yield, and high nutrient use efficiency in dryland wheat production.【Method】A 5-yr long farm survey of 1 261 farmers was carried out to analyze and evaluate their fertilizer applications and the fertilizer reduction potential in Weibei dryland, based on the nutrient requirement determined by the corresponding wheat grain yields and sustainable development of dryland wheat production.【Result】Obtained results showed the farmers’ wheat yields ranged from 750 to 9 000 kg hm-2, with the average of 4 243 kg·hm-2, and they were allocated into five groups as: very low (<2 640 kg·hm-2), low (2 640-3 780 kg·hm-2), moderate (3 780-4 920 kg·hm-2), high (4 920-6 060 kg·hm-2) and very high (>6 060 kg·hm-2), respectively, accounting for 22.0%, 22.2%, 19.3%, 22.8% and 13.6% of the total. Farmers’ nitrogen (N) application rates ranged from 33 to 454 kg N·hm-2 with an average of 188 kg N·hm-2, phosphorus (P) ranged from 0 to 435 kg P2O5·hm-2 with an average of 125 kg P2O5·hm-2, and potassium ranged from 0 to 201 kg K2O·hm-2 with an average of 19 kg K2O·hm-2. However, farmers’ yields showed no significant correlations with the N, P, and K rates, respectively. With the increase of grain yield levels, the proportion of N over application farmers decreased from 97.8% in the very low yield group to 18.0% in very high group, but that of N deficient application farmers increased from 0.7% to 45.9%, correspondingly. Similar to N, the proportion of P over application farmers decreased from 99.3% in very low yield group to 70.9% in very high yield group, and this means P over application was practiced by more than 70.0% of farmers in each yield group. Different from N and P, K deficient application was practiced by more than 60.0% of farmers in each yield group. Therefore, for N, farmers in very low and low yield groups were recommended to reduce 24-144 kg N·hm-2, 28%-73% from their high or very high N application rates, and farmers in moderate, high and very high yield groups were recommended to reduce 50-181 kg N·hm-2, 26%-51% of their high or very high N rates and add 38-134 kg N·hm-2, 41%-345% more to the low or very low N rates. For P, farmers in different yield groups should reduce 7-31 kg P2O5·hm-2, 23%-33% from the high P rates, and reduce 85-118 kg P2O5·hm-2, 61%-85% from the very high P rates. For K, farmers with no or very low K input in different yield groups were suggested to use 13-50 kg K2O·hm-2, and add 7-18 kg K2O·hm-2, 35%-78% for those with low K rates. 【Conclusion】 Compared with the conventional method, which adopted an uniform fertilization rate as the criterion to evaluate the famers’ fertilizer application with variable yields, the present work proposed a yield based approach. This approach is proved to be suitable for the small scale household farming in China, and enable to objectively and accurately understand the arbitrary and over application of fertilizer, and to provide a scientific basis for the effective regulation of farmers’ fertilizer application.
DOI:10.2134/agronj1992.00021962008400050017xURL [本文引用: 1]
[本文引用: 1]
[本文引用: 1]
DOI:10.1007/s11104-009-9919-yURL [本文引用: 1]
DOI:10.1007/s11104-013-1696-yURL [本文引用: 1]
Sufficient soil phosphorus (P) is important for achieving optimal crop production, but excessive soil P levels may create a risk of P losses and associated eutrophication of surface waters. The aim of this study was to determine critical soil P levels for achieving optimal crop yields and minimal P losses in common soil types and dominant cropping systems in China.
Four long-term experiment sites were selected in China. The critical level of soil Olsen-P for crop yield was determined using the linear-plateau model. The relationships between the soil total P, Olsen-P and CaCl2-P were evaluated using two-segment linear model to determine the soil P fertility rate and leaching change-point.
The critical levels of soil Olsen-P for optimal crop yield ranged from 10.9 mg kg(-1) to 21.4 mg kg(-1), above which crop yield response less to the increasing of soil Olsen-P. The P leaching change-points of Olsen-P ranged from 39.9 mg kg(-1) to 90.2 mg kg(-1), above which soil CaCl2-P greatly increasing with increasing soil Olsen-P. Similar change-point was found between soil total P and Olsen-P. Overall, the change-point ranged from 4.6 mg kg(-1) to 71.8 mg kg(-1) among all the four sites. These change-points were highly affected by crop specie, soil type, pH and soil organic matter content.
The three response curves could be used to access the soil Olsen-P status for crop yield, soil P fertility rate and soil P leaching risk for a sustainable soil P management in field.
[本文引用: 2]
[本文引用: 3]
[本文引用: 3]
DOI:10.1007/s00271-008-0131-2URL [本文引用: 2]
Food production and water use are closely linked processes and, as competition for water intensifies, water must be used more efficiently in food production worldwide. A field experiment with wither wheat (TriticumAestivum L.), involving six irrigation treatments (from rain-fed to 5 irrigation applications), was maintained in the North China Plain (NCP) for 6years. The results revealed that dry matter production, grain yield and water use efficiency (WUE) were each curvilinearly related to evapotranspiration (ET). Maximum dry matter at maturity was achieved by irrigating to 94% and maximum grain yield to 84% of seasonal full ET. A positive relationship was found between harvest index (HI) and dry matter mobilization efficiency (DMME) during grain filling. Moderate water deficit during grain filling increased mobilization of assimilate stored in vegetative tissues to grains, resulting in greater grain yield and WUE. Generally, high WUE corresponded with low ET, being highest at about half potential ET. At this location in NCP, highest WUE and grain yield was obtained at seasonal water consumption in the range 250–420mm. For that, with average seasonal rainfall of 132mm, irrigation requirements was in the range of 120–300mm and due to the deep root system of winter wheat and high water-holding capacity of the soil profile, soil moisture depletion of 100–150mm constituted the greater part of the ET under limited water supply. The results reveal that WUE was maximized when around 35% ET was obtained from soil moisture depletion. For that, seasonal irrigation was around 60–140mm in an average season.
DOI:10.3864/j.issn.0578-1752.2011.21.008URL [本文引用: 1]
【Objective】 Research on effects of fertilization and mulching cultivation patterns on yield and water use of winter wheat is recognized to be of great significance in increasing crop yield and water and nutrient efficiency on Weibei dryland.【Method】Field experiments were carried out to study the effects of recommended N fertilization based on soil test, topdressing, ridge-mulching and furrow seeding, and covering soil surface by retention of wheat straw during summer fallow on winter wheat yield, biomass, harvesting index, water use efficiency and annual changes of soil water.【Result】 Results showed that compared to local farmers’ cultivation mode (apply all the fertilizers to soil once before seeding), topdressing of partial N fertilizer (25% of total) in dry-land region increased winter wheat yield by 6%-14% and WUE by 7%-10%, with WUE reaching 12.2 kg•hm-2•mm-1 to 13.6 kg•hm-2•mm-1; ridge-mulching and furrow seeding combined with N reduced topdressing increased winter wheat yield by 15%-41% and WUE by 10%-30%, and the WUE were as high as 12.2 kg•hm-2•mm-1 to 16.5 kg•hm-2•mm-1. Optimizing nitrogen fertilizer application by 1/4 nitrogen fertilizer being topdressed and at the same time using the ridge-mulching and furrow seeding was found to be able to enhance deep soil water usage by winter wheat, increase water content of winter wheat at heading stage and then enhance the biomass and harvesting index at harvest. This method led to a higher soil water consumption over the whole growing season, but the water use efficiency was also increased due to much more increase of grain yield. However, only reducing nitrogen input did not increase the water use efficiency. Nitrogen reduced topdressing combined with ridge-mulching and furrow seeding also increased soil storage of rainfall water during summer fallow and the summer fallow efficiency, by covering furrow soil surface by retention of wheat straw and keeping the ridge mulched plastic film during summer fallow. This method achieved annual soil water balance and was proved to be able to sustainablely increase winter wheat yield.【Conclusion】Optimizing nitrogen application combined with ridge-mulching and furrow seeding was showed to be the cultivation and fertilization method to increase yield and water use efficiency for winter wheat growing in Weibei dryland area on the Loess Plateau.
DOI:10.1007/BF00023162URL [本文引用: 1]
DOI:10.1017/S0021859600028665URL [本文引用: 1]
DOI:10.1111/j.1439-037X.1988.tb00648.xURL [本文引用: 1]
URL [本文引用: 1]
The relationship between biological yield, harvest index and economic yield were studied using 11 different new wheat varieties (lines). The results showed that the phenotypic and genetic correlations between biological yield and economic yield were both positive significant at 1% level, the phenotypic correlation between harvest index and economic yield was also positive significant at 1% level. The genetic potential of biological yield and the relationship between biological yield and economic yield were much greater than that of harvest index. The way of increasing economic yield is maintaining harvest index, increasing biological yield and harmonizing the relationship between biological yield and harvest index.
[本文引用: 1]
DOI:10.1093/jxb/erq311URL [本文引用: 1]
Theoretical considerations suggest that wheat yield potential could be increased by up to 50% through the genetic improvement of radiation use efficiency (RUE). However, to achieve agronomic impacts, structural and reproductive aspects of the crop must be improved in parallel. A Wheat Yield Consortium (WYC) has been convened that fosters linkage between ongoing research platforms in order to develop a cohesive portfolio of activities that will maximize the probability of impact in farmers' fields. Attempts to increase RUE will focus on improving the performance and regulation of Rubisco, introduction of C-4-like traits such as CO2-concentrating mechanisms, improvement of light interception, and improvement of photosynthesis at the spike and whole canopy levels. For extra photo-assimilates to translate into increased grain yield, reproductive aspects of growth must be tailored to a range of agro-ecosystems to ensure that stable expression of a high harvest index (HI) is achieved. Adequate partitioning among plant organs will be critical to achieve favourable expression of HI, and to ensure that plants with heavier grain have strong enough stems and roots to avoid lodging. Trait-based hybridization strategies will aim to achieve their simultaneous expression in elite agronomic backgrounds, and wide crossing will be employed to augment genetic diversity where needed; for example, to introduce traits for improving RUE from wild species or C-4 crops. Genomic selection approaches will be employed, especially for difficult-to-phenotype traits. Genome-wide selection will be evaluated and is likely to complement crossing of complex but complementary traits by identifying favourable allele combinations among progeny. Products will be delivered to national wheat programmes worldwide via well-established international nursery systems and are expected to make a significant contribution to global food security.
DOI:10.1016/j.fcr.2011.06.023URL [本文引用: 1]
New insights into changes in physiological processes associated with genetic gains in yield potential are essential for improved understanding of yield-limiting factors. Our field study was conducted at two sites with three N levels and 15 modern wheat (Triticum aestivum L.) varieties. The goal was to evaluate yield components, time courses of dry matter production, and N accumulation among different yield categories, and to determine physiological processes associated with yield-trait relationships. Close correlations were observed between yield and dry matter production after the stem elongation stage, particularly post-anthesis. Similar close correlations were observed between grain yield and N accumulation over the whole growing season, except for the re-greening stage. No positive correlation was found between yield and harvest index. Differences in dry matter production among different yield categories began at anthesis; differences in N accumulation emerged even earlier. We conclude that consistent increases in dry matter production (especially post-anthesis) and N accumulation are crucial for further improvements in wheat yield-trait relationships. (C) 2011 Published by Elsevier B.V.
[本文引用: 1]
[本文引用: 1]
[本文引用: 1]
[本文引用: 1]
[本文引用: 1]
URL [本文引用: 1]
Dynamic changes of root morphology affected by nitrate levels in different maize inbred lines (“478”、“CA170”)are studied in this paper.The results show that increasing the nitrate application level can enhance the shoot biomass as the planting time passes .whereas “478”is higher than “CA170”at two nitrate concentrations.Compared with “CA170”,the variety of“478”has a longer total root length,average root length and density of laterals to obtain more nitrogen at N deficiency,but this tendency is not so significant at the very beginning of the sampling time(7d).At high nitrate supply,the density of laterals increases for the two varieties,root average length however,becomes short,and the genotypic difference of the two varieties does not exist.Therefore,A larger root system of“478”is useful to extract much more N especially at low N condition.
DOI:10.1007/s11104-009-0204-xURL [本文引用: 1]
[本文引用: 1]
DOI:10.1023/A:1021107026067URL [本文引用: 1]
DOI:10.11674/zwyf.2013.0606URL [本文引用: 1]
在实验室条件下分别制备了含腐植酸、 海藻酸和谷氨酸3种增效剂的增效磷肥,运用土柱栽培试验研究等磷(设置低、 高2个施磷水平)投入条件下不同增效剂添加量的增效磷肥对小麦产量和磷肥利用率的影响。结果表明, 1)低磷水平下,增效磷肥处理小麦子粒产量比普通磷酸一铵提高9.74%~33.54%,高磷水平下,含腐植酸增效磷肥和含海藻酸增效磷肥处理小麦子粒产量分别比普通磷酸一铵增加26.81%和30.65%。低磷和高磷水平下,不同增效磷肥处理小麦子粒产量均随增效剂添加量的增加而提高。2)低磷和高磷水平下,增效磷肥处理小麦子粒含磷量与普通磷酸一铵处理差异不显著。3)低磷水平下,增效磷肥处理小麦吸磷总量比普通磷酸一铵增加14.81%~42.59%,磷肥的表观利用率平均提高了8712621个百分点;高磷水平下,腐植酸增效磷肥和海藻酸增效磷肥处理小麦吸磷总量分别比普通磷酸一铵增加1818%和3273%,磷肥的表观利用率平均提高了613和1019个百分点。
[D].
[本文引用: 1]
[D].
[本文引用: 1]
[本文引用: 1]
[本文引用: 1]
[本文引用: 1]
[本文引用: 1]
[本文引用: 1]
[本文引用: 1]
DOI:10.3864/j.issn.0578-1752.2019.05.007URL [本文引用: 1]
:【Objective】To evaluate the applicability of nitrogen fertilizer reduction and optimization for rice productivity in Jiangsu Province, the current situations and existed problems of fertilizer application were studied, and the effects of reducing nitrogen application on rice yield formation, nitrogen uptake and utilization were quantified.【Method】The current situations of rice nitrogen application rate (chemical nitrogen), grain yield and nitrogen use efficiency (PFPN, Partial factor productivity of applied nitrogen) were conducted by 1 502 farmer surveys in Jiangsu Province. Moreover, the effect of nitrogen reduction on rice productivity was evaluated by using Meta-analysis with 195 observations from 49 previous published studies. 【Result】The data of farmer practices survey showed that the averaged rice yield, nitrogen application rate and PFPN in Jiangsu Province were 8 273 kg·hm -2, 358.10 kg·hm -2 and 25.12 kg·kg -1, respectively. Meta-analysis showed that after reducing the N rate, the yield and PFPN increased by 2.8%-5.7% and 52.4%-77.0%, respectively, compared with traditional/conventional nitrogen application in Jiangsu province. The increased rice yield and PFPN were attributed to the regulated nitrogen uptake (-5.8%- -14.0%), which reducing the rice panicle number by 2.09%-5.46%, while increasing the grains per panicle, seed setting rate and 1000-grain weight by 3.96%-6.79%, 2.00%-3.88% and 0.89%-2.10%, respectively. The enhancing effects of reducing nitrogen application on rice yield and nitrogen efficiency in indica rice were higher than those of japonica rice. Reducing the nitrogen application based on reasonable nutrient management combined with organic matter (straw) input had the best effects (high yield and high nutrient efficiency). Present study also showed that the best reduction proportion of nitrogen application was supposed to lower than 25%. Moreover, the soils with high fertility were more conducive to achieve nitrogen fertilizer reduction with ensured rice yield. Taken together, the nitrogen reduction of rice in Jiangsu province could be realized by adjusting the nitrogen management and applying organic fertilizer. The recommended reduction space of nitrogen fertilizer was 31%, in which the basal and tillering fertilizers were the main decreasing direction. 【Conclusion】The reduction of chemical nitrogen fertilizer application of rice in Jiangsu province could be achieved while the basal fertilizer and tillering fertilizer should be most considered. The yield components of rice could be controlled reasonably, and the yield and nitrogen utilization efficiency of rice could be improved by reducing nitrogen application when controlling the reduction of nitrogen fertilizer within 31% and combined with optimizing management.
[本文引用: 1]
[本文引用: 1]
