 ,�Ͼ�ũҵ��ѧũѧԺ/ũҵ������������̬�����������ص�ʵ����/����ʡ�ִ���������Эͬ��������JCIC-MCP,�Ͼ� 210095
Critical Phosphorus Concentration Dilution Model and Phosphorus Nutrition Diagnosis in Two Cotton Cultivars with Different Phosphorus Sensitivity
PANG BaoGang, CAO Nan, ZHOU ZhiGuo, ZHAO WenQing,College of Agriculture, Nanjing Agricultural University/Key Laboratory of Crop Ecophysiology and Management, Ministry of Agriculture/Jiangsu Collaborative Innovation Center for Modern Crop Production (JCIC-MCP), Nanjing 210095ͨѶ����:
�ո�����:2020-02-10��������:2020-05-5�����������:2020-11-16
| ��������: |
Received:2020-02-10Accepted:2020-05-5Online:2020-11-16
����� About authors
�ӱ���,E-mail��

ժҪ
�ؼ��ʣ�
Abstract
Keywords��
PDF (554KB)Ԫ������ά�����������������EndNote|Ris|Bibtex�ղر���
�������ø�ʽ
�ӱ���, ���, ���ι�, ������. ��ͬ��������Ʒ���ٽ���Ũ��ϡ��ģ������Ӫ�����[J]. �й�ũҵ��ѧ, 2020, 53(22): 4561-6130 doi:10.3864/j.issn.0578-1752.2020.22.004
PANG BaoGang, CAO Nan, ZHOU ZhiGuo, ZHAO WenQing.
���ſ�ѧ����Դ����ʶ�루OSID����

0 ����
���о����塿��������������������Ĵ���Ӫ��Ԫ��֮һ[1],�������������ṹ�����ɳɷ�,������ᡢ��֬�ȵĺϳ�[2],���������ϴ�л������������Ҫ����[3]��Ϊ�������������,ũ������ʹ����,�������������ƶ���,�ʵ��������ʽ�Ϊ10%��25%,ʩ��Ĺ����ʴֲ����������ж�δ����������,�����������������Դ���˷�,��ũҵ������ɾ�ľ�����ʧ[4],ͬʱҲ���»�����������ͻ��,����ˮ�帻Ӫ����[5]������ˮ��Ⱦ[6]�ȡ������ҹ���Ҫ�ľ�������[7],��Ȼ��������������Ե���ҪС[8],����Ȼ�ձ������ʩ�ù���[9]�������ʵ�[10]�����⡣�ٽ���Ũ��ϡ�����߿���Ϊ������ӯ����ϵķ���,��������Ӫ��������Ϊ��Ҫ,���,�����ٽ���Ũ��ϡ�����߲���������Ӫ���������,��Ϊָ�����ʺ���ʩ�á�ʵ�ֽڷ���Ч�ṩ�������ݡ���ǰ���о���չ���ʶ���������Ӱ������һ��,�о����������ȱ�ᵼ���������½�[11]��Ʒ�ʽ���[12],������ʹ�Ӧ�������������[13]������[14]�͵�������������[15]�����������ʩ����,ǰ�˵��о���Ҫ������������½����,�����ݲ��������������Ƽ�[16,17],���о��ó�������ʩ�������нϴ���죨75��180 kg P2O5��hm-2ʩ����֮�䣩[11, 14-21],������Ʒ�֡���������������������ͬ��������ء����������,���������ٽ���Ũ��ϡ��������������Ӫ���������Ƽ�����ʩ����,����һ���̶ȹ���������졣�ٽ���Ũ����ָ����������ij��������ij������ʱ�ڻ�����������ʱ�������Ũ��[22,23],�ٽ���Ũ�ȣ�Pc��ϡ������һ���ʾΪPc=aW-b,ʽ��,WΪ���ϲ�������,a��bΪ����,�ֱ��ʾ�����ϲ�����������Ϊ1 t��hm-2ʱֲ�����Ũ�Ⱥ�ÿ���۵�λ������ʱ��Ũ���½����ٶ�[22,24-25]��������,�����ٽ���Ũ��ϡ��������Ӧ����������[22]��С��[22,24]�Լ�������[23,25]������,����ͬ�����ͬ���ﲻͬƷ�ּ��Լ���ͬƷ���ڲ�ͬ�ص���ٽ���ϡ��ģ�Ͳ��������б仯��BELANGER��[22]�о�����,�����ݳ���ȵIJ�ͬ,���ٽ���Ũ��ϡ�����߲�ͬ,�����ƤΪPc=3.27W-0.20,������ƤΪPc=5.23W-0.40��BELANGER��[24]�о�����,С����ٽ���Ũ��ϡ�������ڲ�ͬ�ص������ͬ,����aֵ��ΧΪ3.62��4.94 g��(100 g)-1,bֵ��ΧΪ0.21��0.49��ZAMUNER��[23]���������������ٽ���Ũ��ϡ������ΪPc=3.919W-0.304,��ͨ��������Ӫ��ָ����PNI��,���ڲⶨ���ֺ�60��80 d��������Ӫ��״����PNIΪ������ϲ���Ũ�ȵ�ʵ��ֵ������ٽ���Ũ��ϡ��ģ����õ���Ӧ���������ٽ���Ũ��ֵ�ı�ֵ,������������Ӫ�����[23],��PNI��1,��ʾֲ����ȱ��;PNI = 1,����ֲ��������Ӫ���������״̬;PNI��1,�����ֲ����Ӫ����ʣ�������о�����㡿ǰ���о���ͨ��ʩ�����������������������ʵ�Ӱ��������˵�ʩ����,�����ٽ���Ũ��ϡ�����ߺ���Ӫ��ָ���ĽǶȷ���������ʩ�������о����١��������Ĺؼ����⡿���о�ּ��ͨ��������ʩ���������������������ȵ�Ӱ��,��Բ�ͬ����������Ʒ�ֱַ����ٽ���ϡ������,������Ӫ��ָ��,Ϊ������Ӫ����Ϻ��ʹ����ṩ�������ݡ�1 �����뷽��
1.1 �������
������2017��2018���ڽ���ʡ����е���ԭ�ֳ���33��27' N,120��34' E�����С�ѡ������������Ʒ��³54��������������Ʒ��ԥ����9110Ϊ����[26],����ʩ������0��50��100��150��200 kg P2O5��hm-2,�ֱ���P0��P50��P100��P150��P200��ʾ�����顣������Ϊ�ع������,��������ǰ������һ���Ի�ʩ�������ط������ֱ�Ϊ225 kg N��hm-2��225 kg K2O��hm-2�����ʲ���ǰʩ��40%,ʢ����ʩ��60%;�ط���������ǰ������һ���Ի�ʩ�������������������,��10������,ÿ�����ظ�3��,ÿС�����79.2 m2��13.2 m��6 m������������Ϊɰ����,2017��2018���������طֱ�Ϊ1.37��1.36 g��cm-3,pH �ֱ�Ϊ8.3��8.1,0��20 cm����ֱ��л���11.9��12.1 g��kg-1,ȫ��0.8��0.8 g��kg-1����Ч��18.2��18.1 mg��kg-1����Ч��18.3��18.1 mg��kg-1����Ч�� 117.1��115.9 mg��kg-1�������ӷֱ���2017��5��28�ա�2018��5��29�ղ���,��2017��10��15�ա�2018��10��14���ջ�,��ֲ�ܶȾ�Ϊ9.0��105��/hm2���������������ʩ�������߲�����Ҫ����С�1.2 ȡ��������ⶨ����
�ֱ��������ڡ�ʢ���ڡ�ʢ���ڡ�ʢ���ڡ�������ȡ����ÿС��ѡ����һ�µ���3��,��������������֦������Ҷ����֦Ҷ���壨��,��ά,���ѣ��Ȳ�ͬ���ٽ��з���,��105����ɱ��30 min,80���º�������,�ֱ������������,��������ϲ���������֮�����,��1 mm ɸ,��H2SO4-H2O2������,���ü��ʽ���������Dzⶨ��������Ũ��,������������ϲ���Ũ�ȡ�
����������,ÿ����С��ѡȡ20����,ͳ�Ƶ�������,��������ʱ,�ڸ�С��ȡ����5 m������ֲ��,��ȡȫ����������,�ⶨ���������ء�������������
1.3 �ٽ���ϡ������ģ�͵Ľ�������֤
1.3.1 �ٽ���ϡ������ģ�͵Ľ��� ����2017����������ݽ���ģ�ͽ������ٽ���Ũ����ָ��һ��������ʱ���ڻ�����������ʱ����С��Ũ��ֵ[23]���ٽ���Ũ��ϡ�������㷽������JUSTES��[27]��Ѧ��Ƽ��[28]�Լ�ZAMUNER��[23],����ÿ��ȡ���յ����������ϲ�����������֮��Ӧ����Ũ��,�������ٽ���Ũ��ϡ������ģ�ͣ�ʽ��,Pc��%��Ϊ������ϲ��ٽ���Ũ��ֵ,Wc��t��hm-2��Ϊ��������������������ֵ,a��bΪ����,a���������ϲ���λ���������ٽ���Ũ��ֵ;bΪ�����ٽ���Ũ��ϡ������б�ʵ�ͳ�Ʋ�����
1.3.2 ģ����֤ ����2018����������ݽ���ģ����֤��ģ�͵���֤�ù���ͨ�õĸ�������RMSE[29,30]�ͱ�����������n-RMSE[31]�ķ�����
ʽ��,Pi��Oi�ֱ�Ϊ�ٽ���Ũ�Ȳⶨֵ��ģ��ֵ;nΪ������;SΪʵ�����ݵ�ƽ��ֵ��RMSEֵԽС,ģ��ֵ�����ֵ��һ����Խ��,ƫ��ԽС,��ģ�͵�Ԥ�⾫ȷ��Խ�ߡ�JAMIESON��[32]��Ϊ��n-RMSE�� 10%,ģ���ȶ��Լ���;10%��n-RMSE��20%,ģ���ȶ��ԽϺ�;20%��n-RMSE��30%,ģ���ȶ���һ��;n-RMSE��30%,ģ���ȶ��Խϲ
1.4 ����Ӫ��ָ����PNI������Ե��ϲ���������RDW��
������Ӫ��ָ��PNIΪ������ϲ���Ũ�ȵ�ʵ��ֵ������ٽ���Ũ��ϡ��ģ����õ���Ӧ���������ٽ���Ũ��ֵ�ı�ֵ,������ʽ���㣺ʽ��,PaΪ������ϲ���Ũ�ȵ�ʵ��ֵ;PcΪ�����ٽ���Ũ��ϡ��ģ����õ���Ӧ���������ٽ���Ũ��ֵ����PNI��1,��ʾֲ����ȱ��;PNI = 1,����ֲ��������Ӫ���������״̬;PNI��1,�����ֲ����
Ӫ����ʣ[23]��
��Ե��ϲ���������RDW��Ϊ���ϲ���������ͬһ����ʱ�ڸ��������ϲ����������ֵ�ı�ֵ��
1.5 ���ݴ���
����Microsoft Excel 2010�����������������,��Origin 2017��ͼ,��������رȽϲ���LSD����2 ���
2.1 ʩ�����������������������ɵ�Ӱ��
������������Ʒ�ּ��������,��ԥ����9110���,³54������Խϸ�,���ؽϵ�,���Ʒ�ּ����������첻������ʩ�ס�Ʒ�֡�ʩ�������������������������,2��2��Ʒ�ֱ���һ��,��������Ӱ�첻��������1����Table 1
��1
��1ʩ�����������������������ɵ�Ӱ��
Table 1
| Ʒ�� Variety | ʩ���� Phosphorus application rate (kg P2O5��hm-2) | 2017 | 2018 | ||||
|---|---|---|---|---|---|---|---|
| ���� Boll number (��104��hm-2) | ���� Seedcotton weight per boll (g) | ������ Seedcotton yield (kg��hm-2) | ���� Boll number (��104��hm-2) | ���� Seedcotton weight per boll (g) | ������ Seedcotton yield (kg��hm-2) | ||
| ԥ����9110 Yuzaomian 9110 | 0 | 87.1��1.0b | 4.0��0.0a | 3459.5��33.6c | 92.6��0.9d | 4.2��0.1a | 3869.3��55.4d |
| 50 | 93.5��1.0b | 4.0��0.0a | 3760.8��47.2b | 98.4��1.3c | 4.2��0.2a | 4124.9��65.9c | |
| 100 | 110.6��7.2a | 4.0��0.1a | 4459.0��79.8a | 109.6��0.9b | 4.3��0.0a | 4681.6��58.6b | |
| 150 | 115.2��4.0a | 4.0��0.1a | 4643.1��71.9a | 113.9��2.8a | 4.3��0.0a | 4897.2��87.4a | |
| 200 | 115.5��1.6a | 4.1��0.1a | 4691.7��53.7a | 116.3��3.3a | 4.3��0.0a | 4991.9��93.5a | |
| ³54 Lu 54 | 0 | 90.0��2.1d | 3.7��0.1a | 3366.1��59.9d | 91.4��1.5d | 3.9��0.1a | 3538.1��49.5d |
| 50 | 104.6��3.8c | 3.8��0.1a | 3924.9��75.6c | 108.9��2.2c | 3.9��0.2a | 4257.7��58.5c | |
| 100 | 115.5��4.0b | 3.8��0.0a | 4342.0��70.0b | 120.3��2.9b | 4.0��0.1a | 4762.3��79.1b | |
| 150 | 122.7��1.1a | 3.8��0.0a | 4686.3��84.4a | 127.4��1.9a | 4.0��0.0a | 5107.6��72.4a | |
| 200 | 123.5��2.5a | 3.8��0.1a | 4705.7��47.9a | 126.0��1.6a | 4.0��0.0a | 5127.9��81.2a | |
| �������ANOVA | |||||||
| Ʒ��Variety (V) | ** | ** | NS | ** | ** | NS | |
| ʩ����P rate | ** | NS | ** | ** | NS | ** | |
| Ʒ�֡�ʩ����V��P rate | ** | NS | ** | ** | NS | ** | |
�´��ڴ�|����CSV
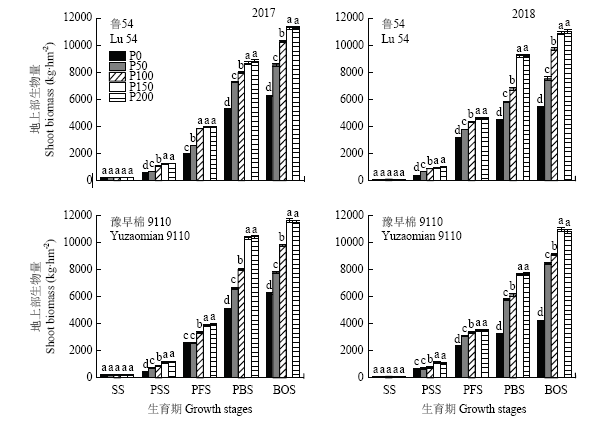
��ʩ����������,������������������,���߾���150��200 kg P2O5��hm-2ʩ�����´ﵽ���,����������0��50��100 kg P2O5��hm-2ʩ����,2��Ʒ�ֱ���һ�¡���2017��,�벻ʩ�����,50��100��150��200 kg P2O5��hm-2��ʩ������,����������Ʒ��³54���������ֱ����16.6%��29.0%��39.2%��39.8%,�����ֱ�������16.0%��28.0%��36.0%��36.9%;����������Ʒ��ԥ���� 9110���������ֱ����8.7%��28.9%��34.2%��35.6%,�����ֱ����7.4%��27.0%��32.3%��32.6%����2018��,�벻ʩ�����,50��100��150��200 kg P2O5��hm-2��ʩ������,����������Ʒ��³54���������ֱ����20.3%��34.6%��44.3%��44.9%,�����ֱ����19.1%��31.6%��39.4%��37.9%;����������Ʒ��ԥ���� 9110���������ֱ����6.6%��21.0%��26.6%��29.0%,�����ֱ����6.3%��18.4%��23.0%��25.6%��
2.2 ʩ�����������ϲ�����������Ũ�ȵ�Ӱ��
2.2.1 ʩ�����������ϲ���������Ӱ�� ������ϲ������������ڸ�ʩ����������������,��ʢ���ڡ�ʢ���ڡ�ʢ���ڡ������ڲ�������,��������ΪP0��P50��P100��P150 �� P200,2��Ʒ��2����һ�£�ͼ1����ͼ1
 �´��ڴ�|����ԭͼZIP|����PPT
ͼ1ʩ�������������������ۻ���Ӱ��
SS��PSS��PFS��PBS��BOS�ֱ��ʾ�����ڡ�ʢ���ڡ�ʢ���ڡ�ʢ���ں������ڡ���ͬ
Fig. 1Effects of phosphorus application on the dynamics of aboveground dry matter SS, PSS, PFS, PBS and BOS represented cotton seedling stage, peak squaring stage, peak flowering stage, peak boll setting stage and boll opening stage, respectively. The same as below
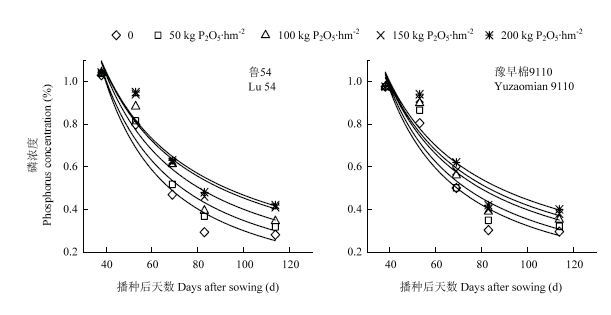
2.2.2 ʩ�����������ϲ���Ũ�ȵ�Ӱ�� �����������̵��ƽ�,������ϲ���Ũ�ȳ��ֳ����½�������,³54�ĵ��ϲ���Ũ���½����ȴ���ԥ����9110����ͬһȡ����,������ϲ���Ũ����ʩ�������Ӷ�����,2��Ʒ�ֽ������һ�£�ͼ2����
ͼ2
 �´��ڴ�|����ԭͼZIP|����PPT
ͼ2ʩ��������������������Ũ�ȱ仯��Ӱ�죨2017�꣩
Fig. 2Effects of phosphorus application on the dynamics changes of aboveground biomass phosphorus content in 2017
2.3 ������ϲ��ٽ���Ũ��ϡ������ģ�͵Ľ�������֤
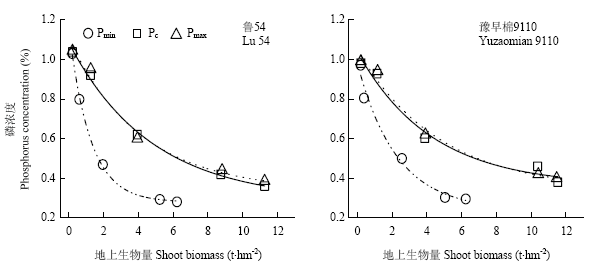
2.3.1 ģ�ͽ��� ���ڸ��������ϲ�������֮��û����������,������ϲ���Ũ��û����������,��˲���ƽ��ֵ��Ϊ��ʱ�ڵ��ٽ���Ũ��ֵ�������ڡ�ʢ���ڡ�ʢ���ڡ�ʢ���ں��������ٽ���Ũ��ֵ�ֱ�Ϊ1.04%��0.92%��0.62%��0.42% �� 0.36%��³54��;0.98%��0.93%��0.60%��0.46% ��0.38%��ԥ����9110�����������ٽ���Ũ��ֵ�����Ӧ�ĸ����ؽ�����ϣ�ͼ3��,�õ���³54��ԥ���� 9110 2��Ʒ�����ٽ���Ũ��ϡ��ģ��,���̵ľ���ϵ���ֱ�Ϊ0.858��0.845,���ﵽ����ˮƽ����2��������,��ÿ��ȡ������Ũ�ȵ������Сʵ��ֵ�����Ӧ�ĵ��ϲ��������������,�ɵõ�����ߣ�Pmax,%������ͣ�Pmin,%����Ũ��ϡ��ģ��,����ϡ�ͱ߽�ģ��,ģ�Ͳ�������2��³54����ߡ��ٽ���Ũ��ϡ�������в���,��ԥ����9110����ߡ��ٽ���Ũ��ϡ���������غϡ�
2.3.2 ģ����֤ ����������Ʒ��³54��������������Ʒ��ԥ����9110���ٽ���Ũ�Ȳⶨֵ��ģ��ֵ�����ֱ�Ϊ0.0257��0.0863��0.0084��0.1163����3��,��Ӧ���ٽ���Ũ��ϡ��ģ�͵�RMSE�ֱ�Ϊ0.1296��0.1383,n-RMSE�ֱ�Ϊ17.8504%��18.5447%;��������ϡ��ģ���нϸߵ��ȶ��ԡ�
Table 2
��2
��2����ϡ��ģ�͵IJ���ֵ
Table 2
| Ʒ�� Variety | ��ϡ��ģ�� Phosphorus dilution model | |||
|---|---|---|---|---|
| a | b | R2 | ||
| ³54 Lu 54 | Pmin | 0.599 | 0.139 | 0.945** |
| Pmax | 0.798 | 0.217 | 0.852* | |
| Pc | 0.784 | 0.221 | 0.858* | |
| ԥ����9110 | Pmin | 0.584 | 0.320 | 0.978** |
| Yuzaomian 9110 | Pmax | 0.782 | 0.201 | 0.838* |
| Pc | 0.774 | 0.198 | 0.845* | |
�´��ڴ�|����CSV
ͼ3
 �´��ڴ�|����ԭͼZIP|����PPT
ͼ3��������������ϡ�����ߣ�2017�꣩
Fig. 3The phosphorus dilution model of cotton aboveground biomass in 2017
Table 3
��3
��3���ٽ���Ũ�ȣ�CPC���ⶨֵ��ģ��ֵ��2018�꣩
Table 3
| ������ Stage | ³54 Lu 54 | ԥ����9110 Yuzaomian 9110 | ||||
|---|---|---|---|---|---|---|
| �ⶨֵ Observed value | ģ��ֵ Simulated value | ��� Error | �ⶨֵ Observed value | ģ��ֵ Simulated value | ��� Error | |
| ���� Seedling stage | 1.3500 | 1.4292 | 0.0560 | 1.2800 | 1.3045 | 0.0173 |
| ʢ����Peak squaring stage | 0.9200 | 0.7979 | 0.0863 | 0.9300 | 0.7658 | 0.1161 |
| ʢ����Peak flowering stage | 0.5800 | 0.5262 | 0.0381 | 0.6265 | 0.5833 | 0.0305 |
| ʢ����Peak boll setting stage | 0.4000 | 0.4363 | 0.0257 | 0.4734 | 0.4853 | 0.0084 |
| ������Boll opening stage | 0.3800 | 0.4167 | 0.0259 | 0.4181 | 0.4473 | 0.0207 |
| RMSE | 0.1296 | 0.1383 | ||||
| n-RMSE | 17.8504% | 18.5447% | ||||
�´��ڴ�|����CSV
2.4 ��ͬʩ��������Ӫ��ָ����PNI����Ӱ��
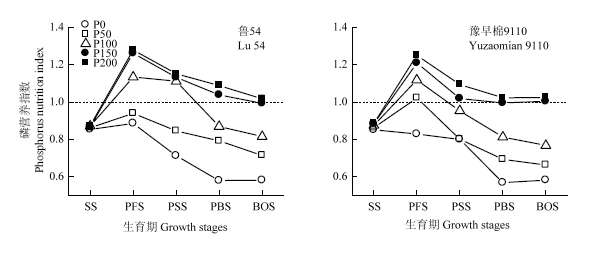
2����Ʒ�ֵ�PNI����ʩ���������Ӷ�����,����ͬһ����,PNI����������ʱ�ڵ����Ʊ���Ϊ�����ߺ͵����ƣ�ͼ4����2017����ʢ����P50����,³54��PNIС��1,��ԥ����9110��PNI�Դ���1;ʢ����P100����,³54��PNI����1,��ԥ����9110��PNIС��1,����³54��ʩ�����仯�������йء�ͼ4
 �´��ڴ�|����ԭͼZIP|����PPT
ͼ4��ʩ����������Ӫ��ָ����PNI���ı仯
Fig. 4Changes of phosphorus nutrition indices (PNI) of cotton
2.5 PNI����Ե��ϲ���������RDW��֮��Ĺ�ϵ
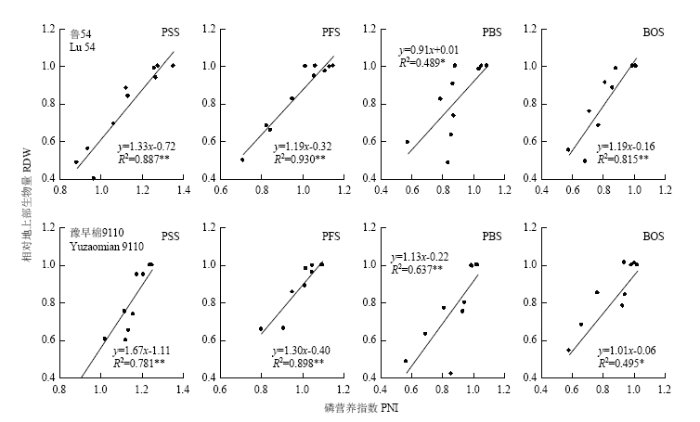
³54��ԥ����9110��ͬ����ʱ�ڵ�PNI����Ե��ϲ�������RDW������Ϊ��������ع�ϵ��ͼ5��������PNI������,��Ե��ϲ���������������,���̾���ϵ���ֱ�Ϊ0.887��0.930��0.489��0.815��0.781��0.898��0.637��0.495,�ﵽ����������ˮƽ��ͼ5
 �´��ڴ�|����ԭͼZIP|����PPT
ͼ5����Ӫ��ָ������Ե��ϲ��������Ĺ�ϵ
n=10, R20.05 = 0.399, R20.01 = 0.586��*��**�ֱ��ʾ��0.05��0.01ˮƽ�ϲ�������
Fig. 5Relationship between phosphorus nutrition index (PNI) and relative shoot biomass (RDW) of cotton
n=10, R20.05 = 0.399, R20.01 = 0.586. *, significantly different at P<0.05; **, significantly different at P<0.01
3 ����
3.1 ���ٽ���Ũ��ϡ������ģ�ͼ�����֤
���������������������Ӫ��Ԫ��,������������̡��ʵĺ����˳ﲻ�������������IJ���,�Ż���άƷ��,���ܴٽ���Դ����Ч�ʵ����,��Ŀǰ�ҹ��ձ������ʩ�ù���[9]�������ʵ�[10]����Ⱦ���������⡣�ٽ���Ũ�ȿ���������Ӫ���������,��ʱ��Ч������ֲ������ӯ��ˮƽ,Ϊָ������ʩ�ʼ�ʵ�ֽڷ���Ч�ṩ�������ݡ��ٽ���Ũ�ȵ��о��Ѿ��ڶ�������[23]��Ӧ��,�������ϵ�Ӧ�û�δ�����������,����ͨ�����ò�ͬ����������Ʒ�ֵ�ʩ��������,��������֤�����ٽ���Ũ��ϡ������ģ�͡����о���,��������������Ʒ��³54���ٽ���Ũ��ϡ������ģ��ΪPc=0.784W-0.221,����������Ʒ��ԥ����9110��ģ��ΪPc=0.774W-0.198����ģ�Ϳ�֪,��������������Ʒ��ԥ����9110���,³54���ٽ���ϡ�����߲���a������1.29%,����b������11.62%,������ͬ��λ������������,����������Ʒ��³54����Խϸߵ���Ũ��,������ϲ�������������,³54�����ٽ���Ũ�ȵݼ������ʣ�����b��ȴ�ϸߡ�˵��2����Ʒ����Ȼ���в�ͬ����������,������������Ʒ�ּ���ٽ���Ũ��������,��������������,����������Ʒ��³54�ٽ���Ũ���½���������������Ʒ��ԥ����9110��,������ֳ��������е����ԡ���ǰ����������[23,25]��������[22]�ij����Ƥ�о�������,���о�������ģ����,����a��b���ϸ�;��С��[24]���о�������,����a�ϵ�;˵����ͬ�����ٽ���Ũ�Ȳ���ͬ,���,�б�Ҫ�����Ͻ�����Ӧ�ٽ���Ũ��ģ��,Ϊ����Ӫ�������ṩ�������ݡ�����,���о�����2018������ݶ��ٽ���Ũ��ģ�ͽ�������֤,ԥ����9110��³54���ٽ���Ũ��ϡ��ģ�͵�RMSE�ֱ�Ϊ0.1296��0.1383������֤�����֪,���������������ٽ���Ũ��ģ��ģ��Ч���Ϻ�,��ԥ����9110��ģ��Ч���Ժá����Ͳˡ����ס�С���������ٽ���Ũ��ϡ��ģ��ģ��Ч�����,���о�������ģ��RMSE��Խ�С,˵��ģ��ģ���Ч����ԽϺ�,�����������IJ�ͬ��Ũ�ȱ仯������ء�����,ԥ����9110��³54���ٽ���Ũ��ϡ��ģ��n-RMSE��ֵ�ֱ�Ϊ17.8504%��18.5447%,����ģ�͵��ȶ�����Ϻ�,������Ϊ������Ӫ��״���жϵĹ���֮һ��
3.2 ��ͬ����������Ʒ����Ӫ����ϼ�����ʩ�����Ƽ�
PNI�ǻ��������ٽ���ϡ��ģ�������ָ��,��ʵ����Ũ�����ٽ���Ũ�ȵı�ֵ����������Ӫ��״���Լ�������̬����������Ӫ��״���ı仯�����о���,��ͬ����ʱ��PNIֵ��ʩ���������Ӷ����ӡ����о�������,��Ӫ��ָ������Ե��ϲ��������������������,�밲־����[33]�������з��ֵ�Ӫ��ָ������Ե�����������������ؽ������,˵�����о�ȷ������ϡ������ģ�Ϳ���������������Ӫ��״�������������ʩ����Ŀǰ���в����о������ܵ�[18]�о������������߲���ʩ����Ϊ158.3 kg P2O5��hm-2,���ʩ����Ϊ146.3 kg P2O5��hm-2����������[34]�о���������ʩ����������,���������������Ӻ͵�����,���ŵ�ʩ������150 kg P2O5��hm-2��Ҧ������[21]��ʩ�Բ�����Ӱ�����,�õ����������ʱ��ʩ����Ϊ132 kg P2O5��hm-2�����о���,ʩ��������150 kg P2O5��hm-2ʱ,2����Ʒ�ֲ�����ʩ���������Ӷ�����,��³54�������ӷ��ȴ���ԥ����9110,ʩ��������150 kg P2O5��hm-2ʱ,���������Ӳ�����;�����ϲ���������150 kg P2O5��hm-2ʩ��Χ��,����ʩ���������Ӷ�����,������ʩ����,���������Ӳ��������������½�;����2��Ʒ�ָ�ʱ��PNI��ˮƽ��1���Ĺ�ϵ,������������150 kg P2O5��hm-2ʱ,PNIֵ������1����,������Ϊ200 kg P2O5��hm-2ʱ,����ֳ�����ӯ������,ʩ��������150 kg P2O5��hm-2ʱ,PNIС��1,�����ʹ�Ӧ���㡣�ۺϲ��������PNI,���о���Ϊ�����˵���ʩ����Ϊ150 kg P2O5��hm-2,�����������[19]���о����һ�¡�
4 ����
����������������150��200 kg P2O5��hm-2ʩ��������������,�����ڸ�ʩ��������첻���������������̵��ƽ�,�����ϲ���Ũ������,���ϲ����������������ơ����ݵ��ϲ�����������Ũ�ȵĹ�ϵ,�ֱ����˲�ͬ����������Ʒ�ֵ��ٽ���ϡ������ģ�ͣ�³54��Pc=0.784W-0.221,ԥ����9110��Pc=0.774W-0.198����2��ϡ������ģ�͵�RMSE�ֱ�Ϊ0.1296��0.1383;n-RMSE�ֱ�Ϊ17.8504%��18.5447%,˵��ģ���нϺõ��ȶ��ԡ�����Ӫ��ָ��PNI���������̵����Ƴ������ߺ��½�������,��ͬһȡ��ʱ��,PNI��ʩ���������Ӷ�����,150 kg��hm-2ʩ����ʱPNIƽ��ֵ�Ͻӽ���1���������������ڲ�ͬʩ����֮��ı��ּ�PNI,�Ƽ������������ʩ����Ϊ150 kg P2O5��hm-2���ο����� ԭ��˳��
������ȵ���
������������
�����ڿ�Ӱ������
[��������: 1]
[��������: 1]
DOI:10.1046/j.1469-8137.2003.00695.xURL [��������: 1]
DOI:10.1016/j.jplph.2019.153051URLPMID:31639535 [��������: 1]

Phosphorus (P) is an essential mineral, required for crucial plant genetic, metabolic and signaling functions. Under P deficiency, normal physiological function can be disrupted, especially photosynthetic metabolism. The majority of photosynthetic studies of P stress has been on model organisms, and very little is known about plants that evolved on P deficient soils. Aspalathus linearis (Burm.f.) R.Dahlgren, a native to the Mediterranean ecosystem of South Africa was used to study the photosynthetic responses during short-term P limitation. A. linearis seedlings were cultured under glasshouse conditions and exposed to short-term P stress. Leaf photosynthetic gas exchange was coupled with metabolic analyses. In spite of the decline in leaf cellular Pi, the photosynthetic rates remained unchanged. These leaves also maintained their levels of light harvesting and reaction center pigments. The efficiency of the light reactions' utilization of ATP and NADPH increased during P-stress. Leaf glucose levels decreased during P-stress, while sucrose concentrations remained unaffected. These results show that during short-term P-stress, A. linearis can maintain its photosynthetic rates by altering the structural and functional components of the light reactions.
DOI:10.1021/es801217qURLPMID:19209578 [��������: 1]
Human-induced eutrophication degrades freshwater systems worldwide by reducing water quality and altering ecosystem structure and function. We compared current total nitrogen (TN) and phosphorus (TP) concentrations for the U.S. Environmental Protection Agency nutrient ecoregions with estimated reference conditions. In all nutrient ecoregions, current median TN and TP values for rivers and lakes exceeded reference median values. In 12 of 14 ecoregions, over 90% of rivers currently exceed reference median values. We calculated potential annual value losses in recreational water usage, waterfront real estate, spending on recovery of threatened and endangered species, and drinking water. The combined costs were approximately $2.2 billion annually as a result of eutrophication in U.S. freshwaters. The greatest economic losses were attributed to lakefront property values ($0.3-2.8 billion per year, although this number was poorly constrained) and recreational use ($0.37-1.16 billion per year). Our evaluation likely underestimates economic losses incurred from freshwater eutrophication. We document potential costs to identify where restoring natural nutrient regimes can have the greatest economic benefits. Our research exposes gaps in current records (e.g., accounting for frequency of algal blooms and fish kills) and suggests further research is necessary to refine cost estimates.
DOI:10.1111/j.1475-2743.2008.00146.xURL [��������: 1]
[D].
[��������: 1]
DOI:10.1074/jbc.RA118.006878URL [��������: 1]
[��������: 1]
[��������: 1]
[D].
[��������: 2]
[D].
[��������: 2]
URL [��������: 2]
Field experiments of winter wheat��summer maize rotation were conducted in North China Plain irrigation area to explore the effects of wheat season irrigation with dairy effluent on grain yield, phosphorus uptake, accumulative phosphorus usage efficiency and phosphorus accumulation in soil. The results showed that the irrigation with dairy effluent significantly improved the yields of winter wheat and summer maize. With the increasing of P2O5�� carried by dairy effluent into soil, winter wheat yield increased at first and then decreased. When the P2O5�� increased 137 kg·hm-2��, winter wheat yield increased to the maximum (7646.4 kg·hm-2) and the phosphorus utilization rate was the highest (24.8%). But excessive phosphorus decreased the winter wheat yield and phospho����rus�� utilization efficiency. Summer maize yield and phosphorus uptake increased with the increase of P2O5�� carried by dairy effluent. The summer maize yield increased by 2222.4-2628.6 kg·hm-2�� and the phosphorus uptake increased by 13.9-21.1 kg·hm-2�� in contrast to the control (CK). ��Under�� conventional phosphorus fertilization at 88 kg·hm-2��, and the summer maize yield increased by 2235.0 kg·hm-2�� compared with CK. As the time of irrigation with dairy effluent increasing, the grain yield increased more significantly. The cumulative phosphorus utilization in this rotation system increased year by year. After six seasons of crop harvest, the cumulative phosphorus utilization rate increased into 40.0%-47.7%. Under the experimental condition, two times of irrigation with the dairy effluents in the winter wheat��summer maize rotation system was the best operating mode.
[��������: 2]
[��������: 2]
[��������: 1]
DOI:10.11963/1002-7807.smdhl.20180103URL [��������: 1]
[Objective] Phosphorus is one of three major required nutrients for cotton growth and development. A phosphorus deficiency will lead to retarded cotton growth, undeveloped roots, and the abscission of buds and bolls, which results in serious reductions in cotton yield and quality. While applied phosphorus is easily fixed in soils, it is mostly transferred to occluded P, which is not available to plants. Therefore, this study aimed to provide theoretical support for the study of response mechanisms to low phosphorus stress and the efficient phosphorus uptake and utilization of different cotton genotypes. [Method] The effects of phosphorus accumulation and utilization, leaf photosynthetic characteristics and root morphology of two genotypes of cotton (CCRI 79 and SCRC 28) were studied in hydroponic cultures having different phosphorus concentrations. [Result] CCRI 79 had higher phosphorus utilization rates of 90.92 mg·mg–1 at the low phosphorus level (KH2PO4 1.0×10⁻⁵ mol·L–1) and 23.09 mg·mg–1 at the high phosphorus level (KH2PO4 0.5 mol·L–1) compared with SCRC 28. When phosphorus was deficient, the total root length, total root surface area and total root volume of SCRC 28 increased by 13.05%, 18.78% and 10.50%, respectively, while the total root length, total root surface area and total root volume of CCRI 79 decreased significantly. [Conclusion] Here, we found that SCRC 28 had a root morphology and physiological characteristics that allowed it to adapt to low phosphorusstress, while CCRI 79 utilized phosphorus more efficiently.
DOI:1002-7807(2010)05-0466-05URL [��������: 2]
ͨ��������飬�о����ʲ�ͬ�������������ʻ��ۡ��������������ա����ۡ������Ӱ�졣�����������ʩ�ʿ������������������������͵����صĻ�������������ʩ��������Ч���������ԡ�����������P2O5��Ϊ 75 �� 150 kg·hm-2 ʱ�����������ʻ��ۡ��������������ٵ����صĻ��������ԵĴٽ����ã��������ڸ����ʻ��ۺ��������ٵ��صĻ������ֱ�ȶ���ƽ������� 24.6%��30.7%��55.9% �� 36.4%�������ڸ����ʻ��ۡ��������������ٵ��صĻ������ֱ�ȶ���ƽ������� 33.4%��39.9%��49.1%��47.7% �� 53.0%��
[��������: 1]
[��������: 1]
[��������: 1]
[��������: 1]
[D].
[��������: 1]
[D].
[��������: 1]
[��������: 1]
[��������: 1]
[��������: 1]
[��������: 1]
[��������: 2]
[��������: 2]
DOI:10.2134/agronj2008.0132URL [��������: 6]
DOI:10.1007/s12230-016-9514-8URL [��������: 9]
DOI:10.2134/agronj14.0451URL [��������: 4]
[��������: 3]
DOI:10.1080/00380768.2019.1709543URL [��������: 1]
DOI:10.1006/anbo.1994.1133URL [��������: 1]
DOI:10.1002/jpln.v170:6URL [��������: 1]
DOI:10.1175/1520-0477(1982)063<1309:SCOTEO>2.0.CO;2URL [��������: 1]
[D].
[��������: 1]
[D].
[��������: 1]
DOI:10.1016/S0308-521X(00)00010-XURL [��������: 1]
DOI:10.1016/0378-4290(91)90040-3URL [��������: 1]
[��������: 1]
[��������: 1]
[��������: 1]
[��������: 1]
