 ,1, Ҷʢ��2
Change of Phosphorus in Lateritic Red Soil and Its Effect on Sugarcane Yield and Phosphorus Loss in Runoff Under 11-Year Continuous Application of Excessive Phosphorus Fertilizer
OU HuiPing1, ZHOU LiuQiang1, HUANG JinSheng1, XIE RuLin1, ZHU XiaoHui1, PENG JiaYu1, ZENG Yan1, MO ZongBiao2, TAN HongWei,1, YE ShengQin2ͨѶ����:
���α༭: ����ϼ
�ո�����:2020-03-9��������:2020-06-3�����������:2020-11-16
| ��������: |
Received:2020-03-9Accepted:2020-06-3Online:2020-11-16
| Fund supported: |
����� About authors
����ƽ,E-mail��

ժҪ
�ؼ��ʣ�
Abstract
Keywords��
PDF (726KB)Ԫ������ά�����������������EndNote|Ris|Bibtex�ղر���
�������ø�ʽ
����ƽ, ����ǿ, �ƽ���, л����, ������, ������, ����, Ī�ڱ�, ̷��ΰ, Ҷʢ��. ���������11����������ʩ���������ݱ估�� �Ը������������ʧ��Ӱ��[J]. �й�ũҵ��ѧ, 2020, 53(22): 4623-4633 doi:10.3864/j.issn.0578-1752.2020.22.009
OU HuiPing, ZHOU LiuQiang, HUANG JinSheng, XIE RuLin, ZHU XiaoHui, PENG JiaYu, ZENG Yan, MO ZongBiao, TAN HongWei, YE ShengQin.
���ſ�ѧ����Դ����ʶ�루OSID����

0 ����
���о����塿����ֲ���������������Ӫ��Ԫ��,�����������������������Ҫ��������[1]�������ǹ�����Ҫ��֧����ҵ,ȫ��������ֲ��������Ⱦ�ȫ����һ[2]���������������ձ�ȱ��,����������������Ҫ��������[3],��������Ҫ����ʩ����ȷ������߲��Ȳ�����ͳ��,����ȫ�����ﳣ��ʩ�봿��60 ��t[4]��Ȼ��,������ʵ��������ʽ�Ϊ10%��25%[5]����ʩ�������е��ױ��̶�Ϊ���ס���������[6],��������ʧ��Ϊũҵ��Դ��Ⱦ����Ҫ��Դ[7]�����,����ʩ����������ʩ���������������е�ʱ���ۻ��仯�����Լ�������ӯ������Ӧ,�������ر仯��������������صر�������ʧ��Ӱ��,�Ժ���ʩ����,��ѧ������������,�����������ͼ��ٻ�����Ⱦ���վ�����Ҫ���塣��ǰ���о���չ��ǰ�����������ص��ݱ估��仯�������ۻ�ӯ��������Ӧ������Olsen-Pũѧ��ֵ���˴������о��������о�����,��ʩ�����������½�,������Լ��ʩ���������������ȫ����Ч����[8,9,10,11]���ҹ�������11%���ٶ����ۻ���[12],����������ʧ���ռӾ�[13]���������ر仯����������ӯ����������ع�ϵ[8,9,10],���������͡��������͡�������ֲ�ƶȺ�ʩ���ƶȶ���[14,15]������Olsen-P����������ʱ���ݼ�����[8]�������о�����㡿Ŀǰ�����������ص��ݱ���Ҫ�����ں�������������ɫ������������ˮ������������������[8,15-20],���ڳ�����������о���������Ч��ȱ�ּ�ָ��[21,22]����������������[23],�����ʩ���³����������̬����ʧ����[24,25,26]�����������ռ����[27]�ȡ���Գ���������������ݱ�δ����������������������,�����ر���������������ǿ,��������ʩ�������������ӯ�����仯,�Ʊض����������ۻ�����ʧ����Ӱ��,���,������Ҫ̽������ʩ����������ʩ�����������ص��ݱ�����������������ӯ������Ӧ��ϵ,��ȷ�������ص�ũѧ��ֵ���������Ĺؼ����⡿���ó��ڶ�λ����ϵͳ�о�ʩ���³�����������������ۻ���������ʧ�����ر仯����ƽ�⡢�����������Ӧ��ϵ,ȷ��������Olsen-Pũѧ��ֵ,Ϊ����������ʿ�ѧʩ���ṩ����֧�š�1 �����뷽��
1.1 �������ſ�
��س��ڷ�����ر�������λ�������ʼ��2008��,�ص�λ�ڹ���,ũҵũ�岿����ֲ��Ӫ����ʩ�ʼ�����ѧ�۲�ʵ��վ�ڣ�����108��2��50.2��,��γ23��14��49.0�壩,���θ߶�115 m���õش������ȴ���������,��ƽ������21.7��,�������40.7��,��5�����8 046��,���������1 250 mm,��������892.6 mm,��˪��ԼΪ346 d,�������ʱ��1 660 h,̫��������Ϊ4 529 MJ��m-2���¡��⡢����Դ�ḻ��1.2 ���Բ���
1.2.1 �������� ��ֲ�ĸ���Ʒ��2008��2010��Ϊ��̨��22��,2011��2013��Ϊ����28��,2014��2018��Ϊ����29�š�1.2.2 �������� ����Ϊ���ļͺ��������ij����,���鿪ʼǰ���㣨0��20 cm�������������ʣ�pH��H2O��5.68,�л���20.1 g��kg-1,ȫ��0.85 g��kg-1,�̬��5.58 mg��kg-1,��̬��0.9 mg��kg-1,��Ч��9.7 mg��kg-1,��Ч��53 mg��kg-1��
1.3 �������
ѡȡ���������3����ͬ��������1��������ʩ�ʣ�CK��;��2���Ż�ʩ�ʣ�OPT��;��3������ʩ�ף�OPT+P��,��ʩ����ΪOPT������1.5��,���ط�ʩ����ͬOPT����������������,3���ظ�,С�����24 m2����8 m����3 m����С��������40 cm��ˮ�����������﹡����12 cm,��40 cm,��������30 cm��,�����ʩ,����ˮ,Ϊ��Ȼ����ũҵ��ÿ��С�����Ӧ1���������ݻ�Ϊ1.5 m3�ľ����ռ��أ���3 m����1 m���� 0.5 m��,�������б�˳�,���ڼ����ر������IJ��������������ϸ��и���,С�������а�����ͨ�����ռ��ء�ʩ�ʴ������ط�ʩ����һ��,��2008��2010���2013��ʩ��120 kg��hm-2,2011��2012���Լ�2014��2018��ʩ��135 kg��hm-2�����������������أ�N 46%������þ�ʣ�P2O5 18%�����Ȼ��أ�K2O 60%����������ֲ��ʩ�ʷ����μ�����ƽ��[28]���ס��Ӳ��벡�溦�����뵱�ظ�����ֲһ�¡�
������ֲ�ƶ�Ϊ1����ֲ��-2��3������,����,2008��2011��2014��2018��Ϊ��ֲ���,2009��2012��2015��Ϊ��һ������2010��2013��2016Ϊ�ڶ�������2017��Ϊ����������
1.4 �ⶨ��Ŀ�ͷ���
����������գ���С���������,�ڸ����ջ��ڽ���С���ĸ���ȫ��ƽ���ջ�,��Ҷ,��ȥβ��,��ʵ����ⶨ�ᾥ��������Ҷ������ֲ����Ʒ�IJɼ���ⶨ���ڸ����ջ�ǰȡС��������һ�µĴ�����ֲ��6��,ƽ���ջ���H2SO4-H2O2����,�����ɫ������[29]��
�����ɼ���ⶨ��ÿ���ڸ����ջ��15 d��ʹ��ֱ��2 cm������,��X��ʽ�ɼ�0��20 cm ��������15��������,���ڷ��,ĥϸ��1 mm��0.25 mmɸ,�ֱ���̼�����ƽ���-�����ɫ���ⶨOlsen-P�����ͼ���-�����ɫ���ⶨ����ȫ����[29]��
����ˮ���IJɼ��������ײⶨ��������ƽ��[24]���ס�
1.5 ���ݴ�������[8,10,17]
������Բ���Yr=Yi/Ym��100
������Բ�����������Ч����Ӧ��ϵͨ��Mitscherlich����ģ��,��ʽ���£�
�ɷ���ģ�������Բ���Ϊ���ֵ��90%ʱ,������Ч�ĺ�����Ϊũѧ��ֵ��
ʽ��,Pi��ʾ�� i ����������;P0��ʾ��ʼ������Ч����;P2Ϊ������ֲ��2�������ȫ����;YrΪ�ᾥ����Բ�����t��hm-2��;YiΪÿ��������ᾥ������t��hm-2��;YmΪÿ�������������ᾥ������t��hm-2��;Y��Ԥ�����Բ���;A��������Բ���;b�Dz���������Olsen-P����Ӧϵ��;x��������Ч������
���ݲ���Excel 2007��������,DPS7.5��������,Sigmaplot������origin 8.0������ͼ����ͬ��������رȽϲ���Duncan�¸��������= 0.05����
2 ���
2.1 ����ȫ�����仯
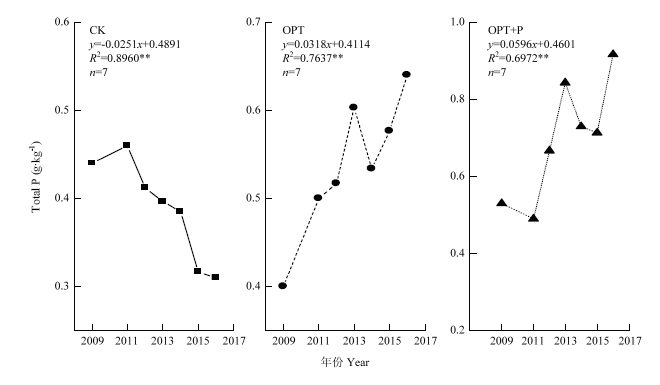
ͼ1��ʾ,����������ȫ�������������ֲ���ʼ�������ع�ϵ��CK��������ȫ�������������ʻ����½�,����ֲ�ڶ��꣨2009�꺬������0.44 g��kg-1�½���2016���0.31 g��kg-1,�½�����29.5%��ʩ���ʺ�,����ȫ���������������������ӡ�OPT��OPT+P�����ֱ������ڶ����0.40 g��kg-1��0.53 g��kg-1������2016���0.64 g��kg-1��0.92 g��kg-1,����60.0%��73.0%����Ϸ���,CK����ȫ��������Ϊ0.0251 g��kg-1��a-1,OPT��OPT+P����ȫ�����������ʷֱ�Ϊ0.0318��0.0596 g��kg-1��a-1���ɼ�,����������ֲ�������ʩ����,�����ĺĽ�,�������ؽ����ȱ��,ʩ������������ʩ������Ϸ������������ȫ������ͼ1
 �´��ڴ�|����ԭͼZIP|����PPT
ͼ1����ʩ���³�����������ȫ�����仯
Fig. 1Change of total P in latosolic red soil under long-term P fertilization
2.2 ����Olsen-P�����仯
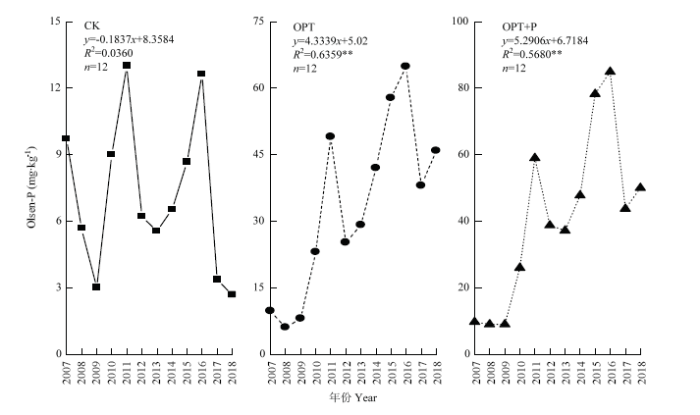
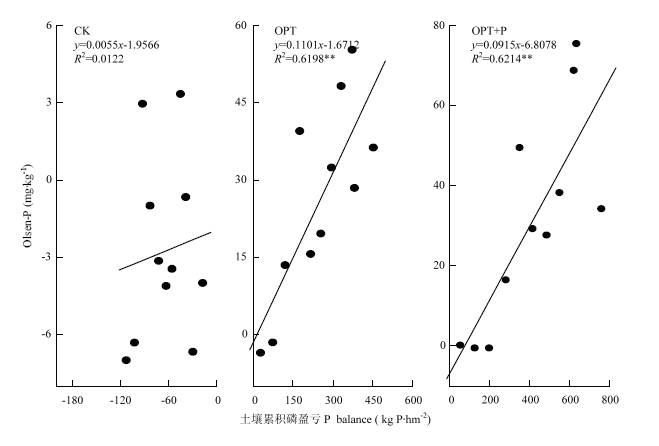
ͼ2��ʾ,CK��������Olsen-P�����仯�����ɡ�ʩ�ʺ�����Olsen-P�������������������ӳ��ֲ����������ơ�����,OPT��OPT+P�����ֱ�����鿪ʼ��9.7 g��kg-1������2018���45.8 mg��kg-1��50.0 mg��kg-1,�����ߴ�4.7����5.2������Ϸ���,Olsen-P�����������ʷֱ�Ϊ4.3��5.3 mg��kg-1��a-1��ͼ2
 �´��ڴ�|����ԭͼZIP|����PPT
ͼ2����ʩ���³�������������Ч�����仯
Fig. 2Change of Olsen-P in latosolic red soil under long-term P fertilization
2.3 �����ױ仯��������ӯ������Ӧ
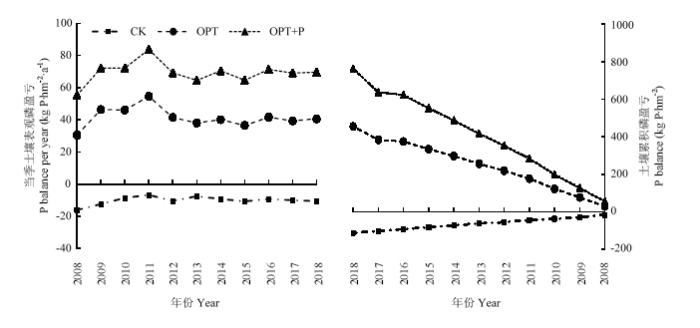
2.3.1 ��������ӯ����� ͼ3��ʾ,CK����11�굱������������ӯ�������ۻ���ӯ����ƽ���ֱ�Ϊ-10.2 kg P��hm-2��a-1��-112.1 kg P��hm-2��ʩ�ʴ�����������������ӯ������ӯ��״̬,11��ƽ������������ӯ�������������ۻ�ӯ�����ֱ�Ϊ41.3��69.2 kg P��hm-2��a-1��454.7��761 kg P��hm-2,��OPT+P������������OPT����67.5%����ƽ������������ӯ����ռʩ�����ı���OPT��OPT�����ֱ�Ϊ31.9%��35.6%��ͼ3
 �´��ڴ�|����ԭͼZIP|����PPT
ͼ3����ʩ����������ӯ���仯
Fig. 3Change of P balance under long-term P fertilization
˵������ʩ�Ӿ���������ӯ�ࡣ
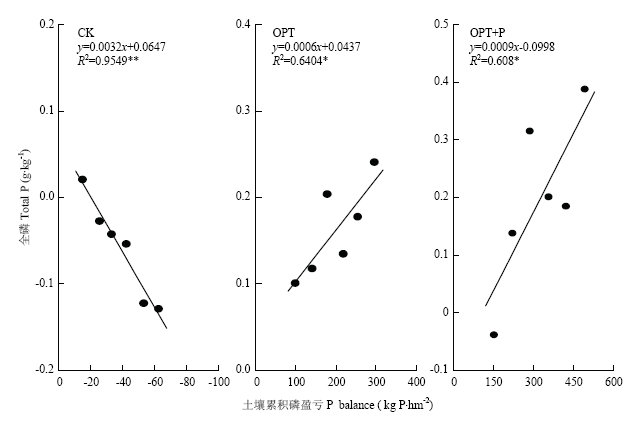
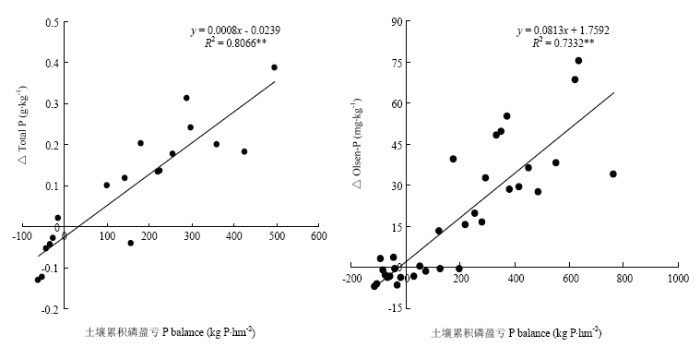
2.3.2 ����ȫ������Ч�ױ仯����������ӯ������Ӧ ͼ4��ʾ,����ȫ�ױ仯���������ۻ���ӯ������������P<0.05������������ع�ϵ��P<0.01����CK����ÿ��ȱ100 kg P��hm-2,����ȫ�����½�0.32 g��kg-1,OPT��OPT+P����ÿӯ��100 kg P��hm-2,ȫ��������0.06�� 0.09 g��kg-1��
ͼ4
 �´��ڴ�|����ԭͼZIP|����PPT
ͼ4������ʩ������ȫ�ױ仯���������ۻ�ӯ���Ĺ�ϵ
Fig. 4Correlations relationship between soil total P change and P balance under long-term P fertilization
CK��������Olsen-P�仯���������ۻ���ӯ��������ع�ϵ��ʩ������Olsen-P�仯���������ۻ���ӯ�����ʼ���������ع�ϵ��ͼ5,P<0.01����OPT������OPT+P��������ÿӯ��100 kg P��hm-2,Olsen-PŨ�ȷֱ�����11.0��9.1 mg��kg-1�����д����µ�����ȫ��Olsen-P�仯���������ۻ���ӯ�����Ĺ�ϵ����,���������ۻ���ӯ����������,����ȫ����Ч��������������,�����ÿӯ��100 kg P��hm-2,ȫ��Olsen-PŨ�ȷֱ�����0.08 g��kg-1��8.1 mg��kg-1��ͼ6����
ͼ5
 �´��ڴ�|����ԭͼZIP|����PPT
ͼ5������ʩ������Olsen-P�仯���ۻ���ӯ���Ĺ�ϵ
Fig. 5Correlations relationship between soil Olsen-P change and P balance under long-term P fertilization
ͼ6
 �´��ڴ�|����ԭͼZIP|����PPT
ͼ6�����ȫ��Olsen-P�仯���������ۻ���ӯ���Ĺ�ϵ
Fig. 6Correlations relationship between soil total P, Olsen-P change and P balance under all treatments
2.4 �ᾥ������������Ч����Ӧ
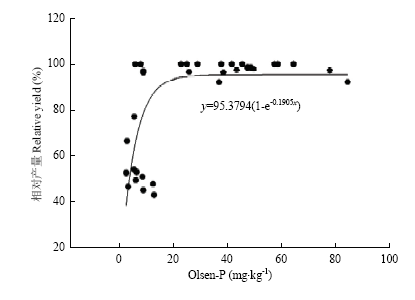
��ũѧ��ֵ��ָ�������е���Ч�����ﵽij��ֵ��,������������ʵļ���ʩ�ö�����,������������ʵ�ʩ����Ӧ���͡�ͼ7��ʾ,��Mitscherlich�������������Բ�����������Ч�Ĺ�ϵ��õij�����������Olsen-Pũѧ��ֵΪ12.1 mg��kg-1��ͼ7
 �´��ڴ�|����ԭͼZIP|����PPT
ͼ7������Բ�����������Ч����Ӧ��ϵ
Fig. 7Responses of relative yield of cane to soil Olsen-P content
2.5 ʩ���µر���������ʧ�仯����������Olsen-P�Ĺ�ϵ
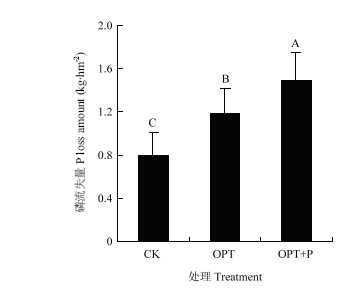
��11��ر���������ʧ������ƽ������,���������ͼ8��,��CK�������,ʩ�ʾ�������ߵر���������ʧ��49.5%��87.3%��ʩ�ʴ�����,����ʧ��OPT+P��������������OPT����25.2%���ɼ�ʩ��,��������ʩ�������������ͨ���ر�����;����ʧ�ķ��ա���ÿ�������ر���������ʧ��������Olsen-P���������������,���߳�������ع�ϵ��P<0.05������1����ͼ8
 �´��ڴ�|����ԭͼZIP|����PPT
ͼ8������ʩ���µر���������ʧ�� ��ͬ��ĸ��ʾ���켫����
Fig. 8Change of P loss amount under long-term P fertilization Different letters represent significant difference at 0.01 level
2.6 ʩ�����������ع���
ũѧ��ֵ�ͻ�����ֵ���������ع�������Ҫ���ݡ���������Olsen-P�������ڻ�����ֵʱ,Ӧ������������ʹOlsen-P�������͵�������ֵ��;��������Olsen-P��������ũѧ��ֵ�ֵ��ڻ�����ֵʱ,ʩ������������������൱;������Olsen-P��������ũѧ��ֵ,��Ҫʩ����ʹOlsen-P�ﵽũѧ��ֵ��Table 1
��1
��1�����ر���������ʧ��������Olsen-P�Ĺ�ϵ
Table 1
| ���Year | |||||||||||
|---|---|---|---|---|---|---|---|---|---|---|---|
| 2008 | 2009 | 2010 | 2011 | 2012 | 2013 | 2014 | 2015 | 2016 | 2017 | 2018 | |
| r | 0.910 | 0.895 | 0.965* | 0.956* | 0.999** | 0.966* | 0.969* | 0.999** | 0.998** | 0.957* | 0.962* |
�´��ڴ�|����CSV
���ڵ�11�������Olsen-P�����Լ��������ر仯����������ӯ���Ĺ�ϵ,�ο������͵�[13]�ں���������õ�����Olsen-P������ֵ,����ó�OPT��OPT+P����Olsen-Pˮƽ�ӵ�11�꽵��������ֵ��ʱ��ֱ���Ҫ12���16�꣨��2����
Table 2
��2
��2ʩ�ʴ�����11������Olsen-P��������������ֵ�����ʱ��
Table 2
| ���� Treatment | ÿ�����Я���� P amount in sugarcane (kg P��hm-2) | Olsen-P�仯�������ۻ�ӯ��������Ӧϵ�� Coefficient of Olsen-P variation and P balance | ��11������ Olsen-P ���� Olsen-P content in 11-year (mg��kg-1) | Olsen-P ������ֵ[13] Environment threshold (mg��kg-1) | ��ʩ��������Olsen-P����������ֵ�� ʱ��(��) Time need for Olsen-P decrease to environment threshold with no fertilization (a) |
|---|---|---|---|---|---|
| OPT | 18.36 | 0.1101 | 45.8 | 21.7 | 12 |
| OPT+P | 18.92 | 0.0915 | 50.0 | 21.7 | 16 |
�´��ڴ�|����CSV
3 ����
3.1 ��ʩ�ʳ�������غ����仯
ʩ��������Ӱ���������غ����仯����Ҫ��ʩ,����������Ӧ��ʩ�ʴ�ʩ����Ӧ��ͬ�������͡���ֲ����ȶ���,һ������Ҫ�벻ͬ��ֲ�����µ������ۻ���ӯ�����й�,��һ����,�����������ʡ�����Լ��л��ʵȶ����ع̶������IJ����й�[30]���о�����,��ʩ�������º������ض�С��-����������������ȫ����Ч������0.0003 g��kg-1��a-1��0.10 mg��kg-1��a-1�������½�,��ʩ������0.0194 g��kg-1��a-1��1.87 mg��kg-1��a-1����������[8],����С���ﲻʩ����0.004 g��kg-1��a-1��0.13 mg��kg-1��a-1�������½�,��ʩ������0.005 g��kg-1��a-1��0.02 mg��kg-1��a-1����������[31],���������˫��������ȫ������ʩ����0.002 g��kg-1��a-1�������½�,��ʩ��������ȫ����0.0033 g��kg-1��a-1����������[17]�����о�����,����11�겻ʩ��,���ڸ���ÿ���Я��,����ȫ����Ч���������ֲ�������ӷֱ���0.025 g��kg-1��a-1��ͼ1����0.18 mg��kg-1��a-1�����ʣ�ͼ2���½���ʩ�״��������׳���ӯ�ࣨͼ3��,OPT��OPT+P��������ȫ����Ч�ֱ���0.032 g��kg-1��4.3 mg��kg-1��a-1��0.060 g��kg-1��a-1��5.3 mg��kg-1��a-1�����ʣ�ͼ1��ͼ2������,ʩ����Խ��,���������ۻ���Խ��,����Ҫ��������ʩ��������,���OPT������OPT+P����������ߵ������൱,OPT+P���������ۻ���ӯ�������ߣ�ͼ3�����ɼ�,�ʵ�����ʩ��,��������ʩ������������������������Ч�Ե�������Ч��������������ֶ�λ�����о����һ��[8-9, 20, 32-33]��3.2 ���ر仯����ӯ��������Ӧ
�о�����,�������ر仯������ӯ�����������[8,10,30],��ͬ�������͡���ֲ���ʩ���ƶȻ�ͬһ����ͬһ����,�����������ʺ���ˮƽ�IJ���,�������ر仯������ӯ������Ӧ���������졣����ÿ�ۻ�ӯ��100 kg P��hm-2,��ʩ���ط�������ɫˮ����ȫ��Olsen-P�����ֱ�����0.16 g��kg-1��17.19 mg��kg-1[18],��������С������������ϵ���0.02��0.06 g��kg-1��3.00��5.22 mg��kg-1[8],�Ϸ�������˫������ʩ��������Olsen-P���4.5 mg��kg-1[10],��������������ɫ����ˮ��������Olsen-P�ֱ�ƽ�����1.12��3.76��2.34��5.04 mg��kg-1[19]�����о��������,���ڲ�ʩ��,����������������ص�����,����ȫ��������,�����ۻ�ӯ��100 P��hm-2,����ȫ���½�0.32 g��kg-1��ʩ�����������������ӯ��״̬,�����ۻ�ӯ��100 kg P��hm-2,����ȫ����OPT������OPT+P�����ֱ����0.06��0.09 g��kg-1,Olsen-P ����OPT������OPT+P�����ֱ����11.0��9.1 mg��kg-1���ɼ�,���ۻ���ȱ��,ȫ������Ӧ�����ۻ�ӯ����ȫ��������Ӧ������ʩ���ܴٽ�����ȫ���ۻ����ʹ���ʩ����������������ʧ���ա�3.3 ������Ч���������������������ʧ���������ع���
������ʴ������ر�������ʧ��һ����Ҫ����[34],��ͬ�Ⱦ���������,������ˮƽԽ��,����ʧ��Խ��ʩ��,��������ʩ���������ӵر���������ʧ����ͼ8��,������������ˮƽ�����ϸ��йء��ر���������ʧ��������Olsen-P����������������أ���2��Ҳ���֤������һ�㡣�ɴ˿ɼ�,ʩ�������������ˮƽ��ͬʱ��������ͨ���ر�������ʧ��ɻ�����Ⱦ�ķ��ա�����������Ӧע���������صľ����,���ߵ��������ص���������ʧ���ռӾ�,���͵����������ֳ�Ϊ�����������������ӡ�����Olsen-Pũѧ��ֵ�������������ЧӦ����Ҫ�ο�ָ�ꡣ�о���Ϊ,������Olsen-P�����ϵ�ʱ,Olsen-P�������������������������,������Olsen-P�����ﵽũѧ��ֵʱ,Olsen-P�������������������������������[8]�����о�����Mitscherlich������ϻ�ø����ũѧ��ֵΪ12.1 mg��kg-1,�����������[22]�ڳ������10.5 mg��kg-1��Ϊ����ˮƽ�������Ǻ�,Ҳ��κ�͵�[31]�ڳ���С��ػ�õ�ũѧ��ֵ��13.41 mg��kg-1�����,�����������[8]�ں�������õ�С��أ�21.5 mg��kg-1��������Olsen-P��32.9 mg��kg-1��ũѧ��ֵ,����Ҫ��������������Լ������Ⱦ���Ӱ��������ũѧ��ֵ�����ء�
���ڲ����뻷���������濼��,������������˽��ͻ�����Ⱦ���յ��������Olsen-P����������ũѧ��ֵ�뻷����ֵ֮�䡣���о���������ʩ��3��,����Olsen-P�����������ʼ��9.7 mg��kg-1������23.0��26.0 mg��kg-1,����������Olsen-P������ֵ��21.7 mg��kg-1��[13],�ڵ�11������Olsen-P�������Ǹߴﻷ����ֵ��2������,�Ӿ�����������ͨ���ر�������������ʧ��Ⱦˮ��ķ��ա�������ֲ��11�꣨2018�꣩������Olsen-P����,���ò�ʩ�ʷ�ʽ��Ҫ12��16��ʱ������Olsen-P�������ܽ���������ֵ,����Ȼ������������Ӱ�졣���,����ʩ�ʴ����������ۻ�ӯ��������������Olsen-P����Ӧ��ϵ,�ڳ�ʼ����Olsen-P����ԼΪ10 mg��kg-1�ij��������,��120��135.5 kg P2O5��hm-2ʩ����,�ڸ�����ֲ�ĵ�2��3����ø���ʩ�Ĵ�ʩ����ά������Olsen-P��������ũѧ��ֵ�뻷����ֵ֮�䡣
4 ����
����ʩ��������һֱ����ӯ��״̬,����ʩ����������ӯ��������,����ȫ��Olsen-P�����ۻ�������������,�ر���������ʧ����������ȫ����Ч�ױ仯������������ӯ��������������ع�ϵ������Olsen-P ũѧ��ֵΪ12.1 mg��kg-1������������Olsen-P����ԼΪ10 mg��kg-1,ʩ��120��135.5 kg P2O5��hm-2���Ӹ�����ֲ�ĵ�2��3����ø���ʩ��,��ά������Olsen-P��������ũѧ��ֵ�뻷����ֵ֮�䡣�ο����� ԭ��˳��
������ȵ���
������������
�����ڿ�Ӱ������
DOI:10.1111/sum.2005.21.issue-s1URL [��������: 1]
[��������: 1]
[��������: 1]
[��������: 1]
[��������: 1]
[��������: 1]
[��������: 1]
URL [��������: 1]

Soil phosphorus (P) availability directly determines cropland productivity. Based on the long-term fertilization experiments in different climatic zones of China, this paper summarized the P content, its availability, and the factors affecting the P transformation in China cropland soils. The total and available P contents in different types of China cropland soils were 0.31-1.72 g·kg-1�� and 0.1-228.8 mg·kg-1��, respectively. Soil parent material, soil physical and chemical prosperities, and fertilization practices were the main factors affecting the soil P availability. It was suggested that more attentions should be paid on the mixed application of organic manure and chemical fertilizers to improve the P availability of cropland soils and on the potential environmental impacts of this fertilization.
URL [��������: 1]
Soil phosphorus (P) availability directly determines cropland productivity. Based on the long-term fertilization experiments in different climatic zones of China, this paper summarized the P content, its availability, and the factors affecting the P transformation in China cropland soils. The total and available P contents in different types of China cropland soils were 0.31-1.72 g·kg-1�� and 0.1-228.8 mg·kg-1��, respectively. Soil parent material, soil physical and chemical prosperities, and fertilization practices were the main factors affecting the soil P availability. It was suggested that more attentions should be paid on the mixed application of organic manure and chemical fertilizers to improve the P availability of cropland soils and on the potential environmental impacts of this fertilization.
[��������: 1]
[��������: 1]
[��������: 1]
[��������: 1]
DOI:10.3864/j.issn.0578-1752.2019.21.012URL [��������: 11]
��Objective�� Change characteristic of phosphorus (P) in red soil were quantified under long term different fertilizations, and effects of P on soil productivity were studied, so as to provide a theoretical basis for P management in red soil regions in southern China. ��Method�� Change of soil Olsen-P and total P content was compared under long term no P fertilization (CK, N, NK), chemical P fertilizer (PK, NP, NPK), application of chemical fertilizer combined with half crop straw return (NPKS) and application of organic manure and chemical fertilizer combined with organic manure (1.5NPKM, NPKM, M) using long term trial platform in the upland red soil (from 1991-2016). Responses of soil P to P balance were analyzed. Different models were used to fit the response curve of crops yield to Olsen-P in the red soil. The critical P value of soil Olsen-P for crop yield (CV) was calculated. ��Result�� The Olsen-P and total P increased, and P activation coefficient (PAC) promoted under long term P fertilization in the red soil. PAC was higher under application of organic manure and chemical fertilizer combined with organic manure (1.5NPKM, NPKM, M) than that under application of chemical fertilizer combined with half crop straw return (NPKS) and chemical P fertilizer (PK, NP, NPK). Changes of Olsen-P and total P were significantly affected by P balance (P<0.01). Soil Olsen-P increased by 3.00-5.22 mg·kg -1, and total P increased by 0.02-0.06 g·kg -1 with 100 kg P·hm -2 cumulative surplus in the red soil. The Olsen-P decreased with years under long term no P fertilization (CK, N, NK), and they decreased by 1.85 mg·kg -1, 0.40 mg·kg -1, and 1.76 mg·kg -1, respectively, with 100 kg P·hm -2 cumulative deficiency in the red soil. Grain yields of wheat and maize were significant higher under application of organic manure and chemical fertilizer combined with organic manure (1.5NPKM, NPKM, M) than that under application of chemical fertilizer combined with half crop straw return (NPKS) and chemical P fertilizer (PK, NP, NPK) than under no P fertilizations (CK, N, NK). Sustainability index of grain yield (SYI) were higher under application of organic manure and chemical fertilizer combined with organic manure (1.5NPKM, NPKM, M) than that under the other treatments. Three models (linear-linear model, linear-platform model and Michelice model) were better fit the response of crop yield to Olsen-P in red soil (P<0.01). Linear-linear model was recommended for the higher R 2. The critical value of Olsen-P content in agronomic in red soil of wheat and maize were 13.5 mg·kg -1, and 23.4 mg·kg -1, respectively, calculated by linear-linear mode. ��Conclusion�� Application of chemical fertilizer combined with organic manure were recommended in red soil region of southern China. That had the beneficial for P accumulation and promoting P availability. Applications of chemical fertilizer combined with organic manure were also used to keep the high and stable production. Linear-linear model was recommended to calculate the critical value of Olsen-P content in agronomic. Application rates of P fertilizer should be adjusted timely according to the difference between actual Olsen-P content in the soil and critical value of Olsen-P content in agronomic in productivity.
[��������: 3]
[��������: 3]
[��������: 5]
[��������: 5]
[��������: 1]
DOI:10.1016/j.fcr.2016.04.006URL [��������: 1]
[��������: 4]
[��������: 4]
DOI:10.1007/s10705-012-9530-0URL [��������: 1]
Limited information on soil available phosphorous (P) status has restricted rational P-management strategies, which are necessary to develop, budget, and control P fertilizer inputs. This study was conducted to quantify the relationship between the P budget (P input minus output) and soil available P content (Olsen-P) and its variation from seven long-term experiments that covered subtropical and temperate zones with seven crop systems and six soil types. Across all years and experiments, soil available P content increased linearly with increasing P budget (P < 0.01), and the increase in soil available P content in the 0-20 cm topsoil layer by each 100 kg P budget was 1.44-5.74 mg kg(-1) for the seven sites. This large variation can be explained by the different environments, crop systems, and soil physico-chemical properties. These results will help to predict long-term changes in soil available P using the annual P budget and provide useful information for proper management of P fertilizer.
DOI:10.3864/j.issn.0578-1752.2019.21.013URL [��������: 2]
��Objective�� In this study, the changes of phosphorus profit and loss as well as various forms of inorganic phosphorus in fluvo-aquic soil under long-term fertilizer application, and the effect of soil phosphorus profit and loss on inorganic phosphorus were discussed, which provided a theoretical basis for the rational application of phosphorus fertilizer in fluvo-aquic soil.��Method�� Based on the “National Long-term Monitoring Station for Soil Fertility and Fertilizer Benefit in Fluvo-aquic Soil”, the four fertilization modes in North China including NPK (single chemical fertilizer), SNPK (straw return), MNPK (organic-inorganic combined application), 1.5 MNPK (high amount of organic-inorganic combined application), were studied with the control of NK (non-phosphate fertilizer) to study the changes of apparent phosphorus profit and loss, cumulative phosphorus profit and loss, the content and relative content of each form of inorganic phosphorus, and the effect of soil phosphorus profit and loss on each form of inorganic phosphorus.��Result�� Under the condition of not applying phosphate fertilizer for 25 years, the phosphorus in the soil was always in a state of deficit, the cumulative deficit of phosphorus in soil was 431.8 kg·hm -2, after 25 years, the cumulative surplus of soil phosphorus on four phosphate fertilizer models (NPK, SNPK, MNPK, and1.5MNPK) was 291.2, 398.4, 1 742.4, and 2 676.9 kg·hm -2, respectively. When phosphorus fertilizer was not applied for a long time, Ca2-P decreased most in soil inorganic phosphorus by 49.0%. In the first 13 years, the soil Ca2-P of the above four fertilizer models increased by 1.2-5.4 times, with an average annual increase of 1.26-5.73 mg·kg -1. In the latter 12 years, the growth rate of soil Ca2-P decreased by 99.2%-112.6% by applying chemical fertilizer single, straw returning and organic-inorganic combined application model; and the content of Ca2-P in the soil decreased by 2.0 mg·kg -1 per year. The relative content of soil Ca2-P increased by 1.0%-3.5% in 25 years above four fertilizer models. After 25 years of application of phosphate fertilizer, the content of Ca8-P, Al-P, and Fe-P in soil increased 1.4-6.5, 1.8-3.3, and 1.1-2.2 times, respectively, with an average annual increase of 4.69-19.81, 1.67-3.10, and 1.23-2.37 mg·kg -1, respectively; the relative content increased 8.4%-3.0%, 3.3%-4.0%, 1.8%-3.3%, respectively. The contents of Ca10-P and O-P were oscillatory between 350-410 and 100-160 mg·kg -1 for a long time, but their relative contents decreased by 11.4%-29.7% and 3.1%-8.9%, respectively. Under the condition of not applying phosphate fertilizer for 25 years, for every 100 kg P·hm -2 cumulative deficit, Ca2-P, Ca8-P, Al-P, Fe-P, Ca10-P, and O-P in soil decreased by 1.2, 2.7, 1.1, 1.5, 0.8, and 7.5 mg·kg -1, respectively. Under the mode of single fertilizer and straw returning for 25 years, for every 100 kg P·hm -2 cumulative surplus, Ca2-P, Ca8-P, Al-P, Fe-P, Ca10-P, and O-P in soil increased by 3.9-5.0, 21.5-21.6, 6.5-7.4, 4.8-5.6, 4.0-7.5, and 2.4-7.2 mg·kg -1, respectively. Under the mode of organic and inorganic combined application for 25 years, for every 100 kg P·hm -2 cumulative surplus, Ca2-P, Ca8-P, Al-P, Fe-P, Ca10-P, and O-P in soil increased by 1.8-2.8, 14.2-16.4, 2.5-3.2, 1.9-2.6, -0.2-1.2, and 0.3-1.9 mg·kg -1, respectively. ��Conclusion�� The long-term application of phosphorus fertilizer could increase the surplus of phosphorus and the content and its relative content of Ca2-P, Ca8-P, Al-P, and Fe-P in fluvo-aquic soil, and the effect of organic and inorganic combined application was higher than that of single chemical fertilizer and straw returning. When the surplus of phosphorus in fluvo-aquic soil was the same, the increment of Ca8-P was the most in all fertilizer models, followed by Al-P and Fe-P, and the increment of Ca2-P, Ca8-P, Al-P, and Fe-P in soil with single chemical fertilizer was higher than that of straw returning and organic and inorganic combined application.
DOI:10.1016/S2095-3119(13)60684-XURL
[��������: 2]
[��������: 2]
[��������: 1]
[��������: 1]
DOI:10.3864/j.issn.0578-1752.2015.23.014URL [��������: 1]
��Objective��The objective of this study is to clarify the changes in available phosphorus (P) and its response to P balance (P input minus P output), and to provide a scientific basis for rational fertilization.��Method��Twenty-one monitoring sites of the main five types of soil in China with long-term conventional fertilization were chosen to explore the relationships of change of available P and P balance, available P efficiency (available P efficiency refers to the change of available P by the unit of accumulated P budget) and soil properties (pH, soil organic matter, total nitrogen and alkaline-hydrolyzable nitrogen).��Result��The P was exhausted at two monitoring sites, and accumulated at nineteen sites. The P balance in different sites ranged from -290-4 919 kg·hm-2 under conventional fertilization. Soil available P increased at 14 monitoring sites, and decreased at 2 sites. Available P increased significantly by 0.74 mg·kg-1 each year at 21 monitoring sites. Among all the sites, 81% have a significant positive correlation between changes of available P and soil P balance. Available P increased by 1.12, 3.76, 5.01, 2.34, and 0.47 mg·kg-1 with an average surplus of 100 kg P·hm-2 under fluvo-aquic soil, black soil, paddy soil, purplish soil and irrigation-silted soil. And the coefficient of variation was 25%, 52% and 68% under fluvo-aquic soil, paddy soil and purplish soil. Available P efficiency in the conventional fertilization soil was significantly correlated with the soil pH (r=0.65, P<0.01), soil organic matter content (r=0.62, P<0.01), total nitrogen (r=0.52, P<0.01) and alkaline-hydrolyzable nitrogen (r=0.63, P<0.01) .��Conclusion��The available P efficiency of different soil types ranged from 0.47-10.76 mg·kg-1. The overall trend in available P efficiency across all soil types was paddy soil>black soil>purplish soil>fluvo-aquic soil>irrigation-silted soil. The available P efficiency in the conventional fertilization soil was significantly correlated with the soil pH, soil organic matter, total nitrogen, and alkaline-hydrolyzable nitrogen.
URL [��������: 2]
��Objective�� Response of Olsen-P to P balance in a black loessial soil was studied in a long-term fertilization experiment carried out in Pingliang, Gansu province for the purpose of providing a theoretical basis for the scientific application of phosphate fertilizer in the Loess Plateau dryland farming areas. ��Method�� The relationships between Olsen-P change and the budget of soil P balance in the treatments of CK, N, NP, M, NPM were studied by the method of linear regression based on a 28-year (1979-2007) experiment. ��Result�� The results showed that long-term application of M, NP, and NPM resulted in significant increase of Olsen-P by 0.54, 0.64 and 1.11 mg?kg-1?a-1, respectively. While the soil Olsen-P content remained stable or showed a decreasing trend in the CK and N treatments. The increase amount of Olsen-P changed with P balance. Application of NP, M, NMP increased the amount of Olsen-P significantly. The P balance was very significantly (P��0.01) correlated with the Olsen-P. With an average surplus of 100 kg phosphorus per hm2, the soil Olsen-P increased by 3.85, 0.29 and 0.53 mg?kg-1, in the NP, M, and NPM treatments, respectively. Application of chemical fertilizer increased Olsen-P was 11.6 times higher than that of manure, followed by the chemical fertilizer combined with manure. ��Conclusion�� Changes of soil Olsen-P followed soil phosphorus surplus and the close correlation between the increased amount of Olsen-P and the form applied phosphorus were observed. Long-term application of chemical P fertilizer resulted in the increase of the amount of Olsen-P is higher than manure obviously in black loessial soil.
[��������: 1]
[��������: 1]
[��������: 2]
[��������: 2]
[��������: 1]
[��������: 1]
[��������: 2]
[��������: 2]
URL [��������: 1]
URL [��������: 1]
[��������: 1]
[��������: 1]
[��������: 1]
[��������: 1]
DOI:10.3864/j.issn.0578-1752.2018.10.012URL [��������: 1]
��Objective�� This study was conducted to explore the response of the sugarcane yield stability, fertilizer contribution rate and N, P loss in runoff under long-term different fertilization, with an aim to provide scientific references for establishing the optimal fertilization pattern and promoting the sustainable production of sugarcane as well as the quality of agroecosystem improvement.��Method�� Four different fertilization treatments (non-fertilization (CK), optimum fertilization (OPT), application of 50% N increase based on OPT (OPT+N) and application of 50% P2O5 increase based on OPT (OPT+P)) were chosen from an 8-years fertilization filed experiment. The changes of annual sugarcane stem yield, fertilizer contribution rate and N, P loss in runoff were investigated. ��Result�� At the first 4 years of planting, sugarcane yield declined sharply, and then kept equilibrium around 50 t·hm-2, while fertilization treatments showed a fluctuation in different years, and kept the same trend in the same year. Fertilization significantly increased the sugarcane yield and its stability. With an average of 8 years, sugarcane yield under fertilizer treatments was 70% higher than that under CK. However, there was no significant increase between OPT and OPT+N treatments in sugarcane yield, while OPT was higher than OPT+N treatment. There was no significant difference among fertilizer treatments in sugarcane yield stability. The soil contribution rate in sugarcane field declined sharply at the first 4 years of planting, while fertilizer contribution rate showed the opposite trend, and then both of them basically stabled at around 50%. Both of fertilizer contribution rate and agronomic efficiency in OPT treatment were significantly higher than or equal to OPT+N and OPT+P treatments. Fertilization significantly increased N and P runoff loss. Excessive application of N and P fertilizer significantly increased the corresponding N and P loss, but not N (P) fertilizer loss rate. ��Conclusion�� Excessive application of N and P not only had no advantage in sugarcane yield and its stability, but also resulted in waste of resources and increase of nutrient loss. OPT treatment was a better fertilization model for high and stable yield of sugarcane, high fertilizer contribution rate and low nutrient loss.
[��������: 2]
[��������: 2]
DOI:10.1371/journal.pone.0131713URLPMID:26177293 [��������: 2]
The Olsen phosphorus (P) concentration of a soil is a key index that can be used to evaluate the P supply capacity of the soil and to estimate the optimal P fertilization rate. A study of the relationship between the soil Olsen P concentration and the P balance (P input minus P output) and their variations among different fertilization patterns will help to provide useful information for proper management of P fertilization. In this paper, the two investigated long-term experiments were established on black soils in the northeast region of China. Six fertilization treatments were selected: (1) unfertilized (CK); (2) nitrogen only (N); (3) nitrogen and potassium (NK); (4) nitrogen and phosphorus (NP); (5) nitrogen, phosphorus, and potassium (NPK); and (6) nitrogen, phosphorus, potassium and manure (NPKM). The results showed that the average Olsen P concentrations in the black soils at Gongzhuling and Harbin (16- and 31-year study periods, respectively), decreased by 0.49 and 0.56 mg kg-1 a-1, respectively, without P addition and increased by 3.17 and 1.78 mg kg-1 a-1, respectively, with P fertilization. The changes in soil Olsen P concentrations were significantly (P<0.05) correlated with the P balances at both sites except for the NP and NPK treatments at Gongzhuling. Under an average deficit of 100 kg ha-1 P, the soil Olsen P concentration at both sites decreased by 1.36~3.35 mg kg-1 in the treatments without P addition and increased by 4.80~16.04 mg kg-1 in the treatments with 100 kg ha-1 of P accumulation. In addition, the changes in Olsen P concentrations in the soil with 100 kg ha-1of P balance were significantly correlated with the P activation coefficient (PAC, percentage of Olsen P to total P, r=0.99, P<0.01) and soil organic matter content (r=0.91, P<0.01). A low pH was related to large changes of Olsen P by 1 kg ha-1 of P balance. These results indicated that soil organic matter and pH have important effects on the change in soil Olsen P by 1 kg ha-1 of P balance.
[��������: 2]
[��������: 2]
[��������: 1]
[��������: 1]
DOI:10.3864/j.issn.0578-1752.2016.06.009URL [��������: 1]
��Objective�� In order to reveal the impact of various fertilization treatments on the characteristics of paddy soil phosphorus (P) evolution, and its response to soil P balance. We analyzed the annual variation of soil available P content, total P content, soil P balance, and phosphorus activation coefficient (PAC). ��Method�� This study was based on a long-term different fertilization experiment of paddy soil in subtropical China that was established in 1982. The different fertilization treatments included non-fertilization (CK), cattle manure (M), chemical nitrogen (N), P and potassium (K) fertilizer (NPK), NPK with M (NPKM), N and P fertilizer with M (NPM), N and K fertilizer with M (NKM), and P and K fertilizer with M (PKM). The annual variation characteristics of soil available P content, total P content, soil P balance, and PAC from 1982 to 2012 were analyzed. ��Result�� Soil available P content improved efficiently through fertilizer application. The change rate of soil available P content of M, NKM, NPK, NPM, NPKM, and PKM was 0.18, 0.20, 0.83, 1.35, 1.46, and 1.62 mg·kg-1·a-1, respectively. The soil total P content was on the decline under non-fertilization. The change rate of the soil total P content of M, NPK, PKM, NPM, and NPKM was 4.3, 15.4, 16.0, 18.3, and 22.9 mg·kg-1·a-1, respectively. All the fertilizer treatments had a P surplus no matter whether applying chemical fertilizer or cattle manure. The P apparent balance was significantly correlated with the Olsen-P increment (P<0.05). With an average surplus of 100 kg P·hm-2, the soil Olsen-P increased by 0.4, 0.7, 1.9, 2.1, 2.2, and 3.2 mg·kg-1, in the M, NKM, NPM, NPKM, PKM, and NPK treatments, respectively. The PAC of NPK was significantly higher than M and NKM (P<0.05), while there was no significant difference in the soil P surplus amount among these treatments. ��Conclusion��Applying chemical P fertilizer plus cattle manure can significantly improve the soil available P, total P content, and PAC, compared with the treatments that applied chemical fertilizer or cattle manure alone.
DOI:10.1007/s10705-015-9718-1URL [��������: 1]
