 ,1, 梁诗涵1, 邱军2, 高金锋1, 高小丽1, 王鹏科1, 冯佰利,1, 杨璞,1
An Examination on Breeding Status Quo of Chinese Tartary Buckwheat Varieties Based on the National Cross-Country Tests of Tartary Buckwheat Varieties in China over 12 Consecutive Years
WU CaoYang,1, LIANG ShiHan1, QIU Jun2, GAO JinFeng1, GAO XiaoLi1, WANG PengKe1, FENG BaiLi,1, YANG Pu,1通讯作者:
责任编辑: 李莉
收稿日期:2019-12-15接受日期:2020-04-13网络出版日期:2020-10-01
| 基金资助: |
Received:2019-12-15Accepted:2020-04-13Online:2020-10-01
作者简介 About authors
吴曹阳,E-mail:

摘要
关键词:
Abstract
Keywords:
PDF (835KB)元数据多维度评价相关文章导出EndNote|Ris|Bibtex收藏本文
本文引用格式
吴曹阳, 梁诗涵, 邱军, 高金锋, 高小丽, 王鹏科, 冯佰利, 杨璞. 基于连续12年国家苦荞区域试验的中国苦荞品种选育现状分析[J]. 中国农业科学, 2020, 53(19): 3878-3892 doi:10.3864/j.issn.0578-1752.2020.19.003
WU CaoYang, LIANG ShiHan, QIU Jun, GAO JinFeng, GAO XiaoLi, WANG PengKe, FENG BaiLi, YANG Pu.
0 引言
【研究意义】苦荞(Fagopyrum tataricum (L.) Gaertn)属蓼科荞麦属,是荞麦属2个栽培种之一,是起源于中国的古老农作物,也是重要的出口创汇农产品[1,2]。中国苦荞地域分布南北纵越20°,东西横越37°,垂直高度4 000 m,主要集中分布在云南省、四川省、贵州省、西藏自治区、甘肃省、陕西省、山西省等高海拔地区,具有耐干旱、耐贫瘠、耐寒冷及适应能力强等特性,是这些地区不可或缺的特色农作物。按照区划布局、栽培特点和耕作制度,苦荞产区可以划分为4个生态区,即北方春荞麦区、北方夏荞麦区、南方秋冬荞麦区和西南高原春秋荞麦区。其中,北方春荞麦区和西南高原春秋荞麦区是苦荞主产区。苦荞不仅富含淀粉、脂肪、蛋白质、矿物质及钙、铁、磷、锌、碘、铜、铂、硼、钴等营养成分[3],还富含生物类黄酮[4],具有降血脂血糖、降胆固醇、抗氧化、防癌等功效[5,6,7]。因此,筛选和培育高产优质苦荞品种,集成示范抗逆高产栽培技术是实现产区农民增产增收的主要途径之一。品种区域试验是育成品种丰产性、适应性评价的重要依据,参试品种的产量、品质和农艺性状表现代表一定时期内育种水平的高低。系统分析连续多年苦荞区域试验品种的性状表现和特性,剖析当前苦荞育种存在的主要问题,为未来苦荞品种选育提供参考。【前人研究进展】中国从20世纪70年代末开始苦荞种质资源的收集、保存工作。20世纪80年代初,云南省、贵州省、四川省、陕西省、甘肃省、山西省等地的科研单位先后开展了苦荞的育种工作,到20世纪80年代,苦荞的育种单位有10多个;目前,全国苦荞育种单位比过去略有增加,已增至20余个。从1984年开始,由山西省农业科学院牵头组织开展了国家荞麦区域试验(3年/轮),至2000年共进行了5轮,鉴定了一些优良苦荞品种,在生产上发挥了重要作用。2001年种子法实施后,苦荞被国家列为非审定作物。从2002年开始,由西北农林科技大学组织开展了第6—12轮国家苦荞区域试验,考察了参试品种的生育期、株高、主茎分枝数、主茎节数、单株粒重、千粒重、产量、淀粉含量、蛋白质含量、黄酮含量等性状。与此同时,苦荞主产省区也开展了省级苦荞品种区域试验。通过苦荞品种区域试验平台,先后有35个苦荞品种通过国家和省级鉴定[8]。通过剖析苦荞参试品种的性状间关系,发现产量与单株粒数、主茎节数之间存在显著的关联[9]。在水稻[10,11]、小麦[12,13]、玉米[14,15]等作物的研究中,通过分析连续多年的品种数据均为后期品种改良提出了建设性意见。研究发现,通过改良产量构成因子,有望进一步提高作物产量[16]。除了产量及相关性状以外,品质性状也是影响作物品种鉴定的重要因素[17],特别是一些专用品种的审定[18]。在国家苦荞品种区域试验中,主要关注了碳水化合物含量、脂肪含量、蛋白质含量和黄酮含量,对于在水稻、玉米、小麦等作物[19,20,21]选育中广泛关注的优质[22]、耐密植[23]、早熟[24]、多抗[25]、适宜机械化[26]和专用[27]等方向均缺少足够关注。苦荞作为药食同源作物,市场开发前景广阔。但中国对于苦荞的科研工作起步相对较晚,育种技术落后、现有品种产量低且不稳定[28]。因此,在利用传统的诱变育种、杂交育种及杂种优势利用等育种技术的基础上,如何加强分子育种技术研发与应用,进而培育优质高产专用品种是苦荞生产亟待解决的关键问题。【本研究切入点】长期以来,苦荞属于小宗作物,农业生产上多种植于高寒、丘陵地区。水资源匮乏、交通不便、生产方式落后、管理粗放、消费量低和地域性强等因素综合作用导致苦荞产量一直处于较低且不稳定的水平,生产能力徘徊不前[29]。另外,苦荞品种改良未获突破性进展,也严重制约了中国苦荞产业发展[30]。因此,分析国家苦荞品种区域试验数据,梳理连续4轮(12年)国家苦荞区域试验参试品种的性状变化,比较不同年份、不同育种单位品种间的差别,探究目前苦荞育种工作中存在的问题,为未来苦荞品种改良提供参考。【拟解决的关键问题】本研究通过对2003—2014年参试的所有苦荞品种(北方组和南方组)的主要农艺性状进行分析,研究不同年份和不同育种单位品种间的性状差异及其对产量的影响,为苦荞品种改良提供理论依据。1 材料与方法
1.1 试验材料
2003—2014年国家共进行了4轮苦荞区域试验,分别是2003—2005年、2006—2008年、2009—2011年和2012—2014年。参加苦荞区域试验的品种共有42个,由来自9个省(市)的19个单位供种(电子附表1)。在这4轮苦荞区域试验中,共有46个试点参加试验,依据中国南北方地理划分标准将苦荞区试试点分为北方组和南方组,其中北方组24个,南方组22个。每轮试验的区试点数为9—15个,参试品种9—14个(电子附表2),采用随机区组排列,重复3次,小区面积10 m2,行距33 cm,各试点留苗密度在60万—90万株/hm2。试验点均选择中等地力的土地,田间管理水平保持一致,每轮试验所用对照品种均为九江苦荞(以CK表示,下同)。Table 1
表1
表12003—2014年北方组苦荞产量和农艺性状表现
Table 1
| 省(区) Province | 性状 Traits | 年份 Year | 平均 Average | |||
|---|---|---|---|---|---|---|
| 2003—2005 | 2006—2008 | 2009—2011 | 2012—2014 | |||
| 陕西省 Shaanxi | 生育日数Growing duration (d) | 102.67±6.81 | 93.00±1.00 | 88.33±2.31 | 88.00±2.60 | 93.00±6.84 |
| 株高Plant height (cm) | 138.20±6.06 | 109.70±2.65 | 113.00±2.23 | 119.06±5.28 | 119.99±12.74 | |
| 主茎分枝数Branch numbers | 5.73±0.12 | 5.50±0.36 | 5.80±0.75 | 5.53±0.48 | 5.64±0.15 | |
| 主茎节数Node numbers | 14.67±1.07 | 15.40±0.36 | 15.83±0.46 | 15.16±0.49 | 15.26±0.49 | |
| 单株粒重Grain weight per plant (g) | 5.53±0.45 | 3.93±0.59 | 3.40±0.56 | 4.03±0.97 | 4.23±0.92 | |
| 千粒重1000-grains weight (g) | 17.63±0.06 | 20.50±1.35 | 19.73±0.57 | 17.07±1.64 | 18.73±1.64 | |
| 产量Yield (kg·hm-2) | 2370.31±160.90 | 2005.36±436.53 | 1964.58±151.75 | 2141.59±278.50 | 2120.46±182.96 | |
| 甘肃省 Gansu | 生育日数Growing duration (d) | 103.33±5.69 | 88.00±1.00 | 90.00±2.45 | 91.00±1.73 | 93.08±6.95 |
| 株高Plant height (cm) | 126.70±5.93 | 102.43±1.33 | 114.43±4.51 | 131.53±1.34 | 118.78±13.06 | |
| 主茎分枝数Branch numbers | 6.10±0.26 | 6.80±0.62 | 6.03±0.85 | 5.47±0.60 | 6.10±0.55 | |
| 主茎节数Node numbers | 14.57±0.90 | 14.63±0.29 | 15.77±0.64 | 16.50±0.26 | 15.37±0.93 | |
| 单株粒重Grain weight per plant (g) | 4.50±0.36 | 3.77±0.31 | 3.82±0.49 | 4.97±1.80 | 4.26±0.58 | |
| 千粒重1000-grains weight (g) | 18.50±0.44 | 17.70±1.56 | 18.62±0.85 | 15.73±1.12 | 17.64±1.33 | |
| 产量Yield (kg·hm-2) | 2113.76±262.60 | 1854.51±427.81 | 1777.91±99.09 | 2390.61±339.56 | 2034.20±277.69 | |
| 山西省 Shanxi | 生育日数Growing duration (d) | - | 93.33±2.89 | - | 85.17±1.33 | 89.25±5.77 |
| 株高Plant height (cm) | - | 120.27±1.42 | - | 116.17±5.25 | 118.22±2.90 | |
| 主茎分枝数Branch numbers | - | 6.40±0.36 | - | 5.25±0.56 | 5.83±0.81 | |
| 主茎节数Node numbers | - | 15.93±0.42 | - | 14.05±0.47 | 14.99±1.33 | |
| 单株粒重Grain weight per plant (g) | - | 4.47±0.06 | - | 4.30±0.69 | 4.38±0.12 | |
| 千粒重1000-grains weight (g) | - | 18.03±1.07 | - | 17.30±0.83 | 17.67±0.52 | |
| 产量Yield (kg·hm-2) | - | 2048.89±341.89 | - | 2278.20±214.09 | 2163.55±162.15 | |
| 云南省 Yunnan | 生育日数Growing duration (d) | 107.13±6.03 | 90.56±4.28 | 89.33±2.52 | 95.75±11.46 | 95.69±8.11 |
| 株高Plant height (cm) | 141.11±11.17 | 103.98±4.50 | 112.30±7.30 | 120.83±9.01 | 119.56±15.93 | |
| 省(区) Province | 性状 Traits | 年份 Year | 平均 Average | |||
| 2003—2005 | 2006—2008 | 2009—2011 | 2012—2014 | |||
| 主茎分枝数Branch numbers | 5.60±0.80 | 6.33±0.34 | 6.13±0.93 | 5.78±0.97 | 5.96±0.33 | |
| 主茎节数Node numbers | 16.03±1.14 | 14.60±0.90 | 15.13±0.76 | 16.22±2.43 | 15.49±0.76 | |
| 单株粒重Grain weight per plant (g) | 4.48±0.35 | 4.00±0.76 | 3.80±0.46 | 4.07±1.36 | 4.09±0.28 | |
| 千粒重1000-grains weight (g) | 18.54±0.52 | 17.76±1.38 | 18.90±0.62 | 18.16±1.43 | 18.34±0.49 | |
| 产量Yield (kg·hm-2) | 1859.42±147.49 | 1924.57±369.45 | 2148.67±26.10 | 1895.43±388.70 | 1957.02±130.51 | |
| 贵州省 Guizhou | 生育日数Growing duration (d) | 104.22±5.36 | 95.11±3.06 | 83.67±0.58 | 94.00±1.00 | 94.25±8.41 |
| 株高Plant height (cm) | 131.80±7.96 | 117.60±6.22 | 109.30±1.04 | 124.90±9.82 | 120.90±9.67 | |
| 主茎分枝数Branch numbers | 5.80±0.35 | 6.20±0.54 | 5.33±0.67 | 5.77±0.42 | 5.78±0.35 | |
| 主茎节数Node numbers | 14.96±1.18 | 15.82±0.86 | 13.90±0.26 | 16.70±0.70 | 15.34±1.20 | |
| 单株粒重Grain weight per plant (g) | 5.50±0.67 | 3.80±0.59 | 3.70±0.36 | 4.53±0.65 | 4.38±0.83 | |
| 千粒重1000-grains weight (g) | 18.77±0.50 | 17.81±1.77 | 18.00±0.70 | 16.97±1.20 | 17.89±0.74 | |
| 产量Yield (kg·hm-2) | 2316.40±193.06 | 1869.48±392.46 | 1949.12±152.72 | 2186.14±251.20 | 2080.29±207.04 | |
| 江西省 Jiangxi | 生育日数Growing duration (d) | 100.33±5.69 | 89.33±1.15 | 86.00±1.73 | 85.00±1.00 | 90.17±7.03 |
| 株高Plant height (cm) | 126.73±5.45 | 107.30±3.66 | 111.47±3.33 | 119.90±5.67 | 116.35±8.68 | |
| 主茎分枝数Branch numbers | 5.63±0.12 | 5.37±0.12 | 6.40±0.80 | 5.67±0.55 | 5.77±0.44 | |
| 主茎节数Node numbers | 13.67±0.81 | 13.93±0.40 | 14.83±0.81 | 14.90±0.30 | 14.33±0.63 | |
| 单株粒重Grain weight per plant (g) | 4.60±0.30 | 3.37±0.32 | 3.67±0.55 | 4.13±0.78 | 3.94±0.54 | |
| 千粒重1000-grains weight (g) | 18.73±0.21 | 17.93±1.14 | 17.30±0.17 | 17.07±1.29 | 17.76±0.75 | |
| 产量Yield (kg·hm-2) | 2086.44±118.56 | 1795.34±389.54 | 2002.73±128.29 | 2186.25±219.11 | 2017.69±166.14 | |
| 四川省 Sichuan | 生育日数Growing duration (d) | - | 92.75±4.97 | 84.33±1.15 | - | 88.54±5.95 |
| 株高Plant height (cm) | - | 112.33±7.57 | 99.77±2.30 | - | 106.05±8.88 | |
| 主茎分枝数Branch numbers | - | 5.69±0.57 | 6.07±1.03 | - | 5.88±0.27 | |
| 主茎节数Node numbers | - | 15.21±1.01 | 13.93±0.81 | - | 14.57±0.90 | |
| 单株粒重Grain weight per plant (g) | - | 3.44±0.51 | 3.47±1.10 | - | 3.45±0.02 | |
| 千粒重1000-grains weight (g) | - | 17.90±1.22 | 17.30±0.17 | - | 17.60±0.42 | |
| 产量Yield (kg·hm-2) | - | 1749.95±390.48 | 1816.48±34.42 | - | 1783.22±47.05 | |
| 湖南省 Hunan | 生育日数Growing duration (d) | - | - | 85.50±1.38 | - | 85.50±1.38 |
| 株高Plant height (cm) | - | - | 105.52±3.22 | - | 105.52±3.22 | |
| 主茎分枝数Branch numbers | - | - | 6.30±1.01 | - | 6.30±1.01 | |
| 主茎节数Node numbers | - | - | 14.37±0.73 | - | 14.37±0.73 | |
| 单株粒重Grain weight per plant (g) | - | - | 3.85±0.42 | - | 3.85±0.42 | |
| 千粒重1000-grains weight (g) | - | - | 17.48±0.69 | - | 17.48±0.69 | |
| 产量Yield (kg·hm-2) | - | - | 2132.77±120.46 | - | 2132.77±120.46 | |
| 重庆市 Chongqing | 生育日数Growing duration (d) | - | - | - | 85.33±1.15 | 85.33±1.15 |
| 株高Plant height (cm) | - | - | - | 120.17±8.06 | 120.17±8.06 | |
| 主茎分枝数Branch numbers | - | - | - | 6.13±0.76 | 6.13±0.76 | |
| 主茎节数Node numbers | - | - | - | 14.97±0.38 | 14.97±0.38 | |
| 单株粒重Grain weight per plant (g) | - | - | - | 4.57±1.17 | 4.57±1.17 | |
| 千粒重1000-grains weight (g) | - | - | - | 16.60±0.70 | 16.60±0.70 | |
| 产量Yield (kg·hm-2) | - | - | - | 2237.99±203.21 | 2237.99±203.21 | |
新窗口打开|下载CSV
1.2 调查指标
试验主要调查了苦荞的生育日数、株高、主茎分枝数、主茎节数、单株粒重、千粒重和产量等7个性状。各性状的测量标准如下:生育日数:出苗到成熟的日数,以“天”表示。
株高:植株基部到主茎顶部之间的距离,以“cm”表示。
主茎分枝数:由主茎分生出的枝数,以“个”表示。
主茎节数:主茎基部到顶部之间节间的数量,以“节”表示。
单株粒重:各株种子的重量,以“g”表示。
千粒重:1 000粒种子的重量,以“g”表示。
产量:每公顷种子的产量,以“kg·hm-2”表示。
1.3 数据统计方法
用Excel 2016软件对北方组和南方组苦荞农艺性状数据进行统计分析。用SPSS软件进行不同育种单位培育品种间的聚类分析,用Ward法进行聚类,区间测量方法选择平方欧氏距离。用STATISTICA 10.0软件进行相关性分析以及产量与各农艺性状之间的多元线性回归分析。2 结果
2.1 苦荞育种进步与品种主要特征变化
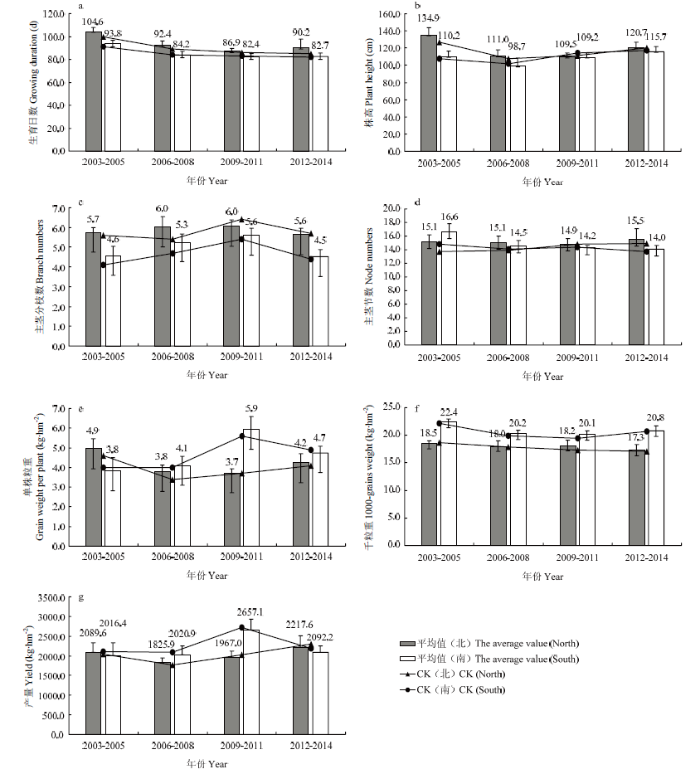
基于2003—2014年参加区域试验的所有苦荞品种按生长区气候条件分成北方组和南方组,对参试品种7个产量相关性状进行分析。结果发现,北方组的各个品种生育日数为86.9—104.6 d,平均生育日数为93.5 d;株高为109.5—134.9 cm,平均为119.0 cm;主茎分枝数为5.6—6.0个,平均为5.9个;主茎节数为14.9—15.5节,平均为15.2节;单株粒重为3.7—4.9 g,平均为4.2 g;千粒重为17.3—18.5 g,平均为18.0 g;产量为1 825.9—2 217.6 kg·hm-2,平均为2 025.0 kg·hm-2。由图1可知,2006—2014年,产量随着年份的推移增加了21%,CK在不同年份之间的变化趋势与品种平均值变化趋势基本一致。图1
 新窗口打开|下载原图ZIP|生成PPT
图12003—2014年北方组和南方组苦荞各性状在每轮区试中的表现
CK(北)和CK(南)分别代表对照品种九江苦荞在四轮区试中的变化。a:生育日数;b:株高;c:主茎分枝数;d:主茎节数;e:单株粒重;f:千粒重;g:产量
Fig. 1Performance of Tartary buckwheat characters in Northern group and Southern group in each round of regional trials from 2003 to 2014
CK (North) and CK (South) represent the changes of the control variety Jiujiangkuqiao in four rounds. a: Growing duration; b: Plant height; c: Branch numbers; d: Node numbers; e: Grain weight per plant; f: 1000-grains weight; g: Yield
南方组的各苦荞品种生育日数为82.4—93.8 d,平均生育日数为85.8 d;株高为98.7—115.7 cm,平均为108.5 cm;主茎分枝数为4.5—5.6个,平均为5.0个;主茎节数为14.0—16.6节,平均为14.9节;单株粒重为3.8—5.9 g,平均为4.6 g;千粒重为20.1—22.4 g,平均为20.9 g;产量为2 016.4—2 657.1 kg·hm-2,平均为2 196.6 kg·hm-2。由图1可以看出,2003—2011年,主茎分枝数、单株粒重和产量随着年份推移而持续增加,主茎分枝数、单株粒重和产量分别增加了22%、55%和32%,CK在不同年份之间的变化趋势与品种平均值变化趋势基本一致。
将2003—2014年北方组和南方组苦荞4轮区试的7个性状进行t测验,发现北方组与南方组的7个性状均存在显著差异,南方组苦荞的生育日数、株高、主茎分枝数、主茎节数、单株粒重、千粒重和产量分别是北方组苦荞的91.8%、91.2%、84.7%、98.0%、115.0%、116.1%和108.5%。南方组苦荞较北方组生育期更短,株高更矮,分枝数和主茎节数都更少,但是单株粒重,千粒重和产量都更高,这可能是南方组的光照时常以及水热资源较北方组更充沛导致的。
2.2 苦荞育种单位之间的品种差异
2003—2014年,来自陕西省、甘肃省、云南省、贵州省、江西省、山西省、四川省、湖南省和重庆市等19个育种单位共提供了42个苦荞品种。其中云南省5个单位,贵州省3个单位,陕西省、甘肃省、山西省和四川省各2个单位,江西省、湖南省和重庆市各1个单位。由于47%的单位只提供了1个参试品种,很多单位只参加了1—2轮区域试验,受区试条件影响,本研究将同一省区的不同育种单位划分为同一组进行比较分析,以便更好地代表对应地区的苦荞育种水平。北方组苦荞供种单位共19个,分别位于陕西省、甘肃省、山西省、云南省、贵州省、江西省、四川省、湖南省和重庆市9个省区。2003—2014年,参试品种的生育日数为(85.33±1.15)—(95.69±8.11)d,平均为(90.54±3.73)d,其中云南省最长,重庆市最短;株高为(105.52±3.22)—(120.90±9.67)cm,平均为(116.17±6.04)cm,其中贵州省最高,湖南省最低;主茎分枝数为(5.64±0.15)—(6.30±1.01)个,平均为(5.93±0.21)个,其中湖南省最高,陕西省最低;主茎节数为(14.33±0.63)—(15.49±0.76)节,平均为(14.97±0.45)节,其中云南省最高,江西省最低;单株粒重为(3.45±0.02)—(4.57±1.17)g,平均为(4.13±0.34)g,其中重庆市最高,四川省最低;千粒重为(16.60±0.70)—(18.73±1.64)g,平均为(17.74±0.59)g,其中陕西省最高,重庆市最低;产量为(1 783.22±47.05)—(2 237.99±203.21)kg·hm-2,平均为(2 058.58±132.95)kg·hm-2,其中重庆市最高,四川省最低(表1)。
南方组苦荞供种单位共19个,分别位于陕西省、甘肃省、山西省、云南省、贵州省、江西省、四川省、湖南省和重庆市9个省(市)。2003—2014年,参试品种的生育日数为(81.00±2.65)—(87.07±5.56)d,平均为(83.93±2.12)d,其中云南省最长,重庆市最短;株高为(102.53±7.02)—(115.00±6.91)cm,平均为(108.47±3.87 cm),其中重庆市最高,四川省最低;主茎分枝数为(4.66±0.58)—(6.05±0.71)个,平均为(5.10±0.45)个,其中湖南省最高,江西省最低;主茎节数为(14.17±0.52)—(15.15±1.28)节,平均为(14.53±0.33)节,其中云南省最高,湖南省最低;单株粒重为(4.33±1.17)—(5.73±0.94)g,平均为(4.85±0.50)g,其中湖南省最高,陕西省最低;千粒重为(19.50±0.54)—(21.18±0.88)g,平均为(20.62±0.52)g,其中云南省最高,湖南省最低;产量为(1 966.89±404.21)—(2 736.19±302.84)kg·hm-2,平均为(2 240.85±235.38)kg·hm-2,其中湖南省最高,陕西省最低(表2)。
Table 2
表2
表22003—2014年南方组苦荞产量和农艺性状表现
Table 2
| 省(区) Province | 性状 Traits | 年份 Year | 平均 Average | |||
|---|---|---|---|---|---|---|
| 2003—2005 | 2006—2008 | 2009—2011 | 2012—2014 | |||
| 陕西省 Shaanxi | 生育日数Growing duration (d) | 94.67±3.21 | 82.67±3.79 | 84.33±1.53 | 82.11±2.80 | 85.94±5.89 |
| 株高Plant height (cm) | 117.40±9.61 | 79.93±6.54 | 106.17±4.92 | 115.77±8.12 | 104.82±17.31 | |
| 主茎分枝数Branch numbers | 4.77±0.50 | 4.37±1.10 | 5.37±1.03 | 4.52±0.81 | 4.76±0.44 | |
| 主茎节数Node numbers | 17.03±0.57 | 13.17±1.36 | 14.13±0.50 | 14.20±1.38 | 14.63±1.67 | |
| 单株粒重Grain weight per plant (g) | 3.90±1.25 | 2.97±1.01 | 5.70±1.30 | 4.77±0.74 | 4.33±1.17 | |
| 千粒重1000-grains weight (g) | 21.43±2.48 | 21.23±0.76 | 20.83±0.93 | 20.47±1.32 | 20.99±0.43 | |
| 产量Yield (kg·hm-2) | 2023.41±117.30 | 1387.13±387.19 | 2312.04±483.40 | 2144.98±358.67 | 1966.89±404.21 | |
| 甘肃省 Gansu | 生育日数Growing duration (d) | 92.33±5.51 | 81.00±4.00 | 84.00±1.79 | 81.67±2.08 | 84.75±5.22 |
| 株高Plant height (cm) | 101.27±4.73 | 90.30±8.57 | 108.15±6.27 | 127.30±3.10 | 106.75±15.54 | |
| 主茎分枝数Branch numbers | 4.97±0.49 | 5.40±0.92 | 5.37±0.77 | 4.33±0.57 | 5.02±0.50 | |
| 主茎节数Node numbers | 16.10±1.08 | 14.00±0.56 | 14.57±0.62 | 14.30±0.79 | 14.74±0.93 | |
| 单株粒重Grain weight per plant (g) | 3.60±0.75 | 4.53±0.91 | 5.28±0.80 | 4.37±0.74 | 4.45±0.69 | |
| 千粒重1000-grains weight (g) | 22.33±1.81 | 21.03±0.76 | 20.32±0.79 | 19.43±0.45 | 20.78±1.23 | |
| 产量Yield (kg·hm-2) | 1783.33±264.53 | 1894.32±284.12 | 2362.90±302.14 | 1970.25±296.74 | 2002.70±252.10 | |
| 山西省 Shanxi | 生育日数Growing duration (d) | - | 85.00±4.00 | - | 80.67±2.58 | 82.83±3.06 |
| 株高Plant height (cm) | - | 110.70±7.12 | - | 112.45±6.21 | 111.58±1.24 | |
| 主茎分枝数Branch numbers | - | 5.47±1.11 | - | 4.23±0.73 | 4.85±0.87 | |
| 主茎节数Node numbers | - | 15.20±0.69 | - | 13.17±1.09 | 14.18±1.44 | |
| 单株粒重Grain weight per plant (g) | - | 3.93±0.40 | - | 4.77±0.16 | 4.35±0.59 | |
| 千粒重1000-grains weight (g) | - | 20.10±0.61 | - | 21.32±0.59 | 20.71±0.86 | |
| 产量Yield (kg·hm-2) | - | 1988.97±130.17 | - | 2194.04±325.44 | 2091.50±145.00 | |
| 云南省 Yunnan | 生育日数Growing duration (d) | 95.38±5.76 | 84.56±4.10 | 83.67±2.31 | 84.67±4.56 | 87.07±5.56 |
| 株高Plant height (cm) | 110.10±10.04 | 97.53±2.54 | 118.27±5.00 | 114.58±8.81 | 110.12±9.03 | |
| 主茎分枝数Branch numbers | 4.21±0.93 | 5.61±1.05 | 5.60±1.06 | 4.68±0.74 | 5.02±0.70 | |
| 主茎节数Node numbers | 17.03±1.20 | 14.87±1.17 | 14.43±0.64 | 14.27±1.73 | 15.15±1.28 | |
| 单株粒重Grain weight per plant (g) | 3.33±0.95 | 4.56±0.94 | 6.70±0.82 | 4.58±0.60 | 4.79±1.40 | |
| 千粒重1000-grains weight (g) | 22.36±1.43 | 20.38±0.60 | 20.67±0.38 | 21.31±0.51 | 21.18±0.88 | |
| 产量Yield (kg·hm-2) | 1785.14±384.19 | 2188.02±304.55 | 2796.93±150.02 | 2060.83±354.52 | 2207.73±427.28 | |
| 贵州省 Guizhou | 生育日数Growing duration (d) | 92.78±5.31 | 86.11±3.41 | 79.00±1.00 | 83.00±4.58 | 85.22±5.82 |
| 株高Plant height (cm) | 110.97±5.51 | 104.56±10.28 | 109.40±1.77 | 114.27±5.85 | 109.80±4.04 | |
| 主茎分枝数Branch numbers | 4.86±0.61 | 5.14±1.00 | 5.23±1.12 | 4.47±0.58 | 4.93±0.35 | |
| 主茎节数Node numbers | 16.74±1.17 | 15.01±0.94 | 13.37±0.47 | 14.00±1.47 | 14.78±1.47 | |
| 单株粒重Grain weight per plant (g) | 4.38±0.95 | 4.07±1.09 | 6.27±1.93 | 5.20±0.30 | 4.98±0.98 | |
| 千粒重1000-grains weight (g) | 22.78±1.96 | 19.82±1.14 | 20.63±0.15 | 20.57±0.51 | 20.95±1.27 | |
| 产量Yield (kg·hm-2) | 2083.01±242.18 | 1823.59±251.16 | 3122.37±451.41 | 2043.17±432.23 | 2268.03±580.87 | |
| 江西省 Jiangxi | 生育日数Growing duration (d) | 91.00±6.00 | 83.67±3.51 | 83.00±1.00 | 81.67±3.06 | 84.83±4.19 |
| 株高Plant height (cm) | 107.60±0.50 | 101.80±4.36 | 114.30±2.69 | 116.87±4.01 | 110.14±6.80 | |
| 主茎分枝数Branch numbers | 4.10±0.72 | 4.73±1.25 | 5.43±0.91 | 4.37±0.35 | 4.66±0.58 | |
| 主茎节数Node numbers | 14.83±0.59 | 14.07±1.05 | 14.43±0.70 | 13.67±1.31 | 14.25±0.50 | |
| 省(区) Province | 性状 Traits | 年份 Year | 平均 Average | |||
| 2003—2005 | 2006—2008 | 2009—2011 | 2012—2014 | |||
| 单株粒重Grain weight per plant (g) | 4.00±0.70 | 3.97±0.93 | 5.57±0.12 | 4.93±0.72 | 4.62±0.78 | |
| 千粒重1000-grains weight (g) | 22.20±1.57 | 19.90±0.66 | 19.47±0.81 | 20.70±0.26 | 20.57±1.20 | |
| 产量Yield (kg·hm-2) | 1997.65±372.73 | 2038.94±355.64 | 2739.88±421.23 | 2229.39±363.26 | 2251.47±340.89 | |
| 四川省 Sichuan | 生育日数Growing duration (d) | - | 83.42±4.12 | 79.33±1.15 | - | 81.38±2.89 |
| 株高Plant height (cm) | - | 97.57±8.07 | 107.50±1.32 | - | 102.53±7.02 | |
| 主茎分枝数Branch numbers | - | 5.24±1.17 | 5.97±0.72 | - | 5.60±0.51 | |
| 主茎节数Node numbers | - | 14.28±0.84 | 14.33±0.74 | - | 14.30±0.04 | |
| 单株粒重Grain weight per plant (g) | - | 3.98±0.75 | 7.10±0.87 | - | 5.54±2.20 | |
| 千粒重1000-grains weight (g) | - | 20.13±0.54 | 20.10±0.26 | - | 20.12±0.02 | |
| 产量Yield (kg·hm-2) | - | 2053.63±251.55 | 2829.64±282.74 | - | 2441.64±548.72 | |
| 湖南省 Hunan | 生育日数Growing duration (d) | - | - | 82.33±0.52 | - | 82.33±0.52 |
| 株高Plant height (cm) | - | - | 105.50±2.58 | - | 105.50±2.58 | |
| 主茎分枝数Branch numbers | - | - | 6.05±0.71 | - | 6.05±0.71 | |
| 主茎节数Node numbers | - | - | 14.17±0.52 | - | 14.17±0.52 | |
| 单株粒重Grain weight per plant (g) | - | - | 5.73±0.94 | - | 5.73±0.94 | |
| 千粒重1000-grains weight (g) | - | - | 19.50±0.54 | - | 19.50±0.54 | |
| 产量Yield (kg·hm-2) | - | - | 2736.19±302.84 | - | 2736.19±302.84 | |
| 重庆市 Chongqing | 生育日数Growing duration (d) | - | - | - | 81.00±2.65 | 81.00±2.65 |
| 株高Plant height (cm) | - | - | - | 115.00±6.91 | 115.00±6.91 | |
| 主茎分枝数Branch numbers | - | - | - | 5.00±0.82 | 5.00±0.82 | |
| 主茎节数Node numbers | - | - | - | 14.57±1.03 | 14.57±1.03 | |
| 单株粒重Grain weight per plant (g) | - | - | - | 4.90±0.98 | 4.90±0.98 | |
| 千粒重1000-grains weight (g) | - | - | - | 20.83±0.12 | 20.83±0.12 | |
| 产量Yield (kg·hm-2) | - | - | - | 2201.52±330.01 | 2201.52±330.01 | |
新窗口打开|下载CSV
以南方组和北方组产量的比值(108.5%)作为标准,将各育种省(区)的产量数据进行卡方检验,结果发现,云南省、贵州省和江西省所育苦荞的南北组产量差异不显著,说明这三个省的苦荞品种对自然环境的适应性较好,易于推广,抗环境变化能力强;陕西省、甘肃省、山西省、四川省、湖南省和重庆市苦荞品种南北组产量差异显著,其中陕西省、甘肃省、山西省和重庆市育成品种在北方组的产量更高,而四川省和湖南省所育成品种在南方组的产量更高,说明陕西省、甘肃省、山西省和重庆市的苦荞品种有明显的北方偏好性,在北方种植的经济效益大于在南方种植的经济效益,而四川省和湖南省的苦荞品种有明显的南方偏好性,更适于在南方推广种植。
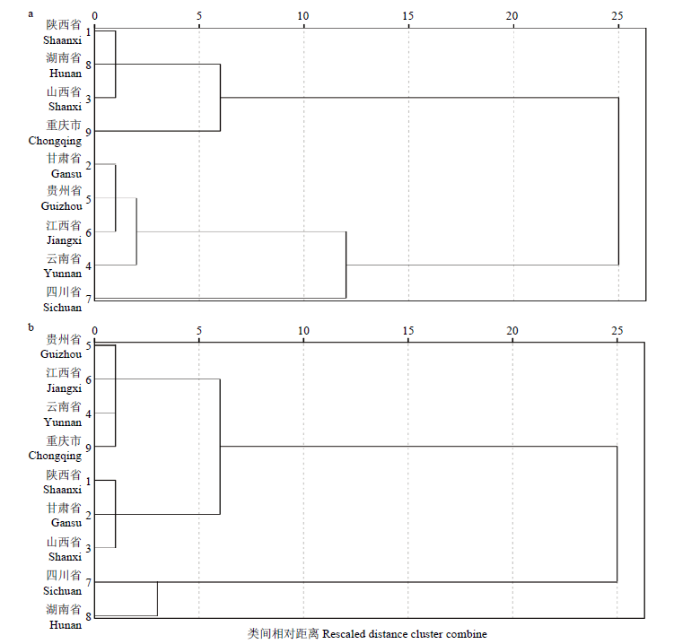
将不同供种单位提供的苦荞参试品种的农艺性状进行聚类分析,结果显示,在相对遗传距离为5时,北方组苦荞品种被分为4组,其中陕西省、湖南省和山西省的品种被分为一组,甘肃省、贵州省、江西省和云南省的育成品种分为一组,重庆市和四川省的育成品种各自分为一组;南方组苦荞育成品种被分为3组,其中贵州省、江西省、云南省和重庆市育成品种被分为一组,陕西省、甘肃省、山西省育成品种分为一组,四川省和湖南省的育成品种被分为一组(图2)。
图2
 新窗口打开|下载原图ZIP|生成PPT
图2不同省(区)苦荞品种聚类分析
a:北方组苦荞;b:南方组苦荞
Fig. 2The cluster analysis of Tartary buckwheat cultivars in different province
a: Tartary buckwheat in northern group; b: Tartary buckwheat in southern group
2.3 苦荞参试品种主要农艺性状间的相关性分析与多元回归分析
分别利用12年间北方组苦荞和南方组苦荞参试品种的主要农艺性状进行相关性分析(表3)。结果表明,无论在北方组还是南方组中,单株粒重和最终的产量都有极强的相关性,株高和其他性状间的相关性在北方组和南方组的表现十分不同。北方组中,株高与主茎节数以及单株粒重有很强的正相关性(P<0.05以及P<0.01),已知单株粒重和产量之间具有强相关性(南北组中均P<0.01),但是株高在与单株粒重显示出强相关性的同时,与产量之间没有显著关系,并且在南方组中,株高和任何性状间都没有显著相关性。主茎分枝数和株高在南北组中的表现相反,在南方组中,主茎分枝数和单株粒重间有很强的正相关性,而在北方组中则未展现出相关性。南方组中主茎分枝数与单株粒重间有很强的正相关性,但是与千粒重之间却显示出极强的负相关性,并且此现象并未在北方组中出现。在南方组中,千粒重和产量间显示出了较强的负相关性;在北方组中,千粒重和产量也存在不显著的负相关的关系,并且无论在南方组还是北方组之间,千粒重都和单株粒重显示出强的(P<0.05)或弱的(r=-0.2111)负相关性。Table 3
表3
表3北方组苦荞和南方组苦荞主要性状之间的相关性
Table 3
| 性状 Trait | 生育日数 Growing duration | 株高 Plant height | 主茎分枝数 Branch numbers | 主茎节数 Node numbers | 单株粒重 Grain weight per plant | 千粒重 1000-grains weight | 产量 Yield |
|---|---|---|---|---|---|---|---|
| 生育日数Growing duration | 0.5501 | -0.5168 | 0.7280* | 0.1057 | 0.7689* | -0.3775 | |
| 株高Plant height | -0.0207 | -0.4492 | 0.7614* | 0.8308** | 0.1954 | 0.4583 | |
| 主茎分枝数Branch numbers | -0.5019 | -0.5130 | -0.2343 | -0.0704 | -0.6097 | 0.1644 | |
| 主茎节数Node numbers | 0.6598* | 0.2379 | -0.3475 | 0.5892 | 0.3712 | 0.1295 | |
| 单株粒重Grain weight per plant | -0.5037 | -0.3705 | 0.8875** | -0.2938 | -0.2111 | 0.8269** | |
| 千粒重1000-grains weight | 0.6028 | 0.4917 | -0.8535** | 0.7421* | -0.7660* | -0.3988 | |
| 产量Yield | -0.3914 | -0.3320 | 0.8493** | -0.4213 | 0.9369** | -0.8380** |
新窗口打开|下载CSV
以生育日数(X1)、株高(X2)、主茎分枝数(X3)、主茎节数(X4)、单株粒重(X5)和千粒重(X6)这6个农艺性状为自变量,单位面积产量作为因变量(Y)进行多元回归分析,分别建立了北方组苦荞产量和南方组苦荞产量与其他性状的最优回归模型:
(1)北方组苦荞:Y = 2005.990–0.310 X1+0.150 X3+0.686 X5+0.163 X6(r=0.7283,R2= 0.5304,F=23.5332,P=0.0000);
(2)南方组苦荞:Y = 868.800+0.325 X1+0.327 X3–0.320 X4+0.594 X5–0.250 X6(r=0.7836,R2= 0.6140,F=33.6695,P=0.0000)。
以上结果表明,在北方组苦荞中,生育日数、主茎分枝数、单株粒重和千粒重一起决定了产量53.0%的变异;而在南方组苦荞中,生育日数、主茎分枝数、主茎节数、单株粒重和千粒重共同决定了产量61.4%的变异。
3 讨论
3.1 苦荞产量相关性状改良是高产品种选育的基础
通过对2003—2014年12年间所有北方组和南方组区域试验参试品种的分析发现,北方组和南方组苦荞品种的产量和主要农艺性状均存在显著差异,而且北方组苦荞中的产量以及南方组苦荞中的主茎分枝数、单株粒重和产量均随年份的增长而增加,表明苦荞产量相关性状的改良取得成效。除了产量和粒重,其他性状的增幅均较低或为负增长。这一增幅差异可能是由于主茎分枝数、单株粒重和产量受生态因子的影响较大,而生育日数、株高、主茎节数和千粒重这4个性状受生态因子的影响程度相对较小[31],由于本试验北方组和南方组所用的苦荞品种相同,且每轮区试的条件和田间管理水平一致,因而可以认为在不同试点间各性状的差异可能是由于地理及气象条件不同所致。通过相关性分析,发现单株粒重对于产量的形成十分重要,但其是否与其他产量相关因素有相互影响尚不得而知,因此,除了尽可能增加单株粒重之外,如何控制单株粒重和其他产量性状间的相互影响也非常关键。株高和主茎分枝数在南北方组中的表现相反,在北方,株高可以为苦荞产量形成提供参考;在南方,主茎分枝数可以为苦荞产量形成提供参考。无论在北方组还是南方组,千粒重与单株粒重以及产量间都显示出或强或弱的负相关性,这或许可以提示:在苦荞种植中,单株粒重是比千粒重更值得关注的产量性状。
重庆市、山西省、湖南省和陕西省的育种单位所提供的苦荞品种产量在北方组苦荞区试中表现较好;湖南省、四川省的育种单位提供的苦荞品种产量在南方组苦荞区试中表现较好,与聚类分析的结果一致,北方组区试中重庆市虽单独被划分为一组,但从整体上来看,提供高产量苦荞品种的育种省基本划分在一起。结合卡方分析,根据苦荞的地域偏好性,陕西省、山西省和重庆市所育成的品种适宜在北方推广种植;四川省和湖南省的苦荞品种在南方有更好的经济效益。但陕西省的苦荞品种在南方组第二轮区试中出现大幅减产的现象,说明了苦荞育种可能存在抗病虫、抗干旱和抗灾害等方面的不足,除了考虑提高产量,苦荞抗逆品种的选育是下一步育种的重点方向。四川省的苦荞品种单株粒重在南方组第三轮区试中变化非常大,且明显超越其他省份,产量也增加了近800 kg,或许可以说明四川省的育种策略主要是通过增加单株粒重来实现增产。
众多研究都表明,作物产量的构成因素很多,是一个复杂性状,苦荞也不例外。目前,苦荞产量与主要农艺性状相关关系的研究已有较多报道[32]。通过分析产量与各性状间的相关性发现,在苦荞生态因子相关性方面,株高与纬度呈极显著正相关,主茎分枝数与生育期均温呈极显著正相关,说明高纬度的北方组可以通过选育植株较高的品种提高产量,年均气温较高的南方组则可以通过增加主茎分枝数实现增产[31]。
4轮区试中,山西省和四川省只参加了2轮试验,而湖南省和重庆市只参加了一轮区试,虽然这4个省市的苦荞产量均表现优异,但不能很好地反映苦荞各个性状在12年间的变化趋势,因此需要继续对高产品种进行试验,观察其产量在年际之间的变化幅度,即是否具有稳产的特性,从而真正选育出适合南北方种植的高产稳产苦荞。
3.2 稳定的政策支持和持续的科技投入是苦荞品种改良取得进展的重要推动力
20世纪80年代,中国科学家开始对苦荞进行开发利用,1989年,农业部科技司批准在太原成立“全国荞麦育种、栽培及开发利用科研协作组”,而后苦荞产业的发展不仅是科技人员和企业的呼吁要求,也得到了政府的支持。在这4轮苦荞区域试验中,一共有42个品种参加了区试试验,云南省、贵州省和陕西省的12家育种单位提供了25个苦荞品种,占苦荞参试品种总数的59.5%,是中国苦荞育种的中坚力量。而在主粮作物中,仅2018年通过国家审定的水稻品种就有268个,且达到优质米部标的水稻品种占审定品种的50%[33]。2018年,有77个小麦品种通过国家审定[34]。1972—2013年,玉米国家和地区审定的品种总数为6 291[35]。由此可见,苦荞品种选育的数量远远低于主粮作物,且育种力量也远不如大宗粮食作物。因此,为了更好地改良苦荞品种,要加强基础研究,如广泛考察、收集和鉴定野生资源,建立种质库等;还要适应市场,培育适宜机械化栽培、易于脱壳和满足保健功能的苦荞品种;此外,在选育新品种时,也要尝试多种育种方法,如杂交育种、生物工程育种和杂种优势利用等[36]。目前,苦荞基因组测序工作已经完成[37],苦荞分子育种技术的发展也将为苦荞育种提供强力支持。3.3 高黄酮、易脱壳、低苦味、抗落粒、抗倒伏和适宜机械化的多元化目标是苦荞育种改良的主要方向
苦荞是一种营养极为丰富且保健功能较强的药食同源作物,富含蛋白质、维生素、膳食纤维等营养成分,还含有其他禾本科作物所没有的生物黄酮类活性成分,因此,苦荞品种改良不仅仅局限于关注产量性状,而富含功能成分的特殊性状和品种选育更为重要。但苦荞含有苦味素、面粉缺乏面筋、适口性差等限制了苦荞加工与利用。目前市场上常见的苦荞加工产品有苦荞茶[38]、苦荞粉、苦荞酒、苦荞方便面等加工产品。但受制于高黄酮优质苦荞品种缺乏和加工工艺落后,苦荞加工产品的质量参差不齐,使得苦荞难以规模化生产。另外,苦荞脱壳加工机械化不足也成为制约苦荞加工业发展的主要因素之一。因此,培育易脱壳、高黄酮的苦荞品种是苦荞育种的重要方向之一。苦荞生产区域往往土壤贫瘠,生产规模小,加之劳动力匮乏,难以适应新时代苦荞生产的需要,亟需提高苦荞机械化生产水平。选育抗落粒、抗倒伏、成熟期一致、适于全程机械化生产的新品种,加强农艺适应农机是苦荞产业发展的重要方向。
苦荞花期长,花色鲜艳,籽粒颜色多样,也可以加以利用。如盛花期叶片和花器芦丁含量高,是重要的药用植物资源;茎秆和花器、果皮中含有的花青素可作为食用色素[39],尤其在乡村振兴产业发展中,生育期长、枝繁叶茂、花色艳丽的观赏型苦荞新品种成为市场的新宠。
目前,中国苦荞育种多采用系统选育、单株混合选择、诱变育种以及引种改良等传统育种技术和方法,要培育有突破性的苦荞品种,不仅要在资源挖掘、优异种质资源创新上下功夫,更主要的是依靠科技进步,借鉴大宗作物在远缘杂交育种、生物工程育种以及杂种优势利用等[40]领域的进展和成就,改进育种技术和方法,提高苦荞育种水平。
4 结论
2003—2014年,中国苦荞产量相关性状的改良取得成效。单株粒重对产量的形成十分重要,北方组中,株高同样可以作为提高产量的参考;南方组中,主茎分枝数也可以作为产量形成的参考。增加抗性品种和具有稳产特性的苦荞品种选育是下一步育种的重点方向,不同省市育种单位的育种手段存在差异,云南省、贵州省和江西省的苦荞适应性更广泛,陕西省、山西省和重庆市选育的品种更适合北方地区,四川省和湖南省选育的品种在南方具有更好的产量。加强分子设计育种等新技术研发与应用,培育高黄酮、易脱壳、抗落粒、抗倒伏、成熟期一致、适于机械化栽培的优质专用品种也是苦荞育种的重要方向。参考文献 原文顺序
文献年度倒序
文中引用次数倒序
被引期刊影响因子
[本文引用: 1]
DOI:10.3864/j.issn.0578-1752.2016.11.002URL [本文引用: 1]

【Objective】 The objective of this study was to understand the genetic diversity and population structure of tartary buckwheat resources from different production regions and to provide theoretical foundation of functional gene and resources use. 【Method】 Eight phenotypic traits were evaluated by correlation and principal component analyses. Plants were cultivated in the greenhouse, and 10 fresh leaves were selected in the three leaf stage. DNA of tartary buckwheat was extracted using the CTAB method, and then they were amplified based on the SSR marker, detected by the electrophoresis, and took photos and saved. 0, 1 matrix was structured based on the detection of SSR, and eighty-three materials were used to analyze genetic diversity and genetic structure by PowerMarker3.25 and Structure2.3.4 software. 【Result】 Distribution of the eight phenotypic traits were scattered with most apparently interrelated. The cumulative contribution rate of four principal components formerly reached up to 85.2%, which may show the relative relationships of the plant traits. The variation coefficient and genetic diversity of plant height and main stem diameter contributed the most to this metrics between all plant traits. Among the distinct geographical regions, the mean H′ (1.82) of Tibet population was the richest, and in Sichuan population was the second with a mean H′ of 1.78, just slightly lower. Genetic diversity of plant traits from the distinct regions showed that the H′ of growth stage, plant height, and main stem branch number in Sichuan population were the highest, while the H′ of leaf width was the richest trait in the Shaanxi population, andof 1000-seeds weight H′ in Yunnan population was the richest trait for plants of that region. Principal component analysis of 7 different geographical populations showed plant traits of similar production regions may have a close relation. Genetic diversity of 83 individuals of tartary buckwheat germplasm resources was detected by 13 pairs of SSR primes. A total of 208 loci were detected, among which 200 (96.2%) were polymorphous. The number of amplified fragments and polymorphous fragments per primer combination were 16 and 15.4; the number of alleles varied from 4 to 58, and the frequencies of major alleles varied from 0.02 to 0.86; gene diversity was between 0.38 and 0.98, and polymorphic information index was 0.35-0.98. Genetic diversity of different production regions showed that genetic structure of the northerly populations showed close relationship, and genetic structure of southwesterly population was also so, which showed the relationship between population cluster and production regions. The number of alleles (12.1), genetic diversity index (0.84), and polymorphic information content (0.83) in Shaanxi were the highest among the regions. All resources were divided into three clusters based on modules by genetic structure analysis, and cluster analysis based on genetic distance showed dispersive resources and no regionalization. Genetic distances were close from plant materials of the same production regions among different resources. 【Conclusion】 Polymorphic information contents of tartary buckwheat from main production regions were high, and the genetic diversity among them was rich. Resource interflow and genetic material exchange were observed in northerly and southwesterly production regions.
DOI:10.3864/j.issn.0578-1752.2016.11.002URL [本文引用: 1]
【Objective】 The objective of this study was to understand the genetic diversity and population structure of tartary buckwheat resources from different production regions and to provide theoretical foundation of functional gene and resources use. 【Method】 Eight phenotypic traits were evaluated by correlation and principal component analyses. Plants were cultivated in the greenhouse, and 10 fresh leaves were selected in the three leaf stage. DNA of tartary buckwheat was extracted using the CTAB method, and then they were amplified based on the SSR marker, detected by the electrophoresis, and took photos and saved. 0, 1 matrix was structured based on the detection of SSR, and eighty-three materials were used to analyze genetic diversity and genetic structure by PowerMarker3.25 and Structure2.3.4 software. 【Result】 Distribution of the eight phenotypic traits were scattered with most apparently interrelated. The cumulative contribution rate of four principal components formerly reached up to 85.2%, which may show the relative relationships of the plant traits. The variation coefficient and genetic diversity of plant height and main stem diameter contributed the most to this metrics between all plant traits. Among the distinct geographical regions, the mean H′ (1.82) of Tibet population was the richest, and in Sichuan population was the second with a mean H′ of 1.78, just slightly lower. Genetic diversity of plant traits from the distinct regions showed that the H′ of growth stage, plant height, and main stem branch number in Sichuan population were the highest, while the H′ of leaf width was the richest trait in the Shaanxi population, andof 1000-seeds weight H′ in Yunnan population was the richest trait for plants of that region. Principal component analysis of 7 different geographical populations showed plant traits of similar production regions may have a close relation. Genetic diversity of 83 individuals of tartary buckwheat germplasm resources was detected by 13 pairs of SSR primes. A total of 208 loci were detected, among which 200 (96.2%) were polymorphous. The number of amplified fragments and polymorphous fragments per primer combination were 16 and 15.4; the number of alleles varied from 4 to 58, and the frequencies of major alleles varied from 0.02 to 0.86; gene diversity was between 0.38 and 0.98, and polymorphic information index was 0.35-0.98. Genetic diversity of different production regions showed that genetic structure of the northerly populations showed close relationship, and genetic structure of southwesterly population was also so, which showed the relationship between population cluster and production regions. The number of alleles (12.1), genetic diversity index (0.84), and polymorphic information content (0.83) in Shaanxi were the highest among the regions. All resources were divided into three clusters based on modules by genetic structure analysis, and cluster analysis based on genetic distance showed dispersive resources and no regionalization. Genetic distances were close from plant materials of the same production regions among different resources. 【Conclusion】 Polymorphic information contents of tartary buckwheat from main production regions were high, and the genetic diversity among them was rich. Resource interflow and genetic material exchange were observed in northerly and southwesterly production regions.
URLPMID:11592684 [本文引用: 1]
DOI:10.3864/j.issn.0578-1752.2012.06.002URL [本文引用: 1]
【Objective】 The SSR molecular markers system was optimized and constructed for genetic diversity analyses of Chinese tartary buckwheat germplasm resources, which is helpful for evaluating Chinese tartary buckwheat collections. 【Method】 The SSR-PCR system was optimized by [L16(45)]orthogonal design, the optimized gel concentration of PAGE was confirmed, and the genetic diversity of 50 tartary buckwheat accessions was analyzed by 19 SSR primer pairs screened from 250 ones of different crops. 【Result】The optimized SSR-PCR system was as follows: 30 ng DNA template, 150 μmol•L-1 dNTP, 0.1 μmol•L-1 primer, 2.0 U•L-1 TaqDNA polymerase, 2.0 mmol•L-1 Mg2+, 1×Taq buffer and ddH2O then added up to terminal volume of 25 μL with 6% PAGE for testing. The primers screening efficiency was 7.6%, and the primers from common buckwheat were applicable. A total of 157 alleles were detected by 19 primers, with 2-11 alleles for each primer pair, and the average was 7.42. Moreover, the averaged PIC and DP values were 0.8881 and 5.684, respectively. Using Popgen Ver.1.31, 50 accessions were clustered into 5 groups at GS 0.578. The clustering results revealed that the genetic diversity of accessions of tartary buckwheat was not correlated to their geographic origins. The genetic diversity of tartary buckwheat from Sichuan was very rich as genetic parameters were the highest. The core primers could be used to identify the similar accessions.【Conclusion】 The SSR molecular markers system was effective for assessment of genetic diversity of Chinese tartary buckwheat germplasm resources. SSR primers of common buckwheat could be used in tartary buckwheat. TBP5 and Fes2695 were SSR core primers. It showed a high genetic diversity in 50 Chinese tartary buckwheat accessions which could be classified into 5 groups.
URL [本文引用: 1]
Cytochrome P450s are one of the largest enzyme protein families in higher plants and widely involve in secondary metabolism and stress tolerance. In this study, a CYP81 homologous gene FtP450-R4(GenBank Accession No. KM271986) was obtained from Fagopyrum tataricum. The full-length of FtP450-R4 cDNA contained a 5'-UTR (49 bp), a 3'-UTR (194 bp) and an ORF of 1 527 bp. It encoded a protein of 508 amino acid residues. Bioinformatics analysis showed that the FtP450-R4 was located in endoplasmic reticulum by the 4~24 amino acid residues in the N-terminal, and it shared the homology of 44%~46% with F3'H, I2'H, and other plants CYP450 proteins. Sequence multi-alignment showed that FtP450-R4 contained the classic motifs and conserved regions of CYP450s, but excluded the feature motifs of GGEK in F3′H. Phylogenetic tree showed that FtP450-R4, Arabidopsis thaliana CYP81 families and I2′H were gathered in a large cluster, suggesting that FtP450-R4 might involve in flavonoids hydroxylation or stress response. FtP450-R4 could be significantly induced in cotyledons by UV-B, cold and drought stress, but not in hypocotyls. The recombinant protein of FtP450-R4 expressed in a soluble form in Escherichia coli strain BL21(DE3) and activity identification showed that it could perform enzyme catalysis using reduced form of nicotinamide-adenine dinucleotide phosphate (NADPH) and kaempferol as substrates. Totally, this work can make better understand for the function of CYP450s and provides fundamental information for the flavonoids regulation mechanism in F. tataricum.
DOI:10.1016/j.jff.2012.11.013URL [本文引用: 1]
URLPMID:26434312 [本文引用: 1]
[本文引用: 1]
[本文引用: 1]
URL [本文引用: 1]
试验以14个全国苦荞品种为材料,进行籽粒产量相关性状的分析,结果表明,主要相关性状对籽粒产量影响的顺序为:株高>主茎节敖>出苗日数>单株粒重>单株粒数>现蕾至开花天数>生育日数>千粒重>出苗至现蕾天数>一级分枝.籽粒产量与开花至成熟天数关系不密切.增加株高、主茎节数、单株粒重、单株粒数是增加籽粒产量的主要途径.选择大粒和提高现蕾至开花天数是提高籽粒产量的重要途径.通过增加出苗至现蕾天数和一级分枝数可间接提高籽粒产量.出苗天数增加可导致籽粒产量减少.
URL [本文引用: 1]
试验以14个全国苦荞品种为材料,进行籽粒产量相关性状的分析,结果表明,主要相关性状对籽粒产量影响的顺序为:株高>主茎节敖>出苗日数>单株粒重>单株粒数>现蕾至开花天数>生育日数>千粒重>出苗至现蕾天数>一级分枝.籽粒产量与开花至成熟天数关系不密切.增加株高、主茎节数、单株粒重、单株粒数是增加籽粒产量的主要途径.选择大粒和提高现蕾至开花天数是提高籽粒产量的重要途径.通过增加出苗至现蕾天数和一级分枝数可间接提高籽粒产量.出苗天数增加可导致籽粒产量减少.
[本文引用: 1]
[本文引用: 1]
URL [本文引用: 1]
2001~2005年,对江苏省水稻区试和预试品种(系)808份进行稻瘟病、白叶枯病和纹枯病抗性鉴定.鉴定结果表明:在被测的各种水稻类型中,籼稻品种(系)对稻瘟病的抗性比粳稻好;在粳稻类品种(系)中杂交粳稻对稻瘟病的抗性又略比常规粳稻好;粳稻品种(系)对白叶枯病的抗性比籼稻好;常规稻对白叶枯病的抗性明显比杂交稻好;大部分被测水稻品种(系)对纹枯病的抗性较差.
URL [本文引用: 1]
2001~2005年,对江苏省水稻区试和预试品种(系)808份进行稻瘟病、白叶枯病和纹枯病抗性鉴定.鉴定结果表明:在被测的各种水稻类型中,籼稻品种(系)对稻瘟病的抗性比粳稻好;在粳稻类品种(系)中杂交粳稻对稻瘟病的抗性又略比常规粳稻好;粳稻品种(系)对白叶枯病的抗性比籼稻好;常规稻对白叶枯病的抗性明显比杂交稻好;大部分被测水稻品种(系)对纹枯病的抗性较差.
[本文引用: 1]
[本文引用: 1]
[本文引用: 1]
[本文引用: 1]
[本文引用: 1]
[本文引用: 1]
[本文引用: 1]
[本文引用: 1]
URL [本文引用: 1]
利用河北省1998-2007年间春播花生区域试验资料,对各参试品系、对照品种的13个农艺性状的变化进行了分析,结果表明,参试品系间及参试品系与对照品种间的农艺性状均存在较大差异;参试品系的总分枝、结果枝、单株饱果数、单株结果数、单株产量、百果重、百仁重近年来不断增加;与对照品种相比,主茎高、侧枝长、总分枝、结果枝的平均值有所降低;单株饱果数、单株结果数、单株产量、百果重、百仁重在增加;在生育期、出米率上的差异不大.
URL [本文引用: 1]
利用河北省1998-2007年间春播花生区域试验资料,对各参试品系、对照品种的13个农艺性状的变化进行了分析,结果表明,参试品系间及参试品系与对照品种间的农艺性状均存在较大差异;参试品系的总分枝、结果枝、单株饱果数、单株结果数、单株产量、百果重、百仁重近年来不断增加;与对照品种相比,主茎高、侧枝长、总分枝、结果枝的平均值有所降低;单株饱果数、单株结果数、单株产量、百果重、百仁重在增加;在生育期、出米率上的差异不大.
DOI:10.3864/j.issn.0578-1752.2018.21.002URL [本文引用: 1]
【Objective】Simultaneous improvement in yield and quality of maize hybrids is vital to improve maize variety and develop the maize industry. Amounts of studies focused on the trends of crude starch and crude protein concentrations with maize varieties released in different eras, however, the results are different and the relationships between different substances were rarely mentioned. Hence, further exploration of the changing trends of yield and quality related traits for maize hybrids released in China over the past years and their intrinsic connections are needed. 【Method】The information of 770 maize varieties released in China from 1992 to 2017 were collected, and the related traits of yield and quality of the 73.64% common maize hybrids were used for further analysis. 【Result】The results showed that the volume weight, 1000-kernel weight and crude starch concentration were significantly or highly significantly increased with an average annual improvements of 1.87 g·L -1, 0.91 g, and 0.19%, respectively. To the contrast, the crude fat concentration was significantly reduced by 0.03% per year. The annual average of crude protein and lysine concentration remained stable along with time, the averages from 1992 to 2017 were 9.88% and 0.30%, respectively. Correlation analysis was processed and both volume weight and 1000-kernel weight were significantly positively correlated with crude starch concentration, however, they were negatively related to the crude fat concentration to some extent. In addition, both of the crude protein and lysine concentration showed extremely significant negative relationships with the crude starch concentration and 1000-kernel weight. The accumulation trends based on 1000-kernel weight showed that crude starch, crude protein and lysine per 1000-kernel increased to some extent over the released years. The average annual increase for each trait was 1.159 g, 0.092 g and 0.001 g, respectively. Crude fat accumulation still decreased which is similar to its concentration. 【Conclusion】Overall, during the process of maize varieties improvement, the traits related to yield such as 1000-kernel weight and bulk weight are relatively fast improved in China, and the advance of them rely on, to a great extent, the enhancement of the crude starch concentration, however, which may lead to an effect of carbon dilution on the concentrations of crude protein, lysine and crude fat. The carbon dilution effects and the relatively fast improvement in 1000-kernel weight determined the different performances between concentrations and accumulations for crude protein and lysine. Besides, the relationships between the traits of suitable mechanical grain-harvesting and grain quality deserve further attention during the selection of suitable mechanical grain-harvesting variety.
[本文引用: 1]
[本文引用: 1]
[本文引用: 1]
[本文引用: 1]
[本文引用: 1]
[本文引用: 1]
[本文引用: 1]
[本文引用: 1]
[本文引用: 1]
[本文引用: 1]
[本文引用: 1]
[本文引用: 1]
[本文引用: 1]
[本文引用: 1]
[本文引用: 1]
[本文引用: 1]
[本文引用: 1]
[本文引用: 1]
[本文引用: 1]
[本文引用: 1]
[本文引用: 1]
[本文引用: 1]
URL [本文引用: 1]
通过对通渭县苦养生产、加工现状的分析,指出产业发展优势和制约产业升级的困难和问题,提出了进一步发展苦荞产业的思路和对策.
URL [本文引用: 1]
通过对通渭县苦养生产、加工现状的分析,指出产业发展优势和制约产业升级的困难和问题,提出了进一步发展苦荞产业的思路和对策.
[本文引用: 1]
[本文引用: 1]
[本文引用: 2]
[本文引用: 2]
[本文引用: 1]
[本文引用: 1]
[本文引用: 1]
[本文引用: 1]
[本文引用: 1]
[本文引用: 1]
DOI:10.3864/j.issn.0578-1752.2014.22.002URL [本文引用: 1]
【Objective】Variety accreditation acts as the permiting for commercialization of maize varieties, the basis for the regulation and administration of seeds market, and the reference for variety selection and right protection in China. Therefore, comprehensive analysis on accredited maize varieties according to demands of businesses such as maize variety management, and in-depth exploration of the internal link and implicit message of these variety data can provide more systematic and distinct reference to seeds management departments, scientific research institutions, seeds enterprises and farmers.【Method】 The state and provincial authorized maize variety data of China in 42 years were obtained through material search, collection and data verification, and the trend of change of maize varieties on the market in different years and regions, the repeated rate of parental inbred lines of all the accredited maize varieties and the relationship between the accreditation, protection and withdraw from promotion of maize varieties were discussed.【Result】It is shown that during the period of 1972-2013, the total number of state and provincial accredited maize varieties was 6291, among which 503 were of state level, while the present state and provincial accredited variety number was 4882, among which 332 were of state level. A total of 1726 breeding organizations have records of accredited maize varieties, and scientific research institutions and seeds enterprises accounted for 48.3% and 46.6%, respectively, with an average of 7 and 3 varieties for each organization. A total of 8754 different parental inbred lines have been used in hybridization match of all accredited maize varieties, 19.4% of which were used repeatedly. The three most frequently used inbred lines were Mo17, Chang7-2 and Dan340. A record count of 1876 of all accredited maize varieties in 42 years have been withdrawn from promotion and the average employment period of such withdrawn varieties was 13.3a. Applications for new variety property have been filed for 29.2% of all accredited maize varieties in history and approved for only 15.1% of them.【Conclusion】During the recent 10 years, the number of accredited maize varieties at all levels increased steadily year by year, so was the maize variety inventory. In terms of trend, the northern area has more accredited varieties than the southern area and the number of accredited varieties in the eastern area increased faster than that in the western area. Of all breeding organizations, scientific research institutions acted as the main entity in terms of the quantity of accredited maize varieties and the number of accredited maize varieties of large-scale seeds enterprises increased remarkably. The number of newly-named parental inbred lines has increased rapidly, so the repeating rate of them has decreased year by year. The yearly number of accredited varieties withdrawn from promotion tends to be steady and fewer varieties are overlapped in both accreditation and property applications.
[本文引用: 1]
[本文引用: 1]
DOI:10.1016/j.molp.2017.08.013URLPMID:28866080 [本文引用: 1]
Tartary buckwheat (Fagopyrum tataricum) is an important pseudocereal crop that is strongly adapted to growth in adverse environments. Its gluten-free grain contains complete proteins with a well-balanced composition of essential amino acids and is a rich source of beneficial phytochemicals that provide significant health benefits. Here, we report a high-quality, chromosome-scale Tartary buckwheat genome sequence of 489.3 Mb that is assembled by combining whole-genome shotgun sequencing of both Illumina short reads and single-molecule real-time long reads, sequence tags of a large DNA insert fosmid library, Hi-C sequencing data, and BioNano genome maps. We annotated 33 366 high-confidence protein-coding genes based on expression evidence. Comparisons of the intra-genome with the sugar beet genome revealed an independent whole-genome duplication that occurred in the buckwheat lineage after they diverged from the common ancestor, which was not shared with rosids or asterids. The reference genome facilitated the identification of many new genes predicted to be involved in rutin biosynthesis and regulation, aluminum stress resistance, and in drought and cold stress responses. Our data suggest that Tartary buckwheat's ability to tolerate high levels of abiotic stress is attributed to the expansion of several gene families involved in signal transduction, gene regulation, and membrane transport. The availability of these genomic resources will facilitate the discovery of agronomically and nutritionally important genes and genetic improvement of Tartary buckwheat.
URL [本文引用: 1]
为了分析不同加工方式对传统荞麦制品营养成分含量及功能特性的影响。利用高效液相色谱法测定了蒸、煮、烙、油炸和发酵等加工方式所得传统荞麦制品中的芦丁、槲皮素含量,对其制品的抗氧化能力进行了比较。结果表明,荞麦面粉加水调制成面团时,芦丁结构发生了变化,生成了槲皮素;传统荞麦制品中,槲皮素含量远高于芦丁含量;不同加工方式对芦丁和槲皮素含量的影响不同,发酵对荞麦中芦丁、槲皮素的影响最大(苦荞面粉中的芦丁含量为6 869.1 mg/kg,槲皮素未捡出;而苦荞醋中的芦丁含量为19.8 mg/kg,槲皮素含量为29.2 mg/kg),油炸次之,煮制对芦丁、槲皮素的影响最小;不同加工方式所得苦荞制品的甲醇提取物均具有一定的抗氧化能力,其中发酵制品的抗氧化能力最强,而油炸制品最弱。此结果提示人们在加工荞麦制品时,应尽量避免采用加热温度较高的烙制和油炸,可多采用煮制加工,以减少对荞麦制品品质的影响,同时应重视苦荞醋的研究与开发。
URL [本文引用: 1]
Measurement of root, stem, leaves, flowers, hull, flour of the buckwheat. It was result that the buckwheat root contentwas 0.51%, the stem 1.25%, and the leaves 5.39%, The flowers 6.28, the grains 2.13%, the hull 1.06%, and the powder 2.31%.High performance liquid chromatography (HPLC) was used to determine the rutin of the organs. The sample was analyzed ona C18 column with methanol water (0.45% H3PO4)(55:45) and assayed by 260nm UV detector. The highest rutin content ofbuckwheat was in its every Organs。
DOI:10.3864/j.issn.0578-1752.2017.06.003URL [本文引用: 1]
Potato, the third most important food crop, plays a key role in global and China’s food security. Improvement of varieties is a base for sustainable development of potato industry. Potatoes frequently suffer from diverse biotic and abiotic stress, so it is urgent to breed new varieties with better disease resistance, stress tolerance, tuber yield and quality as well as specific usage to meet the needs of potato processing and people nutrition. Potato breeding is a system combining germplasm evaluation and utilization, major traits genetics analysis, breeding technology application and variety extension and crop management together. Within a global conservation strategy there are about 65,000 accessions. Using a homozygous doubled-monoploid potato clone, 86% of the 844-megabase genome sequence are revealed and assembled, and 39,031 protein-coding genes are predicted. At present, re-sequencing of potato accessions is in process. Common cultivated potato is an asexual propagation tetraploid with tetrasomic inheritance and high heterozygosity. Nevertheless, inheritance of many major traits involving plant development and morphology, tuber quality, disease resistance and stress tolerance are revealed. A lot of genes determining potato major traits are mapped and cloned. Potato breeding technology involves conventional breeding, ploidy manipulation, marker-assisted selection, genetic engineering and promising genomic selection for complex traits. Since 1949, China potato breeding has achieved great progress that is reflected on growth of number of registered varieties. Dutch potato breeding ranks among the best in world and participatory potato breeding model is a successful practice for commercial breeding. In the future, it is a trend to breed superior and specific purpose varieties based on improvement of integrated breeding technology, innovation of breeding model and germplasm utilization.
