 ,11
,11 2
Genetic Diversity Analysis and Comprehensive Evaluation of Phenotypic Traits in Hulless Barley Germplasm Resources
BAI YiXiong1,2, ZHENG XueQing1, YAO YouHua1, YAO XiaoHua1, WU KunLun,1通讯作者:
责任编辑: 李莉
收稿日期:2019-05-28接受日期:2019-07-24网络出版日期:2019-12-01
| 基金资助: |
Received:2019-05-28Accepted:2019-07-24Online:2019-12-01
作者简介 About authors
白羿雄,E-mail:yixiongbai@163.com

摘要
关键词:
Abstract
Keywords:
PDF (1139KB)元数据多维度评价相关文章导出EndNote|Ris|Bibtex收藏本文
本文引用格式
白羿雄, 郑雪晴, 姚有华, 姚晓华, 吴昆仑. 青稞种质资源表型性状的遗传多样性分析及综合评价[J]. 中国农业科学, 2019, 52(23): 4201-4214 doi:10.3864/j.issn.0578-1752.2019.23.002
BAI YiXiong, ZHENG XueQing, YAO YouHua, YAO XiaoHua, WU KunLun.
0 引言
【研究意义】青稞(Hordeum vulgare L.var.nudum Hook.f.)属禾本科大麦属,因其内外稃与颖果分离,籽粒裸露,故又称裸大麦[1],是栽培大麦变种。青稞为青藏高原最具特色的农作物,具有耐寒、抗旱、抗逆性强、适应性广、生育期短等特点[2]。青稞主要分布在中国五省藏区,其中青海省种植面积达10.67万公顷,占总耕地面积19%左右,青稞在藏区总种植面积高达25.58万公顷[3],是藏族同胞的主粮[4]。青稞因具有较高的蛋白质、高膳食纤维、高β–葡聚糖并含有丰富的多酚类物质而被用于食品加工业[5],青稞秸秆是牧区牦牛和藏羊的主要饲草,对藏区畜牧业发展至关重要[6]。【前人研究进展】遗传多样性研究及综合评价对掌握物种遗传信息具有推动作用,也为育种工作提供便利。近年来,科研工作者主要采用形态标记[7]、生化标记[8]和分子标记[9,10,11]等手段开展作物遗传多样性研究和种质资源的综合评价。以SSR标记对青稞多样项研究结果表明,青稞种质在农艺性状中表现出丰富的遗传多样性[12,13],不同生态区青稞材料在遗传上存在较大差异[14],野生种质中等位基因数量高于栽培大麦[15]。以SNP标记对种质群体结构及性状的研究结果表明,可将33 176份大麦种质划分为5个亚群,且发现许多参与大麦驯化和育种选择的特征标记[16],二棱和六棱大麦间差异较大[17]。表型性状和分子标记是育种家获取不同青稞资源遗传差异的重要途径,表型性状观察分类是青稞分类学的主要研究方法之一。目前,在水稻[18]、谷子[19]、陆地棉[20]、藜麦[21]、花生[22]中以表型性状开展遗传多样性和综合评价的研究已有相关报道,开展种质资源遗传多样性研究和综合评价对深化种质利用具有重要意义。目前,中国青稞特异性、一致性、稳定性(distinctness uniformity stability,DUS)测试指南以形态性状测试为主,且详细界定了用于品种鉴别的表型及观测时期。青稞为自花授粉作物,新品种培育以传统种间杂交选育为主,利用分子标记辅助选择技术和转基因技术进行育种的单位较少。青稞育种过程因优异亲本数量有限导致其遗传基础狭窄,严重制约优异品种的选育进程。为进一步提高育成青稞品种产量、品质及抗性水平,需收集并筛选优异种质。【本研究切入点】目前,对青稞表型性状在自然群体间的分布规律尚不明确,且适宜用于青稞优异种质资源评价和筛选的指标体系尚未见相关报道。【拟解决的关键问题】本研究拟对两年两点间205份青稞种质的15个表型性状进行研究,并通过相关性分析、主成分分析、聚类分析和逐步线性回归分析明确该种质群体结构,并构建青稞优异种质评价体系,筛选出丰产稳产青稞种质,以期为新品种选育和优异性状的全基因组关联分析(genome-wide association study,GWAS)奠定理论基础。1 材料与方法
1.1 试验材料
以国内外205份青稞种质为参试材料(电子附表1),其中含西藏种质111份、青海34份、四川20份、甘肃4份、江苏4份、湖南2份、浙江2份、国外种质2份、源于其他各省种质5份,并有21份种质来源不详。1.2 试验设计
试验于2017—2018年在青海大学农林科学院(青海省西宁市,河谷灌溉农业区,地理位置:36°43′N,101°45′E,海拔2 261 m)和海北州农业科学研究所(青海省海北州海晏县,高寒农牧交错区,地理位置:37°0′N,100°51′E,海拔 3 160 m)试验田内进行。西宁试验地土质为沙壤土,土壤耕层有机质为22.49 g·kg-1、全氮含量1.78 g·kg-1、速效磷含量37.48 mg·kg-1、速效钾含量286 mg·kg-1。海北试验地土壤为高山草甸土,土壤耕层有机质为40.73 g·kg-1,全氮含量2.37 g·kg-1、速效磷含量14.50 mg·kg-1、速效钾含量86.13 mg·kg-1。根据生产上青稞品种的施肥量,两点间均施用磷酸二氢铵300 kg·hm-2和尿素150 kg·hm-2,苗期追施尿素37.5 kg·hm-2,等行距株距人工点播,行距20 cm,株距5 cm。2017年,西宁试点于4月6日播种,8月5日收获,海北试点于4月15日播种,9月20日收获;2018年,西宁试点于4月8日播种,8月10日收获,海北试点于4月17日播种,9月23日收获。试验采用随机区组设计,小区面积为2.5 m×4 m,设3次重复。1.3 试验方法
每份参试材料选取长势一致的10株材料进行表型性状调查。田间调查青稞倒伏率、产量,根系所测性状为根数和根干重;茎部所测性状包括株高、有效分蘖数、重心位置、茎秆壁厚、茎粗、茎秆强度;穗部所测性状为穗长、穗重、小穗数、穗粒数、千粒重,共统计15个指标。参照白羿雄等[23]研究方法测定表型性状。1.4 数据分析
采用Excel2010进行遗传多样性分析;采用作物品种区域试验管理分析系统1.0(RCT99)的AMMI模型对参试种质进行丰产稳产性分析[24,25];采用SPSS20.0进行正态性检验、互作分析、相关性分析、聚类分析、主成分分析和逐步线性回归分析,以构建青稞种质资源的表型评价体系。其中聚类分析方法为系统聚类平均联结(组间)法,隶属函数和遗传多样性指数的计算方式如下:μ(Xi)=(Xi?Xmin)/(Xmax?Xmin)(i=1,2,3,...,n)
式中,μ(Xi)为各材料第i个性状的隶属函数值,i为各材料第i个性状值,Xmax、Xmin分别为所有参试材料中第i个性状的最大值和最小值[26]。
采用Shannon-Wiener’s多样性指数(Shannon- Wiener’s diversity index H′)进行遗传多样性评价。
H′=-∑Pi×ln pi(i=1,2,3,...,n)
式中,pi表示某性状第i级别内材料份数占总份数的百分比[26]。
2 结果
2.1 表型性状的遗传多样性分析
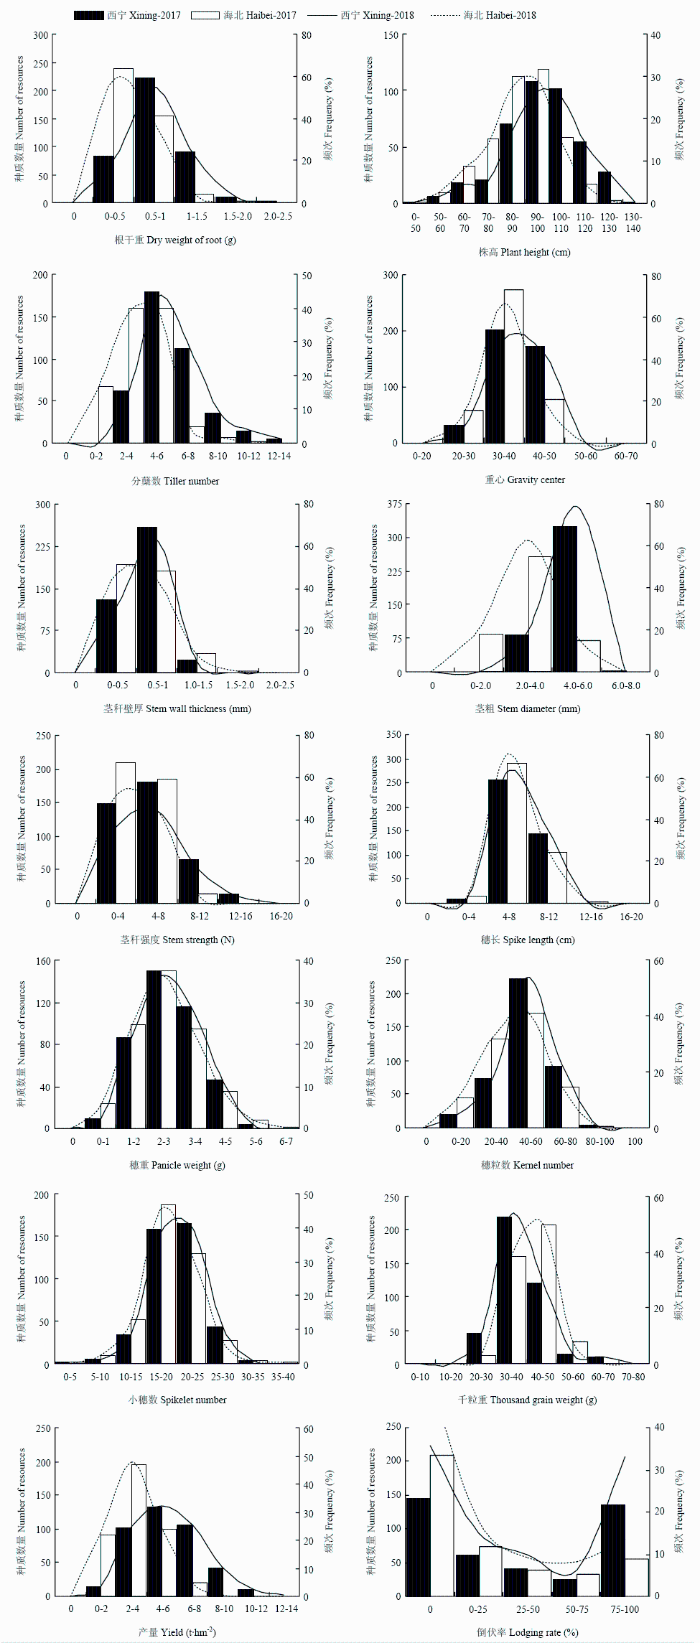
表型性状中倒伏率变异系数最大(CV=121.49%),表明倒伏率在表型性状中遗传变异最为丰富;重心位置变异系数最小(CV=14.68%),其遗传变异程度最低。在各性状中穗重的多样性指数最大(H′=2.08),其遗传多样性最为丰富。多样性指数分布范围为1.41—2.08(表1),且各性状基因型均分布在较大变幅区段内(图1),表明参试种质表型性状的遗传多样性丰富。Table 1
表1
表1青稞种质资源的表型性状
Table 1
| 表型性状Phenotypic traits | 平均值Mean±SD | 变幅Range | 变异系数CV (%) | 多样性指数H′ |
|---|---|---|---|---|
| 根数NOR | 30.13±9.70 | 9.33—75.33 | 32.18 | 1.99 |
| 根干重RDW (g) | 0.65±0.33 | 0.04—2.41 | 51.52 | 1.94 |
| 株高PH (cm) | 93.19±15.12 | 41.75—135.34 | 16.23 | 2.07 |
| 分蘖数NOT | 5.22±2.22 | 1.00—19.75 | 42.44 | 2.03 |
| 重心位置COG (cm) | 37.27±5.47 | 22.38—67.06 | 14.68 | 2.06 |
| 茎秆壁厚WT (mm) | 0.61±0.27 | 0.10—2.03 | 45.19 | 1.99 |
| 茎粗DMS (mm) | 3.86±1.10 | 1.19—7.53 | 28.57 | 2.03 |
| 茎秆强度SS (N) | 4.94±2.50 | 0.97—15.81 | 50.58 | 1.95 |
| 穗长SL (cm) | 7.17±1.66 | 2.50—14.25 | 23.14 | 2.07 |
| 穗重PW (g) | 2.70±1.04 | 0.45—6.04 | 38.34 | 2.08 |
| 小穗数SN | 19.91±4.38 | 5.00—42.50 | 21.85 | 2.07 |
| 穗粒数KPS | 46.77±16.15 | 8.25—98.00 | 34.54 | 2.07 |
| 千粒重TGW (g) | 39.95±7.09 | 21.51—72.45 | 17.74 | 2.04 |
| 产量Y (kg·hm-2) | 4396.80±2249.39 | 361.42—15409.74 | 51.16 | 2.01 |
| 倒伏率LR (%) | 32.18±39.10 | 0.00—100.00 | 121.49 | 1.41 |
新窗口打开|下载CSV
图1
 新窗口打开|下载原图ZIP|生成PPT
图1青稞种质资源表型性状值的分布
Fig. 1Distribution of phenotypic traits in hulless barley germplasms
各性状于两点间差异较大(表2)。西宁点除千粒重外各参试指标均值高于海北点,而西宁点大部分性状的变异系数低于海北点;表明相较于西宁点,海北点遗传变异更丰富,西宁点更适宜于各基因型生长发育。
Table 2
表2
表2表型性状在不同环境下的变异
Table 2
| 表型性状 Phenotypic traits | 西宁Xining | 海北Haibei | ||||
|---|---|---|---|---|---|---|
| 平均值Mean±SD | 变幅Range | 变异系数CV (%) | 平均值Mean±SD | 变幅Range | 变异系数CV (%) | |
| 根数NOR | 33.89±10.57 | 9.33—75.33 | 31.19 | 26.38±6.96 | 12.50—52.67 | 26.40 |
| 根干重RDW (g) | 0.79±0.35 | 0.17—2.41 | 44.06 | 0.50±0.24 | 0.04—1.64 | 48.23 |
| 株高PH (cm) | 97.84±15.36 | 47.25—135.34 | 15.70 | 88.53±13.36 | 41.75—122.50 | 15.09 |
| 分蘖数NOT | 6.35±2.17 | 2.75—19.75 | 34.23 | 4.10±1.60 | 1.00—10.50 | 39.18 |
| 重心位置COG (cm) | 38.64±5.56 | 22.38—67.06 | 14.38 | 35.90±5.03 | 22.50—50.00 | 14.01 |
| 茎秆壁厚WT (mm) | 0.64±0.24 | 0.18—2.03 | 37.89 | 0.57±0.30 | 0.10—1.61 | 52.15 |
| 茎粗DMS (mm) | 4.58±0.67 | 2.63—7.53 | 14.59 | 3.13±0.96 | 1.19—6.00 | 30.75 |
| 茎秆强度SS (N) | 5.58±2.98 | 0.97—15.81 | 53.39 | 4.30±1.68 | 1.50—11.59 | 39.03 |
| 穗长SL (cm) | 7.35±1.63 | 3.10—14.13 | 22.17 | 7.00±1.67 | 2.50—14.25 | 23.92 |
| 穗重PW (g) | 2.77±0.99 | 0.58—5.47 | 35.59 | 2.63±1.08 | 0.45—6.04 | 41.02 |
| 小穗数SN | 20.32±4.11 | 5.00—32.00 | 20.25 | 19.55±4.56 | 6.25—42.50 | 23.31 |
| 穗粒数KPS | 50.11±15.16 | 9.75—89.25 | 30.25 | 43.43±16.44 | 8.25—98.00 | 37.86 |
| 千粒重TGW (g) | 38.54±7.60 | 21.51—72.45 | 19.73 | 41.36±6.23 | 26.59—57.60 | 15.06 |
| 产量Y (kg·hm-2) | 5533.06±2269.52 | 1223.29—15409.74 | 41.02 | 3260.54±1546.84 | 361.42—8073.53 | 47.44 |
| 倒伏率LR (%) | 41.69±42.48 | 0.00—100.00 | 101.89 | 22.67±32.79 | 0.00—100.00 | 144.62 |
新窗口打开|下载CSV
2.2 表型性状在各基因型中的分布规律
除倒伏率外各性状指标均呈正态或偏态分布,分布频次呈中间高两边低的分布趋势(图1)。正态检验分析结果表明穗长、穗重在各基因型中呈正态分布;而穗粒数和千粒重基因型在海北点间呈正态分布(表3)。根数、株高、穗长、穗重、穗粒数、倒伏率的最高频次分布区间在两年两点间相同。部分性状最高分布频次在两点间存在一定差异,表明环境因素对各性状分布频次会产生一定程度影响(图1)。Table 3
表3
表3参试材料正态性检验
Table 3
| 环境 Environment | 西宁 Xining | 海北 Haibei | 西宁和海北 Xining and Haibei |
|---|---|---|---|
| 根数NOR | 0.00 | 0.00 | 0.00 |
| 根干重RDW (g) | 0.00 | 0.00 | 0.00 |
| 株高PH (cm) | 0.05 | 0.05+ | 0.02 |
| 分蘖数NOT | 0.00 | 0.00 | 0.00 |
| 重心位置COG (cm) | 0.00 | 0.00 | 0.00 |
| 茎秆壁厚WT (mm) | 0.01 | 0.00 | 0.00 |
| 茎粗DMS (mm) | 0.01 | 0.00 | 0.00 |
| 茎秆强度SS (N) | 0.00 | 0.00 | 0.00 |
| 穗长SL (cm) | 0.08+ | 0.20+ | 0.20+ |
| 穗重PW (g) | 0.20+ | 0.09+ | 0.20+ |
| 小穗数SN | 0.00 | 0.00 | 0.00 |
| 穗粒数KPS | 0.00 | 0.14+ | 0.00 |
| 千粒重TGW (g) | 0.00 | 0.20+ | 0.00 |
| 产量Y (kg·hm-2) | 0.02 | 0.00 | 0.00 |
| 倒伏率LR (%) | 0.00 | 0.00 | 0.00 |
新窗口打开|下载CSV
2.3 基因型、年份与环境的互作效应分析
各表型性状受环境因素、基因型、年份的影响均极显著,且各表型性状的基因型与环境(G×E)、基因型与年份(G×Y)、基因型×环境×年份(G×E×Y)间存在极显著互作效应(表4)。Table 4
表4
表4基因型、环境和年份的互作效益分析
Table 4
| 变异来源 Variance sources | df | 根数NOR | 根干重RDW | 株高PH | 分蘖数NOT | 重心位置COG | 茎秆壁厚WT | 茎粗DMS | 茎秆强度SS | ||||||||
|---|---|---|---|---|---|---|---|---|---|---|---|---|---|---|---|---|---|
| F | P | F | P | F | P | F | P | F | P | F | P | F | P | F | P | ||
| 基因型Genotype(G) | 204 | 3.45 | 0.00 | 6.00 | 0.00 | 32.37 | 0.00 | 5.17 | 0.00 | 13.26 | 0.00 | 19.29 | 0.00 | 7.79 | 0.00 | 7.36 | 0.00 |
| 年份Year(Y) | 1 | 598.80 | 0.00 | 1070.65 | 0.00 | 1323.06 | 0.001 | 1012.97 | 0.00 | 329.45 | 0.00 | 10457.98 | 0.00 | 16269.04 | 0.00 | 379.88 | 0.00 |
| 环境Environment(E) | 1 | 808.24 | 0.00 | 938.84 | 0.00 | 11.64 | 0.00 | 75.26 | 0.00 | 162.51 | 0.00 | 16954.86 | 0.00 | 3809.00 | 0.00 | 1395.45 | 0.00 |
| 基因型×环境G×E | 204 | 2.83 | 0.00 | 4.03 | 0.00 | 7.66 | 0.00 | 2.46 | 0.00 | 3.44 | 0.00 | 16.18 | 0.00 | 3.36 | 0.00 | 2.81 | 0.00 |
| 基因型×年份G×Y | 204 | 3.01 | 0.00 | 3.82 | 0.00 | 6.03 | 0.00 | 2.36 | 0.00 | 2.81 | 0.00 | 17.36 | 0.00 | 2.85 | 0.00 | 3.55 | 0.00 |
| 基因型×环境×年份G×E×Y | 204 | 3.39 | 0.00 | 3.96 | 0.00 | 15.69 | 0.00 | 3.85 | 0.00 | 3.83 | 0.00 | 70.20 | 0.00 | 31.43 | 0.00 | 5.92 | 0.00 |
| 变异来源 Variance sources | df | 穗长SL | 穗重PW | 小穗数SN | 穗粒数KSP | 千粒重TGW | 产量Y | 倒伏率LR | |||||||||
| F | P | F | P | F | P | F | P | F | P | F | P | F | P | ||||
| 基因型Genotype(G) | 204 | 10.74 | 0.00 | 19.45 | 0.00 | 10.33 | 0.00 | 25.94 | 0.00 | 73.94 | 0.00 | 3.83 | 0.00 | 1814.24 | 0.00 | ||
| 年份Year(Y) | 1 | 54.62 | 0.00 | 33.26 | 0.00 | 41.02 | 0.00 | 397.65 | 0.00 | 1529.21 | 0.00 | 961.55 | 0.00 | 60624.73 | 0.00 | ||
| 环境Environment(E) | 1 | 766.82 | 0.00 | 451.23 | 0.00 | 251.61 | 0.00 | 1018.16 | 0.00 | 828.19 | 0.00 | 15.51 | 0.00 | 49011.26 | 0.00 | ||
| 基因型×环境G×E | 204 | 2.55 | 0.00 | 4.04 | 0.00 | 4.42 | 0.00 | 4.22 | 0.00 | 33.03 | 0.00 | 2.03 | 0.00 | 690.30 | 0.00 | ||
| 基因型×年份G×Y | 204 | 3.36 | 0.00 | 4.88 | 0.00 | 3.66 | 0.00 | 4.50 | 0.00 | 30.53 | 0.00 | 2.29 | 0.00 | 510.09 | 0.00 | ||
| 基因型×环境×年份G×E×Y | 204 | 3.34 | 0.00 | 6.60 | 0.00 | 5.90 | 0.00 | 4.01 | 0.00 | 39.47 | 0.00 | 5.48 | 0.00 | 1450.58 | 0.00 | ||
新窗口打开|下载CSV
2.4 性状间相关分析
青稞根系、茎秆和穗部组织内各指标间存在显著相关性(表5)。根系中根数和根干重呈极显著正相关性。茎秆中重心位置、茎秆壁厚、茎粗两两指标间均呈极显著正相关性;穗部穗长、穗重、小穗数两两间均呈极显著正相关性,而穗粒数与千粒重间呈极显著负相关性。Table 5
表5
表5青稞15个表型性状相关系数
Table 5
| 性状 Trait | 根数 NOR | 根干重 RDW | 株高 PH | 分蘖数NOT | 重心位置COG | 茎秆壁厚厚 WT | 茎粗 DMS | 茎秆强度 SS | 穗长 SL | 穗重 PW | 小穗数 SN | 穗粒数 KPS | 千粒重 TGW | 产量 Y | 倒伏率 LR |
|---|---|---|---|---|---|---|---|---|---|---|---|---|---|---|---|
| 根数NOR | 1 | ||||||||||||||
| 根干重RDW | 0.712** | 1 | |||||||||||||
| 株高PH | -0.011 | 0.079* | 1 | ||||||||||||
| 分蘖数NOT | 0.304** | 0.312** | 0.055 | 1 | |||||||||||
| 重心位置COG | 0.131** | 0.154** | 0.669** | 0.043 | 1 | ||||||||||
| 茎秆壁厚WT | 0.313** | 0.336** | 0.071* | -0.042 | 0.146** | 1 | |||||||||
| 茎粗DMS | 0.312** | 0.395** | 0.262** | 0.305** | 0.279** | 0.505** | 1 | ||||||||
| 茎秆强度SS | 0.428** | 0.533** | 0.042 | 0.076* | 0.261** | 0.494** | 0.423** | 1 | |||||||
| 穗长SL | 0.236** | 0.248** | 0.001 | 0.026 | 0.154** | 0.293** | 0.134** | 0.407** | 1 | ||||||
| 穗重PW | 0.231** | 0.264** | -0.097** | -0.168** | 0.082* | 0.330** | 0.278** | 0.493** | 0.528** | 1 | |||||
| 小穗数SN | 0.200** | 0.235** | -0.111** | 0.009 | 0.104** | 0.277** | 0.241** | 0.401** | 0.680** | 0.664** | 1 | ||||
| 穗粒数KPS | 0.290** | 0.327** | 0.014 | -0.200** | 0.145** | 0.363** | 0.343** | 0.452** | 0.437** | 0.836** | 0.569** | 1 | |||
| 千粒重TGW | -0.108** | -0.088* | -0.058 | 0.028 | -0.036 | -0.096** | -0.051 | -0.022 | 0.055 | 0.104** | 0.032 | -0.165** | 1 | ||
| 产量Y | 0.436** | 0.464** | 0.05 | 0.631** | 0.155** | 0.200** | 0.532** | 0.386** | 0.300** | 0.483** | 0.388** | 0.493** | 0.219** | 1 | |
| 倒伏率LR | -0.130** | -0.152** | 0.507** | 0.100** | 0.333** | -0.161** | 0.064 | -0.266** | -0.181** | -0.305** | -0.278** | -0.181** | -0.130** | -0.071* | 1 |
新窗口打开|下载CSV
青稞根系、茎秆和穗部组织间的农艺性状也存在显著相关性。根系两项指标与茎秆中除株高外的各项指标呈极显著相关性,而同穗部除千粒重外各指标呈极显著相关性。茎秆各项指标同穗重呈显著相关性,且部分指标同穗部相关指标呈极显著相关性。产量同除株高性状外的各指标呈极显著正相关性,表明根系发达,茎秆分蘖多抗折力强,穗粒数多、千粒重大的参试材料产量高。倒伏率同根数、根干重、茎秆壁厚、茎秆强度、穗长、穗重、小穗数、穗粒数、千粒重呈极显著负相关性,同产量呈显著负相关性。根系发达、茎部抗折力高的青稞植株其机械固持能力较强,倒伏率低;青稞植株严重倒伏会限制穗部生长发育,使穗长变短、穗粒数减少、籽粒变小、穗重变轻、进而使产量锐减。
2.5 主成分分析及综合评价
前7个主成分代表青稞种质资源表型性状85.02%的遗传信息量(表6)。第1主成分贡献率为31.91%,为穗重、穗粒数因子;第2主成分贡献率为15.58%,为株高因子;第3主成分贡献率为11.69%,为分蘖数因子;第4、5主成分贡献率分别为8.79%和6.30%,均为千粒重因子;第6主成分贡献率为5.83%,为茎粗因子;第7主成分贡献率为4.93%,为穗长因子。Table 6
表6
表6青稞种质资源表型性状的主成分分析
Table 6
| 性状Trait | PV1a1i | PV2a2i | PV3a3i | PV4a4i | PV5a5i | PV6a6i | PV7a7i |
|---|---|---|---|---|---|---|---|
| 根数NOR | 0.604 | 0.205 | -0.393 | -0.318 | -0.100 | 0.314 | -0.205 |
| 根干重RDW (g) | 0.664 | 0.242 | -0.352 | -0.297 | -0.015 | 0.280 | -0.196 |
| 株高PH (cm) | 0.062 | 0.749 | 0.478 | 0.113 | 0.066 | 0.110 | -0.059 |
| 分蘖数NOT | 0.208 | 0.472 | -0.683 | 0.286 | -0.211 | -0.065 | 0.269 |
| 重心位置COG (cm) | 0.275 | 0.623 | 0.487 | 0.123 | 0.089 | 0.275 | -0.046 |
| 茎秆壁厚WT (mm) | 0.583 | 0.041 | 0.134 | -0.389 | 0.428 | -0.216 | 0.321 |
| 茎粗DMS (mm) | 0.607 | 0.416 | -0.049 | -0.045 | 0.217 | -0.481 | 0.125 |
| 茎秆强度SS (N) | 0.750 | 0.012 | 0.022 | -0.200 | 0.260 | 0.162 | 0.027 |
| 穗长SL (cm) | 0.626 | -0.238 | 0.219 | 0.229 | -0.173 | 0.351 | 0.416 |
| 穗重PW (g) | 0.758 | -0.39 | 0.268 | 0.184 | -0.063 | -0.138 | -0.248 |
| 小穗数SN | 0.691 | -0.345 | 0.197 | 0.252 | -0.215 | 0.075 | 0.272 |
| 穗粒数KPS | 0.753 | -0.234 | 0.332 | -0.026 | -0.231 | -0.247 | -0.323 |
| 千粒重TGW (g) | -0.008 | -0.141 | -0.172 | 0.691 | 0.603 | 0.165 | -0.178 |
| 产量Y (kg·hm-2) | 0.710 | 0.210 | -0.371 | 0.421 | -0.111 | -0.225 | -0.129 |
| 倒伏率LR (%) | -0.267 | 0.666 | 0.296 | 0.140 | -0.268 | -0.119 | -0.011 |
| 特征值E | 4.786 | 2.337 | 1.754 | 1.318 | 0.945 | 0.874 | 0.739 |
| 贡献率CR (%) | 31.909 | 15.580 | 11.692 | 8.785 | 6.301 | 5.827 | 4.927 |
| 累计贡献率CCR (%) | 31.909 | 47.489 | 59.181 | 67.966 | 74.268 | 80.095 | 85.022 |
新窗口打开|下载CSV
将种质资源的15个表型性状的值利用模糊隶属函数进行标准化处理,并将其带入7个主成分的得分中,求得各种质的7个主成分得分,第1主成分得分是:F1=0.604X1+0.664X2+0.062X3+0.208X4+0.275X5+ 0.583X6+0.607X7+0.750X8+0.626X9+0.758X10+0.691X11+0.753X12-0.008X13+0.710 X14-0.267X15,利用7个主成分贡献率权重(0.375、0.183、0.138、0.103、0.074、0.069和0.058),构建用于筛选青稞优异种质的评价指标F值,其为F=0.375F1+0.183F2+0.138F3+0.103F4+ 0.074F5+0.069F6+0.058F7,F值越高,可初步表明该种质综合性状越好。
利用205份青稞种质在两年两点间F值的平均值大小,筛选出排名前十的种质为170(1.498)、131(1.495)、168(1.482)、165(1.464)、118(1.460)、164(1.453)、109(1.446)、143(1.443)、132(1.416)和107(1.415),其F值较高,表明其综合性状较好;排名较低的10份种质为116(0.878)、96(0.873)、179(0.873)、124(0.850)、193(0.842)、130(0.819)、6(0.760)、83(0.714)、4(0.688)和5(0.675),其F值较低。
以参试材料表型性状及F值进行逐步回归分析,并构建线性回归方程以用于优异种质鉴选,构建方程为:F=(-344.805+125.172X2+12.620X5+121.132X6+ 51.404X7+18.736X8+37.733X9+4.148X12+0.027X14)×10-3,其中X2、X5、X6、X7、X8、X9、X12和X14分别代表根干重、重心位置、茎秆壁厚、茎粗、茎秆强度、穗长、穗粒数、产量。该回归方程的相关系数r=0.988,决定系数R2=0.976,表明X2、X5、X6、X7、X8、X9、X12、X14这8个自变量可决定F值总变异的97.6%,F值为4 062.225。相关性分析研究结果表明,以上8个表型性状同F值均呈极显著相关性(表7),则该方程可用于青稞种质资源的综合评价。
Table 7
表7
表7表型性状与综合得分(F值)间的相关性
Table 7
| 性状 Trait | F值 F-value | 性状 Trait | F值 F-value | |
|---|---|---|---|---|
| 根干重RDW (g) | 0.621** | 穗长SL (cm) | 0.589** | |
| 重心位置COG (cm) | 0.482** | 穗粒数KPS | 0.706** | |
| 茎秆壁厚WT (mm) | 0.575** | 产量Y (kg·hm-2) | 0.697** | |
| 茎粗DMS (mm) | 0.678** | 茎秆强度SS (N) | 0.727** |
新窗口打开|下载CSV
2.6 表型性状的聚类分析
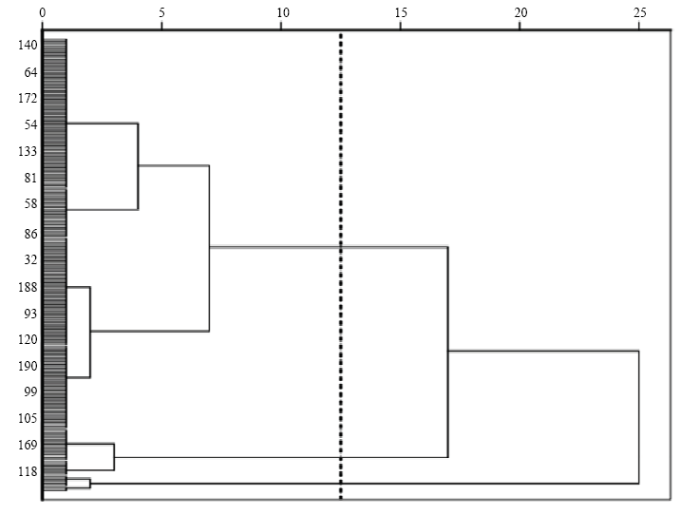
可将205份供试材料划分为3个亚类(图2)。第一类,共177份,占供试材料的86.34%,为高重心、易倒伏、而其它性状居中的种质;第二类,共21份,为矮秆、低重心且其余性状表现良好的优异种质,其中,产量均值高达6 250.65 kg·hm-2;第三类,共7份,为株高较高,而根系欠发达、茎部易折、穗部性状表现较差的种质。图2
 新窗口打开|下载原图ZIP|生成PPT
图2205份青稞种质聚类分析图
Fig. 2205 clusters of hulless barley germplasm cluster analysis
2.7 丰产稳产性分析
从图3可以看出,参试种质中ZDM9845的丰产性最好,但其稳产性较差;ZYM1906和ZYM1757的稳产性较好,但丰产性极差。甘青4号则具有最好的丰产稳产性,另外昆仑14号、ZDM9734、ZDM9334和西藏42的丰产稳产性均较好。图3
 新窗口打开|下载原图ZIP|生成PPT
图3205份青稞种质的AMMI双标图
Fig. 3AMMI double plot of 205 copies of hulless barley germplasms
丰产稳产性较好的5个品种为甘青4号、昆仑14号、藏815007、ZDM9334和西藏42,其F值在参试材料中位于前十且均属于聚类分析中优异青稞种质(第二类)。聚类分析中优质青稞种质类别(第二类)中包含F值最高的10份品种中的9份,故聚类分析结果和AMMI模型共同验证本研究所构建回归方程有较高可靠性。
3 讨论
3.1 表型性状的遗传多样性分析
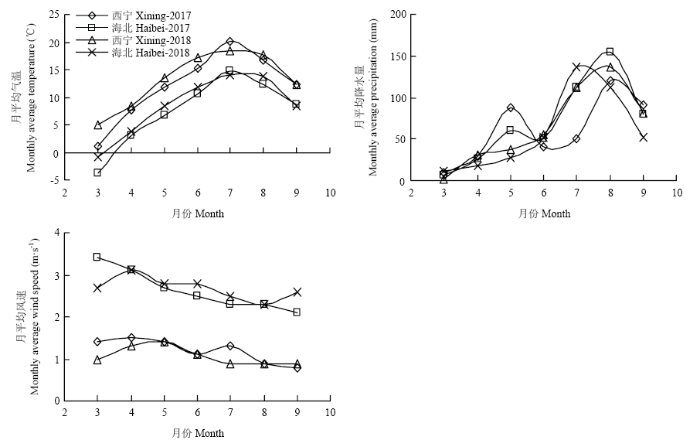
表型性状是结构基因的功能表现,是长期自然与人工选择的结果,虽易受时间、环境因素影响,但表型性状观察结果直观,经济实用,通过表型性状的遗传多样性分析已经在多种作物中得到应用[27,28]。本研究利用青稞的15个表型形状,计算Shannon-Wiener’s多样性指数的均值为1.94,遗传多样性指数较高,说明该批种质具有较高的丰富度和均匀度。倒伏率在15个表型性状中变异系数最高,该结果同白羿雄等[23]研究结果一致,说明倒伏率的遗传变异极为较丰富,倒伏率的分布频次中无倒伏和严重倒伏的青稞品种较多,中度倒伏品种较少,歧化现象严重,同时倒伏率在基因型间的互作、环境间的互作均为极显著,表明基因型和环境均会对倒伏率性状的遗传效应产生极大影响,该结果同黄文辉等[29]研究结果一致。本研究结果表明青稞穗长、穗重2个性状在基因型中呈正态分布,同王贵学等[30]在小麦中对这两个性状的研究结果相同。本研究过程受到群体结构、样本数量、环境因素的限制,检验出青稞中2个性状呈正态分布,其余性状是否呈正态分布,仍需开展进一步的研究。性状指标在西宁和海北两生态区呈现一定差异性,例如东都红胶泥、ZDM9854、甘青9188-10在西宁点表现较好丰产性,适宜在河谷灌溉农业区种植,却不适宜在高寒农牧交错区种植。除千粒重外西宁点各性状指标均高于海北点,该现象可能为环境因子所致。相较于西宁点,海北点海拔高、风力大(海北点平均风速是西宁点的2.3倍)、气温低(图4),会使青稞植株发育受限,最终致使绝大部分指标降低;但高海拔地区昼夜温差大,光合作用累积的营养物质于夜间消耗较少,籽粒中相对积累较多的营养物质,致使海北点青稞千粒重较大,该千粒重的研究结果同侯维海等[31]研究结果一致。
图4
 新窗口打开|下载原图ZIP|生成PPT
图42017—2018西宁、海北气象数据
Fig. 4The meteorological data of Xining and Haibei in 2017-2018
3.2 青稞种质资源表型性状综合评价
种质资源综合评价可为作物品种选育及综合利用提供重要参考。在作物中常利用加权隶属函数法进行耐盐[32]、耐低磷等耐性及抗性[33]进行综合评价;灰色关联分析、加权分析进行综合评价的方法不能有效评价种质具有一定局限性;主成分分析法结合丰产稳产性分析是近年来对作物开展遗传多样性评价的有效方法[34]。主成分分析基于表型数据标准化,且利用其得分归一化处理的F值可为育种和遗传研究提供参考[19]。而本文利用主成分分析和逐步线性回归构建青稞综合评价体系,从15个表型性状中筛选出根数等8个性状作为鉴定指标。以评价体系为基础,结合丰产稳产性分析结果,筛选出5份优异种质,分别为昆仑14号、甘青4号、藏815007、ZDM9334、西藏42号。筛选种质均表现出根系发达,茎秆粗壮,穗部饱满,每穗粒数均高于60,产量高于6 000 kg·hm-2,不倒伏,表型性状综合表现优异、且表现出较好丰产和稳产特性。其中昆仑14号为国审青稞品种,具有高产、稳产、适应性广的特点,其在五省藏区推广面积达13.35万公顷;甘青4号为甘南藏族自治州的主栽品种,其在该州推广面积达5万公顷。由此表明,利用表型综合性状综合得分(F值)对青稞材料进行综合评价具有较高的可靠性,且以此方法可增加筛选优良种质的准确率,提高育种工作效率。此外,表型性状研究会存在一定局限性,为拓宽研究的广度和深度仍需结合现代分子技术手段进行遗传学评价和鉴定[35,36,37]。笔者所在青稞课题组拟后续结合SNP标记的基因分型结果,进一步明确该群体的遗传结构和亲缘关系远近,以拓展青稞遗传多样性和综合评价研究的深度和广度。
4 结论
参试青稞种质资源的遗传多样性丰富,穗长、穗重在各基因型中呈正态分布,其余12个性状在基因型中呈偏态分布;该批种质可划分为3个亚类;根干重、重心位置、茎秆壁厚、茎粗、茎秆强度、穗长、穗粒数、产量8个指标可作为核心种质评价的综合指标。参考文献 原文顺序
文献年度倒序
文中引用次数倒序
被引期刊影响因子
DOI:10.1016/j.jplph.2019.153093URLPMID:31841951 [本文引用: 1]

Nitrogen (N) mobilization from mature leaves plays a key role in supplying amino acids to vegetative and reproductive sinks. However, it is unknown if the mobilized N is predominantly sourced by net N-export (a senescence-related process) or other source of N-export from leaves. We used a new approach to partition gross and net N-export from leaf blades at different developmental stages in Cleistogenes squarrosa (a perennial C4 grass). Net N-export was determined as net loss of leaf N with age, while gross N-export was quantified from isotopic mass balances obtained following 24?h-long 15N-labeling with nitrate on 10-12 developmentally distinct (mature and senescing) leaves of individual major tillers. Net N-export was apparent only in older leaves (leaf no.?>?7, with leaves numbered basipetally from the tip of the tiller and leaf no. 2 the youngest fully-expanded leaf), while gross N-export was largely independent of leaf age category and was ~8.4 times greater than the net N-export of a tiller. At whole-tiller level, N import compensated 88?±?14 (SE) % of gross N-export of all mature blades leading to a net N-export of 0.51?±?0.07 (SE) μg h-1 tiller-1. N-import was equivalent to 0.09?±?0.01 (SE) d-1 of total leaf N, similar to reported rates of leaf protein turnover. Gross N-export from all mature blades of a tiller was ~1.9-times the total demand of the immature tissues of the same (vegetative) tiller. Significant N-export is evident in all mature blades, and is not limited to senescence conditions, implying a much shorter mean residence time of leaf N than that calculated from net N-export. Gross N-export contributes not only to the N demand of the immature tissues of the same tiller but also to N supply of other sinks, such as newly formed tillers. N dynamics at tiller level is integrated with that of the remainder of the shoot, thus highlights the importance of integration of leaf-, tiller-, and plant-scale N dynamics.
DOI:10.1016/j.jplph.2019.153093URLPMID:31841951 [本文引用: 1]
Nitrogen (N) mobilization from mature leaves plays a key role in supplying amino acids to vegetative and reproductive sinks. However, it is unknown if the mobilized N is predominantly sourced by net N-export (a senescence-related process) or other source of N-export from leaves. We used a new approach to partition gross and net N-export from leaf blades at different developmental stages in Cleistogenes squarrosa (a perennial C4 grass). Net N-export was determined as net loss of leaf N with age, while gross N-export was quantified from isotopic mass balances obtained following 24?h-long 15N-labeling with nitrate on 10-12 developmentally distinct (mature and senescing) leaves of individual major tillers. Net N-export was apparent only in older leaves (leaf no.?>?7, with leaves numbered basipetally from the tip of the tiller and leaf no. 2 the youngest fully-expanded leaf), while gross N-export was largely independent of leaf age category and was ~8.4 times greater than the net N-export of a tiller. At whole-tiller level, N import compensated 88?±?14 (SE) % of gross N-export of all mature blades leading to a net N-export of 0.51?±?0.07 (SE) μg h-1 tiller-1. N-import was equivalent to 0.09?±?0.01 (SE) d-1 of total leaf N, similar to reported rates of leaf protein turnover. Gross N-export from all mature blades of a tiller was ~1.9-times the total demand of the immature tissues of the same (vegetative) tiller. Significant N-export is evident in all mature blades, and is not limited to senescence conditions, implying a much shorter mean residence time of leaf N than that calculated from net N-export. Gross N-export contributes not only to the N demand of the immature tissues of the same tiller but also to N supply of other sinks, such as newly formed tillers. N dynamics at tiller level is integrated with that of the remainder of the shoot, thus highlights the importance of integration of leaf-, tiller-, and plant-scale N dynamics.
[本文引用: 1]
[本文引用: 1]
[本文引用: 1]
[本文引用: 1]
[本文引用: 1]
[本文引用: 1]
[本文引用: 1]
[本文引用: 1]
[D].
[本文引用: 1]
[D].
[本文引用: 1]
DOI:10.1007/s10722-017-0582-5URL [本文引用: 1]
DOI:10.1007/s00122-003-1328-7URL [本文引用: 1]
We analyzed genetic diversity in the storage protein hordein encoded at Hor-1, Hor-2 and Hor-3 loci in seeds from 211 accessions of wild close relatives of barley, Hordeum vulgare ssp. agriocrithon and H. vulgare ssp. spontaneum. Altogether 32, 27 and 13 different phenotypes were found for Hor-1, Hor-2 and Hor-3, respectively. A comparison of our results with those of previous studies indicates that Tibetan samples reflect the highest diverse level of hordein phenotypes when compared to samples from Israel and Jordan. This high degree of polymorphism supports the hypothesis that Tibet is one of the original centers of H. vulgare L.
DOI:10.1007/s00122-013-2065-1URL [本文引用: 1]
Modern genomics approaches rely on the availability of high-throughput and high-density genotyping platforms. A major breakthrough in wheat genotyping was the development of an SNP array. In this study, we used a diverse panel of 172 elite European winter wheat lines to evaluate the utility of the SNP array for genomic analyses in wheat germplasm derived from breeding programs. We investigated population structure and genetic relatedness and found that the results obtained with SNP and SSR markers differ. This suggests that additional research is required to determine the optimum approach for the investigation of population structure and kinship. Our analysis of linkage disequilibrium (LD) showed that LD decays within approximately 5–10?cM. Moreover, we found that LD is variable along chromosomes. Our results suggest that the number of SNPs needs to be increased further to obtain a higher coverage of the chromosomes. Taken together, SNPs can be a valuable tool for genomics approaches and for a knowledge-based improvement of wheat.
DOI:10.1007/s10528-016-9711-7URLPMID:26762294 [本文引用: 1]
Analysis of the genetic diversity and population structure of crops is very important for use in breeding programs and for genetic resources conservation. We analyzed the genetic diversity and population structure of 47 rice genotypes from diverse origins using amplified fragment length polymorphism (AFLP) markers and morphological characters. The 47 genotypes, which were composed of four populations: Iranian native varieties, Iranian improved varieties, International Rice Research Institute (IRRI) rice varieties, and world rice collections, were analyzed using ten primer combinations. A total of 221 scorable bands were produced with an average of 22.1 alleles per pair of primers, of which 120 (54.30%) were polymorphic. The polymorphism information content (PIC) values varied from 0.32 to 0.41 with an average of 0.35. The high percentage of polymorphic bands (%PB) was found to be 64.71 and the resolving power (R p) collections were 63.36. UPGMA clustering based on numerical data from AFLP patterns clustered all 47 genotypes into three large groups. The genetic similarity between individuals ranged from 0.54 to 0.94 with an average of 0.74. Population genetic tree showed that Iranian native cultivars formed far distant cluster from the other populations, which may indicate that these varieties had minimal genetic change over time. Analysis of molecular variance (AMOVA) revealed that the largest proportion of the variation (84%) to be within populations showing the inbreeding nature of rice. Therefore, Iranian native varieties (landraces) may have unique genes, which can be used for future breeding programs and there is a need to conserve this unique diversity. Furthermore, crossing of Iranian genotypes with the genetically distant genotypes in the other three populations may result in useful combinations, which can be used as varieties and/or lines for future rice breeding programs.
DOI:10.4238/2015.October.29.7URLPMID:26535702 [本文引用: 1]
In the current study, morphological traits and molecular markers were used to assess the genetic diversity of 29 cultivated tomatoes, 14 wild tomatoes and seven introgression lines. The three components of the principal component analysis (PCA) explained 78.54% of the total morphological variation in the 50 tomato genotypes assessed. Based on these morphological traits, a three-dimensional PCA plot separated the 50 genotypes into distinct groups, and a dendrogram divided them into six clusters. Fifteen polymorphic genomic simple- sequence repeat (genomic-SSR) and 13 polymorphic expressed sequence tag-derived SSR (EST-SSR) markers amplified 1115 and 780 clear fragments, respectively. Genomic-SSRs detected a total of 64 alleles, with a mean of 4 alleles per primer, while EST-SSRs detected 52 alleles, with a mean of 4 alleles per primer. The polymorphism information content was slightly higher in genomic-SSRs (0.49) than in EST-SSRs (0.45). The mean similarity coefficient among the wild tomatoes was lower than the mean similarity coefficient among the cultivated tomatoes. The dendrogram based on genetic distance divided the 50 tomato genotypes into eight clusters. The Mantel test between genomic-SSR and EST-SSR matrices revealed a good correlation, whereas the morphological matrices and the molecular matrices were weakly correlated. We confirm the applicability of EST-SSRs in analyzing genetic diversity among cultivated and wild tomatoes. High variability of the 50 tomato genotypes was observed at the morphological and molecular level, indicating valuable tomato germplasm, especially in the wild tomatoes, which could be used for further genetic studies.
[D].
[本文引用: 1]
[D].
[本文引用: 1]
[本文引用: 1]
[本文引用: 1]
DOI:10.7606/j.issn.1009-1041.2011.06.006URL [本文引用: 1]
Hulless barley is the typical crop in Tibetan Plateau. The genetic diversity of 55 hulless barley materials from Tibetan Plateau was studied by SSR markers. A total of 48 alleles were identified at 13 polymorphic SSR loci. The number of alleles per locus ranged from 2 to 10 with an average of 3.7, 1 to 21 genotypes could be detected by the polymorphic loci, and Nei’s gene diversity index ranged from 0 to 0.4998 with an average of 0.2921. Shannon information index ranged from 0 to 0.6930 with an average of 0.4461. All of the results indicated that the genetic diversity of hulless barley from Tibetan Plateau was abundant. There was a great difference among the hulless barley cultivars from different ecological regions. The alleles of 15 materials from Yunnan were more than Tibet, Sichuan and Qinghai, with the highest of Nei’s gene diversity index, and the lowest Shannon information index. The genetic diversity of Yunnan was the most abundant, while Sichuan was the less. The materials were divided into five groups by cluster analysis, and some materials were not distinguished clearly by cluster analysis based on ecological types, indicating that growth habits of these materials were independent with related behaviors of SSR primer loci, but clustering based on SSR polymorphism was related to ecological areas generally. Obtaining the affinity of hulless barley materials by cluster analysis would provide references for genetic study and breeding.
DOI:10.1007/s10722-015-0285-8URL [本文引用: 1]
DOI:10.1371/journal.pone.0094688URLPMID:24732668 [本文引用: 1]
New sources of genetic diversity must be incorporated into plant breeding programs if they are to continue increasing grain yield and quality, and tolerance to abiotic and biotic stresses. Germplasm collections provide a source of genetic and phenotypic diversity, but characterization of these resources is required to increase their utility for breeding programs. We used a barley SNP iSelect platform with 7,842 SNPs to genotype 2,417 barley accessions sampled from the USDA National Small Grains Collection of 33,176 accessions. Most of the accessions in this core collection are categorized as landraces or cultivars/breeding lines and were obtained from more than 100 countries. Both STRUCTURE and principal component analysis identified five major subpopulations within the core collection, mainly differentiated by geographical origin and spike row number (an inflorescence architecture trait). Different patterns of linkage disequilibrium (LD) were found across the barley genome and many regions of high LD contained traits involved in domestication and breeding selection. The genotype data were used to define 'mini-core' sets of accessions capturing the majority of the allelic diversity present in the core collection. These 'mini-core' sets can be used for evaluating traits that are difficult or expensive to score. Genome-wide association studies (GWAS) of 'hull cover', 'spike row number', and 'heading date' demonstrate the utility of the core collection for locating genetic factors determining important phenotypes. The GWAS results were referenced to a new barley consensus map containing 5,665 SNPs. Our results demonstrate that GWAS and high-density SNP genotyping are effective tools for plant breeders interested in accessing genetic diversity in large germplasm collections.
DOI:10.1007/s10722-017-0527-zURL [本文引用: 1]
DOI:10.3724/SP.J.1006.2012.00829URL [本文引用: 1]
Germplasm resources are fundamental in rice breeding and dissecting complex traits; however, assessment of genetic diversity benefits the identification of optimal parental combinations to produce segregating offspring with maximum genetic variability, and facilitates the introgression of favorable genes from various germplasm into commercial cultivars. The USDA rice core collection (USDA-RCC) (1 579 rice accessions originated from six continents), was analyzed with 14 phenotypic traits to assess diversity and phenotypically superior rice germplasm. Themain results were summarized as follows: (1) Genetic distance of the germplasm from Asia and Africa to that of Oceania was larger. Rice germplasm from Asia, Africa and Oceania had accordingly greater phenotypic and genetic diversities, and genetic diversity of different traits was different among continents. Six traits including kernel length/width (KLW), alkali spreading value (ASC), plant height (PH), kernel width (KW), 1000-kernel weight (TKW) and amylose content (AC) had greater genetic diversity. (2) Comprehensive assessment of phenotypic traits was conducted using principal component analysis (392768 from Vietnam had the best comprehensive traits while the accession PI 281760 performed the worst comprehensive traits, and AC, HD, PH, lodging, BRC and HC would be suitable as comprehensive criteria for assessing USDA-RCC germplasm. We suggest these rice germplasm possessing great phenotypic diversity should be widely utilized in breeding programs, moreover, these rice germplasm with farther genetic distance and different comprehensive traits should be appropriately considered for the parental selection.PCA) and step regression analysis, demonstrating that the accession PI
DOI:10.3724/SP.J.1006.2016.00019URL [本文引用: 2]
Evaluation of genetic diversity could benefit the identification of optimal parental combinations for obtaining segregating offspring with maximum genetic variability, and facilitate the introgression of favorable genes from various germplasm into commercial cultivars. In this study, foxtail millet core collections including 878 world-wide accessions were evaluated through phenotypic analysis of 15 agronomic traits. Main conclusions are as follows: (1) Chinese accessions present higher level of phenotypic diversity, especially in grain weight per main stem, panicle length, panicle diameter, plant height, stem node number and growth period; phenotypic diversity is lower in elite cultivars than in traditional landraces;gains of breeding progress in foxtail millet are expressed in reduced plant height and panicle length, coupling with increased diameter of main stem, stem node number, panicle diameter, grain weight per main stem, panicle weight per main stem and growth period; (2)from the cluster analysis, foreign resources are divided into three categories according to the geographical origins, the first category mainly includes accessions from northeast European countries, the second cluster is mainly collected from North America and Africa, and the third group includes varieties mainly from East Asia, South Asia, African, and European countries; Chinese collections is able to be divided into three groups of spring-sowing, summer-sowing and southern ecotypes; (3) comprehensive assessment of phenotypic traits based on principal component analysis (PCA) and step regression analysis demonstrates that leaf sheath color, bristle length, hull color, grain color, plant height, spike length, stem diameter and grain weight per plant can be used as main identification indicators of foxtail millet phenotypic variations. This research will benefit the utilization of foxtail millet resources in variety breeding practices in the future.
DOI:10.3864/j.issn.0578-1752.2016.19.003URL [本文引用: 1]
【Objective】 The objective of this study is to analyze the genetic diversity and the law of genetic variation of phenotypic traits and explore the comprehensive evaluation techniques for core collection in upland cotton.【Method】The genetic diversity of 419 core collections in upland cotton was analyzed with 17 phenotypic traits. Genetic diversity of phenotypic traits was calculated using Shannon-weaver Information Index. Phenotypic distance was analyzed using Nei’s 1973, and then NTSYS-pc 2.20q software was used for cluster analysis of core collections. With SAS9.2, the best linear unbiased estimate (BLUE) value was gotten from phenotypic trait data, and then the optimum value of phenotypic traits was calculated according to the best linear unbiased estimator. Meanwhile, the principal component, regression and correlation analysis were also used to study the comprehensive evaluation index and method of core collection. 【Result】 Based on the analysis of phenotypic traits of core collection, it was found that the variation of boll number, boll weight, lint percentage, seed index and other traits were greater with coefficient of variation over 10% , while the variation of fiber breaking strength, micronaire level and the upper half of the average length was smaller which their coefficient of variation was below 10%. Variance analysis found that there were significant differences in the phenotypic traits between various locations, between years, and between locations and years. The phenotypic traits of different geographical origin germplasms were quite different. The growing stage elongation, upper half mean length, lint percentage and other traits from the geographical origin of the Yangtze River areas were higher than those of other geographic origins, and the comprehensive properties including the fiber strength, boll weight, uniformity index, plant height, and spinning uniformity index from the Northwest areas were the best. The yield and fiber quality traits from the US germplasms were superior to the sum of the other countries. Genetic diversity indices of phenotypic traits were 0.351-3.796, with an average of 1.715. The result of analysis on the genetic diversity of different geographical origins indicated that the genetic diversity and genetic richness in the Yellow River areas was the highest, but that in south China was the lowest. Cluster analysis showed that the upland cotton lines were overall dispersed with no obvious groups, but the partial accessions with similar characteristics can be clustered into 13 groups. After comprehensive evaluating these core collections, seven principal components were found when the cumulative contribution rate was more than 85%. The comprehensive value (F) of phenotypic traits of core collections averaged 1.740. The highest F value (2.302) was from Australia’s N74-250, and the lowest F value (0.624) was from Liaoyang green cotton. Correlation analysis between 17 phenotypic traits and their F values illuminated that 14 phenotypic traits including boll weight, lint percentage, fiber strength, upper half mean length, etc. were very significantly correlated with the F values, except micronaire, seed index and yellow givers. Finally, the regression equation was constructed for comprehensively evaluating the core collection with 8 phenotypic traits as the independent variables including boll opening stage, boll weight, elongation, flowering, micronaire, plant height, number of fruit branches, and spinning consistent index. 【Conclusion】 The core collection of upland cotton from China has a rich genetic diversity. The difference in genetic variation of the germplasms with different geographical origins is great. The accessions from different ecological zones have unique characteristics.
[本文引用: 1]
[本文引用: 1]
[本文引用: 1]
[本文引用: 1]
DOI:10.3864/j.issn.0578-1752.2019.02.004URL [本文引用: 2]
【Objective】 Lodging has become one of the main factors affecting the production and yield of hulless barley. Screening the traits closely related to the lodging resistance and constructing the lodging resistance evaluation system is an important theoretical basis for the breeding of hulless barley varieties. 【Method】 23 agronomic traits in roots, stems, and ears related to the lodging of 35 hulless barley germplasms were analyzed by statistical method. The variance analysis was carried out to identify the differences among different traits, and correlation analysis was used to screen out the traits which closely related to the lodging resistance. The indexes were finally constructed by principal component analysis and linear stepwise regression analysis to construct a hulless barley resistance evaluation system. 【Result】 The results showed that different genotypes of barley cultivars had larger differences among the same traits, and the differences of genotypes among the phenotypic traits were extremely significant, among this, the genetic variation of lodging rate was the most abundant. The agronomic traits of the same genotypes were greatly affected between different ecoregion, and the genetic variation of the genotypes in Haibei alpine farming-pastoral ecotone was abundant. There were significant interaction effects between genotypes of various traits and environmental factors (P<0.05). Correlation analysis showed that the stem strength was most closely related to the lodging resistance of the hulless barley, which was used lodging resistance index to construct the lodging resistance evaluation system. When the plant had more tiller numbers, longer third and fourth stem segments, which caused the lodging, and made the number of grains reduced, and the ear weight became lighter. When the root dry weight was heavier, the stem was heavier, the wall thickness was thicker, and the stem strength was larger, which made the plants have the stronger ability to retain and lodging resistance. 【Conclusion】 Based on tiller numbers, ear weight, stem length, stem weight and stem strength, a comprehensive evaluation system for the resistance indexes of barley was constructed. The results showed that the system was reliable and could be used for the evaluation of lodging resistance of hulless barley germplasms.
DOI:10.1097/HP.0000000000001158URLPMID:31842137 [本文引用: 1]
In 2018, Defence Research and Development Canada, in partnership with Natural Resources Canada, led a field trial of survey and mapping of a large dispersion of radioactivity using Unmanned Aerial Vehicles (UAVs). The intent was to disperse La material in a 3,200 m L-polygon with an approximate activity level of 10 MBq m and to measure the radioactive material using sensors carried by UAVs. Due to the potential radiological hazard to personnel, the activity was approved only if Unmanned Ground Vehicles (UGVs) were able to completely handle and disperse the material remotely. One UGV was equipped with a traditional agricultural sprayer to disperse the material, and one UGV was equipped with a force feedback manipulator arm. Due to the freezing temperatures during dispersal, the 35 GBq of La was dispersed non-uniformly as one sprayer boom failed to perform as tested. However, rough analysis of the electronic dosimetry on the UGV concluded that 99% of the material was dispersed on the ground. The dosimeter placed closest to the robot manipulator arm, used for dispersal of material, indicated a contact dose of 33.5 mSv. The electronic dosimeter placed where the driver would have sat on the sprayer vehicle if it were not unmanned indicated a dose of 22.3 mSv. Thus, the use of UGVs for material dispersion substantially reduced the external exposure to personnel. The use of UGVs eliminated the potential of internal exposure as well. The Radiation Safety Officer received the highest dose at approximately 3 μSv, with the majority of the exposure coming from the handling of the Type A container.
[本文引用: 1]
[本文引用: 1]
DOI:10.1016/j.ecolind.2016.03.043URL [本文引用: 2]
DOI:10.3724/SP.J.1006.2018.00063URL [本文引用: 1]
DOI:10.3724/SP.J.1006.2018.00063URL [本文引用: 1]
[本文引用: 1]
[本文引用: 1]
[本文引用: 1]
[本文引用: 1]
[本文引用: 1]
[本文引用: 1]
[本文引用: 1]
[本文引用: 1]
DOI:10.3864/j.issn.0578-1752.2014.10.018URL [本文引用: 1]
【Objective】Salt tolerance of 278 naked oat accessions from different ecological zones at germination stage were comprehensively evaluated in order to provide a guide for identification and evaluation of salt tolerance of naked oat, and supply abundant materials of salt tolerance for breeding of salt tolerance as breeding parents.【Method】Identification for salt tolerant germplasm of naked oat was conducted in an artificial climate incubator with germination method on paper in petri dish under 1.2% NaCl aqueous solution and distilled water, respectively. The culture condition was constant temperature 25℃, relative humidity (70±5)%, 12 h light (6:00-18:00), light intensity 150 μmol?m-2?s-1 in the incubator. When the length of radicle was equal to that of kernel at least, and the shoot height was not less than 1/2 of seed length, the seed was considered as germinated. Germination potential of tested accessions was counted after 96 hours cultivation. Final germination rate, length of the longest primary root and seedling height were measured after 168 hours cultivation. These four traits were used to identify salt tolerance of tested accessions. Based on salt tolerance coefficients derived from four identification indices, the weight of each index was allocated according to variation coefficient of membership function value of four salt tolerance coefficients, and 278 naked oat accessions were evaluated for salt tolerance with the weighted membership function method and classified through cluster analysis.【Result】Compared with distilled water control, germination potential and germination rate of all accessions were declined except SHX88 and NM47, and the root length and seedling height of all accessions were suppressed by salt stress. There were differences among tested accessions based on the four kinds of identification indices. With the weighted membership function method and cluster analysis, salt tolerance of 278 naked oat accessions were comprehensively evaluated and categorized into five grades. Seventeen accessions were highly salt tolerant, 114 accessions were salt tolerant, 106 accessions were middle tolerant, 25 accessions were susceptible and 16 accessions were highly susceptible. Germination potential and germination rate were closer with salt tolerance at germination stage among the four identification indices, but germination rate was more variable than germination potential among tested accessions.【Conclusion】Germination rate is an efficient identification index for rapid identifying and preliminary screening of salt tolerant accessions. The weighted membership function method has good application value in the comprehensive evaluation of tolerance of naked oat to salt stress. SHX75 and other sixteen naked oat accessions which are highly tolerant to salt stress have provided a basis for breeding, cultivation and mechanism research of salt tolerance.
URL [本文引用: 1]
【Objective】 The objective of the experiment was to obtain some bruise-tolerant potato genotypes for the bruising-related research. 【Method】 One hundred and four potato genotypes were used to assess their bruises by analyzing skinning, internal bruise and browning by Principle Component Analysis (PCA), Multivariate Analysis of Variance (MAOVA) and cluster analysis. 【Result】 The vector of principle component was skinning>internal bruise>browning in PCA of three bruises while 104 potato genotypes can be clustered into six clusters with prominent difference. 【Conclusion】 The importance of three bruises for tuber was skinning (SK)>internal bruise (IB)>browning (BR). Some genotypes with good integrative bruise tolerance were obtained. The result can simplify bruising problem and provide basic materials for further research.
URL [本文引用: 1]
【目的】综合评价中国近年育成和引进的红麻品种,为红麻育种和生产利用提供科学依据。【方法】以中国“八•五”至“十•五”期间育种单位选育的及近年从国外引进的共40个红麻品种为供试材料,采用随机区组设计,2年各设3次重复。估算40个红麻品种12个产量和纤维品质性状的主成分,并以前3个主成分和欧氏距离为基础,分别作二维散点图和系统聚类分析。【结果】(1)在40份红麻种质中,前3个主成分累计贡献率达86.07%。第1主成分为韧皮纤维产量构成因子,贡献率达53.44%;第2主成分为茎秆皮骨构成因子贡献率达24.94%;第3主成分为纤维品质构成因子,贡献率达7.69%。(2)根据品种性状主成分表现,评选出综合性状优良的红麻新品种有福红952-1、福红2-1、KB11、福红992、SCS11-09、KB2、福红2号等7个。其中福红992、KB11、KB2和福红952-1等品种3个主成分构成因子协调最好。(3)在主成分二维排序分析中,当以第1主成分分别与第2主成分和第3主成分向量作二维排序分类,供试品种2个二维排序散布图对品种产量和品质性状的评价,可以把产量和品质性状优异的品种与相对较差的品种区分开来。(4)在欧氏距离聚类图中,当取值D =51.08时可把40份品种分成4类,即1个由36个品种聚成的大类群和1个由2个品种构成的亚类群,以及2个单一品种自成体系的个类(福红952-1、福红2号);在D =39.12水平面上,第Ⅰ大类又可分为3个小亚类群和5个相互距离较远的单一品种自成体系的个类,这5个品种分别为C2032、BG52-1、泰红763、金山无刺(迟)和福红7号。【结论】系统聚类结果可揭示出供试品种的相对遗传距离,对红麻育种亲本利用有一定的参考价值。二维排序分析结果对区分供试品种产量与品质性状优劣,具有简便、直观的特点。二维排序和欧氏距离2种不同分类方法,既有共性又有特异性,都能较好地为红麻品种改良亲本利用提供科学依据。
DOI:10.2135/cropsci2016.03.0200URL [本文引用: 1]
DOI:10.1016/j.molp.2018.01.009URLPMID:29421339 [本文引用: 1]
Wild potato species have substantial phenotypic and physiological diversity. Here, we report a comprehensive assessment of wild and cultivated potato species based on genomic analyses of 201 accessions of Solanum section Petota. We sequenced the genomes of these 201 accessions and identified 6?487?006 high-quality single nucleotide polymorphisms (SNPs) from 167 accessions in clade 4 of Solanum section Petota, including 146 wild and 21 cultivated diploid potato accessions with a broad geographic distribution. Genome-wide genetic variation analysis showed that the diversity of wild potatoes is higher than that of cultivated potatoes, and much higher genetic diversity in the agronomically important disease resistance genes was observed in wild potatoes. Furthermore, by exploiting information about known quantitative trait loci (QTL), we identified 609 genes under selection, including those correlated with the loss of bitterness in tubers and those involved in tuberization, two major domesticated traits of potato. Phylogenetic analyses revealed a north-south division of all species in clade 4, not just those in the S.?brevicaule complex, and further supported S. candolleanum as the progenitor of cultivated potato and the monophyletic origin of cultivated potato in southern Peru. In addition, we analyzed the genome of S.?candolleanum and identified 529 genes lost in cultivated potato. Collectively, the molecular markers generated in this study provide a valuable resource for the identification of agronomically important genes useful for potato breeding.
DOI:10.1007/s10722-017-0555-8URL [本文引用: 1]
