 ,1,**, 刘金栋,2,**, 刘彩云1, 贾德新1, 刘鹏,1,*, 王雅美,2,*
Genome-wide association study of nitrogen use efficiency related traits in common wheat (Triticum aestivum L.)
JIN Yi-Rong,1,**, LIU Jin-Dong,2,**, LIU Cai-Yun1, JIA De-Xin1, LIU Peng,1,*, WANG Ya-Mei,2,*通讯作者:
收稿日期:2020-03-24接受日期:2020-09-13网络出版日期:2021-03-12
| 基金资助: |
Received:2020-03-24Accepted:2020-09-13Online:2021-03-12
| Fund supported: |
作者简介 About authors
靳义荣, E-mail:
刘金栋, E-mail:

摘要
关键词:
Abstract
Keywords:
PDF (3110KB)元数据多维度评价相关文章导出EndNote|Ris|Bibtex收藏本文
本文引用格式
靳义荣, 刘金栋, 刘彩云, 贾德新, 刘鹏, 王雅美. 普通小麦氮素利用效率相关性状全基因组关联分析[J]. 作物学报, 2021, 47(3): 394-404. doi:10.3724/SP.J.1006.2021.01024
JIN Yi-Rong, LIU Jin-Dong, LIU Cai-Yun, JIA De-Xin, LIU Peng, WANG Ya-Mei.
氮元素在植物正常生长发育过程中发挥着重要作用。但是, 长期以来, 小麦生产过程中氮肥施用量严重超出实际需求量, 氮肥利用率只有21.2%~ 35.9%。大量损失的氮素进入大气和地下水中, 严重污染水环境。另一方面, 贫困地区田间氮肥施用水平较低, 小麦产量长期处于较低水平。开展小麦氮素利用效率, 选育氮高效的新品种是提高产量和品质, 降低环境危害的有效途径。
根系作为植物最为重要的地下器官, 在植株生长发育过程中发挥着重要作用[1,2,3]。根系构型(root system architecture, RSA)主要指根系的结构及空间造型, 包括多个相关性状, 例如总根长、总根表面积、总根体积、根尖数和平均根直径等[3,4], 是影响作物产量、品质和抗性最为重要的因素之一, 与氮素吸收和转运等生理特性密切相关[5,6,7]。植株根系长度, 表面积和体积决定着植株氮素的吸收利用效率[3]。拥有大直径木质部导管的粗根系更利于穿透深层次土壤, 提高养分吸收效率[3]。另外, 根尖数增加可有效提升根表面积和体积, 影响养分利用效率[6,8]。根系的根长、直径和吸收面积等性状与千粒重、粒长、粒宽等产量性状呈显著正相关[3]。因此, 根系构型是植物氮素利用能力的体现[6,8]。
氮素利用效率是典型的复杂数量性状, 由多基因共同控制。QTL定位(quantitative trait locus)又称连锁分析, 是研究数量性状遗传功能的常用方法。在大田条件下定位氮素利用效率相关性状的QTL位点, 具有试验周期长, 且易受环境条件影响的缺点。相较于传统的连锁分析, 全基因组关联分析(genome-wide association study, GWAS)以自然群体为材料, 来源广泛 (野生种、地方品种、现代品种和高代品系), 基因多态性较高, 无需构建双亲群体, 具有发掘效率高、分辨率高且成本较低的优点。近年来, 小麦SNP技术快速发展, 国内外已开发出多款小麦SNP芯片, 如9K、90K、660K和820K芯片, 为GWAS分析提供了极为丰富且覆盖度较高的基因型数据。迄今为止, 基于SNP标记的GWAS分析在小麦加工品质[9,10]、生理[11,12]和抗病性[9,13-14]等相关性状基因的发掘研究中已广泛使用。
植物中拥有复杂的氮响应机制, 在不同的氮素水平条件下会引起植物形成一系列的生理和生化变化。NH4+可通过IAA、GA或乙烯等方式生成信号作用于下游调控蛋白以调节植物根系生长[1,2]。苗期根部性状作为表型进行氮素利用效率位点挖掘已在相关研究中广泛应用。Lian等[15]在差异氮素含量水平下对水稻苗期根系组成性状开展QTL定位, 发现仅个别QTL在多个环境下共同存在, 认为不同氮素环境下根系相关性状的定位可用于解析植物氮素利用效率遗传机制。An等[16]以小麦为研究材料, 在大田试验条件下分别对氮素吸收效率和苗期根部性状进行遗传定位, 发现多个苗期根系发育相关性状的QTL与田间氮吸收的QTL位点一致。以上研究表明, 对植株根系生长发育相关性状进行探究, 可有效反映植株氮素利用效率的遗传特征, 解析氮素利用效率遗传机制。通过大田或苗期水培实验, 在不同的氮素水平下已发掘一批影响小麦植株根系、植株生长以及产量相关性状的QTL位点, 主要集中于小麦2A、2B、4A、5A、7A和7B染色体上[16,17,18,19]。
我国黄淮冬麦区和北部冬麦区是小麦最为重要的产区, 是保障我国粮食安全的重要基础。本研究以160份来自于黄淮和北部冬麦区的育成品种、高代品系和地方品种为材料, 在正常供氮和缺氮两种氮素水培环境下研究不同基因型苗期根系构型相关性状, 并结合小麦660K芯片进行GWAS分析, 以发掘氮元素利用效率相关基因, 为培育高氮素利用效率小麦品种提供参考。
1 材料与方法
1.1 试验材料
采用160份主要来自于黄淮和北部冬麦区的小麦地方品种(20份)、育成品种(76份)和高代育种品系(64份)在不同氮素水平水培条件下进行氮素利用效率相关性状的GWAS分析(附表1)。Table s1
附表1
附表1160份小麦材料及其根系构型相关表型数据
Table s1
| 品种(系) 名称 | 类别 | 来源 | 氮+磷+钾 (N+P+K) | 磷+钾 (P+K) | ||||||||
|---|---|---|---|---|---|---|---|---|---|---|---|---|
| 总根长 | 总根表面积 | 平均根直径 | 总根体积 | 根尖数 | 总根长 | 总根表面积 | 平均根直径 | 总根体积 | 根尖数 | |||
| TRL (cm) | TRS (cm2) | ARD (mm) | TRV (cm3) | NRT | TRL (cm) | TRS (cm2) | ARD (mm) | TRV (cm3) | NRT | |||
| 石特14 | 育成种 | 196.3 | 20.2 | 0.691 | 0.429 | 58.0 | 461.3 | 25.9 | 0.387 | 0.800 | 590.0 | |
| 复壮30 | 育成种 | 274.2 | 19.1 | 0.533 | 0.424 | 141.0 | 252.4 | 21.7 | 0.441 | 0.512 | 411.5 | |
| 平阳27 | 育成种 | 102.5 | 11.4 | 0.923 | 0.397 | 38.0 | 282.9 | 20.7 | 0.483 | 0.618 | 320.0 | |
| 蚰包 | 地方品种 | 104.1 | 13.7 | 0.656 | 0.273 | 48.5 | 439.6 | 26.0 | 0.386 | 0.513 | 226.5 | |
| 郑州6号 | 育成种 | 河南 | 208.0 | 19.8 | 0.578 | 0.432 | 152.5 | 406.8 | 25.5 | 0.395 | 0.773 | 702.0 |
| 豫麦49 | 育成种 | 河南 | 233.0 | 19.8 | 0.666 | 0.484 | 68.5 | 350.8 | 22.6 | 0.385 | 0.436 | 565.5 |
| 白芒麦1 | 地方品种 | 246.3 | 22.0 | 0.652 | 0.473 | 112.5 | 396.1 | 25.3 | 0.398 | 0.633 | 514.5 | |
| 半截芒 | 地方品种 | 158.5 | 17.6 | 0.744 | 0.344 | 86.0 | 263.9 | 21.8 | 0.403 | 0.376 | 278.0 | |
| 老来瞎 | 地方品种 | 110.5 | 13.6 | 0.981 | 0.380 | 26.5 | 265.4 | 22.4 | 0.390 | 0.429 | 272.0 | |
| 西山扁穗 | 地方品种 | 141.4 | 15.3 | 0.581 | 0.293 | 72.5 | 473.3 | 23.7 | 0.420 | 0.528 | 316.5 | |
| 红狗豆 | 地方品种 | 128.4 | 15.2 | 0.729 | 0.277 | 40.0 | 255.6 | 18.8 | 0.478 | 0.497 | 254.5 | |
| 蚰子麦 | 育成种 | 271.6 | 21.5 | 0.739 | 0.593 | 121.5 | 433.8 | 25.0 | 0.428 | 0.534 | 375.0 | |
| 白扁穗 | 地方品种 | 127.5 | 14.7 | 0.880 | 0.458 | 47.0 | 367.3 | 26.3 | 0.420 | 0.705 | 428.5 | |
| 白齐麦 | 地方品种 | 150.4 | 14.2 | 0.732 | 0.310 | 82.5 | 285.5 | 20.7 | 0.396 | 0.395 | 315.0 | |
| 白秃子头 | 地方品种 | 168.1 | 17.2 | 0.585 | 0.328 | 81.5 | 363.8 | 23.4 | 0.407 | 0.531 | 539.0 | |
| 有芒扫谷旦 | 地方品种 | 254.6 | 19.5 | 0.671 | 0.538 | 142.5 | 401.0 | 23.7 | 0.427 | 0.493 | 364.5 | |
| 阜阳红 | 地方品种 | 安徽 | 276.2 | 24.2 | 0.743 | 0.727 | 116.0 | 347.3 | 24.5 | 0.398 | 0.566 | 487.0 |
| 蚂蚱麦 | 地方品种 | 219.3 | 22.3 | 0.540 | 0.345 | 133.0 | 283.2 | 23.8 | 0.421 | 0.366 | 270.0 | |
| 抢场麦 | 地方品种 | 101.5 | 12.9 | 0.769 | 0.250 | 24.5 | 306.2 | 19.3 | 0.402 | 0.390 | 357.5 | |
| 火麦 | 地方品种 | 179.7 | 16.6 | 0.498 | 0.358 | 112.5 | 442.8 | 23.0 | 0.434 | 0.519 | 338.0 | |
| 碱麦 | 地方品种 | 190.3 | 19.2 | 0.642 | 0.321 | 75.5 | 404.0 | 25.7 | 0.380 | 0.539 | 375.0 | |
| 大口麦 | 地方品种 | 138.0 | 19.6 | 0.781 | 0.294 | 39.0 | 189.5 | 14.6 | 0.506 | 0.486 | 208.0 | |
| 白条鱼 | 地方品种 | 155.5 | 18.0 | 0.655 | 0.383 | 75.0 | 436.2 | 19.6 | 0.419 | 0.475 | 450.0 | |
| 老齐麦 | 地方品种 | 228.8 | 20.4 | 0.418 | 0.574 | 276.5 | 360.5 | 19.8 | 0.390 | 0.464 | 514.0 | |
| 出山豹 | 地方品种 | 191.8 | 20.0 | 0.560 | 0.572 | 105.5 | 409.2 | 23.3 | 0.462 | 0.652 | 253.0 | |
| 大粒半芒 | 地方品种 | 231.6 | 23.7 | 0.494 | 0.434 | 260.0 | 342.4 | 20.0 | 0.392 | 0.527 | 285.0 | |
| 扁穗麦 | 育成种 | 214.1 | 19.0 | 0.678 | 0.506 | 92.5 | 353.2 | 24.5 | 0.416 | 0.643 | 375.0 | |
| 齐大195 | 育成种 | 159.4 | 17.9 | 0.886 | 0.724 | 117.5 | 587.5 | 25.5 | 0.403 | 0.543 | 376.0 | |
| 黄县大粒半芒 | 育成种 | 156.5 | 18.0 | 0.517 | 0.289 | 95.0 | 490.1 | 22.7 | 0.426 | 0.601 | 357.0 | |
| 泗水三八麦 | 育成种 | 山东 | 350.5 | 25.7 | 0.475 | 0.548 | 177.0 | 631.3 | 25.8 | 0.392 | 0.965 | 593.5 |
| 蚰包麦 | 育成种 | 197.9 | 16.4 | 0.802 | 0.564 | 116.0 | 292.8 | 20.8 | 0.436 | 0.403 | 220.0 | |
| 碧蚂1号 | 育成种 | 209.8 | 22.1 | 0.481 | 0.363 | 124.0 | 426.5 | 22.8 | 0.390 | 0.624 | 488.0 | |
| 烟农78 | 育成种 | 山东 | 182.1 | 17.3 | 0.498 | 0.357 | 174.0 | 522.4 | 25.7 | 0.434 | 0.878 | 475.5 |
| 济宁3号 | 育成种 | 山东 | 192.2 | 19.8 | 0.816 | 0.624 | 92.5 | 358.7 | 22.9 | 0.432 | 0.504 | 483.0 |
| 鲁麦8号 | 育成种 | 山东 | 121.8 | 16.4 | 0.951 | 0.478 | 30.0 | 244.3 | 20.2 | 0.510 | 0.678 | 362.0 |
| 鲁麦12号 | 育成种 | 山东 | 231.3 | 21.6 | 0.710 | 0.523 | 102.5 | 529.9 | 25.9 | 0.404 | 0.570 | 390.5 |
| 山农辐63 | 育成种 | 山东 | 271.2 | 22.8 | 0.609 | 0.645 | 142.0 | 358.7 | 24.7 | 0.414 | 0.665 | 431.0 |
| 山农587 | 育成种 | 山东 | 194.1 | 18.4 | 0.570 | 0.440 | 83.5 | 518.8 | 25.7 | 0.387 | 0.398 | 551.0 |
| 刑麦9号 | 高代品系 | 268.8 | 21.9 | 0.604 | 0.566 | 214.5 | 353.8 | 25.1 | 0.440 | 0.538 | 616.0 | |
| 鲁麦1号 | 育成种 | 山东 | 406.2 | 18.8 | 0.404 | 0.716 | 299.0 | 406.2 | 18.8 | 0.404 | 0.716 | 299.0 |
| 鲁麦22 | 育成种 | 山东 | 222.8 | 19.4 | 0.719 | 0.653 | 97.0 | 427.4 | 26.9 | 0.397 | 0.663 | 521.0 |
| 鲁麦23 | 育成种 | 山东 | 116.2 | 12.6 | 0.771 | 0.371 | 42.0 | 215.0 | 18.9 | 0.370 | 0.615 | 543.0 |
| 鲁麦16 | 育成种 | 山东 | 259.3 | 20.3 | 0.710 | 0.706 | 128.5 | 558.4 | 25.8 | 0.398 | 0.666 | 349.5 |
| 鲁麦19 | 育成种 | 山东 | 203.6 | 20.1 | 0.611 | 0.375 | 97.0 | 330.1 | 21.1 | 0.374 | 0.608 | 627.0 |
| 鲁麦20 | 育成种 | 山东 | 86.3 | 11.8 | 0.971 | 0.424 | 28.0 | 347.8 | 24.5 | 0.420 | 0.651 | 422.5 |
| 淄麦12 | 育成种 | 河南 | 307.5 | 23.7 | 0.595 | 0.746 | 171.0 | 288.2 | 22.8 | 0.412 | 0.392 | 393.0 |
| 烟辐188 | 育成种 | 山东 | 264.3 | 23.3 | 0.561 | 0.507 | 171.5 | 525.4 | 24.3 | 0.421 | 0.785 | 483.5 |
| 山农664 | 育成种 | 山东 | 223.5 | 19.7 | 0.608 | 0.429 | 71.0 | 373.1 | 22.1 | 0.432 | 0.560 | 375.0 |
| 汶农5号 | 育成种 | 山东 | 179.7 | 16.1 | 0.763 | 0.428 | 98.5 | 368.4 | 24.5 | 0.431 | 0.867 | 551.0 |
| 莱州137 | 育成种 | 山东 | 267.7 | 19.4 | 0.714 | 0.602 | 141.0 | 459.2 | 24.0 | 0.387 | 0.615 | 569.5 |
| 烟2415 | 育成种 | 山东 | 238.0 | 21.0 | 0.573 | 0.734 | 153.5 | 443.0 | 24.7 | 0.435 | 0.434 | 323.5 |
| 山农11 | 育成种 | 山东 | 161.8 | 16.1 | 0.607 | 0.352 | 103.0 | 276.9 | 21.8 | 0.408 | 0.534 | 682.5 |
| 淄麦7号 | 育成种 | 河南 | 223.8 | 20.1 | 0.579 | 0.531 | 171.5 | 392.9 | 22.6 | 0.418 | 0.650 | 578.0 |
| 金铎1号 | 育成种 | 237.5 | 17.9 | 0.646 | 0.322 | 87.5 | 304.5 | 20.4 | 0.482 | 0.787 | 284.5 | |
| 济南18 | 育成种 | 山东 | 135.8 | 13.5 | 0.785 | 0.336 | 40.0 | 269.5 | 21.6 | 0.396 | 0.523 | 380.0 |
| 山融3号 | 育成种 | 山东 | 179.5 | 18.5 | 0.688 | 0.391 | 118.0 | 388.6 | 23.4 | 0.406 | 0.644 | 490.5 |
| 偃麦4110 | 育成种 | 河南 | 347.0 | 23.9 | 0.495 | 0.570 | 377.0 | 532.3 | 23.8 | 0.364 | 0.652 | 678.5 |
| 良星99 | 育成种 | 山东 | 282.3 | 25.1 | 0.485 | 0.645 | 248.5 | 300.6 | 21.2 | 0.405 | 0.575 | 528.5 |
| 济麦33 | 高代品系 | 山东 | 270.2 | 22.9 | 0.499 | 0.587 | 268.0 | 421.8 | 24.4 | 0.407 | 0.639 | 442.5 |
| 济麦37 | 高代品系 | 山东 | 177.3 | 18.0 | 0.741 | 0.573 | 133.0 | 515.3 | 24.9 | 0.435 | 0.554 | 430.0 |
| 济麦0419 | 高代品系 | 山东 | 172.4 | 16.7 | 0.711 | 0.498 | 47.5 | 266.1 | 19.9 | 0.471 | 0.428 | 367.5 |
| 济麦0536 | 高代品系 | 山东 | 204.7 | 20.1 | 0.770 | 0.528 | 396.5 | 420.6 | 26.0 | 0.459 | 0.688 | 232.0 |
| 济麦08101 | 高代品系 | 山东 | 368.9 | 17.4 | 0.627 | 0.463 | 123.0 | 416.3 | 24.0 | 0.375 | 0.516 | 673.5 |
| 济麦36 | 高代品系 | 山东 | 286.4 | 21.3 | 0.579 | 0.569 | 76.0 | 541.9 | 25.6 | 0.407 | 0.796 | 441.0 |
| 济麦47 | 高代品系 | 山东 | 296.7 | 24.6 | 0.482 | 0.612 | 153.0 | 412.2 | 25.7 | 0.391 | 0.372 | 344.0 |
| 济麦49 | 高代品系 | 山东 | 222.8 | 20.7 | 0.560 | 0.488 | 123.0 | 411.5 | 19.5 | 0.378 | 0.613 | 593.0 |
| 济麦23 | 育成种 | 山东 | 213.6 | 20.1 | 0.598 | 0.521 | 127.0 | 286.1 | 23.7 | 0.433 | 0.483 | 326.5 |
| 山农15(B245) | 育成种 | 山东 | 205.5 | 21.4 | 0.715 | 0.591 | 95.5 | 336.9 | 22.0 | 0.372 | 0.592 | 749.0 |
| 良星77 | 育成种 | 山东 | 239.8 | 21.4 | 0.698 | 0.493 | 80.0 | 472.1 | 24.9 | 0.459 | 0.747 | 789.5 |
| 鑫麦296 | 育成种 | 95.6 | 11.6 | 0.835 | 0.359 | 26.5 | 557.1 | 25.1 | 0.401 | 0.758 | 650.5 | |
| 郯麦98 | 育成种 | 山东 | 240.7 | 23.0 | 0.508 | 0.431 | 138.0 | 433.3 | 19.0 | 0.397 | 0.536 | 736.5 |
| 泰农19 | 育成种 | 山东 | 163.4 | 14.5 | 0.644 | 0.394 | 71.0 | 345.4 | 20.1 | 0.485 | 0.684 | 263.5 |
| 汶农14 | 育成种 | 山东 | 123.1 | 17.5 | 0.856 | 0.556 | 52.0 | 448.8 | 22.0 | 0.434 | 0.511 | 358.5 |
| 山农0431 | 高代品系 | 山东 | 157.7 | 14.8 | 0.787 | 0.479 | 54.5 | 450.3 | 23.7 | 0.414 | 0.613 | 381.0 |
| 山农11J1565 | 高代品系 | 山东 | 190.0 | 20.0 | 0.505 | 0.250 | 74.0 | 334.5 | 22.8 | 0.393 | 0.738 | 594.5 |
| 山农21 | 育成种 | 山东 | 249.1 | 22.5 | 0.596 | 0.599 | 87.5 | 471.0 | 24.5 | 0.393 | 0.630 | 427.5 |
| 山农22 | 育成种 | 山东 | 171.0 | 18.9 | 0.578 | 0.406 | 118.0 | 493.1 | 22.8 | 0.399 | 0.630 | 672.0 |
| 山农670 | 高代品系 | 山东 | 196.9 | 21.1 | 0.584 | 0.592 | 142.5 | 429.9 | 22.1 | 0.424 | 0.521 | 288.0 |
| 山农711 | 高代品系 | 山东 | 324.1 | 26.0 | 0.497 | 0.554 | 200.5 | 518.1 | 24.4 | 0.429 | 0.757 | 450.5 |
| 山农737 | 高代品系 | 山东 | 277.9 | 26.3 | 0.464 | 0.573 | 252.5 | 391.1 | 21.7 | 0.466 | 0.516 | 290.0 |
| 山农0713-2 | 高代品系 | 山东 | 277.4 | 26.3 | 0.499 | 0.548 | 247.5 | 568.8 | 25.4 | 0.408 | 1.043 | 709.5 |
| 山农11J0635 | 高代品系 | 山东 | 191.6 | 17.0 | 0.623 | 0.435 | 204.5 | 464.1 | 23.0 | 0.413 | 0.757 | 621.5 |
| 山农12J1740 | 高代品系 | 山东 | 171.2 | 15.8 | 0.563 | 0.529 | 129.0 | 360.4 | 20.3 | 0.414 | 0.668 | 299.0 |
| 烟农173 | 育成种 | 山东 | 314.3 | 26.2 | 0.498 | 0.459 | 149.0 | 384.8 | 23.2 | 0.418 | 0.560 | 463.5 |
| 存麦1号 | 育成种 | 287.6 | 23.4 | 0.441 | 0.562 | 222.0 | 457.2 | 23.5 | 0.397 | 0.956 | 555.0 | |
| 花5 | 高代品系 | 235.2 | 23.8 | 0.512 | 0.461 | 146.0 | 457.5 | 23.5 | 0.379 | 0.749 | 730.0 | |
| 花8 | 高代品系 | 194.3 | 23.4 | 0.662 | 0.443 | 76.0 | 479.4 | 25.1 | 0.415 | 0.679 | 505.0 | |
| 济创15 | 高代品系 | 山东 | 163.6 | 17.7 | 0.816 | 0.414 | 56.5 | 330.4 | 19.4 | 0.411 | 0.494 | 340.5 |
| 济创23 | 高代品系 | 山东 | 218.7 | 23.2 | 0.452 | 0.367 | 151.0 | 523.3 | 24.7 | 0.386 | 0.610 | 564.0 |
| 济创28 | 高代品系 | 山东 | 186.4 | 20.0 | 0.692 | 0.494 | 104.5 | 432.2 | 24.0 | 0.407 | 0.529 | 363.0 |
| 龙麦1号 | 高代品系 | 山东 | 175.4 | 18.9 | 0.633 | 0.333 | 97.0 | 413.4 | 22.0 | 0.376 | 0.306 | 401.5 |
| 洛麦21 | 育成种 | 河南 | 192.9 | 19.7 | 0.677 | 0.456 | 83.5 | 416.4 | 22.4 | 0.441 | 0.825 | 535.0 |
| 神麦1号 | 育成种 | 160.3 | 15.2 | 0.522 | 0.332 | 93.0 | 415.9 | 21.0 | 0.392 | 0.565 | 349.0 | |
| 郑麦366 | 育成种 | 河南 | 224.1 | 17.2 | 0.556 | 0.390 | 93.0 | 554.4 | 25.7 | 0.412 | 0.812 | 534.5 |
| 周黑麦1号 | 育成种 | 河南 | 191.8 | 22.6 | 0.631 | 0.391 | 94.0 | 488.6 | 23.6 | 0.437 | 0.645 | 315.0 |
| 周麦30 | 育成种 | 河南 | 270.5 | 21.6 | 0.598 | 0.663 | 131.5 | 449.9 | 24.3 | 0.421 | 0.816 | 441.0 |
| 周麦31 | 高代品系 | 河南 | 210.0 | 20.6 | 0.616 | 0.430 | 80.0 | 371.7 | 23.5 | 0.455 | 0.583 | 418.0 |
| BN10F(002)加1-特1 | 高代品系 | 101.1 | 11.2 | 0.595 | 0.231 | 48.0 | 388.4 | 25.6 | 0.412 | 0.880 | 403.5 | |
| 兰材282 | 高代品系 | 河南 | 495.7 | 25.9 | 0.419 | 0.532 | 290.0 | 547.8 | 22.5 | 0.408 | 0.702 | 465.0 |
| 兰材633 | 高代品系 | 河南 | 259.3 | 25.0 | 0.503 | 0.395 | 126.0 | 527.5 | 24.1 | 0.378 | 0.732 | 562.0 |
| 兰材693 | 高代品系 | 河南 | 318.7 | 23.9 | 0.457 | 0.475 | 227.0 | 474.3 | 23.2 | 0.408 | 0.657 | 574.5 |
| 兰考198 | 高代品系 | 河南 | 188.8 | 17.3 | 0.667 | 0.368 | 108.0 | 432.1 | 22.0 | 0.439 | 0.598 | 563.0 |
| 兰考298 | 高代品系 | 河南 | 183.9 | 19.8 | 0.642 | 0.401 | 84.0 | 264.5 | 18.4 | 0.423 | 0.536 | 486.5 |
| 山农1565 | 高代品系 | 山东 | 150.2 | 18.5 | 0.810 | 0.461 | 51.0 | 485.1 | 23.8 | 0.377 | 0.737 | 444.0 |
| 兰考323 | 高代品系 | 河南 | 180.8 | 16.5 | 0.554 | 0.355 | 108.0 | 324.5 | 25.6 | 0.397 | 0.702 | 471.0 |
| 兰考358 | 高代品系 | 河南 | 140.7 | 17.3 | 0.660 | 0.391 | 73.0 | 370.1 | 23.1 | 0.430 | 0.667 | 359.0 |
| 兰考380 | 高代品系 | 河南 | 196.0 | 20.0 | 0.462 | 0.506 | 192.5 | 501.6 | 24.7 | 0.401 | 0.644 | 524.5 |
| 兰考381 | 高代品系 | 河南 | 179.1 | 24.0 | 0.504 | 0.455 | 165.0 | 512.4 | 23.7 | 0.416 | 0.682 | 640.5 |
| 兰考396 | 高代品系 | 河南 | 162.2 | 17.3 | 0.596 | 0.325 | 140.5 | 340.8 | 22.6 | 0.446 | 0.541 | 480.5 |
| 百农160 | 育成种 | 208.5 | 19.7 | 0.673 | 0.286 | 136.5 | 399.8 | 26.2 | 0.430 | 0.562 | 365.5 | |
| 河农7069 | 育成种 | 河南 | 156.9 | 18.1 | 0.671 | 0.317 | 54.5 | 460.2 | 22.3 | 0.407 | 0.672 | 518.5 |
| 河农9206 | 育成种 | 河南 | 274.3 | 22.2 | 0.556 | 0.575 | 91.5 | 606.2 | 25.6 | 0.388 | 1.073 | 532.0 |
| 冀矮1号 | 高代品系 | 90.0 | 13.9 | 0.656 | 0.229 | 32.0 | 382.3 | 22.7 | 0.436 | 0.655 | 506.0 | |
| 冀麦325 | 育成种 | 214.1 | 21.3 | 0.551 | 0.491 | 117.5 | 397.3 | 20.6 | 0.432 | 0.437 | 334.0 | |
| 金博士731 | 高代品系 | 140.3 | 18.4 | 0.523 | 0.302 | 126.0 | 547.2 | 24.0 | 0.438 | 0.766 | 720.5 | |
| 石矮1号 | 高代品系 | 220.7 | 18.6 | 0.659 | 0.424 | 105.5 | 527.5 | 24.6 | 0.383 | 0.583 | 881.0 | |
| 石新733 | 育成种 | 224.9 | 23.4 | 0.473 | 0.485 | 177.5 | 499.0 | 24.8 | 0.433 | 0.677 | 543.0 | |
| 刑麦13号 | 育成种 | 237.5 | 21.8 | 0.512 | 0.428 | 128.5 | 299.0 | 21.9 | 0.542 | 0.534 | 256.0 | |
| 舜麦1718 | 育成种 | 262.1 | 23.0 | 0.640 | 0.470 | 116.5 | 617.6 | 26.2 | 0.398 | 0.767 | 576.0 | |
| 徐麦31 | 育成种 | 江苏 | 206.8 | 22.0 | 0.608 | 0.627 | 118.5 | 539.2 | 26.1 | 0.427 | 0.767 | 720.0 |
| 徐麦27 | 育成种 | 江苏 | 353.7 | 26.8 | 0.426 | 0.702 | 234.0 | 483.2 | 23.8 | 0.447 | 0.728 | 519.5 |
| 徐麦856 | 育成种 | 江苏 | 237.0 | 21.6 | 0.557 | 0.644 | 163.5 | 558.5 | 24.9 | 0.417 | 0.911 | 793.0 |
| 西农979 | 育成种 | 346.1 | 25.0 | 0.491 | 0.743 | 189.5 | 463.8 | 21.8 | 0.406 | 0.683 | 549.5 | |
| 普冰2011 | 高代品系 | 226.6 | 18.3 | 0.484 | 0.420 | 115.0 | 361.8 | 16.0 | 0.454 | 0.445 | 285.5 | |
| 中植9号 | 高代品系 | 河南 | 190.5 | 21.1 | 0.578 | 0.339 | 71.5 | 508.5 | 23.0 | 0.466 | 0.599 | 629.0 |
| 宿2013 | 高代品系 | 195.9 | 17.3 | 0.813 | 0.389 | 49.5 | 425.3 | 21.8 | 0.449 | 0.532 | 352.0 | |
| 安农1206 | 高代品系 | 261.5 | 21.8 | 0.470 | 0.538 | 194.5 | 459.8 | 24.6 | 0.385 | 0.702 | 546.0 | |
| PI27012 | 高代品系 | 191.3 | 20.4 | 0.562 | 0.383 | 89.0 | 365.8 | 20.7 | 0.414 | 0.584 | 528.0 | |
| 宿8802(皖麦19) | 育成种 | 188.7 | 17.6 | 0.577 | 0.469 | 52.5 | 564.4 | 23.7 | 0.437 | 0.521 | 456.0 | |
| 济宁114076 | 高代品系 | 山东 | 173.7 | 20.5 | 0.657 | 0.438 | 118.0 | 437.7 | 25.0 | 0.418 | 0.563 | 474.5 |
| 泰科麦6338(1) | 高代品系 | 山东 | 251.3 | 22.3 | 0.639 | 0.477 | 170.5 | 524.6 | 24.8 | 0.404 | 0.450 | 495.0 |
| 泰科麦50206(3) | 高代品系 | 山东 | 219.7 | 18.9 | 0.722 | 0.367 | 92.5 | 429.5 | 23.5 | 0.421 | 0.574 | 315.5 |
| 济南4号 | 育成种 | 山东 | 120.8 | 17.0 | 0.569 | 0.448 | 111.5 | 301.3 | 21.0 | 0.411 | 0.442 | 440.5 |
| 济麦25 | 高代品系 | 山东 | 249.7 | 24.0 | 0.492 | 0.505 | 106.5 | 286.2 | 24.4 | 0.426 | 0.770 | 623.5 |
| 济麦31 | 高代品系 | 山东 | 248.8 | 25.1 | 0.522 | 0.692 | 263.0 | 419.3 | 26.2 | 0.400 | 0.638 | 655.0 |
| 鲁原502 | 育成种 | 山东 | 170.0 | 17.0 | 0.533 | 0.259 | 45.0 | 529.5 | 25.8 | 0.388 | 0.745 | 697.5 |
| 临麦6号 | 高代品系 | 山东 | 114.9 | 15.2 | 0.645 | 0.303 | 72.5 | 292.9 | 17.9 | 0.377 | 0.567 | 614.5 |
| 烟农999 | 育成种 | 山东 | 181.4 | 18.6 | 0.670 | 0.399 | 73.5 | 325.6 | 20.6 | 0.412 | 0.471 | 355.0 |
| 周麦16 | 育成种 | 河南 | 181.5 | 18.3 | 0.608 | 0.364 | 91.0 | 400.1 | 22.9 | 0.459 | 0.547 | 391.0 |
| 周麦22 | 育成种 | 河南 | 146.6 | 14.4 | 0.576 | 0.300 | 99.5 | 282.5 | 24.2 | 0.408 | 0.726 | 493.0 |
| 石H83-366 | 高代品系 | 166.6 | 19.5 | 0.680 | 0.358 | 75.5 | 199.0 | 17.0 | 0.439 | 0.338 | 269.5 | |
| 淮麦05155 | 高代品系 | 245.6 | 21.8 | 0.656 | 0.427 | 80.0 | 479.5 | 24.4 | 0.424 | 0.698 | 870.0 | |
| 峰川9号 | 育成种 | 239.1 | 23.4 | 0.571 | 0.432 | 118.0 | 258.1 | 18.2 | 0.425 | 0.309 | 273.0 | |
| 烟农187 | 高代品系 | 山东 | 226.7 | 21.4 | 0.479 | 0.488 | 204.5 | 353.0 | 22.2 | 0.377 | 0.562 | 490.0 |
| LA15P315 | 高代品系 | 185.8 | 18.9 | 0.666 | 0.471 | 88.5 | 330.9 | 24.2 | 0.443 | 0.752 | 571.0 | |
| LA15P330 | 高代品系 | 141.8 | 15.6 | 0.598 | 0.310 | 72.5 | 349.0 | 22.0 | 0.478 | 0.613 | 345.5 | |
| 济麦51 | 高代品系 | 山东 | 197.9 | 16.7 | 0.595 | 0.458 | 93.0 | 363.5 | 22.7 | 0.421 | 0.486 | 466.5 |
| 济麦52 | 高代品系 | 山东 | 120.0 | 16.2 | 0.779 | 0.325 | 53.5 | 322.5 | 23.2 | 0.414 | 0.646 | 638.0 |
| 济麦229 | 育成种 | 山东 | 254.2 | 24.1 | 0.476 | 0.420 | 221.5 | 375.6 | 22.2 | 0.386 | 0.646 | 524.5 |
| 济麦262 | 育成种 | 山东 | 196.5 | 21.7 | 0.545 | 0.500 | 101.5 | 326.2 | 20.8 | 0.429 | 0.622 | 468.0 |
| 济麦66 | 高代品系 | 山东 | 198.5 | 20.3 | 0.569 | 0.537 | 137.5 | 312.6 | 21.8 | 0.412 | 0.760 | 402.5 |
| LJ154052 | 高代品系 | 168.9 | 18.3 | 0.562 | 0.268 | 104.5 | 406.7 | 24.8 | 0.363 | 0.500 | 510.5 | |
| LJ15鉴010 | 高代品系 | 322.7 | 24.9 | 0.519 | 0.584 | 209.5 | 481.4 | 24.0 | 0.388 | 0.703 | 604.0 | |
| LJ15鉴16 | 高代品系 | 104.6 | 12.2 | 0.682 | 0.342 | 91.5 | 463.1 | 23.8 | 0.382 | 0.917 | 801.5 | |
| LJ15鉴71 | 高代品系 | 203.5 | 19.0 | 0.607 | 0.526 | 111.5 | 284.3 | 21.4 | 0.433 | 0.531 | 248.5 | |
| 济麦21 | 育成种 | 山东 | 161.3 | 15.4 | 0.615 | 0.408 | 105.5 | 271.3 | 18.8 | 0.379 | 0.523 | 490.0 |
| 济麦22 | 育成种 | 山东 | 233.1 | 18.6 | 0.524 | 0.457 | 118.5 | 488.8 | 26.1 | 0.372 | 0.637 | 490.0 |
| 济麦44 | 高代品系 | 山东 | 256.2 | 25.0 | 0.565 | 0.364 | 36.0 | 325.3 | 19.6 | 0.426 | 0.679 | 597.5 |
| 德抗961 | 育成种 | 133.4 | 16.2 | 0.570 | 0.322 | 96.5 | 248.6 | 20.0 | 0.482 | 0.723 | 315.0 | |
| LJ15210 | 高代品系 | 237.6 | 20.3 | 0.452 | 0.421 | 119.5 | 322.9 | 22.2 | 0.412 | 0.596 | 501.0 | |
新窗口打开|下载CSV
1.2 水培试验
试验在室内水培条件下进行。采用两种营养液: 完全营养液和缺氮营养液。营养液配制参考Hoagland营养液[20], 根据小麦苗期生长需求略有改动。完全营养液组分如下: 1.8 mmol L-1 KCl、1.5 mmol L-1 CaCl2、1.0 mmol L-1 Ca(NO3)2、1.0 mmol L-1 (NH4)2SO4、0.5 mmol L-1 MgSO4、0.2 mmol L-1 KH2PO4、1.0×10⁻³ mmol L-1 H3BO3、1.0×10⁻³ mmol L-1 ZnSO4、1.0×10⁻³ mmol L-1 MnSO4、0.5×10⁻³ mmol L-1 CuSO4、0.1 mmol L-1 Fe-EDTA、1.0×10⁻⁴ mmol L-1 (NH4)6Mo7O24。缺氮营养液的组分如下: 1.8 mmol L-1 KCl、1.5 mmol L-1 CaCl2、1.0 mmol L-1 Ca(NO3)2、0.5 mmol L-1 MgSO4、0.2 mmol L-1 KH2PO4、1.0×10⁻³ mmol L-1 H3BO3、1.0×10⁻³ mmol L-1 ZnSO4、1.0×10⁻³ mmol L-1 MnSO4、0.5×10⁻³ mmol L-1 CuSO4、0.1 mmol L-1 Fe-EDTA、1.0×10⁻⁴ mmol L-1 (NH4)6Mo7O24。挑选饱满、大小一致的小麦籽粒置于10% H2O2溶液中浸泡10 min, 去离子水冲洗3次后, 置于湿润滤纸上培养。在一叶一心期, 选取长势一致的幼苗, 固定在育苗盘中, 将育苗盘分别置于完全营养液和缺氮营养液中。通过氧气泵对营养液进行持续通气, 并且每隔3 d更换一次营养液, 培养至21 d后, 用去离子水将根部冲洗干净, 用剪刀将根和茎在分节处剪断, 分别置于自封袋中备测。
1.3 根系相关表型测定
于每份样品中随机选择10个单株, 将各单株侧根逐一分开, 在不重叠的状态下置于装有去离子水的透明根盘中, 利用WinRHIZOLA6400XL透视扫描系统对根系进行扫描, 获取各单株根系图片。然后利用WinRHIZOPro软件分析各样品的根尖数(number of root tips, NRT)、根系总长度(total root length, TRL)、根系总表面积(total root surface area, TRS)、根系总体积(total root volume, TRV)和根系平均直径(average root diameter, ARD)等表型数据, 取3次重复的平均值作为材料的表型数据值。随后, 计算2种不同氮素条件下各性状的相对值, 即相对根尖数(relative number of root tips, RNRT)、相对总根长(relative total root length, RTRL)、相对总根表面积(relative total root surface area, RTRS)、相对总根体积(relative total root volume, RTRV)和相对根平均直径(relative average root diameter, RARD)。采用SAS 9.2 (www.sas.com)软件统计分析数据, 并计算相关系数。1.4 基因型检测
利用CTAB法提取小麦幼嫩叶片基因组DNA[21]。本研究基因型分析采用小麦660K SNP芯片 (包含630,517个SNP标记) (博奥晶典, http:// www.capitalbiotech.com/)在剔除缺失染色体定位信息和物理位置的标记后, 筛选最小等位基因频率(minor allele frequency, MAF) > 0.05和缺失率(missing rate) < 20% (PowerMarker v3.25)的标记用于下一步GWAS分析。利用多态性信息含量 (polymorphism information content, PIC)和基因多态性两个参数对黄淮冬麦区和北部冬麦区群体遗传多态性进行分析。PIC值基于PowerMarker v3.25按照以下公式计算: PIC = 1 - ∑ (pi)2。其中, pi为第i个等位基因在群体中出现的频率。基因多态性的计算也由PowerMarker v3.25完成。1.5 主成分分析 (principal components analysis, PCA)和LD衰减分析
PCA分析通过Tassel v5.0 (https://www.maizegenetics.net/tassel)开展。PCA可视化在R环境下通过Pot3D (http://www.harrisgeospatial.com/docs/ PLOT3D. html)和Satterplot3d (http://www.sthda.com/english/ wiki/scatterplot3d-3d-graphics-r-software-and-data- visualization)程序包完成。利用Tassel v5.0计算标记间LD。1.6 全基因组关联分析
应用Tassel v5.0软件中的MLM模型, 以主成分分析 (PCA)和亲缘关系 (Kinship)作为协变量, 结合筛选后的基因型数据, 对160份小麦品系根系构型相关性状进行关联分析。GWAS分析结果中, 当P≤0.001时, 认为该标记与性状显著关联。曼哈顿图和Q-Q图可视化在R环境中通过CMplot程序包 (https://github.com/YinLiLin/R-CMplot)完成。2 结果与分析
2.1 表型数据分析
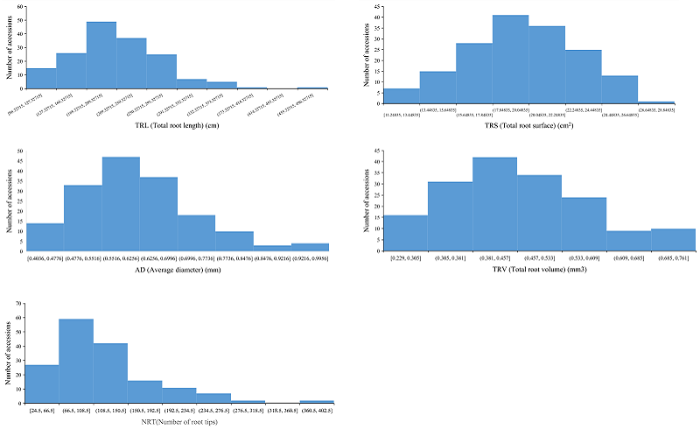
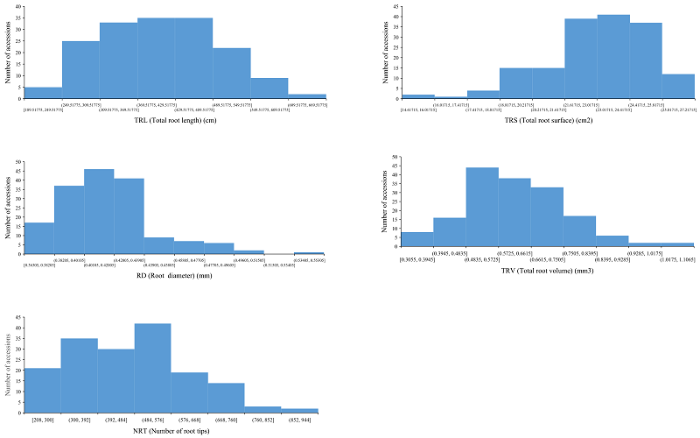
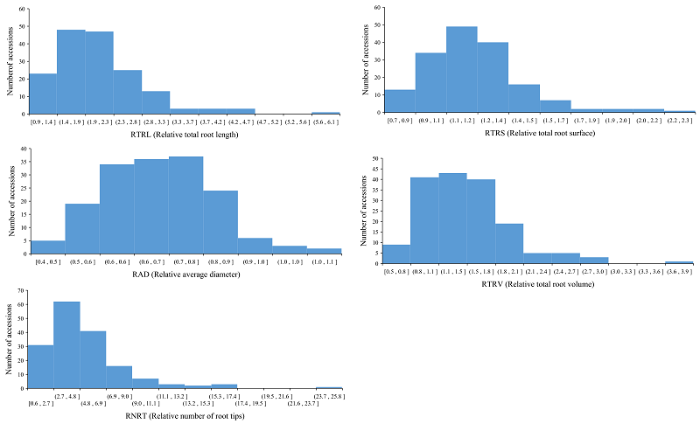
160份普通小麦材料在完全营养液中NRT、TRL、TRS、TRV和ARD的均值分别为119.97、210.23 cm、19.62 cm2、0.42 cm3和0.46 mm; 在缺氮营养液中NRT、TRL、TRS、TRV和ARD的均值分别为476.83、406.85 cm、22.97 cm2、0.62 cm3和0.62 mm (表1, 附表1, 附图1, 附图2, 附图3)。160份材料在2种营养液中RNRT、RTRL、RTRS、RTRV和RARD的均值分别为: 5.15 (0.59~16.60)、2.10 (0.92~5.83)、1.21 (0.74~2.27)、1.49 (0.95~2.52)和1.44 (0.53~3.82)。2种培养环境下根系相关性状比值均呈连续性分布, 变异范围广, 遗传基础丰富, 适于进行GWAS分析 (附图4)。对各性状开展相关性分析, 2种培养条件下根系构成相关性状比值呈显著正相关。其中, RTRL与RTRS (r = 0.718)、RARD (r = 0.383)、RTRV (r = 0.484)、RNRT (r = 0.513)呈显著正相关 (P < 0.05); RTRS与RARD (r = 0.531)、RTRV (r = 0.475)和RNRT (r = 0.492)呈显著正相关 (P < 0.05); RARD与RNRT呈显著正相关 (r = 0.514, P < 0.05); RTRV和RNRT也呈显著正相关 (r = 0.439, P < 0.05)。Table 1
表1
表1160份普通小麦品种根系构型相关性状表型统计
Table 1
| 处理 Treatment | 性状 Trait | 极小值 Min. | 极大值 Max. | 均值 Average | 标准差 Standard deviation | 变异系数 CV (%) |
|---|---|---|---|---|---|---|
| 完全营养液 Absolute nutrient solution | TRL (cm) | 86.33 | 495.67 | 210.23 | 64.44 | 30.7 |
| TRS (cm2) | 11.25 | 26.85 | 19.62 | 3.48 | 17.7 | |
| TRV (cm3) | 0.40 | 0.98 | 0.42 | 0.12 | 18.8 | |
| ARD (mm) | 0.23 | 0.75 | 0.46 | 0.12 | 26.2 | |
| NRT | 24.50 | 396.50 | 119.97 | 65.50 | 54.6 | |
| 缺氮营养液 N-deficiency nutrient solution | TRL (cm) | 189.52 | 631.29 | 406.85 | 94.21 | 23.2 |
| TRS (cm2) | 14.62 | 26.87 | 22.97 | 2.27 | 9.9 | |
| TRV (cm3) | 0.36 | 0.54 | 0.62 | 0.03 | 7.1 | |
| ARD (mm) | 0.31 | 1.07 | 0.62 | 0.14 | 22.6 | |
| NRT | 208.00 | 881.00 | 476.83 | 145.20 | 30.5 | |
| 相对比值 Relative ratio | RTRL | 0.92 | 5.83 | 2.10 | 0.75 | 35.7 |
| RTRS | 0.74 | 2.27 | 1.21 | 0.26 | 21.2 | |
| RTRV | 0.95 | 2.52 | 1.49 | 0.28 | 19.2 | |
| RARD | 0.53 | 3.82 | 1.44 | 0.50 | 34.6 | |
| RNRT | 0.59 | 16.60 | 5.15 | 3.06 | 54.7 |
新窗口打开|下载CSV
附图1
 新窗口打开|下载原图ZIP|生成PPT
附图1160份小麦品种根系构型相关性状表型分布(氮+磷+钾)
Fig. S1Distribution of root system architecture (RSA) related traits in 160 common wheat accessions (N+P+K)
附图2
 新窗口打开|下载原图ZIP|生成PPT
附图2160份小麦品种根系构型相关性状表型分布(磷+钾)
Fig. s2Distribution of root system architecture (RSA) related traits in 160 common wheat accessions (P+K)
附图3
 新窗口打开|下载原图ZIP|生成PPT
附图3160份小麦品种不同氮素条件下相对根系构型相关性状表型分布
Fig. s3Distribution of relative root system architecture (RSA) related traits under different nitrogen level in 160 common wheat accessions
2.2 基因型分析
为保证关联结果的准确性, 过滤掉物理位置缺失、MAF < 5%且缺失率 > 20%的SNP标记, 最终剩余223,168个标记用于进一步分析。标记覆盖所有染色体区段, 物理图谱总长度14,063.9 Mb, 平均密度为0.097 Mb/标记。A、B和D基因组长度分别为4934.5、5179.0和3950.4 Mb, 分别包含93,664 (41.9%)、108,936 (56.3%)和20,568 (9.2%)个标记。B基因组密度最高 (0.048 Mb/标记), 其次为A基因组(0.052 Mb/标记), D基因组标记密度最低(0.193 Mb/标记, 表2)。Table 2
表2
表2160份普通小麦品系基因型数据统计
Table 2
| 染色体 Chr. | 标记数目 Number of markers | 长度 a Length a (Mb) | 密度 Density (Mb/marker) | 最小等位基因频率 Minimum allele frequency (MAF) | 基因多态性 Genetic diversity | 多态性信息含量 Polymorphic information content (PIC) | |||
|---|---|---|---|---|---|---|---|---|---|
| 均值 Average | 范围 Range | 均值 Average | 范围 Range | 均值 Average | 范围 Range | ||||
| 1A | 18,975 | 594.00 | 0.031 | 0.26 | 0.05-0.50 | 0.37 | 0.10-0.50 | 0.28 | 0.09-0.38 |
| 1B | 13,810 | 689.40 | 0.050 | 0.31 | 0.05-0.50 | 0.39 | 0.10-0.50 | 0.29 | 0.09-0.38 |
| 1D | 4464 | 495.40 | 0.111 | 0.18 | 0.05-0.49 | 0.34 | 0.10-0.50 | 0.28 | 0.09-0.38 |
| 2A | 2710 | 780.70 | 0.288 | 0.27 | 0.05-0.50 | 0.36 | 0.10-0.50 | 0.30 | 0.09-0.38 |
| 2B | 14,287 | 801.20 | 0.056 | 0.25 | 0.05-0.50 | 0.38 | 0.10-0.50 | 0.30 | 0.09-0.38 |
| 2D | 3604 | 651.60 | 0.181 | 0.32 | 0.05-0.50 | 0.36 | 0.10-0.50 | 0.30 | 0.09-0.38 |
| 3A | 13,177 | 750.80 | 0.057 | 0.26 | 0.05-0.50 | 0.36 | 0.10-0.50 | 0.27 | 0.09-0.38 |
| 3B | 20,116 | 830.30 | 0.041 | 0.27 | 0.05-0.50 | 0.40 | 0.10-0.50 | 0.31 | 0.09-0.38 |
| 3D | 2417 | 615.40 | 0.255 | 0.20 | 0.05-0.50 | 0.31 | 0.10-0.50 | 0.26 | 0.09-0.38 |
| 4A | 12,438 | 744.50 | 0.060 | 0.25 | 0.05-0.50 | 0.38 | 0.10-0.50 | 0.30 | 0.09-0.38 |
| 4B | 10,680 | 673.40 | 0.063 | 0.23 | 0.05-0.50 | 0.36 | 0.10-0.50 | 0.28 | 0.09-0.38 |
| 4D | 1055 | 509.60 | 0.483 | 0.26 | 0.05-0.49 | 0.38 | 0.10-0.50 | 0.31 | 0.09-0.38 |
| 5A | 11,972 | 709.70 | 0.059 | 0.27 | 0.05-0.50 | 0.37 | 0.10-0.50 | 0.29 | 0.09-0.38 |
| 5B | 23,584 | 713.00 | 0.030 | 0.29 | 0.05-0.50 | 0.37 | 0.10-0.50 | 0.29 | 0.09-0.38 |
| 5D | 2512 | 566.00 | 0.225 | 0.29 | 0.05-0.50 | 0.33 | 0.10-0.50 | 0.27 | 0.09-0.38 |
| 6A | 14,250 | 618.00 | 0.043 | 0.25 | 0.05-0.50 | 0.40 | 0.10-0.50 | 0.32 | 0.09-0.38 |
| 6B | 14,434 | 720.90 | 0.050 | 0.27 | 0.05-0.50 | 0.33 | 0.10-0.50 | 0.27 | 0.09-0.38 |
| 6D | 2544 | 473.50 | 0.186 | 0.25 | 0.05-0.50 | 0.36 | 0.10-0.50 | 0.27 | 0.09-0.38 |
| 7A | 20,807 | 736.60 | 0.035 | 0.27 | 0.05-0.50 | 0.32 | 0.10-0.50 | 0.29 | 0.09-0.38 |
| 7B | 12,025 | 750.60 | 0.062 | 0.28 | 0.05-0.50 | 0.36 | 0.10-0.50 | 0.28 | 0.09-0.38 |
| 7D | 4537 | 638.60 | 0.141 | 0.22 | 0.05-0.50 | 0.29 | 0.10-0.50 | 0.26 | 0.09-0.38 |
| A genome | 93,664 | 4934.50 | 0.052 | 0.27 | 0.05-0.50 | 0.38 | 0.10-0.50 | 0.29 | 0.09-0.38 |
| B genome | 108,936 | 5179.00 | 0.048 | 0.29 | 0.05-0.50 | 0.36 | 0.10-0.50 | 0.28 | 0.09-0.38 |
| D genome | 20,568 | 3950.40 | 0.193 | 0.24 | 0.05-0.50 | 0.33 | 0.10-0.50 | 0.28 | 0.09-0.38 |
新窗口打开|下载CSV
2.3 PCA分析和LD衰减分析
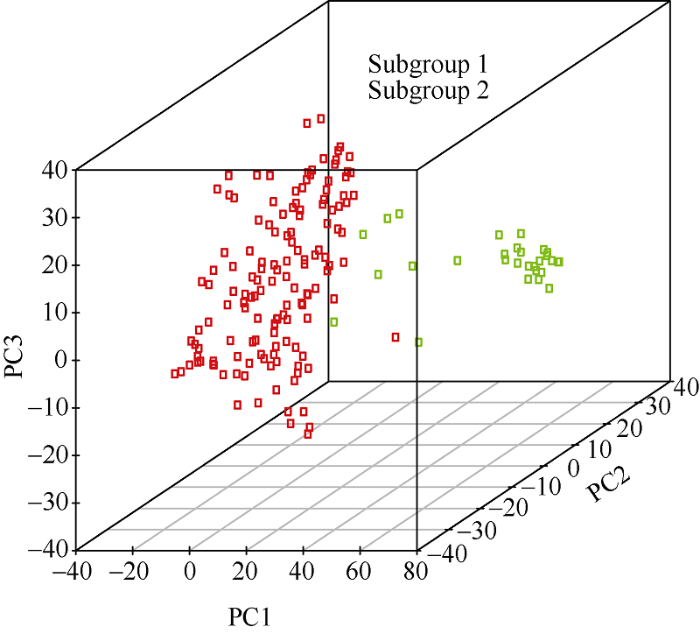
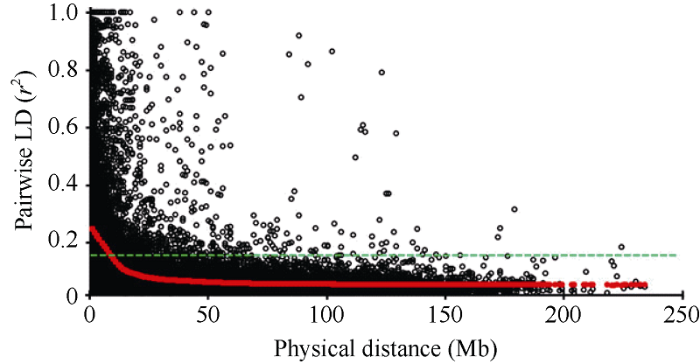
利用Tassel v 5.0 160份小麦品系进行PCA分析, 发现160份小麦品系可分为2个亚群(图1)。其中, 亚群1包含20份农家种, 亚群2包含140份育成品种和高代品系。以第95百分位的r2值作为阈值估测LD衰减距离, 160份小麦品系全基因组水平的r2阈值分别为0.135。r2阈值与LD衰减曲线的交叉点为LD衰减距离[22]。本研究中, 全基因组平均LD衰减距离为8 Mb (图2)。图1
 新窗口打开|下载原图ZIP|生成PPT
图1160份小麦品系主成分分析
Fig. 1Principal component analysis of 160 common wheat lines
图2
 新窗口打开|下载原图ZIP|生成PPT
图2160份小麦品系LD衰减分析
Fig. 2LD decay analysis of 160 common wheat lines
2.4 根系构型相关性状GWAS分析
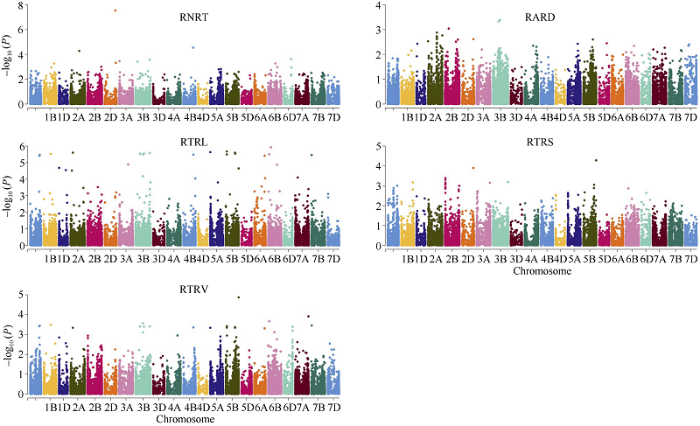
GWAS分析中出现假阳性结果的最主要原因是材料背景复杂, 存在群体结构现象[23]。PCA分析表明前2个主成分分别可解释表型变异的35.4%和8.6%, 160份小麦品系可分为2个亚群, 存在显著的群体结构。结合群体结构(PCA)和亲缘关系(K)的混合线性模型(MLM)可有效降低由群体结构造成的假阳性现象[24,25]。因此, 本研究中, 为了避免由于群体结构和亲缘关系引起的假阳性, 我们采用基于Tassel v 5.0的MLM模型对不同氮素条件下根系构型相关性状比值进行GWAS分析。基于两种不同氮素水平下根系构型相关性状的比值共计检测到86个与氮素利用效率相关性状显著关联的SNP标记, 分布于34个遗传位点(表3和图3)。其中, 7个位点与RNRT相关, 分布于1B、2B、2D、3A、3B (2)和4B染色体上, 分别解释8.4%~13.8%的表型变异; 2个位点与RARD关联, 分布于2B和3B染色体上, 分别解释9.2%和10.4%的表型变异; 7个位点与RTRL显著关联, 分布于1A、1B、2B、2D、3B和5B染色体上, 分别解释6.9%~11.9%的表型变异; 18个位点与RTRS相关, 分布于1A、1B、2A、3B、4B、5A、5B、6A、6B、6D、7A和7B染色体上, 分别解释9.2%~14.8%的表型变异; 29个位点与RTRV相关, 分布于1A、1B、1D、2A、2B、2D、3A、3B、4B、5A、5B、6A、6B、7A和7B染色体上, 分别解释9.6%~19.6%的表型变异(表3和图3)。不同氮素水平环境下根系构成相关性状比值存在较高的相关性。相应的, 在关联结果中我们发现多个相对性状有相同遗传位点, 如11个位点分别与RTRV和RTRS相关; 2个位点与RTRV、RTRS和RTRL相关; 2个位点与RTRV和RTRL相关; 1个位点与RNRT、RTRV和RTRL相关; 2个位点与RNRT和RTRV相关; 2个位点与RNRT、RTRV和RTRS相关; 1个位点与RTRV和RTRS相关。
Table 3
表3
表3与氮素利用效率显著关联(P ≤ 0.001)的SNP标记
Table 3
| 性状 Trait | 标记 Marker | 染色体 Chromosome | 位置 Position (Mb) | 优异等位基因 Favorable allele | P值 P-value | 表型解释变异 R2 (%) | 参考文献 Reference |
|---|---|---|---|---|---|---|---|
| RNRT | AX_110370425 | 1B | 577.6 | G | 5.38E-04 | 9.7 | |
| RNRT | AX_109497462 | 2B | 756.7 | T | 9.75E-04 | 8.9 | |
| RNRT | AX_108811964 | 2D | 612.3 | C | 4.81E-04 | 10.0 | |
| RNRT | AX_109933410 | 3A | 22.6 | G | 3.45E-04 | 8.4 | |
| RNRT | AX_109931146 | 3B | 117.6 | T | 3.78E-04 | 10.2 | Ren et al.[29] |
| RNRT | AX_110438119 | 3B | 778.3 | T | 2.68E-04 | 11.2 | |
| RNRT | AX_109838302 | 4B | 540.3 | T | 2.84E-05 | 13.8 | |
| RARD | AX_108964719 | 2B | 207.1 | G | 9.08E-04 | 9.2 | |
| RARD | AX_110968453 | 3B | 386.4 | G | 4.06E-04 | 10.4 | |
| RTRL | AX_108913559 | 1A | 515.8 | C | 9.88E-04 | 7.0 | |
| RTRL | AX_110617713 | 1B | 633.3 | T | 6.67E-04 | 9.6 | |
| RTRL | AX_109031690 | 2B | 25.5 | T | 6.79E-04 | 9.6 | |
| RTRL | AX_108858890 | 2B | 26.0 | T | 5.03E-04 | 10.4 | |
| RTRL | AX_109958492 | 2B | 26.0 | G | 7.36E-04 | 9.4 | |
| RTRL | AX_108989039 | 2B | 26.1 | G | 7.36E-04 | 9.4 | |
| RTRL | AX_110583038 | 2B | 26.1 | G | 8.66E-04 | 9.2 | |
| RTRL | AX_110536069 | 2B | 26.1 | G | 4.07E-04 | 10.2 | |
| RTRL | AX_109855057 | 2B | 26.1 | A | 7.73E-04 | 9.3 | |
| RTRL | AX_108758132 | 2B | 26.1 | C | 8.12E-04 | 9.6 | |
| RTRL | AX_109974238 | 2B | 785.8 | T | 9.99E-04 | 9.5 | |
| RTRL | AX_108811964 | 2D | 612.3 | C | 1.26E-04 | 11.9 | |
| RTRL | AX_109892051 | 3B | 821.0 | T | 6.39E-04 | 10.3 | |
| RTRL | AX_110045465 | 5B | 707.1 | C | 5.19E-05 | 13.0 | |
| RTRS | AX_110543784 | 1A | 496.9 | A | 3.82E-04 | 10.9 | |
| RTRS | AX_109973556 | 1A | 520.9 | C | 3.62E-04 | 10.3 | |
| RTRS | AX_110111289 | 1B | 384.3 | G | 3.24E-04 | 10.4 | |
| RTRS | AX_108774755 | 2A | 125.9 | G | 4.60E-04 | 9.9 | |
| RTRS | AX_110075829 | 3B | 250.6 | G | 3.91E-04 | 10.2 | |
| RTRS | AX_110612422 | 3B | 403.5 | G | 2.72E-04 | 10.6 | |
| RTRS | AX_110411187 | 3B | 410.1 | G | 7.86E-04 | 9.2 | |
| RTRS | AX_110388860 | 3B | 466.1 | G | 4.02E-04 | 10.1 | |
| RTRS | AX_108977570 | 3B | 780.4 | G | 3.87E-04 | 10.2 | |
| RTRS | AX_109915316 | 4B | 554.8 | G | 4.40E-04 | 10.0 | |
| RTRS | AX_110522770 | 5A | 8.2 | T | 4.58E-04 | 10.1 | Ren et al. [29] |
| RTRS | AX_110044622 | 5B | 59.2 | T | 3.82E-04 | 10.2 | |
| RTRS | AX_110366842 | 5B | 60.2 | G | 4.52E-04 | 10.0 | |
| RTRS | AX_109440517 | 5B | 504.0 | T | 4.23E-04 | 10.0 | |
| RTRS | AX_108813077 | 5B | 517.9 | C | 4.56E-04 | 9.9 | |
| RTRS | AX_110045465 | 5B | 707.1 | C | 1.34E-05 | 14.8 | |
| RTRS | AX_108740494 | 6A | 564.9 | G | 4.87E-04 | 9.9 | |
| RTRS | AX_109907271 | 6B | 54.4 | T | 2.13E-04 | 11.2 | Ren et al. [29] |
| RTRS | AX_110402455 | 6D | 469.2 | G | 6.43E-04 | 9.6 | |
| RTRS | AX_110447828 | 6D | 472.3 | T | 4.04E-04 | 10.3 | |
| RTRS | AX_110444174 | 7A | 722.6 | T | 1.21E-04 | 11.8 | |
| 性状 Trait | 标记 Marker | 染色体 Chromosome | 位置 Position (Mb) | 优异等位基因 Favorable allele | P值 P-value | 表型解释变异 R2 (%) | 参考文献 Reference |
| RTRS | AX_109983408 | 7B | 23.3 | G | 3.50E-04 | 10.5 | |
| RTRV | AX_110003555 | 1A | 486.7 | T | 5.71E-04 | 9.6 | |
| RTRV | AX_110543784 | 1A | 496.9 | A | 3.80E-06 | 17.9 | |
| RTRV | AX_109973556 | 1A | 520.9 | C | 3.38E-06 | 16.9 | |
| RTRV | AX_110111289 | 1B | 384.3 | G | 3.01E-06 | 17.0 | |
| RTRV | AX_110492902 | 1D | 382.2 | T | 2.82E-05 | 16.7 | |
| RTRV | AX_108774755 | 2A | 125.9 | G | 2.48E-06 | 17.4 | |
| RTRV | AX_110536069 | 2B | 26.1 | C | 7.23E-04 | 9.3 | |
| RTRV | AX_109974238 | 2B | 785.8 | T | 8.56E-04 | 9.6 | |
| RTRV | AX_109586550 | 2D | 632.0 | G | 6.33E-04 | 9.5 | |
| RTRV | AX_109933410 | 3A | 22.6 | G | 8.64E-04 | 7.2 | |
| RTRV | AX_110935379 | 3A | 491.9 | T | 1.29E-05 | 14.9 | |
| RTRV | AX_109931146 | 3B | 117.6 | T | 8.08E-04 | 9.4 | |
| RTRV | AX_110075829 | 3B | 250.6 | G | 2.85E-06 | 17.0 | |
| RTRV | AX_110612422 | 3B | 403.5 | G | 3.16E-06 | 16.9 | Shen et al. [30] |
| RTRV | AX_110411187 | 3B | 410.1 | G | 6.65E-05 | 12.6 | |
| RTRV | AX_110388860 | 3B | 466.1 | G | 2.83E-06 | 17.1 | |
| RTRV | AX_108977570 | 3B | 780.4 | G | 2.61E-06 | 17.2 | Shen et al. [30] |
| RTRV | AX_110531944 | 3B | 780.4 | T | 9.04E-04 | 9.0 | |
| RTRV | AX_109827784 | 3B | 780.7 | G | 8.90E-04 | 9.0 | |
| RTRV | AX_109279719 | 3B | 780.8 | G | 8.87E-04 | 9.0 | |
| RTRV | AX_108848657 | 3B | 781.3 | T | 4.03E-04 | 10.2 | |
| RTRV | AX_108783900 | 3B | 781.5 | G | 3.93E-04 | 10.1 | |
| RTRV | AX_109892051 | 3B | 821.0 | T | 1.54E-04 | 12.0 | |
| RTRV | AX_109915316 | 4B | 554.8 | G | 3.27E-06 | 16.8 | Ren et al. [29] |
| RTRV | AX_109364182 | 4B | 655.2 | T | 8.98E-05 | 13.2 | Ren et al. [29] |
| RTRV | AX_110522770 | 5A | 8.2 | T | 2.32E-06 | 17.5 | |
| RTRV | AX_110044622 | 5B | 59.2 | T | 2.11E-06 | 17.5 | Ren et al. [29] |
| RTRV | AX_110366842 | 5B | 60.2 | G | 3.18E-06 | 16.9 | |
| RTRV | AX_109440517 | 5B | 504.0 | T | 2.51E-06 | 17.2 | |
| RTRV | AX_108813077 | 5B | 517.9 | C | 2.88E-06 | 17.0 | |
| RTRV | AX_110045465 | 5B | 707.1 | C | 2.21E-05 | 14.1 | Ren et al. [29] |
| RTRV | AX_108882877 | 6A | 557.9 | G | 5.68E-04 | 9.9 | Shen et al. [30] |
| RTRV | AX_108740494 | 6A | 564.9 | G | 3.75E-06 | 16.8 | |
| RTRV | AX_110504351 | 6A | 596.0 | G | 8.66E-05 | 12.7 | |
| RTRV | AX_109907271 | 6B | 54.4 | T | 3.12E-06 | 17.0 | |
| RTRV | AX_109580957 | 6B | 149.9 | T | 1.18E-06 | 19.6 | |
| RTRV | AX_109308595 | 6B | 485.5 | T | 1.34E-05 | 15.2 | Ren et al. [29] |
| RTRV | AX_109364747 | 7A | 136.3 | T | 7.92E-05 | 12.3 | |
| RTRV | AX_109024988 | 7A | 689.3 | T | 9.92E-04 | 8.9 | |
| RTRV | AX_110444174 | 7A | 722.6 | T | 3.97E-04 | 10.2 | |
| RTRV | AX_109983408 | 7B | 23.3 | G | 3.46E-06 | 17.3 |
新窗口打开|下载CSV
图3
 新窗口打开|下载原图ZIP|生成PPT
图3160份普通小麦品系不同氮素条件下根系相关性状相对值全基因组关联分析曼哈顿图
RNRT: 相对根尖数; RTRL: 相对总根长; RTRS: 相对总根表面积; RTRV: 相对总根体积; RARD: 相对根平均直径。
Fig. 3Manhattan plots for relative root system architecture (RSA) related traits under different nitrogen level in 160 common wheat lines
RNRT: relative number of root tips; RTRL: relative total root length; RTRS: relative total root surface area; RTRV: relative total root volume; RARD: relative average root diameter.
3 讨论
氮素是植物叶绿素、蛋白质、核酸、酶类、生物碱、植物激素以及维生素类等物质的重要组成成分, 是决定作物产量的首要因素。选育高氮素利用效率品种是维持我国小麦生产安全的重要基础。长期以来, 由于氮素利用效率评价困难, 育种家主要依据地上部表型性状等来判断品种氮素利用效率, 对地下根系的作用认识不足, 一定程度上限制了小麦高产育种的进展[3,6]。近年来, 小麦基因芯片的开发和应用, 显著促进了数量性状遗传解析的进程[9,26]。本研究利用小麦660K SNP芯片, 在不同的氮素水平下, 尝试通过GWAS对小麦苗期不同环境下的根系性状进行遗传解析, 以期发掘氮素利用效率相关重要标记和遗传位点, 预测候选基因, 为通过分子育种技术改良小麦氮素利用效率奠定基础。本研究采用的小麦品系来源广泛, 包括地方品种、高代品系和现代育成种。针对3种不同来源的小麦材料, 对其不同氮素水平条件下的根系相关性状进行分析。多重比较结果表明, 高代品系和现代育成种在不同氮素水平下根系构成相关性状均显著高于地方品种, 表明人工选择对于小麦根系构型有较大提升。小麦根系构型对于产量具有重要影响。在人工选育过程中, 育种家在聚合高产基因, 选择高产材料的同时[27], 一定程度上间接完成了小麦根系构型的选择。然而, 针对不同氮素条件下根系构型相关性状比值进行分析, 发现不同来源材料间存在差异, 但并不显著。以上结果表明育种家在高产育种过程中可以间接完成根系相关性状的选择, 但是并不能有效开展氮素利用效率相关性状的选择, 因此, 通过开展不同氮素环境下根系表型鉴定, 间接发掘氮素利用效率相关位点, 对于促进小麦高氮素利用效率选择和育种是十分必要的。基因多态性是保证关联分析结果高效、准确的前提。本研究采用160份品系的基因多态性为0.34, 与之前报道接近[28], 可基本反映黄淮和北部冬麦区的品种多样性。相较于D基因组, A和B基因组具有较高的遗传多态性, 这与前人研究结果一致[9]。本研究采用品系遗传变异丰富, 适用于GWAS分析。PCA分析表明人工选择对群体结构分层具有显著影响。群体结构可导致关联分析结果出现假阳性[28]。因此, 采用结合群体结构(PCA)和亲缘关系(K)的混合线性模型(MLM)进行GWAS, 以避免假阳性的出现。LD衰减是影响关联分析准确度的重要因素, 不同自然群体的LD衰减距离不同。一般来说, 普通小麦LD衰减距离在1.5~15.0 cM范围内[9,26]。本研究中, 全基因组LD平均衰减距离为8 Mb。全基因组的平均标记间距(0.097)远低于LD衰减距离, 标记密度可满足关联分析要求[21]。相较于双亲群体, 自然群体积累了广泛的重组事件, 提供了更多有效重组信息, 可在短时间内发现更多关联位点。除此之外, GWAS分辨率较高, 有利于遗传位点的进一步精细定位和图位克隆。本研究共计检测到34个与氮素利用效率显著关联的位点, 在21条染色体上均有分布。其中, 与RNRT关联的显著位点AX_109931146 (3B, 117.6 Mb), 与RTRS关联的显著位点AX_110522770 (5A, 8.2 Mb)、AX_109907271 (6B, 54.4 Mb), 与RTRV关联的显著位点AX_110612422 (3B, 403.5 Mb)、AX_110531944 (3B, 780.4Mb), AX_109915316 (4B, 554.8 Mb)、AX_109364182 (4B, 655.2 Mb)、AX_110044622 (5B, 59.2 Mb)、AX_110045465 (5B, 707.1 Mb)、AX_108882877 (6A, 557.9 Mb)和AX_109308595 (6B、485.5 Mb)与Ren等[29]和沈兴[30]发掘到的多个氮素利用效率相关位点重叠或一致。这些位点存在氮素利用效率相关基因的可能性较大, 但迄今尚未克隆, 无法探讨其遗传调控机制。另外, 在这些区域, 我们发现了部分生长素响应(auxin responsive gene, ARF)相关基因, 但由于置信区间较大, 仍不可确定为候选基因, 下一步将针对这些区间开展精细定位工作。除此之外, 前人针对小麦氮素利用效率遗传机制也开展了多项研究, 在小麦2A、2B、4A、5A、7A和7B染色体上发现一批控制小麦氮素利用效率相关遗传位点[16,17,18,19], 但是由于多数研究采用的标记为传统的RFLP、SSR或者DArT标记, 根据现有小麦遗传或物理图谱, 无法进行可靠的对比, 暂时无法确定是否与本研究发现位点一致。基于NCBI数据库, 利用与氮素利用效率相关性状显著关联的SNP标记的侧翼序列通过BLASTn发掘候选基因, 在3B染色体(AX_109827784)上检测到一个编码E3-泛素蛋白连接酶的候选基因。E3-泛素蛋白连接酶是一种多类型的蛋白家族, 在植物氮素吸收、根系和幼芽生长发育过程中起着十分重要的作用[31,32]。虽然基于关联标记的生物信息分析是发掘复杂农艺性状相关候选基因的有效方法, 然而, 由于小麦根系构型建成涉及到多个复杂的生理、生化过程, 后续工作将围绕候选基因的作用进行验证。氮素利用效率是一个十分复杂的农艺性状, 相关研究较为滞后, 严重制约了高产、广适品种的培育。由于氮素利用效率在田间育种时无法及时评价表型, 基于分子标记的MAS育种是提升品种氮素利用效率最为重要的途径之一。因此, 研究品种间氮素利用效率差异, 筛选高氮素利用效率品种, 对培育新的优良品种具有重要价值。本研究共计发现34个氮素利用效率关联位点。其中, 存在多个位点与多个性状关联, 如1A染色体486.7 Mb~496.9 Mb处与RTRS和RTRV均显著关联, 1A染色体515.8 Mb~ 520.9 Mb处与RTRL、RTRS和RTRV均显著关联、2B染色体25.5 Mb~26.1 Mb处与RTRL和RTRV等性状显著关联, 这些位点相对更为可靠, 可进一步转化为KASP[33,34]或STARP[35]标记, 用于分子标记辅助育种和QTL精细定位。在所有实验材料中, 徐麦856、郑麦366、济南4号、临麦6号、兰考358、山农587、济麦52、山农0431、山农22、济麦37、鲁原502、山农1565、汶农14、鲁麦20、鑫麦296等品种具有较高的氮素利用效率, 农艺性状优良, 含有较多优异等位基因(15~21个), 可作为亲本, 用以导入或聚合优异等位基因, 提升育种材料的氮素利用效率(表4)。基于以上结果, 下一步研究工作将主要集中于关联位点的验证和育种家友好型KASP标记的开发, 为提升氮素利用效率提供参考。Table 4
表4
表4高氮素利用效率小麦品种
Table 4
| 品种 Cultivar | 性状Trait | 优异等位基因数 Number of favorable alleles | ||||
|---|---|---|---|---|---|---|
| RTRL | RTRS | RARD | RTRV | RNRT | ||
| 徐麦856 Xumai 856 | 2.356 | 1.149 | 0.748 | 1.415 | 4.850 | 17 |
| 郑麦366 Zhengmai 366 | 2.474 | 1.489 | 0.741 | 2.085 | 5.747 | 18 |
| 品种 Cultivar | 性状Trait | 优异等位基因数 Number of favorable alleles | ||||
| RTRL | RTRS | RARD | RTRV | RNRT | ||
| 济南4号 Jinan 4 | 2.495 | 1.238 | 0.722 | 0.985 | 3.951 | 16 |
| 临麦6号 Linmai 6 | 2.548 | 1.177 | 0.584 | 1.870 | 8.476 | 15 |
| 兰考358 Lankao 358 | 2.630 | 1.336 | 0.651 | 1.707 | 4.918 | 18 |
| 山农587 Shannong 587 | 2.674 | 1.401 | 0.678 | 0.903 | 6.599 | 15 |
| 济麦52 Jimai 52 | 2.687 | 1.433 | 0.531 | 1.988 | 11.925 | 16 |
| 山农0431 Shannong 0431 | 2.856 | 1.600 | 0.526 | 1.280 | 6.991 | 17 |
| 山农22 Shannong 22 | 2.884 | 1.206 | 0.690 | 1.554 | 5.695 | 19 |
| 济麦37 Jimai 37 | 2.907 | 1.385 | 0.587 | 0.968 | 3.233 | 20 |
| 鲁原502 Luyuan 502 | 3.114 | 1.520 | 0.729 | 2.882 | 15.500 | 15 |
| 山农1565 Shannong 1565 | 3.230 | 1.286 | 0.466 | 1.599 | 8.706 | 16 |
| 汶农14 Wennong 14 | 3.648 | 1.254 | 0.507 | 0.918 | 6.894 | 17 |
| 鲁麦20 Lumai 20 | 4.029 | 2.079 | 0.432 | 1.534 | 15.089 | 21 |
| 鑫麦296 Xinmai 296 | 5.828 | 2.164 | 0.481 | 2.113 | 24.547 | 20 |
新窗口打开|下载CSV
4 结论
本研究利用160份小麦品系, 通过测定苗期根系构型相关性状, 间接开展氮素利用效率相关性状的GWAS分析, 共计检测到34个关联位点。发掘到的遗传位点及其关联标记可开发为KASP标记, 用于筛选高氮素利用效率小麦品种, 筛选出的品种, 可作为亲本材料应用于小麦高产育种中。附图和附表 请见网络版: 1) 本刊网站
参考文献 原文顺序
文献年度倒序
文中引用次数倒序
被引期刊影响因子
[本文引用: 2]
URLPMID:25165146 [本文引用: 2]
URLPMID:26880749 [本文引用: 6]
[本文引用: 1]
[本文引用: 1]
[本文引用: 4]
DOI:10.3390/plants4020334URLPMID:27135332 [本文引用: 1]

Roots are crucial for nutrient and water acquisition and can be targeted to enhance plant productivity under a broad range of growing conditions. A current challenge for plant breeding is the limited ability to phenotype and select for desirable root characteristics due to their underground location. Plant breeding efforts aimed at modifying root traits can result in novel, more stress-tolerant crops and increased yield by enhancing the capacity of the plant for soil exploration and, thus, water and nutrient acquisition. Available approaches for root phenotyping in laboratory, greenhouse and field encompass simple agar plates to labor-intensive root digging (i.e., shovelomics) and soil boring methods, the construction of underground root observation stations and sophisticated computer-assisted root imaging. Here, we summarize root architectural traits relevant to crop productivity, survey root phenotyping strategies and describe their advantages, limitations and practical value for crop and forage breeding programs.
URLPMID:17177637 [本文引用: 2]
URLPMID:29169344 [本文引用: 5]
URLPMID:27802269 [本文引用: 1]
URLPMID:24400634 [本文引用: 1]
[本文引用: 1]
DOI:10.1111/pbi.12288URLPMID:25424506 [本文引用: 1]
Consensus linkage maps are important tools in crop genomics. We have assembled a high-density tetraploid wheat consensus map by integrating 13 data sets from independent biparental populations involving durum wheat cultivars (Triticum turgidum ssp. durum), cultivated emmer (T. turgidum ssp. dicoccum) and their ancestor (wild emmer, T. turgidum ssp. dicoccoides). The consensus map harboured 30 144 markers (including 26 626 SNPs and 791 SSRs) half of which were present in at least two component maps. The final map spanned 2631 cM of all 14 durum wheat chromosomes and, differently from the individual component maps, all markers fell within the 14 linkage groups. Marker density per genetic distance unit peaked at centromeric regions, likely due to a combination of low recombination rate in the centromeric regions and even gene distribution along the chromosomes. Comparisons with bread wheat indicated fewer regions with recombination suppression, making this consensus map valuable for mapping in the A and B genomes of both durum and bread wheat. Sequence similarity analysis allowed us to relate mapped gene-derived SNPs to chromosome-specific transcripts. Dense patterns of homeologous relationships have been established between the A- and B-genome maps and between nonsyntenic homeologous chromosome regions as well, the latter tracing to ancient translocation events. The gene-based homeologous relationships are valuable to infer the map location of homeologs of target loci/QTLs. Because most SNP and SSR markers were previously mapped in bread wheat, this consensus map will facilitate a more effective integration and exploitation of genes and QTL for wheat breeding purposes.
[本文引用: 1]
URLPMID:16189659 [本文引用: 1]
[本文引用: 3]
URLPMID:15719212 [本文引用: 2]
DOI:10.1007/s00122-009-1076-4URLPMID:19513687 [本文引用: 2]
To better understand the genetic variability for nitrogen use efficiency in winter wheat is a necessity in the frame of the present economic and ecological context. The objective of this work was to investigate the role of the enzymes glutamine synthetase (GS) and glutamate dehydrogenase (GDH), and other nitrogen (N)-related physiological traits in the control of agronomic performance in wheat. A quantitative genetics approach was developed using the Arche x Recital population of doubled haploid lines grown for 3 years in the field. GS and GDH activities, ammonium, amino acid and protein contents were measured at different stages of plant development in different organs after flowering. Significant genotypic effects were observed for all measured physiological and agronomical traits. Heading date was negatively correlated with ammonium, amino acid, protein contents and GS activity in the flag leaf lamina. Grain protein content was positively correlated with both ammonium and amino acid content, and to a lesser extent with soluble protein content and GS activity. A total of 148 quantitative trait loci (QTLs) were detected, 104 QTLs for physiological traits and 44 QTLs for agronomic traits. Twenty-six QTLs were detected for GDH activity spread over 13 chromosomes and 25 QTLs for GS activity spread over 12 chromosomes. We found only a co-localization between a QTL for GS activity and GSe, a structural gene encoding cytosolic GS on chromosome 4B. A coincidence between a QTL for GDH activity and a gene encoding GDH was also found on chromosome 2B. QTL regions combining both physiological and agronomical QTLs were mainly identified on linkage groups 2A, 2B, 2D, 5A, 5B and 5D. This approach allowed us to propose possible functions of physiological traits to explain the variation observed for agronomic traits including yield and its components.
[本文引用: 2]
[本文引用: 1]
URLPMID:6096873 [本文引用: 2]
DOI:10.1534/genetics.105.044586URLPMID:16079235 [本文引用: 1]
[本文引用: 1]
[本文引用: 1]
URLPMID:21482771 [本文引用: 1]
[本文引用: 2]
DOI:10.1093/jxb/erz032URLPMID:30753656 [本文引用: 1]
BRITTLE1 (BT1), responsible for unidirectional transmembrane transport of ADP-glucose, plays a pivotal role in starch synthesis of cereal grain. In this study, we isolated three TaBT1 homoeologous genes located on chromosomes 6A, 6B, and 6D in common wheat. TaBT1 was mainly expressed in developing grains, and knockdown of TaBT1 in common wheat produced a decrease in grain size, thousand kernel weight (TKW), and grain total starch content. High diversity was detected at the TaBT1-6B locus, with 24 polymorphic sites forming three haplotypes (Hap1, Hap2, and Hap3). Association analysis revealed that Hap1 and Hap2 were preferred haplotypes in modern breeding, for their significant correlations with higher TKW. Furthermore, beta-glucuronidase (GUS) staining and enzyme activity assays in developing grains of transgenic rice with exogenous promoters indicated that the promoters of Hap1 and Hap2 showed stronger driving activity than that of Hap3. Evolutionary analysis revealed that BT1 underwent strong selection during wheat polyploidization. In addition, the frequency distribution of TaBT1-6B haplotypes revealed that Hap1 and Hap2 were preferred in global modern wheat cultivars. Our findings suggest that TaBT1 has an important effect on starch synthesis and TKW, and provide two valuable molecular markers for marker assisted selection (MAS) in wheat high-yield breeding.
[本文引用: 2]
DOI:10.3389/fpls.2018.00845URLPMID:29997636 [本文引用: 9]
Genetic divergence for nitrogen utilization in germplasms is important in wheat breeding programs, especially for low nitrogen input management. In this study, a nested association mapping (NAM) population, derived from
[本文引用: 4]
[本文引用: 4]
DOI:10.1093/jxb/erp059URLPMID:19276192 [本文引用: 1]
In yeast and in animals the ubiquitin-proteasome system (UPS) is responsible for removing or modifying most abnormal peptides and also short-lived cellular regulators. The UPS therefore influences many processes such as the cell cycle, signal transduction, transcription, and stress responses including defence. In recent years, similar regulatory roles have been identified in plants. In Arabidopsis, mutations in the ubiquitin-proteasome pathway block development, circadian rhythms, photomorphogenesis, floral homeosis, hormone responses, senescence, and pathogen invasion. Plants have evolved an armoury of defence mechanisms that allow them to counter infection. These encompass both basal responses, triggered by recognition of conserved pathogen-associated molecular patterns, and pathogen-specific responses, mediated via pathogen- and plant-specific gene-for-gene recognition events. The role of E3 ubiquitin ligases in mediating plant defence signalling is reviewed and examples where pathogens impinge on the host's ubiquitination machinery acting as molecular mimics to undermine defence are also highlighted.
DOI:10.1007/s11103-010-9687-3URLPMID:20878348 [本文引用: 1]
Oryza sativa Delayed Seed Germination 1 (OsDSG1), causing a recessive null mutation. Overexpression of the gene enhanced seed germination. OsDSG1 is most similar to Arabidopsis AIP2, an E3 ligase targeting ABI3.Yeast two-hybrid experiments showed that our OsDSG1 binds to OsABI3, indicating that OsDSG1 is a rice ortholog of AIP2. Self-ubiquitination assay indicated that bacterially expressed OsDSG1 protein has E3 ubiquitin ligase activity. Real-time PCR analysis revealed that OsDSG1 was expressed in leaves and roots, and strongly in developing seeds. In addition to the delayed-germination phenotype, mutant plants were shorter and had greater tolerance to high-salt and drought stresses. In the osdsg1 mutant, transcript levels of ABA signaling genes and ABA responsive genes were significantly increased. By contrast, expressions of OsGAMYB and its downstream genes that encode hydrolytic enzymes were markedly reduced. These observations support that OsDSG1 is a major regulator of ABA signaling in germinating seeds. Finally, we observed that the germination rates of various rice cultivars depended upon the transcript levels of OsDSG1 and other ABA-signaling genes.]]>
DOI:10.1007/s11032-013-9917-xURL [本文引用: 1]
DOI:10.1016/j.molp.2017.06.008URLPMID:28669791 [本文引用: 1]
There is a rapidly rising trend in the development and application of molecular marker assays for gene mapping and discovery in field crops and trees. Thus far, more than 50 SNP arrays and 15 different types of genotyping-by-sequencing (GBS) platforms have been developed in over 25 crop species and perennial trees. However, much less effort has been made on developing ultra-high-throughput and cost-effective genotyping platforms for applied breeding programs. In this review, we discuss the scientific bottlenecks in existing SNP arrays and GBS technologies and the strategies to develop targeted platforms for crop molecular breeding. We propose that future practical breeding platforms should adopt automated genotyping technologies, either array or sequencing based, target functional polymorphisms underpinning economic traits, and provide desirable prediction accuracy for quantitative traits, with universal applications under wide genetic backgrounds in crops. The development of such platforms faces serious challenges at both the technological level due to cost ineffectiveness, and the knowledge level due to large genotype-phenotype gaps in crop plants. It is expected that such genotyping platforms will be achieved in the next ten years in major crops in consideration of (a) rapid development in gene discovery of important traits, (b) deepened understanding of quantitative traits through new analytical models and population designs, (c) integration of multi-layer -omics data leading to identification of genes and pathways responsible for important breeding traits, and (d) improvement in cost effectiveness of large-scale genotyping. Crop breeding chips and genotyping platforms will provide unprecedented opportunities to accelerate the development of cultivars with desired yield potential, quality, and enhanced adaptation to mitigate the effects of climate change.
DOI:10.1007/s00122-016-2838-4URLPMID:27942775 [本文引用: 1]
KEY MESSAGE: An innovative genotyping method designated as semi-thermal asymmetric reverse PCR (STARP) was developed for genotyping individual SNPs with improved accuracy, flexible throughputs, low operational costs, and high platform compatibility. Multiplex chip-based technology for genome-scale genotyping of single nucleotide polymorphisms (SNPs) has made great progress in the past two decades. However, PCR-based genotyping of individual SNPs still remains problematic in accuracy, throughput, simplicity, and/or operational costs as well as the compatibility with multiple platforms. Here, we report a novel SNP genotyping method designated semi-thermal asymmetric reverse PCR (STARP). In this method, genotyping assay was performed under unique PCR conditions using two universal priming element-adjustable primers (PEA-primers) and one group of three locus-specific primers: two asymmetrically modified allele-specific primers (AMAS-primers) and their common reverse primer. The two AMAS-primers each were substituted one base in different positions at their 3' regions to significantly increase the amplification specificity of the two alleles and tailed at 5' ends to provide priming sites for PEA-primers. The two PEA-primers were developed for common use in all genotyping assays to stringently target the PCR fragments generated by the two AMAS-primers with similar PCR efficiencies and for flexible detection using either gel-free fluorescence signals or gel-based size separation. The state-of-the-art primer design and unique PCR conditions endowed STARP with all the major advantages of high accuracy, flexible throughputs, simple assay design, low operational costs, and platform compatibility. In addition to SNPs, STARP can also be employed in genotyping of indels (insertion-deletion polymorphisms). As vast variations in DNA sequences are being unearthed by many genome sequencing projects and genotyping by sequencing, STARP will have wide applications across all biological organisms in agriculture, medicine, and forensics.
