 ,1,2,3,*, 陈水森4, 李丹4
Inversion of leaf area index of winter wheat based on GF-1/2 image
Umut HASAN1,2,4, Mamat SAWUT,1,2,3,*, CHEN Shui-Sen4, LI Dan4通讯作者:
收稿日期:2019-07-28接受日期:2019-12-26网络出版日期:2020-01-15
| 基金资助: |
Received:2019-07-28Accepted:2019-12-26Online:2020-01-15
| Fund supported: |
作者简介 About authors
E-mail:umut710@163.com。

摘要
关键词:
Abstract
Keywords:
PDF (3362KB)元数据多维度评价相关文章导出EndNote|Ris|Bibtex收藏本文
本文引用格式
吾木提·艾山江, 买买提·沙吾提, 陈水森, 李丹. 基于GF-1/2卫星数据的冬小麦叶面积指数反演[J]. 作物学报, 2020, 46(5): 787-797. doi:10.3724/SP.J.1006.2020.91049
Umut HASAN, Mamat SAWUT, CHEN Shui-Sen, LI Dan.
叶面积指数(leaf area index, LAI)是一个控制植被冠层生理过程的重要参数[1], 与生物量和作物产量等有着密切的关系。它定义为单位地表面积上的单面总叶面积[2], 叶片投影面积[3]或单位地表面积上总截留面积的一半[1]。在农作物研究方面, LAI可以有效表征冠层的生长状况, 其大小或波动能有效反映作物的长势、水情、病害等状况, 根据LAI生长期的变化还可以被长期应用于作物生长模型、冠层反射模型等。因此, 准确、快速地估测农作物LAI, 对不同尺度上准确、及时地掌握农作物生长状态和预测农作物生长趋势及估算产量具有重要意义[4]。
目前, 国内外利用遥感手段反演LAI的方法主要有两种, 一种是基于植被指数的经验模型法, 另一种是基于植被辐射传输特性的物理模型法。经验模型和物理模型有较明显的区别但又有一定的互补性[5], 经验模型可及时有效、无损地监测农作物长势, 可以作为耦合遥感数据和地面数据的有效手段, 但其机理性较弱[6]; 物理模型虽然机理性强、使用的植被类型和空间范围更广, 但其输入参数较多且难以获取, 存在遥感反演的病态问题[7]。国内外很多****针对不同模型, 从不同角度、不同方法出发, 进行了农作物LAI的遥感反演研究。刘明等[8]利用MODIS影像提取10种植被指数, 建立玉米LAI反演的经验模型, 发现基于优化土壤调整植被指数(OSAVI)和归一化植被指数(NDVI)的回归模型反演LAI的精度最佳; Masayasu等[9]利用植物结构时间序列指数(TIPS)与LAI之间的关系建立估算水稻LAI模型, 发现TIPS具有提高水稻LAI估算精度的潜力; Mairaj等[10]在水稻不同物候期不同氮水平下, 利用9种高光谱植被指数进行LAI的估算, 发现整体上增强植被指数(EVI)表现最佳, 不同物候期、不同氮水平对最佳高光谱植被指数的选择有较显著的影响; 苏伟等[11]利用Sentinel-2遥感影像构建归一化差异光谱指数(NDSI)和比值光谱指数(RSI), 发现基于NDSI(783,705)建立的单变量反演模型效果最佳; Propastin等[12]用ETM+几种多光谱植被指数建立反演LAI的普通最小二乘回归(OLS)模型和地理加权回归(GWR)模型, 发现LAI与遥感数据之间的空间非稳定性和尺度依赖性对LAI估计具有重要意义; 高林等[13]利用无人机高光谱影像数据构建12种植被指数, 发现比值型光谱指数RSI(494,610)与冬小麦LAI 具有较高的正相关, 可以作为估测LAI的最佳指数; 杜鹤娟等[14]以玉米为例, 做了光学与微波植被指数协同反演农作物LAI的可行性分析, 发现光学植被指数MNDVI (modified normalized difference vegetation index)在LAI为0~3时敏感, 微波植被指数SARSRVI在LAI为3~6时敏感, 说明可利用分段敏感的植被指数协同反演玉米LAI; Liang等[15]基于PROSAIL模拟的高光谱数据和43种高光谱植被指数, 采用混合反演方法对农作物LAI进行估测, 表明选择合适的植被指数对提高反演精度的重要性, 并发现OSVAI和MTVI2对LAI比较敏感; 李亚妮等[16]在PROSAIL模型基础上, 建立水稻田缨帽三角-叶面积指数(TCT-LAI)等值线模型, 用于Landsat 8和World View-3影像上反演水稻LAI, 发现TCT-LAI等值线模型反演的LAI与实测LAI间具有良好的拟合效果。以上研究成果不仅为农作物LAI的反演提供更准确的数据来源, 而且能够有效地提高农作物LAI的反演精度, 进一步为精准农业研究提供更可靠、准确的信息。
以往的研究主要以MODIS、Landsat、Sentinel等国外遥感影像作为数据源进行农作物LAI的研究, 国产卫星影像利用率较低。目前, 国产遥感卫星空间分辨率已达到亚米级, 能够为农作物的参数反演研究提供更多地面细节信息。因此, 本文以高分1号(GF-1)WFV、高分2号(GF-2)影像作为数据源, 结合冬小麦主要生育期地面实测LAI数据, 分析基于GF-1/2的多光谱植被指数与不同生育期冬小麦LAI间的相关性和灰色关联性, 建立反演冬小麦LAI的单变量和多变量回归模型, 并对其进行验证, 以期评价GF-1/2影像数据反演不同生育期冬小麦LAI的可行性, 为利用国产高空间分辨率影像定量反演农作物参数提供一定的参考。
1 材料与方法
1.1 研究区概况
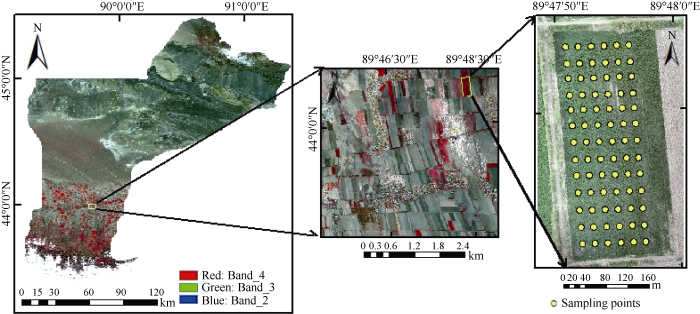
野外观测区位于新疆维吾尔自治区昌吉回族自治州奇台县(89°13′E~91°22′E, 42°25′N~45°29′N)境内; 地形地貌复杂多变, 南依天山, 北部是荒漠, 中部是天山冲积层平原, 属于中温带大陆性半荒漠干旱性气候, 年平均气温5.5℃, 年平均无霜期153 d, 年平均降水量269.4 mm[17]; 该地区主要农作物有小麦、玉米、亚麻、豆类, 其中冬小麦通常于每年9月中下旬播种, 次年3月末开始返青, 7月初成熟。本研究选择奇台县五马场乡半截泉村牧业三队农田(图1), 小麦种植方式为机械种植, 灌溉方式为滴灌, 品种为新冬18, 于2017年9月25日播种。图1
 新窗口打开|下载原图ZIP|生成PPT
图1研究区示意图
Fig. 1Sketch map of the study area
1.2 影像数据与预处理
获取GF-1/2影像数据(表1), 多光谱空间分辨率分别为16 m和4 m, 影像幅宽分别为800 km和45 km, 影像获取时间与地面实测LAI的时间基本保持一致。Table 1
表1
表1奇台县冬小麦遥感影像获取时间
Table 1
| 影像获取时间 Image acquisition time (month/day) | 冬小麦生育期 Growth stage of winter wheat | 影像名称 Image name | 波段信息 Band information |
|---|---|---|---|
| 4/14, 4/16 | 起身期 Erecting stage | GF-1, GF-2 | GF-1/2: 多光谱 Multispectral (0.45-0.52, 0.52-0.59, 0.63-0.69, 0.77-0.89 μm) |
| 5/9 | 拔节期 Jointing stage | GF-1 | |
| 6/6 | 开花期 Flowering stage | GF-1 | GF-2: 全色 Panchromatic (0.45-0.90 μm) |
新窗口打开|下载CSV
影像预处理过程主要包括辐射定标和大气校正。首先, 根据中国资源卫星应用中心(http://218. 247.138.119/CN/Downloads/dbcs/index.shtml)提供的传感器辐射定标参数进行辐射定标; 然后, 利用ENVI5.3的FLAASH模型分别对GF-1、GF-2影像进行大气校正, 并使用原数据自带的RPC文件进行正射校正; 最后, 将GF-2影像的全色波段与多光谱波段融合, 得到空间分辨率为1 m的影像数据, 并利用研究区矢量边界对所有影像进行裁剪。
1.3 地面实验及数据采集
1.3.1 田间观测实验设计 2018年4月至6月对研究区冬小麦进行田间观测以及样品的采集。在130 m × 420 m地块内, 东西方向上20 m, 南北方向上30 m为间隔进行地面观测, 采样点78个, 取4行 × 50 cm小区域, 利用五点采样法取样, 取样后用皮尺测量取样宽度, 并用GPS给出样点坐标, 其空间分布如图1所示。1.3.2 LAI的计算 采用基于数字图像处理的扫描法, 计算扫描的数字图像上绿叶与已知参考物的 像素值比, 结合小麦群体密度来推算叶面积指数。
式中, A为取样面积, m为取样面积内的总株数, n为扫描图像中的总株数, R为已知的参考物面积, P为扫描图像中绿叶与已知参考物的像素之比。
1.4 植被指数的选择
根据前人的研究结果和LAI与宽波段植被指数间的相关性, 利用文献统计的方法统计选取17种对冬小麦LAI较敏感的两波段和三波段植被指数(表2)。Table 2
表2
表2常用宽波段植被指数
Table 2
| 植被指数 VI | 名称 Name | 公式 Equation | 参考文献 Reference |
|---|---|---|---|
| NDVI | 归一化差值植被指数 Normalized Difference Vegetation Index | $(R_{NIR}-R_{red})/(R_{NIR}+R_{red})$ | [18] |
| GNDVI | 绿度归一化差值植被指数 Green Normalized Difference Vegetation Index | $(R_{NIR}-R_{green})/(R_{NIR}+R_{green})$ | [19] |
| RDVI | 复归一化差值植被指数 Renormalized Difference Vegetation Index | $(R_{NIR}-R_{red})/ \sqrt{R_{NIR}+R_{red}}$ | [20] |
| SAVI | 土壤调整植被指数 Soil-Adjusted Vegetation Index | $(1+0.1)/ \frac{R_{NIR}-R_{red}}{R_{NIR}+R_{red}+0.1}$ | [21] |
| MSR | 修正简单比 Modified Simple Ratio | $(R_{NIR}-R_{blue})/(R_{red}+R_{blue})$ | [22] |
| TVI | 三角植被指数 Triangular Vegetation Index | $0.5[120(R_{NIR}-R_{green})-200(R_{red}+R_{green})]$ | [18] |
| OSAVI | 优化土壤调整植被指数 Optimized Soil-Adjusted Vegetation Index | $1.16(R_{NIR}-R_{red})/(R_{NIR}+R_{red}+0.16)$ | [23] |
| EVI | 增强植被指数 Enhanced Vegetation Index | $2.5 \times \frac{R_{NIR}-R_{red}}{R_{NIR}+6 \times R_{red}-7.5 \times R_{blue}+1}$ | [24] |
| EVI2 | 双波段增强植被指数 Two-band Enhanced Vegetation Index | $2.5(R_{NIR}-R_{red})/(R_{NIR}+2.4 \times R_{red}+1)$ | [25] |
| GSR | 绿度简单比 Green Simple Ratio | ${R_{NIR}}/{R_{green}}$ | [26] |
| DVI | 差值植被指数 Difference Vegetation Index | $R_{NIR}-R_{red}$ | [27] |
| WDRVI | 宽动态植被指数 Wide Dynamic Range Vegetation Index | $0.1\times(R_{NIR}-R_{red})/0.1 \times(R_{NIR}+R_{red})$ | [28] |
| CIgreen | 绿色叶绿素指数 Green Chlorophyll Index | $\frac{R_{NIR}}{R_{green}}-1$ | [29] |
| VARI | 可见光大气阻力指数 Visible Atmospherically Resistant Index | $(R_{green}-R_{red})/(R_{green}+R_{red}-R_{blue})$ | [30] |
| MTVI | 修正三角植被指数 Modified Triangular vegetation index | $1.2[1.2(R_{NIR}-R_{green})-200(R_{red}-R_{green})]$ | [18] |
| NLI | 非线性植被指数 Nonlinear Vegetation Index | $(R^{2}_{NIR}-R_{red})/(R^{2}_{NIR}+R_{red})$ | [31] |
| MNLI | 修正非线性植被指数 Modified Nonlinear Vegetation Index | $1.5(R^{2}_{NIR}-R_{red})/(R^{2}_{NIR}+R_{red}+0.5)$ | [31] |
新窗口打开|下载CSV
1.5 灰色关联度分析
对2个系统或2个因素之间关联性大小的量度称为关联度。它描述系统发展过程中因素之间相对变化的情况, 如果两者在系统发展过程中相对变化基本一致, 则认为两者的关联度大; 反之, 两者的关联度就小。可见, 灰色关联度分析是对一个系统发展变化态势的定量描述和比较。灰色关联分析是衡量反映系统行为特征的参考数列与影响因素数列之间关联程度的一种方法[32,33]。本研究以小麦LAI作为参考数列, 常用植被指数作为比较数列进行灰色关联度分析。(1)对小麦LAI数据无量纲化处理。
(2)关联系数的计算
利用参考数列和比较数列, 根据式(2)计算二者的灰色关联系数。
式中, γ0i(k)为参考数列与比较数列k之间的关联系数; $\Delta_{min}$和$\Delta_{max}$分别为最小绝对差和最大绝对差; $\rho$为分辨系数, 取值范围[0, 1], 本文中$\rho$= 0.5。
(3)灰色关联度计算
根据式(3)计算灰色关联度。
(4)关联度排序
按照关联度γi的大小, 对植被指数排序。
1.6 建立模型与验证
利用经验模型法, 建立反演冬小麦LAI的单变量(线性、指数、幂、二次多项式)和多变量(偏最小二乘回归, PLSR)模型, 总样本的一半用于建模, 一半用于验证, 选取决定系数(coefficient of determination, R2)、均方根误差(root mean square error, RMSE)、相对预测偏差(residual prediction deviation, RPD)进行模型精度的检验。2 结果与分析
2.1 LAI与GF-1/2影像宽波段植被指数的相关性
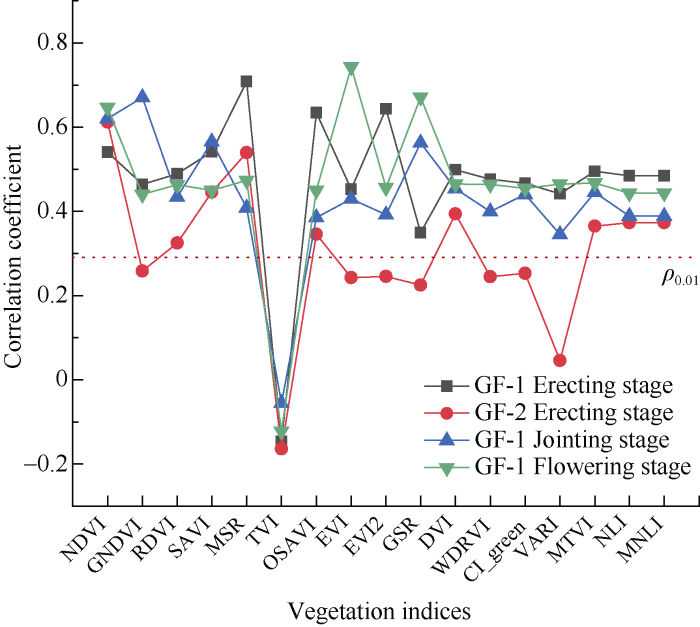
从图2中可知, 不同生育期内, TVI与LAI之间都是负相关, 而且没通过0.01显著性检验(临界值为±0.29), 其他植被指数与LAI间都为正相关, 除了GF-2起身期外, GF-1影像中提取的不同生育期的植被指数都通过了0.01显著性检验, GF-1起身期、GF-1拔节期以及GF-1开花期提取的植被指数中, MSR、GNDVI、EVI与LAI间的相关系数达到了最大值, 分别为0.708、0.671、0.743, 说明这些植被指数与LAI间有较好的相关性。图2
 新窗口打开|下载原图ZIP|生成PPT
图2LAI与GF-1/2宽波段植被指数间的相关系数图
Fig. 2Correlation coefficient diagram between LAI and GF-1/2 broad band vegetation indices
同一生育期内, 即起身期内GF-1和GF-2影像中提取的宽波段植被指数与LAI间的相关性存在一定的差异, GF-2影像中提取的NDVI与LAI间的相关系数明显大于GF-1影像中提取的NDVI与LAI间的相关系数, 达到了0.612, GF-2影像中提取的其他植被指数与LAI间的相关系数都低于GF-1影像中提取的植被指数与LAI间的相关系数, 而且GF-2影像中提取的植被指数中只有9个通过了0.01显著性检验。
2.2 LAI与GF-1/2影像宽波段植被指数的灰色关联度分析
在相关性分析的基础上, 对LAI与GF-1/2影像宽波段植被指数之间进行了灰色关联度的计算, 并对其排序, 作为下一步建立模型的依据, 结果如表3所示。Table 3
表3
表3LAI与GF-1/2宽波段植被指数间的灰色关联度及排序
Table 3
| 起身期 Erecting stage | 拔节期 Jointing stage | 开花期 Flowering stage | |||||
|---|---|---|---|---|---|---|---|
| GF-1 VI | 灰色关联度(排序) Grey correlation degree (ranking) | GF-2 VI | 灰色关联度(排序) Grey correlation degree (ranking) | GF-1 VI | 灰色关联度(排序) Grey correlation degree (ranking) | GF-1 VI | 灰色关联度(排序) Grey correlation degree (ranking) |
| MSR | 0.8015(1) | NDVI | 0.8657(1) | GNDVI | 0.8154(1) | EVI | 0.7894(1) |
| EVI2 | 0.7607(2) | MSR | 0.8622(2) | NDVI | 0.8006(2) | GSR | 0.7737(2) |
| OSAVI | 0.7570(3) | SAVI | 0.8582(3) | SAVI | 0.7890(3) | NDVI | 0.7450(3) |
| GSR | 0.7211(4) | DVI | 0.8545(4) | GSR | 0.7693(4) | SAVI | 0.7417(4) |
| SAVI | 0.6839(5) | MTVI | 0.8523(5) | OSAVI | 0.7448(5) | OSAVI | 0.7417(5) |
| NDVI | 0.6687(6) | RDVI | 0.8508(6) | EVI2 | 0.7440(6) | GNDVI | 0.7413(6) |
| TVI | 0.6590(7) | VARI | 0.8500(7) | CIgreen | 0.7434(7) | EVI2 | 0.7376(7) |
| VARI | 0.6584(8) | CIgreen | 0.8495(8) | WDRVI | 0.7424(8) | WDRVI | 0.7325(8) |
| MTVI | 0.6366(9) | MSR | 0.8494(9) | RDVI | 0.7406(9) | MSR | 0.7235(9) |
| CIgreen | 0.6360(10) | WDRVI | 0.8488(10) | EVI | 0.7399(10) | VARI | 0.7195(10) |
| WDRVI | 0.6340(11) | EVI2 | 0.8485(11) | MSR | 0.7366(11) | RDVI | 0.7176(11) |
| DVI | 0.6327(12) | OSAVI | 0.8483(12) | MTVI | 0.7318(12) | MTVI | 0.7175(12) |
| EVI | 0.6306(13) | EVI | 0.8482(13) | DVI | 0.7312(13) | CIgreen | 0.7173(13) |
| GNDVI | 0.6293(14) | MNLI | 0.8470(14) | VARI | 0.7308(14) | DVI | 0.7155(14) |
| RDVI | 0.6225(15) | NLI | 0.8305(15) | MNLI | 0.7172(15) | NLI | 0.7127(15) |
| NLI | 0.6098(16) | GSR | 0.8303(16) | NLI | 0.7169(16) | MNLI | 0.7126(16) |
| MNLI | 0.6096(17) | TVI | 0.8167(17) | TVI | 0.6898(17) | TVI | 0.6530(17) |
新窗口打开|下载CSV
2.3 LAI单变量估算模型
从建模数据集中, 选择与LAI的灰色关联度最稳定的宽波段植被指数作为自变量x, LAI值作为因变量y, 建立4种单变量回归模型估算冬小麦LAI。由表4可知, 针对GF-1起身期、GF-2起身期、GF-1拔节期建立的4种单变量回归模型中, 二次多项式模型的R2均高于其他3种模型, 分别达到了0.724、0.768和0.783; 根据GF-1开花期EVI建立的4种单变量回归模型的R2、RMSE都很接近, 其中幂函数模型的R2略高于其他3种模型。
Table 4
表4
表4基于GF-1/2影像宽波段植被指数的LAI单变量估算模型
Table 4
| 生育期 Growth stage | 宽波段VI Wide band VI | 模型方程 Model equation | R2 | RMSE |
|---|---|---|---|---|
| GF-1起身期 GF-1 Erecting stage | MSR | y = 5.4668x-2.6287 | 0.701 | 0.494 |
| y = 2.9635x2.6672 | 0.722 | 0.477 | ||
| y = 0.1309e3.1277x | 0.716 | 0.481 | ||
| y = 6.6008x2-5.0771x+1.4542 | 0.724 | 0.475 | ||
| GF-2起身期 GF-2 Erecting stage | NDVI | y = 12.4782x-2.5336 | 0.765 | 0.437 |
| y = 17.8705x2.2060 | 0.745 | 0.455 | ||
| y = 0.2349e5.6859x | 0.722 | 0.477 | ||
| y = -11.7369x2+21.1498x-4.0829 | 0.768 | 0.435 | ||
| GF-1拔节期 GF-1 Jointing stage | GNDVI | y = 8.7911x+0.4153 | 0.761 | 0.553 |
| y = 9.1945x0.9409 | 0.759 | 0.555 | ||
| y = 2.2386e1.5225x | 0.774 | 0.537 | ||
| y = 17.5354x2-13.1548x+7.0072 | 0.783 | 0.527 | ||
| GF-1开花期 GF-1 Flowering stage | EVI | y = 3.1677x+0.6820 | 0.766 | 0.379 |
| y = 3.7582x0.9018 | 0.767 | 0.378 | ||
| y = 2.8333e0.4510x | 0.766 | 0.379 | ||
| y = -0.1721x2+3.8568x+0.0010 | 0.766 | 0.379 |
新窗口打开|下载CSV
2.4 LAI多变量估算模型
从建模数据集中, 根据与LAI的灰色关联度顺序选取GF-1/2影像宽波段植被指数作为自变量, LAI值作为因变量, 建立反演冬小麦LAI的PLSR模型(表5), 筛选出建模效果最佳的宽波段植被指数组合, 并对模型进行比较分析。Table 5
表5
表5基于GF-1/2影像宽波段植被指数的LAI多变量估算模型
Table 5
| 生育期 Growth stage | 模型方程 Model equation | R2 | RMSE |
|---|---|---|---|
| GF-1起身期 GF-1 Erecting stage | LAI=2.0666×MSR+2.4609×EVI2+5.8022×OSAVI-4.2774 | 0.751 | 0.451 |
| GF-2起身期 GF-2 Erecting stage | LAI=6.8168×NDVI+3.1975×MSR+1.5024×SAVI-3.0187 | 0.809 | 0.395 |
| GF-1拔节期 GF-1 Jointing stage | LAI=2.4087×GNDVI+2.0794×NDVI+1.6322×SAVI+0.1967×GSR +0.7757 | 0.760 | 0.554 |
| GF-1开花期 GF-1 Flowering stage | LAI=1.2643×EVI+0.2265×GSR+4.2343×NDVI+0.0108 | 0.783 | 0.365 |
新窗口打开|下载CSV
冬小麦起身期内, 根据与LAI的灰色关联度最高的前3个GF-1植被指数(MSR、EVI2、OSAVI)和前3个GF-2植被指数(NDVI、MSR、SAVI)建立的PLSR模型的效果最佳, 与单变量估算模型相比R2有所增大, 分别达到了0.751、0.809, RMSE分别为0.451、0.395。
冬小麦拔节期内, 根据与LAI的灰色关联度最高的前4个GF-1植被指数(GNDVI、NDVI、SAVI、GSR)建立的PLSR模型的效果最佳, 与单变量估算模型相比R2有所减小, 减小到了0.760, RMSE增大到了0.554, 说明该PLSR模型的效果不如单变量二次多项式模型。
冬小麦开花期内, 根据与LAI的灰色关联度最高的前3个GF-1植被指数(EVI、GSR、NDVI)建立的PLSR模型的效果最佳, 与单变量估算模型相比R2有所增加, 增加到了0.783, RMSE减小到了0.365。
2.5 LAI反演模型精度验证
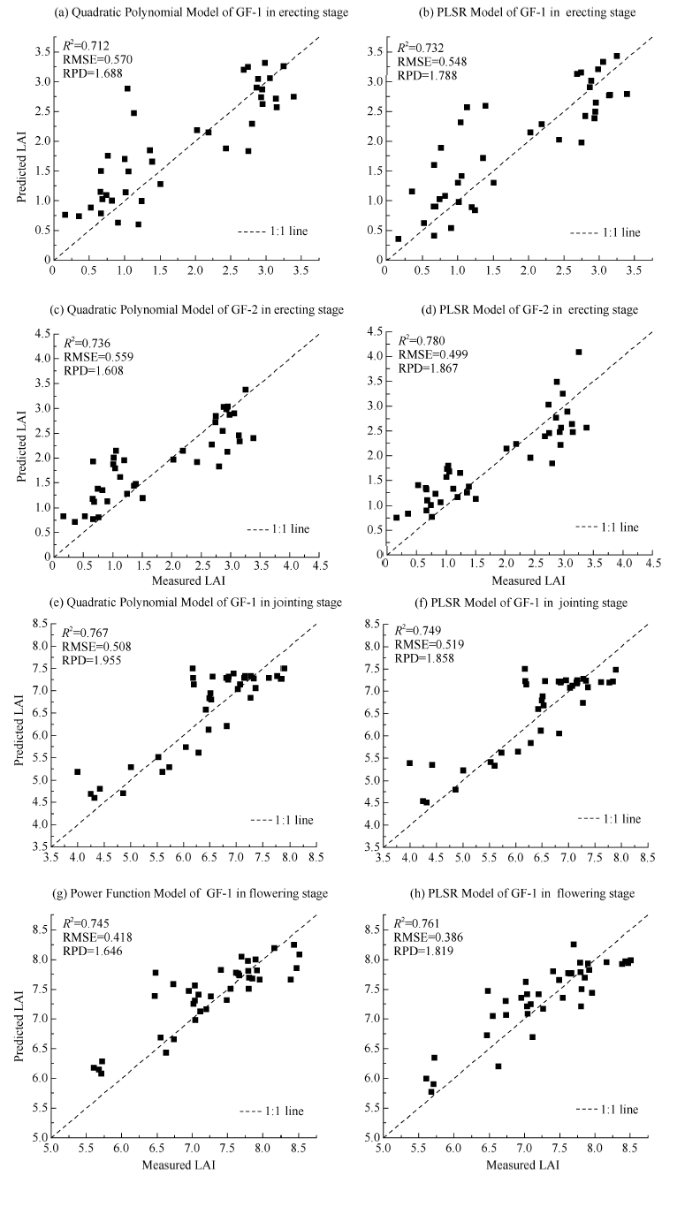
将验证数据集代入基于GF-1/2影像宽波段植被指数建立的最佳LAI估算模型中, 包括单变量模型和多变量模型, 对算得的LAI预测值与实测值进行线性拟合分析(图3), 利用R2、RMSE和RPD来验证各模型的预测精度。图3
 新窗口打开|下载原图ZIP|生成PPT
图3LAI实测值与预测值拟合分析图
Fig. 3Fitting analysis chart between measured and predicted values of LAI
图3中, (a)、(b)为对基于冬小麦起身期GF-1植被指数建立的二次多项式模型和最佳PLSR模型验证后LAI预测值与实测值间的拟合图, (c)、(d)为对基于冬小麦起身期GF-2植被指数建立的二次多项式模型和最佳PLSR模型验证后LAI预测值与实测值间的拟合图, (e)、(f)为对基于冬小麦拔节期GF-1植被指数建立的二次多项式模型和最佳PLSR模型验证后LAI预测值与实测值间的拟合图, (g)、(h)为对基于冬小麦开花期GF-1植被指数建立的幂函数模型和最佳PLSR模型验证后LAI预测值与实测值间的拟合图。
分析图3可知, 冬小麦起身期内, 根据GF-2植被指数建立的PLSR模型具有最高的R2、RPD和最低的RMSE, 分别为0.780、1.867和0.499, 预测精度最高, 说明该模型稳定性较好, 预测能力一般。
冬小麦拔节期内, 根据GF-1植被指数GNDVI建立的二次多项式模型具有最高的R2、RPD和最低的RMSE, 分别为0.767、1.955和0.508, 说明该模型具有较好的稳定性, 预测能力一般, 能较好地对冬小麦LAI进行预测。
冬小麦开花期内, 根据GF-1植被指数建立的PLSR模型具有最高的R2、RPD和最低的RMSE, 分别为0.761、1.819和0.386, 说明该模型的稳定性较好, 能较好地对冬小麦LAI进行预测。
冬小麦3个不同生育期内选择精度最高的模型反演LAI, 并制作LAI空间分布图, 如图4所示。图中, (a)、(b)、(c)分别为根据冬小麦起身期GF-2影像、拔节期和开花期GF-1影像反演的LAI空间分布图。从图中可以看出, 冬小麦起身期(a)估算的农田LAI值基本上小于4, 大于4的地方相对较少, 与实测的LAI值较接近; 冬小麦拔节期(b)估算的农田LAI值大部分在5.5~6.5之间, 部分区域超过了6.5, 与实测的LAI值基本一致; 冬小麦开花期(c)估算的农田LAI值大部分在6~8之间, 局部区域出现了大于8的情况, 与实测的LAI值基本吻合。
图4
 新窗口打开|下载原图ZIP|生成PPT
图4不同生育期LAI空间分布图
Fig. 4Spatial distribution map of LAI in different growth stages
3 讨论
已有不少研究利用遥感影像反演农作物生理参数, 然而借助我国高空间分辨率遥感卫星数据进行的相关研究还较少。本文为了利用国产遥感影像快速、大面积反演冬小麦LAI, 以GF-1/2影像作为数据源, 在区域尺度上获取新疆昌吉州奇台县高空间分辨率的冬小麦光谱信息, 构建17种植被指数, 结合地面田间同步实测的LAI数据, 分析不同空间分辨率的遥感影像在冬小麦不同生育期反演LAI的可行性, 结果发现不同空间分辨率、不同生育期对最佳植被指数的选择有一定的影响, 这与Mairaj等[10]的研究结果一致, 这说明在农作物生理参数定量反演中, 分生育期进行研究是有必要的。建模方法的选择对农作物生理参数的遥感定量反演的精度具有一定的影响, 定量比较评价不同模型的反演精度对农业遥感监测具有重要意义。本文利用四种单变量回归模型和PLSR多变量回归模型反演冬小麦不同生育期的LAI。近年来, 国内外****开始利用机器学习算法进行农作物生理参数的反演, 与应用较广泛的PLSR模型相比, 机器学习回归模型具有更佳的稳健性[34], Maitiniyazi等[35]利用极限学习机回归(ELR)方法提高了大豆LAI的反演精度, 此方法不仅能达到最小的训练误差、最小的权重范数, 保证ELR具有较好的泛化性能, 而且可以通过随机分配输入权重和隐藏层偏差来实现快速学习, 使得它更适合于实时培训[36,37], 因此, 需要进一步研究建模算法对农作物生理参数定量反演的影响。
叶面积指数的反演是比较复杂的过程, 可能受叶片水分、叶绿素含量、养分等其他参数的影响。束美艳等[38]利用高光谱数据构建新型红边抗水植被指数(red-edge resistance water vegetable index, RRWVI), 降低叶片水分对LAI的影响, 从而提高了反演冬小麦LAI的精度。本文暂未考虑其他因素的影响, 在今后的相关研究中有必要对LAI、叶片水分、叶片叶绿素进行相关分析, 消除它们对农作物冠层光谱的耦合影响, 进一步提高农作物 LAI的反演精度。此外, 不同生育期内, GF-1影像中获取的植被指数与LAI间的相关性有所差别。本文中, GF-1起身期中MSR与LAI间的相关性最佳, 可能是因为蓝光、红光和近红外波段的组合大大消除大气中气溶胶对植被指数的干扰; GF-1拔节期中, GNDVI与LAI间的相关性最佳, 可能是因为在拔节期冬小麦覆盖度增加, LAI出现较多中高值, 导致影像红波段反射率达到饱和状态, GNDVI将NDVI中的红波段用绿波段代替以后, 与LAI间的相关性有了较明显的提高。
近些年, 随着无人机遥感技术作为新型遥感技术的中坚力量异军突起, 受到农业工作者的青睐。相比于近地、航空以及卫星等传统遥感平台, 无人机遥感平台机动灵活、轻便主动、自动智能程度高, 更适用于农田环境[39], 可以携带多光谱和高光谱成像仪, 且具有更高的空间分辨率, 在农田尺度上监测农作物具备更大的潜力。我们将在今后的相关研究中进一步验证植被指数在无人机影像上的实际应用能力。
4 结论
冬小麦不同生育期对筛选LAI敏感植被指数有一定的影响, GF-1起身期、GF-1拔节期以及GF-1开花期中, MSR、GNDVI、EVI与LAI间的相关性最佳; 同一生育期不同空间分辨率影像中获取的植被指数对冬小麦LAI的响应有所区别, GF-2影像中提取的NDVI与LAI间的相关系数明显大于GF-1影像中提取的NDVI与LAI间的相关系数, GF-2影像中提取的植被指数中通过0.01显著性检验的只有9个, 明显少于GF-1影像, 可能是空间分辨率高而受到土壤等其他因素影响所致; 反演冬小麦LAI的单变量回归模型中, 不同生育期相比, 基于GF-1拔节期GNDVI建立的二次多项式回归模型效果最佳, 同一生育期相比, 基于GF-2起身期NDVI建立的二次多项式回归模型效果最佳, 多变量回归模型中, 不同生育期最佳植被指数组合有所区别, 基于GF-2起身期NDVI、MSR、SAVI组合建立的反演模型效果最佳。参考文献 原文顺序
文献年度倒序
文中引用次数倒序
被引期刊影响因子
[本文引用: 2]
[本文引用: 1]
[本文引用: 1]
DOI:10.1093/treephys/18.3.185URLPMID:12651388 [本文引用: 1]

Three definitions of leaf area index (LAI) in the literature have no predictable relationship with each other. Factors were derived for converting total LAI to projected LAI of horizontal leaves and to projected LAI for inclined leaves of lodgepole pine (Pinus contorta Dougl. var. latifolia Engelm.) and coastal Douglas-fir (Pseudotsuga menziesii (Mirb.) Franco) to allow comparison of results from different studies. An algorithm was derived to allow determination of these factors based on twig angles and the angles that the foliage subtends with the twig. Allowances were made for both the vertical and horizontal components of projection. The value of the factor for converting total LAI to projected LAI for inclined leaves was 0.229 + 0.0032 for lodgepole pine and 0.230 + 0.0037 for Douglas-fir. Sensitivity analysis established that this conversion factor was more sensitive to differences in vertical angles of the twigs than to twig rotation or foliar arrangement on the twig.
[本文引用: 1]
[本文引用: 1]
DOI:10.1016/j.rse.2008.08.017URL [本文引用: 1]
DOI:10.3864/j.issn.0578-1752.2012.17.004URL [本文引用: 1]
【目的】考虑到利用单一植被指数(VI)反演叶面积指数(LAI)时,存在着不同程度的饱和性和易受土壤背景影响的问题,提出通过分段的方式选择敏感植被指数形成最佳VI组合以提高LAI反演的精度。【方法】通过ACRM辐射传输模型模拟数据,结合地面实测光谱数据,选择常用的植被指数进行土壤敏感性分析以及饱和性分析确定LAI的分段点,并在此基础上分段选择最佳植被指数形成组合VI来实现LAI的最终反演,并利Landsat5 TM开展区域条件下冬小麦LAI反演应用。【结果】以LAI=3是较为适宜的分段点,利用植被指数最佳分段组合OSAVI(LAI≤3)+TGDVI(LAI>3)可在一定程度上有效克服土壤影响因素以及饱和性问题,联合反演的结果明确优于单一植被指数反演精度。【结论】通过分段选择最佳植被指数形成联合VI可以有效提高LAI反演精度。
URL [本文引用: 1]
叶面积指数(LAI,Leaf Area Index)是陆面过程中一个十分重要的输入参数,其遥感反演方法研究一直是国内外遥感应用研究的热点问题。基于统计的遥感反演方法由于缺乏物理基础,其可靠性和普适性差。基于物理的冠层反射模型的LAI反演方法克服了上述弊端,但是由于反演过程是病态的,模型反演结果一般不唯一。神经网络算法的介入可在一定程度上改善这一问题,但是模型反演的病态问题至今仍无法很好地解决。在PROSAIL模型敏感性分析的基础上提出了一种基于影像分类的神经网络反演方法,引进了土壤反射指数用于替代原模型中难以确定的土壤背景反射参数,分别针对不同植被类型建立各自的神经网络,对经过大气纠正后的Landsat ETM+影像进行了模拟实验并同野外实测LAI数据进行比较。结果表明,对于LAI小于3的植被区该方法的反演精度比较可靠,而LAI大于3的植被区,反演的LAI偏小,原因归结为密植被的冠层反射在LAI大于3以后趋于饱和而无法敏感地表征LAI的变化所导致的。
[本文引用: 1]
[本文引用: 1]
DOI:10.3390/rs6064764URL [本文引用: 1]
DOI:10.3389/fpls.2017.00820URLPMID:28588596 [本文引用: 2]
Hyperspectral reflectance derived vegetation indices (VIs) are used for non-destructive leaf area index (LAI) monitoring for precise and efficient N nutrition management. This study tested the hypothesis that there is potential for using various hyperspectral VIs for estimating LAI at different growth stages of rice under varying N rates. Hyperspectral reflectance and crop canopy LAI measurements were carried out over 2 years (2015 and 2016) in Meichuan, Hubei, China. Different N fertilization, 0, 45, 82, 127, 165, 210, 247, and 292 kg ha-1, were applied to generate various scales of VIs and LAI values. Regression models were used to perform quantitative analyses between spectral VIs and LAI measured under different phenological stages. In addition, the coefficient of determination and RMSE were employed to evaluate these models. Among the nine VIs, the ratio vegetation index, normalized difference vegetation index (NDVI), modified soil-adjusted vegetation index (MSAVI), modified triangular vegetation index (MTVI2) and exhibited strong and significant relationships with the LAI estimation at different phenological stages. The enhanced vegetation index performed moderately. However, the green normalized vegetation index and blue normalized vegetation index confirmed that there is potential for crop LAI estimation at early phenological stages; the soil-adjusted vegetation index and optimized soil-adjusted vegetation index were more related to the soil optical properties, which were predicted to be the least accurate for LAI estimation. The noise equivalent accounted for the sensitivity of the VIs and MSAVI, MTVI2, and NDVI for the LAI estimation at phenological stages. The results note that LAI at different crop phenological stages has a significant influence on the potential of hyperspectral derived VIs under different N management practices.
[本文引用: 1]
[本文引用: 1]
DOI:10.1016/j.rse.2009.06.007URL [本文引用: 1]
[本文引用: 1]
[本文引用: 1]
DOI:10.11834/jrs.20133035URL [本文引用: 1]
光学遥感是目前反演植被叶面积指数LAI(Leaf Area Index)的主要手段,但是当叶面积指数较大时存在光学遥感信息饱和、反演精度显著降低的问题。叶面积指数和平均叶倾角对光学、微波波段范围内反射和散射特性都有重要影响,主要表现在植被结构参数的变化可以引起冠层孔隙率和消光截面大小的改变。本文以典型农作物玉米为例,通过构建统一的PROSAIL和MIMICS模型输入参数,生成一套玉米全生长期光学二向反射率和全极化微波后向散射系数模拟库和冠层参数库。通过对模拟数据与LAI敏感性和相关性分析得出:(1)光学植被指数MNDVI(800 nm,2000 nm),在LAI为0―3时敏感,基于MNDVI与LAI的回归模型可以估算LAI变化 0.4的情况,RMSE是0.33,R2是0.958。(2)微波植被指数SARSRVI(1.4 GHz HH,9.6 GHz HV),在LAI为3―6时敏感,基于SARSRVI与LAI的回归模型可以估算LAI变化1的情况,RMSE为0.22,R2是0.9839。研究表明,采用分段敏感的植被指数,协同光学和微波遥感反演玉米全生长期叶面积指数是可行的。
[本文引用: 1]
[本文引用: 1]
[本文引用: 1]
[本文引用: 1]
[本文引用: 1]
DOI:10.1016/S0273-1177(97)01133-2URL
DOI:10.1016/j.rse.2003.12.013URL
DOI:10.1016/S0034-4257(02)00096-2URL
DOI:10.1016/j.rse.2008.06.006URL
DOI:10.2134/agronj2005.0200URL
DOI:10.1078/0176-1617-01176URLPMID:15022830
The Normalized Difference Vegetation Index (NDVI) is widely used for monitoring, analyzing, and mapping temporal and spatial distributions of physiological and biophysical characteristics of vegetation. It is well documented that the NDVI approaches saturation asymptotically under conditions of moderate-to-high aboveground biomass. While reflectance in the red region (rho(red)) exhibits a nearly flat response once the leaf area index (LAI) exceeds 2, the near infrared (NIR) reflectance (PNIR) continue to respond significantly to changes in moderate-to-high vegetation density (LAI from 2 to 6) in crops. However, this higher sensitivity of the rho(NIR) has little effect on NDVI values once the rho(NIR) exceeds 30%. In this paper a simple modification of the NDVI was proposed. The Wide Dynamic Range Vegetation Index, WDRVI = (a * rho(NIR-rho(red))/(a * rho(NIR) + rho(red)), where the weighting coefficient a has a value of 0.1-0.2, increases correlation with vegetation fraction by linearizing the relationship for typical wheat, soybean, and maize canopies. The sensitivity of the WDRVI to moderate-to-high LAI (between 2 and 6) was at least three times greater than that of the NDVI. By enhancing the dynamic range while using the same bands as the NDVI, the WDRVI enables a more robust characterization of crop physiological and phenological characteristics. Although this index needs further evaluation, the linear relationship with vegetation fraction and much higher sensitivity to change in LAI will be especially valuable for precision agriculture and monitoring vegetation status under conditions of moderate-to-high density. It is anticipated that the new index will complement the NDVI and other vegetation indices that are based on the red and NIR spectral bands.
DOI:10.1078/0176-1617-00887URLPMID:12749084
Leaf chlorophyll content provides valuable information about physiological status of plants. Reflectance measurement makes it possible to quickly and non-destructively assess, in situ, the chlorophyll content in leaves. Our objective was to investigate the spectral behavior of the relationship between reflectance and chlorophyll content and to develop a technique for non-destructive chlorophyll estimation in leaves with a wide range of pigment content and composition using reflectance in a few broad spectral bands. Spectral reflectance of maple, chestnut, wild vine and beech leaves in a wide range of pigment content and composition was investigated. It was shown that reciprocal reflectance (R lambda)-1 in the spectral range lambda from 520 to 550 nm and 695 to 705 nm related closely to the total chlorophyll content in leaves of all species. Subtraction of near infra-red reciprocal reflectance, (RNIR)-1, from (R lambda)-1 made index [(R lambda)(-1)-(RNIR)-1] linearly proportional to the total chlorophyll content in spectral ranges lambda from 525 to 555 nm and from 695 to 725 nm with coefficient of determination r2 > 0.94. To adjust for differences in leaf structure, the product of the latter index and NIR reflectance [(R lambda)(-1)-(RNIR)-1]*(RNIR) was used; this further increased the accuracy of the chlorophyll estimation in the range lambda from 520 to 585 nm and from 695 to 740 nm. Two independent data sets were used to validate the developed algorithms. The root mean square error of the chlorophyll prediction did not exceed 50 mumol/m2 in leaves with total chlorophyll ranged from 1 to 830 mumol/m2.
DOI:10.1016/j.fuproc.2016.06.018URL [本文引用: 1]
[本文引用: 1]
[本文引用: 1]
DOI:10.1016/j.isprsjprs.2017.10.011URL [本文引用: 1]
[本文引用: 1]
DOI:10.1109/TSMCB.2011.2168604URLPMID:21984515 [本文引用: 1]
Due to the simplicity of their implementations, least square support vector machine (LS-SVM) and proximal support vector machine (PSVM) have been widely used in binary classification applications. The conventional LS-SVM and PSVM cannot be used in regression and multiclass classification applications directly, although variants of LS-SVM and PSVM have been proposed to handle such cases. This paper shows that both LS-SVM and PSVM can be simplified further and a unified learning framework of LS-SVM, PSVM, and other regularization algorithms referred to extreme learning machine (ELM) can be built. ELM works for the "generalized" single-hidden-layer feedforward networks (SLFNs), but the hidden layer (or called feature mapping) in ELM need not be tuned. Such SLFNs include but are not limited to SVM, polynomial network, and the conventional feedforward neural networks. This paper shows the following: 1) ELM provides a unified learning platform with a widespread type of feature mappings and can be applied in regression and multiclass classification applications directly; 2) from the optimization method point of view, ELM has milder optimization constraints compared to LS-SVM and PSVM; 3) in theory, compared to ELM, LS-SVM and PSVM achieve suboptimal solutions and require higher computational complexity; and 4) in theory, ELM can approximate any target continuous function and classify any disjoint regions. As verified by the simulation results, ELM tends to have better scalability and achieve similar (for regression and binary class cases) or much better (for multiclass cases) generalization performance at much faster learning speed (up to thousands times) than traditional SVM and LS-SVM.
[本文引用: 1]
[本文引用: 1]
[本文引用: 1]
[本文引用: 1]
