Spatiotemporal characteristics of water requirement and agricultural drought during summer maize season in Huaihe River Basin
GAO Chao1, LI Xue-Wen2, SUN Yan-Wei1, ZHOU Ting3, LUO Gang1, CHEN Cai1第一联系人:
收稿日期:2018-01-21接受日期:2018-08-20网络出版日期:2018-09-17
| 基金资助: |
Received:2018-01-21Accepted:2018-08-20Online:2018-09-17
| Fund supported: |

摘要
关键词:
Abstract
Keywords:
PDF (10111KB)元数据多维度评价相关文章导出EndNote|Ris|Bibtex收藏本文
本文引用格式
高超, 李学文, 孙艳伟, 周婷, 罗纲, 陈财. 淮河流域夏玉米生育阶段需水量及农业干旱时空特征[J]. 作物学报, 2019, 45(2): 297-309. doi:10.3724/SP.J.1006.2019.83010
GAO Chao, LI Xue-Wen, SUN Yan-Wei, ZHOU Ting, LUO Gang, CHEN Cai.
干旱作为一种发生频繁、持续时间长、影响范围广的气象灾害, 已对各国人民生活、经济发展和农业生产等造成严重影响, 是人类面临的一个重大环境问题[1,2,3]。干旱频率和强度受气候变化影响, IPCC AR5报道全球气候变暖仍将继续[4], 此背景下, 干旱仍有加重的趋势。
农业干旱由作物水分供需不平衡引起, 致灾原因是降水持续异常缺乏, 受气候、作物本身、土壤性质和人类活动等多方面因素影响[5]。目前, 针对农业干旱的研究, 被广泛关注, 主要从以下方面开展工作: 1) 探讨不同农业干旱评估指标的地区适用性, 选择合适的区域干旱评价指标[6,7,8]; 2) 分析农业干旱的时空演变规律及作物生育期水分亏缺状况, 主要是基于气候倾向率、小波分析、Mann-Kendall (M-K)突变检验等统计方法和GIS空间分析技术[9,10]; 3) 厘清农业干旱指数与作物产量的定量关系, 揭示不同程度干旱可能导致作物的减产情况[11,12]; 4) 计算农业干旱发生频率和平均干旱强度, 构建作物干旱风险模型, 探讨农业风险度的时空特征[13,14]; 5) 联合农业干旱指数和概率分布函数, 估算作物各生育阶段干旱发生的概率[15,16]。
淮河流域是我国重要的粮食生产区, 夏玉米作为主要秋粮, 生长季干旱频发, 严重影响其生长发育和产量形成, 造成农业经济损失[17]。因此研究淮河流域夏玉米生育期干旱时空特征和发生规律, 明确夏玉米各生育阶段需水状况和不同程度干旱发生概率, 有利于当地夏玉米的高产稳产。目前, 针对农业干旱气象类的评估指标较多, 大致分两大类[18]: 1) 以标准化降水指数为代表的降水类指标, 此类指标涉及参数较少, 数据获取较易, 可快速评估旱情, 但无法直接体现农作物遭受干旱影响的程度; 2) 以作物水分亏缺指数(Crop Water Deficit Index, CWDI)为代表的基于水分供需变化类指标, 此类指标从作物生长环境出发, 考虑农田湿润状况, 可更真实地表征农业干旱。CWDI是我国气象行业标准“北方夏玉米干旱等级(QX/T 260-2015)”中规定的两种夏玉米干旱评价指标之一[19]。
本文以淮河流域110个气象站点1961—2015年气象资料为基础, 以CWDI为农业干旱评判指标, 分析淮河流域夏玉米生育期干旱时空演变规律, 并联合四大类33种分布函数, 分析夏玉米生育期不同等级干旱发生概率的空间分布特征, 可为淮河流域夏玉米生产合理布局和防灾减灾等工作提供参考依据。
1 研究区概况
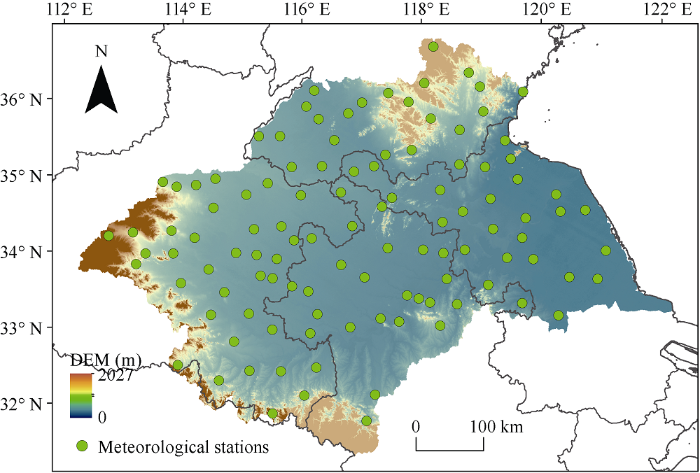
淮河流域位于我国东部, 北纬30°55'~36°36', 东经111°55'~121°25', 总面积约27万平方千米, 主要跨4个省份(图1), 地处南北气候过渡带, 年均降水量在880 mm左右, 但各地区降水年际差异较大, 多年平均气温在11~16℃范围内[20]。淮河流域作为重要的粮食生产地, 耕地面积约13.33万平方千米, 其中夏玉米作为主要秋粮, 是食品和工业的原料之一, 处于当地农业经济发展中的重要位置[21]。1949年至今, 区内多次发生严重干旱, 干旱年份水资源供需矛盾突出, 对农业生产带来极大影响, 是农业干旱研究的典型区域[22]。图1
 新窗口打开|下载原图ZIP|生成PPT
图1淮河流域数字高程模型(DEM)及气象站点位置
Fig. 1Meteorological stations and Digital Elevation Model (DEM) in Huaihe River Basin
2 数据与方法
2.1 数据来源
淮河流域110个地面气象站点1961—2015年日尺度气象资料由中国气象局国家气象信息中心(http://www.nmic.cn/)提供, 主要包括降水量、气温(平均、最低、最高)、日照时数、平均风速和平均相对湿度等, 对以上数据进行异常值检验、缺测值替换和均一化等处理; 研究区DEM为90 m分辨率的SRTM数据, 来自地理空间数据云网站(http://www. gscloud.cn/)。2.2 研究方法
2.2.1 夏玉米主要生育时段划分 按照我国气象行业标准“北方夏玉米干旱等级(QX/T 260-2015)”中的规定, 将淮河流域夏玉米全生育期划分成5个生育阶段, 研究区内不同区域夏玉米实际发育期的进程可能略有差异, 但夏玉米的耕作制度基本一致, 参考相关文献确定各生育阶段的历年平均日期[8,16], 即每年6月1至10日为播种—出苗期, 6月11至7月10日为出苗—拔节期, 7月11至31日为拔节—抽雄期, 8月1至31日为抽雄—乳熟期和9月1至20日的乳熟—成熟期。2.2.2 作物水分亏缺指数计算 CWDI是被用来表示夏玉米水分亏缺程度的常用指标, 通过某一时段内作物需水量和自然供水量之差占同期需水量的比值计算。在本研究区内, 夏玉米生长过程中, 水分供应以自然降水为主, 因此, 以夏玉米潜在蒸散量作为需水量指标, 降水为供水指标, 计算夏玉米生育期CWDI[8]。
式中, CWDI是夏玉米生育阶段水分亏缺指数(单位: %)[19]; ICWDS,j是夏玉米生育阶段内第j旬的累计水分亏缺指数(单位: %), 计算方法见公式(2); n为某生育阶段内旬数。
相关研究表明, 夏玉米水分亏缺具有累计效应, 对后期生长发育有影响。
式中, ICWDS,j为第j旬累计水分亏缺指数(单位: %); ICWD,j为第j旬的水分亏缺指数(单位: %), 计算方法见公式(3); ICWD,j-1、ICWD,j-2和ICWD,j-3分别为该旬之前三旬的水分亏缺指数(单位: %); 根据研究区实际情况, 并参考相关文献, 确定权重系数a、b、c、d分别为0.35、0.30、0.20和0.15[23]。
式中, ETC,j为夏玉米某旬累计需水量(单位: mm); Pj为累计降水量; ETk为夏玉米的需水量基数, 参考相关文献确定[24]; Kj为夏玉米某旬降水量远大于需水量时的水分盈余系数, 计算方法详见公式(4)。
式中, 当旬降水量在ETk~1.5ETk之间时, 盈余效果较好; 当旬降水量在1.5ETk~2.5ETk时, 盈余效果较差; 当旬降水量大于2.5ETk时, 多余降水量转化成径流流失, 水分盈余状态较为稳定。
式中, ET0,j是夏玉米某旬参考蒸散量(单位: mm), 通过联合国粮食与农业组织(Food and Agriculture Organization of the United Nations, FAO)建议的Penman-Monteith (P-M)公式计算[25], 见公式(6); KTC为夏玉米作物系数, 借鉴相关研究中淮河流域部分站点夏玉米作物系数的实测结果确定[26]。
式中, ET0表示参考作物蒸散量(单位: mm d-1); Rn为地表净辐射(单位: MJ m-2); ?为饱和水汽压曲线斜率(单位: kPa ℃-1); T为日平均温度(单位: ℃); U2为2 m高处风速(单位: m s-1); es为饱和水汽压(单位: kPa); eu为实际水汽压(单位: kPa); γ为干湿表常数(单位: kPa ℃-1)。
2.2.3 Mann-Kendall (M-K)趋势检验 采用M-K趋势检验方法对淮河流域夏玉米生育期内的需水量和CWDI进行趋势检验, 显著性水平为0.001、0.01、0.05和0.1时, 分别对应M-K统计变量(Z)的绝对值为3.29、2.58、1.96和1.645[27]。
2.2.4 最优概率分布模型 着重探讨淮河流域夏玉米各生育阶段CWDI序列所遵从的最优分布函数, 并基于最优分布函数探讨夏玉米各生育阶段不同等级干旱发生的概率。为更好地选取最优分布函数, 选取四大类33种分布函数拟合夏玉米各生育阶段的CWDI序列, 四大类为有界概率分布函数、无界概率分布函数、非负概率分布函数和广义分布函数(见表1), 同时选取Kolmogorov-Smirnov (K-S)和Anderson-Darling (A-D)两种拟合优度检验方法确定CWDI序列的最优分布, 其中最优参数估计基于极大似然法。选取的标准是K-S和A-D检验下均需通过95%水平的显著性检验, 然后计算两种检验值的累积和, 并将累积和最小的函数作为最优概率分布函数。本文中样本的序列长度为55, 假设显著性为α=0.05水平时, K-S和A-D临界值分别是0.18338和2.5018。
Table 1
表1
表1四大类概率分布函数
Table 1
| 有界概率分布函数 Bounded probability distribution function | 无界概率分布函数 Unbounded probability distribution function | 非负概率分布函数 Non-negative probability distribution function | 广义分布函数 Generalized distribution function |
|---|---|---|---|
| Beta | Cauchy | Chi-Squared | Gen.Extreme Value |
| Pert | Error Function | Erlang | Gen.Logistic |
| Power Function | Gumbel Max | Exponential | Gen.Pareto |
| Triangular | Gumbel Min | Fatigue Life | Phased Bi-Exponential |
| Uniform | Laplace | Gamma | Phased Bi-Weibull |
| Logistic | log-Logistic | Wakeby | |
| Normal | Lognormal | ||
| Student’s t | Pareto | ||
| Rayleigh | |||
| Weibull |
新窗口打开|下载CSV
3 结果与分析
3.1 需水量变化特征
淮河流域近55年夏玉米全生育期及各生育阶段需水量空间分布特征如图2, 全生育期主要呈现流域中北部较高而西南部和东部较低的空间特征, 全生育期多年平均需水量在481~573 mm范围内, 均值约534 mm。播种—出苗期和出苗—拔节期需水量空间分布特征基本一致, 均呈现流域中部和西北部较高而沿淮河干流南侧和淮河下游地区较低的分布特征, 播种—出苗期多年平均需水量在23~39 mm之间, 均值约34 mm, 出苗—拔节期在85~137 mm之间, 均值约118 mm; 随着生育期的推进, 拔节—抽雄期和抽雄—乳熟期, 流域夏玉米需水量各地区差异较小, 但东部和西南部相对偏小, 拔节—抽雄期多年平均需水量在103~125 mm之间, 均值约117 mm, 抽雄—乳熟期在190~210 mm范围, 均值约200 mm; 乳熟—成熟期, 夏玉米需水量空间差异明显, 沂沭泗地区较高, 而西南部和东南部地区较低, 多年平均需水量在60~69 mm范围, 均值约64 mm。图2
 新窗口打开|下载原图ZIP|生成PPT
图21961-2015年夏玉米生育期需水量和Mean-Kendall (M-K)趋势变化的空间特征
Fig. 2Spatial characteristics of summer maize water requirement and Mean-Kendall (M-K) trend in 1961-2015
淮河流域近55年夏玉米全生育期及各生育阶段内各站点需水量变化趋势分布特征如图2所示。图2-a表明, 夏玉米全生育期年需水量的变化趋势, 约93%的站点呈下降趋势, 其中约65%的站点通过0.001显著水平检验。图2-b表明, 播种—出苗期需水量变化趋势空间分布特征, 各站点均呈现减少趋势, 其中约57%的站点通过0.001显著性水平检验; 图2-c表明, 出苗—拔节期, 约91%的站点呈下降趋势, 其中约20%的站点通过0.001显著水平检验; 图2-d表明, 拔节—抽雄期有86%的站点呈下降趋势, 其中约35%的站点通过0.01及以上水平显著性检验; 图2-e表明, 抽雄—乳熟期, 约97%的站点呈现下降趋势, 其中约73%的站点通过0.01及以上水平的显著性水平检验; 图2-f表明, 乳熟—成熟期, 约74%的站点呈减少的趋势, 其中约19%的站点通过0.1及以上水平的显著性检验。综上, 淮河流域1961—2015年夏玉米生育期需水量呈较明显的下降趋势。
3.2 作物水分亏缺指数变化特征
淮河流域近55年夏玉米生育期CWDI空间分布格局如图3所示。播种—出苗期和出苗—拔节期CWDI空间特征基本一致, 均呈现流域西南部和东南部较低而北部较高的特征, 播种—出苗期年均CWDI在-4%~60%范围, 均值约41%, 出苗—拔节期在-10%~52%范围, 均值约27%; 拔节—抽雄期, 空间特征差异明显, 流域西北部较高而其余地区较低, 年均CWDI为-17%~32%, 均值约1%; 抽雄—乳熟期, 淮河流域中上游地区较高而沂沭泗地区和淮河下游地区较低, 年均CWDI为-8%~33%, 均值约13%; 拔节—抽雄期至乳熟—成熟期空间特征主要表现在淮河中上游地区南部区域的变化, 随着生育期的推进, 由南部低于北部的特征转变成南北部大致相同的特征, 乳熟—成熟期年均CWDI为2%~39%, 均值约26%。另外, 淮河下游地区CWDI在夏玉米生育期中均处于较低水平的特征, 夏玉米生长前期水分亏缺最严重, 生长中期亏缺程较低, 随生育期推进, 水分亏缺程度又趋于严重。图3
 新窗口打开|下载原图ZIP|生成PPT
图31961-2015年夏玉米生育期CWDI和Mean-Kendall (M-K)趋势变化空间特征
Fig. 3Spatial characteristics of CWDI and Mean-Kendall (M-K) trend in summer maize growth period 1961-2015
淮河流域近55年夏玉米生育期水分亏缺指数变化趋势分布情况如图3所示。图3-a表明, 播种—出苗期水分亏缺指数变化趋势, 约96%的站点呈减少趋势, 但其中仅约11%的站点通过0.1及以上水平的显著性检验; 图3-b表明, 出苗—拔节期, 约85%的站点呈减少趋势, 其中仅约9%的站点通过0.1及以上水平的显著性检验; 图3-c表明, 拔节—抽雄期, 约49%的站点呈减少的趋势, 但其中无站点通过显著性检验, 呈增加趋势的站点中约9%的站点通过显著性水平检验; 图3-d表明, 抽雄—乳熟期, 52%的站点呈减少趋势, 但仅约4%的站点通过显著性水平; 图3-e表明, 乳熟—成熟期, 61%的站点呈减少趋势, 但仅3%的站点呈减少趋势。综上, 淮河流域近55年夏玉米生育期CWDI变化趋势不明显, 以波动变化为主。
3.3 最优概率分布模型
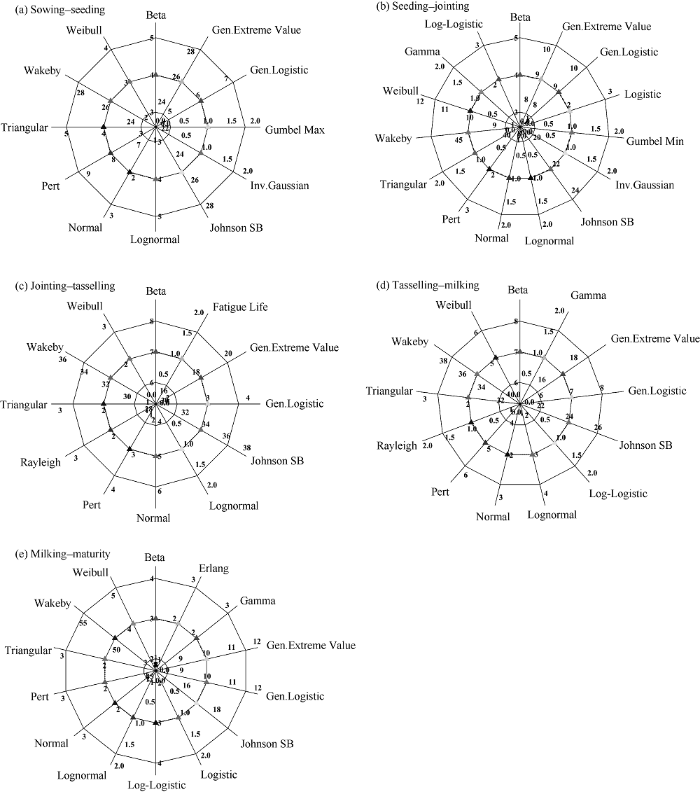
如图4所示, 夏玉米5个生育阶段CWDI序列的最优分布均包含多种函数, 四大类函数均有涉及, 整体上Wakeby、Gen.Extreme Value和Johnson SB函数可作为较多站点CWDI序列的最优拟合模型, 其中, 播种—出苗期、出苗—拔节期、拔节—抽雄期、抽雄—乳熟期和乳熟—成熟期, 分别包括26、44、32、35和51个站点CWDI序列分布的最优拟合是Wakeby函数。图4
 新窗口打开|下载原图ZIP|生成PPT
图4淮河流域110个站点夏玉米生育期水分亏缺指数的最优概率分布函数
Fig. 4Optimal probability distribution function of water deficit index for each growth stage of summer maize at 110 stations in Huaihe River Basin
3.4 夏玉米生育期干旱发生概率空间特征
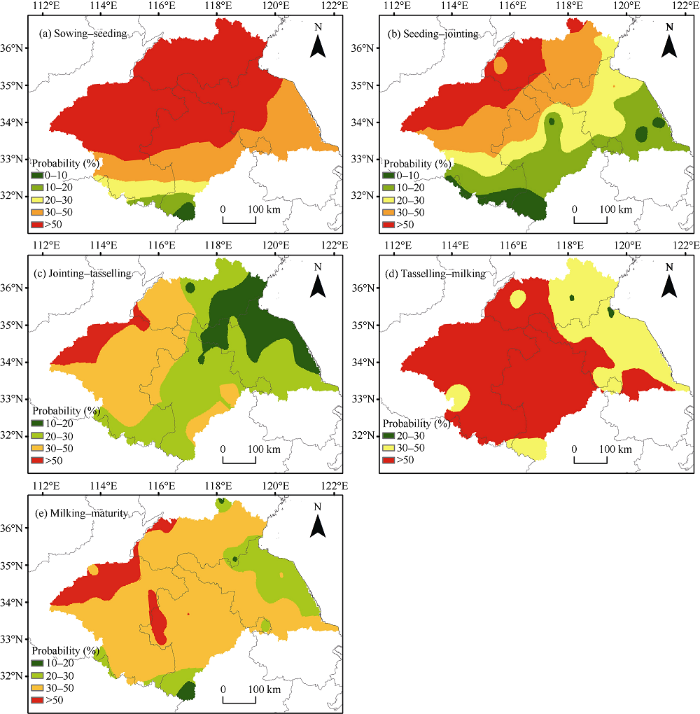
图5给出淮河流域近55年夏玉米各生育阶段发生干旱概率的空间分布特征。图5-a表明, 播种—出苗期干旱发生的概率, 大部分地区在50%以上, 淮河干流以南地区概率较小; 图5-b表明, 出苗—拔节期, 干旱概率大小呈现出纬向分布特征, 南部沿淮河干流地区概率在10%~20%之间, 西北部地区概率高于50%; 图5-c表明, 拔节—抽雄期, 干旱概率在50%以上的地区主要在流域西北部, 河南省淮河流域大部地区概率主要在30%~50%之间, 安徽省淮河流域概率主要在20%~30%之间, 流域东部地区概率相对较小, 在10%以下; 图5-d表明, 抽雄—乳熟期, 夏玉米干旱概率较高, 研究区大部分地区干旱概率在50%以上, 淮河下游地区和沂沭泗地区干旱概率在30%~50%之间; 图5-e表明, 乳熟—成熟期, 研究区大部分地区干旱概率在30%~50%之间, 西北部部分地区干旱概率在50%以上。综上, 淮河流域夏玉米播种—出苗期和抽雄—乳熟期发生干旱概率较高, 且存在西北部干旱概率高于东南部的分布特征。图5
 新窗口打开|下载原图ZIP|生成PPT
图5夏玉米生育阶段干旱发生概率空间特征
Fig. 5Spatial distribution of drought probability for each growth stage of summer maize
3.5 夏玉米生育期不同等级干旱发生概率空间特征
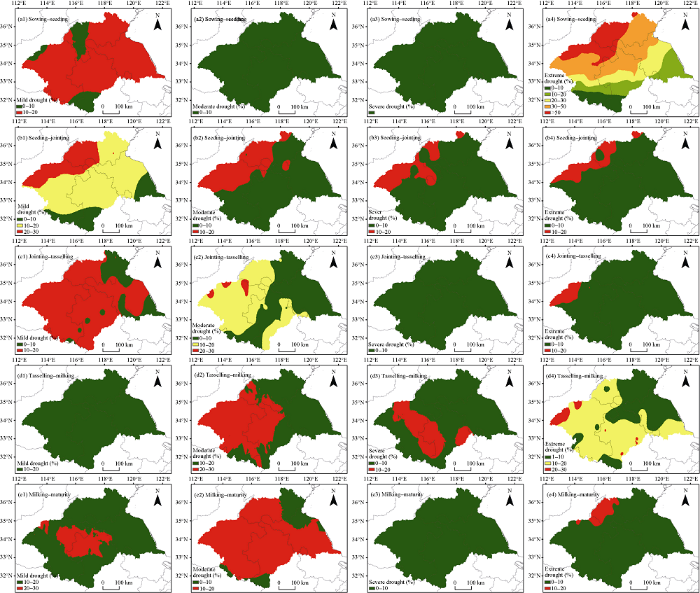
图6给出淮河流域近55年夏玉米各生育阶段不同等级干旱发生概率的空间分布特征。图6-a1~a4表明, 播种—出苗期, 轻旱概率大部地区在10%~ 20%之间, 中旱和重旱概率均在10%以下, 特旱概率较高, 空间上呈纬向分布特征, 北部地区在50%以上, 中部大部分地区30%~50%, 西南部和东南部干旱概率相对较低; 图6-b1~b4表明, 出苗—拔节期, 流域大部分地区轻旱概率10%~20%, 西北部在20%~30%之间, 中旱、重旱和特旱概率的空间分布基本一致, 均是大部地区在0~10%之间, 西北部在10%~20%之间; 图6-c1~c4表明, 拔节—抽雄期, 轻旱概率基本在10%~20%范围, 中旱在中西部概率为10%~20%, 中东部在0~10%之间, 重旱和特旱概率基本都在10%以下; 图6-d1~d4表明, 抽雄—乳熟期, 轻旱概率基本在10%~20%之间, 中旱概率基本在10%~30%之间, 重旱概率大都在0~10%之间, 部分地区超过20%, 特旱, 淮河中上游地区基本在10%~20%之间, 淮河下游和沂沭泗河地区基本在0~10%之间; 图6-e1~e4表明, 乳熟—成熟期, 轻旱概率大部分地区在10%~20%之间, 中部较高, 处于20%~30%范围, 中旱概率基本在10%~20%之间, 重旱和特旱概率基本处于10%以内。图6
 新窗口打开|下载原图ZIP|生成PPT
图6夏玉米生育阶段不同等级干旱发生概率的空间分布
Fig. 6Spatial distribution of probability for each grade of drought at each growth stage of summer maize
4 讨论
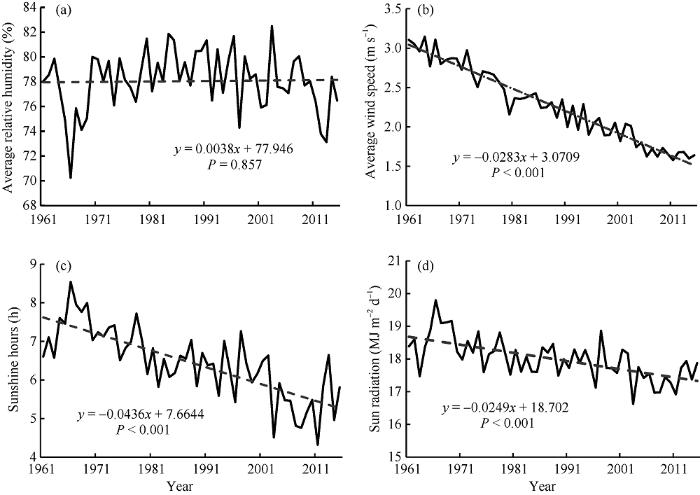
淮河流域是重要的夏玉米生产区, 已有****分别基于全生育期和需水关键期对淮河流域夏玉米需水量变化特征进行分析[17,21], 但夏玉米不同生育阶段对需水量要求不同, 不同阶段缺水程度对产量形成的影响也有区别[28], 同时从本文研究结果看, 各生育阶段需水量空间上地区差异明显。IPCC第五次评估中相关结论表明, 全球气候变暖仍在继续, 近50年来, 淮河流域气温也呈显著上升趋势[29]。气温升高理应导致作物需水量的增加, 但淮河流域夏玉米生育期需水量呈现出显著下降趋势, 参考杨晓琳等的研究结果[30], 夏玉米需水量的变化还与平均相对湿度、平均风速、日照时数和太阳辐射等气象因子相关。利用线性趋势方法[31]探讨淮河流域夏玉米生育期平均相对湿度等气象要素的变化趋势。如图7所示, 淮河流域1961—2015年夏玉米生育期平均风速、日照时数和太阳辐射3个气象要素均呈显著下降趋势, 通过0.05水平的显著性检验, 但平均相对湿度无明显变化特征, 因此, 近55年淮河流域夏玉米生育期需水量呈显著下降趋势主要受平均风速、日照时数和太阳辐射3个气象要素变化的影响。图7
 新窗口打开|下载原图ZIP|生成PPT
图7夏玉米生育期平均相对湿度(a)、平均风速(b)、日照时数(c)和太阳辐射(d)时间变化
图中黑色曲线为逐年气象要素变化, 虚线为线性趋势。
Fig. 7Temporal changes of average relative humidity (a), mean wind speed (b), sunshine hours (c), and solar radiation (d) of summer maize growth period
The black curve shows meteorological changed year by year; the dotted shows the liner trend.
薛昌颖等[16]估算夏玉米生育期干旱发生概率是基于水分亏缺指数服从正态分布或转换成服从正态分布, 但本文研究结果表明夏玉米生育期水分亏缺指数序列多数不服从正态分布, 基于正态分布或转换成正态分布确定的各生育阶段干旱发生概率, 误差较大, 不确定性高, 而本文利用33种分布函数拟合夏玉米生育期水分亏缺指数序列, 得到最优拟合模型, 再确定出干旱发生概率, 可信度更高。根据本文得到的结果, 淮河流域夏玉米生长过程中, 播种—出苗期和抽雄—乳熟期干旱发生概率最大, 大部分地区高于50%, 期间发生的干旱分别称为“初夏旱”和“卡脖旱”, 其中抽雄—乳熟期为该区夏玉米产量形成的关键期[32], 因此十分有必要防御淮河流域夏玉米生长过程中“卡脖旱”发生, 以确保夏玉米的高产稳产。
本文选用在黄淮海地区具有较好适用性的作物水分亏缺指数进行夏玉米生育期干旱特征的研究, 与其他气象指数相比, 该指数基于作物水分供需平衡, 总体考虑作物本身、土壤和气象因子三方面因素的影响, 对农业干旱的累计效应也有较好的体现[33], 能很好反映夏玉米生育期的干旱状况。但由于农业干旱机理的复杂程度, 还受下垫面条件、耕作制度、人类活动和作物品种类型等因素的影响, 且不同干旱指标都具有一定的时间和空间尺度的限制[34], 因此仍需综合考虑多种因素并结合新技术对其深入研究。
本文在淮河流域夏玉米生育期时段划分上, 参考相关文献设定了统一的发育日期[16], 但淮河流域地理跨度较大, 境内地理气候多样, 可能导致不同区域夏玉米的实际生育期进程有差异, 因此, 仍需综合考虑气候地理条件、种植品种和收获产量等因素, 结合夏玉米生育期记录资料, 进行夏玉米农业气候分区[21], 再分别确定各区内夏玉米实际生育日期。另外, 淮河流域内三大粮食作物分别是夏玉米、冬小麦和一季稻, 本文仅探讨了夏玉米生育期需水量及干旱时空特征, 为保障淮河流域内粮食总产量的提升, 下一步将分别以冬小麦和一季稻为研究对象开展相关工作。
5 结论
近55年来, 夏玉米需水量全生育期多年平均值约534 mm, 全生育期、播种—出苗期、出苗—拔节期和乳熟—成熟期空间分布特征基本一致, 大致呈现流域中北部较高而西南部和东南部较低的空间分布; 拔节—抽雄期主要呈现东部比其他地区低的分布特征; 抽雄—乳熟期呈现出流域蚌埠闸以上地区和淮河下游相对较低的空间特征。夏玉米全生育期和各生育阶段需水量均呈显著下降趋势。除拔节—抽雄期外, 夏玉米其余生育阶段水分亏缺均较为严重。各生育阶段中, 播种—出苗期和抽雄—乳熟期干旱发生概率较大, 大部分地区大于50%。除播种—出苗期的特旱概率在30%~50%之间, 各生育阶段不同等级干旱概率均大致在20%以内。参考文献 原文顺序
文献年度倒序
文中引用次数倒序
被引期刊影响因子
DOI:10.11849/zrzyxb.2015.09.011URL [本文引用: 1]

甘肃河东玉米种植区属于旱作雨养农业区,农作物生长主要依靠自然降水来维持,春夏干旱是影响该区玉米生长发育的关键因素。利用河东地区13个气象站点1957—2012年气象资料,基于标准化降水蒸散指数从干旱趋势、周期、空间特征及其与环流因子关系方面探讨近56 a来河东玉米种植区春夏干旱演变特征。结果表明:近56 a河东玉米种植区春夏两季均呈干旱化趋势,并自20世纪90年代中期以后,干旱呈加重趋势。干旱变化共经历了3个气候阶段,20世纪80年代之前,春夏旱情较轻;80年代—90年代,夏旱较春旱严重;2000年以后,春旱较夏旱严重。干旱周期变化,春夏干旱周期分别为20 a和14 a,干旱周期性变化主要是受太阳黑子活动影响。春夏干旱发生频率在突变前后差异显著,低频区在突变后转为高频区,易旱区呈扩大状态。ENSO事件是影响该区春夏干旱发生的主要环流因子,尤其对夏旱影响最为显著。近20 a来ENSO事件增强是该区干旱事件不断加重的原因,ENSO暖事件爆发时,该区春夏趋于干旱,由湿向干转变;ENSO冷事件爆发,干旱则有所缓解,由干向湿转变。
DOI:10.11849/zrzyxb.2015.09.011URL [本文引用: 1]
甘肃河东玉米种植区属于旱作雨养农业区,农作物生长主要依靠自然降水来维持,春夏干旱是影响该区玉米生长发育的关键因素。利用河东地区13个气象站点1957—2012年气象资料,基于标准化降水蒸散指数从干旱趋势、周期、空间特征及其与环流因子关系方面探讨近56 a来河东玉米种植区春夏干旱演变特征。结果表明:近56 a河东玉米种植区春夏两季均呈干旱化趋势,并自20世纪90年代中期以后,干旱呈加重趋势。干旱变化共经历了3个气候阶段,20世纪80年代之前,春夏旱情较轻;80年代—90年代,夏旱较春旱严重;2000年以后,春旱较夏旱严重。干旱周期变化,春夏干旱周期分别为20 a和14 a,干旱周期性变化主要是受太阳黑子活动影响。春夏干旱发生频率在突变前后差异显著,低频区在突变后转为高频区,易旱区呈扩大状态。ENSO事件是影响该区春夏干旱发生的主要环流因子,尤其对夏旱影响最为显著。近20 a来ENSO事件增强是该区干旱事件不断加重的原因,ENSO暖事件爆发时,该区春夏趋于干旱,由湿向干转变;ENSO冷事件爆发,干旱则有所缓解,由干向湿转变。
DOI:10.1016/j.mcm.2009.10.031URL [本文引用: 1]
Regarded as a near real time drought monitoring method, the VTCI index based on remote sensing data is applied to the drought forecasting in the Guanzhong Plain. ARIMA models are used in the VTCI series, and forecast its changes in the future. A new way of modeling for the spatio-temporal series is used in the VTCI series. The time series of 36 pixels are studied firstly for their fitting models. Then the ARIMA model fitting for the whole area is determined. The AR(1) model are chosen to be the best model used in each pixel of the whole area, and the forecast is done with 1 2 steps. The results show that forecasting accuracy is better, 1 step is better than 2 steps. The historical VTCI data are simulated by AR(1) models. Comparing the simulating data with the historical data, the results show that the simulating accuracy is better. Most of the simulating errors are small. All results demonstrate that AR(1) model developed for VTCI series can be used for the drought forecasting in the Guanzhong Plain.
DOI:10.1016/j.jhydrol.2015.01.006URL [本文引用: 1]
Decision makers have continuously asked for better tools and resources to help them assess their risks related to climate variability and extremes. Drought is one of the risks they face, and the need for better drought risk tools and resources has also been expressed. With drought continuing to be one of the most problematic and costly natural disasters within the United States, and building on the work of the original National Drought Atlas (NDA) (1996), an updated and expanded Drought Risk Atlas (DRA) decision support tool for the United States was developed and is housed at the National Drought Mitigation Center. The DRA (1) providesweeklycalculations of multiple indices/indicators, with more than a billion records made freely available, including the SPI, SPEI, PDSI, scPDSI, Deciles and U.S. Drought Monitor; (2) houses more than 3000 stations with data through 2012, nearly tripling the station count of the original NDA; (3) utilizes a much longer period of record, nearly double that of the NDA in most cases; (4) when fully completed, will house a cache of more than 500,000 gridded drought index maps; (5) will allow us to analyze and assess trends and various characteristics of drought, including frequency, intensity, duration and magnitude; (6) will become a resource for the National Weather Service (NWS) personnel around the country by transferring the application into the field through integration within the NWS newly developed Local Climate Analysis Tool (LCAT); and (7) work directly with the National Integrated Drought Information System (NIDIS) program office to include the information contained in the DRA into NIDIS regional drought early warning system pilot basins and the U.S. Drought Portal for broad dissemination to the user community and general public.
DOI:10.3969/j.issn.1673-1719.2014.01.001URL [本文引用: 1]
IPCC第五次评估报告(AR5)第一工作组(WGI)报告的亮点结论,是过去7年全世界气候变化科学研究成果凝练出来的精华。20世纪50年代以来全球气候变暖的一半以上是人类括动造成的。1971年以来人为排放温室气体产生热量的93%进入了海洋,海洋还吸收了大约30%人为排放的CO_2,导致海表水pH值下降了0.1,等等。采用全球耦合模式比较计划第五阶段(CMIP5)的模式,预估未来全球气候变暖仍将持续,21世纪末全球平均地表温度在1986—2005年的基础上将升高0.3~4.8℃。限制气候变化需要大幅度持续减少温室气体排放。如果将1861一1880年以来的人为CO_2累积排放控制在1000 GtC,那么人类有超过66%的可能性把未来升温幅度控制在2℃以内(相对于1861一1880年)。
[本文引用: 1]
[本文引用: 1]
DOI:10.11820/dlkxjz.2010.05.007URL [本文引用: 1]
The analysis of agricultural drought risk is not only the prerequisite of drought risk management, but also the theoretical basis of risk division and of the damages, and it has become a new research focus in recent years. The connotation, the constituent elements, the analysis system, and the study status of agricultural drought disaster were described in this paper. On this basis, this paper pointed out that, from the agricultural drought hazard and vulnerability point of view, the systematic establishment of a comprehensive drought risk analysis framework, especially the development of dynamic mathematical models and index system for each risk factor, is the research priority in the study of temporal and spatial patterns of agricultural drought risk.
DOI:10.3321/j.issn:1007-7588.2008.03.008URL [本文引用: 1]
提出了一个农业旱涝气象指标一一累积湿润指数。该指标以相对湿润度指数为基础,通过确定不同区域综合农田作物系数对参考作物蒸散量进行订正,并考虑前期旱涝程度对当前旱涝状况的累积影响,从而具有农业意义。用土壤墒情指标对该指标进行分区域旬旱涝等级的确定和检验,其定量符合率为60%-70%,定性符合率为80%.90%。利用该指标分析近30年江淮地区农业旱涝时空变化的结果表明,从多年平均意义上江淮地区农田水分状况能满足作物需求,湿润程度湿润区高于半湿润区。农业旱涝年际变化大,变异率北部大于南部。北部旱涝并存,春旱、夏秋和秋冬连旱频率高,夏季洪涝严重;南部总体湿润,以涝居多,但夏秋干旱频发。在气候变化导致江淮地区降水格局发生变化的条件下,近年来北部夏季洪涝,南部夏秋旱问题突出,值得关注。
DOI:10.3969/j.issn.1002-6819.2014.16.020URLMagsci [本文引用: 3]
干旱是影响黄淮海地区夏玉米产量稳定性的主要农业气象灾害。建立夏玉米干旱灾害指标,开展夏玉米干旱灾害的监测及评估,对农业防灾减灾意义重大。该文根据夏玉米生长发育过程,选择土壤相对湿度和作物水分亏缺指数分别建立夏玉米不同生育阶段的干旱等级指标。首先在综合分析有关夏玉米土壤水分指标研究成果的基础上,确定了夏玉米各生育阶段不同干旱等级的土壤相对湿度指标。在此基础上,利用河南省农业气象观测站多年观测资料,建立水分亏缺指数与土壤相对湿度之间的关系模型,利用已确定的土壤相对湿度指标计算得出夏玉米不同生育阶段不同干旱等级的水分亏缺指数干旱指标。根据土壤相对湿度指标,夏玉米播种-出苗、出苗-拔节、拔节-抽雄、抽雄-乳熟和乳熟-成熟5个生育阶段发生轻旱的临界值分别为65%、60%、70%、75%和70%,发生重旱的临界值分别为45%、40%、50%、55%和50%,发生特旱的临界值分别为40%、35%、45%、50%和45%;而根据水分亏缺指数指标,5个生育阶段发生轻旱的水分亏缺指数的临界值分别为35%、40%、20%、10%和35%,发生重旱水分亏缺指数临界值分别为50%、65%、55%、45%和65%,发生特旱的临界值分别为55%、75%、65%、55%和75%。在黄淮海夏玉米区选择代表站点对确定的干旱等级指标进行了验证,土壤相对湿度和水分亏缺指数判定的干旱等级相同及相差一个等级的百分率变化在71%~91%,表明2套指标对干旱发生情况的判别具有较好的一致性;通过与历史典型干旱年份灾情对比,2套指标能够较好的判定出历史年份夏玉米生长季干旱发生情况,能够用于夏玉米干旱的监测、评估等方面的科研及业务服务中。
DOI:10.7606/j.issn.1000-7601.2015.05.41URL [本文引用: 1]
以陕西1961—2010近50 a 22个站点的逐日气象数据为基础资料,计算其冬小麦生育期各旬需水量(ETi)以及作物缺水指数(CWDI),并根据农业干旱等级计算出研究区干旱频率,分析陕西冬小麦各生育期内干旱指数时空分布特征。结果表明:陕西冬小麦各生育期干旱频率为拔节抽穗期>灌浆成熟期>返青期>冬前生长期>越冬期;冬小麦重旱以上频率的空间分布由北向南逐渐减少;冬小麦干旱指数的年代际变化呈上升趋势,20世纪70年代和90年代干旱指数较高,1968年为突变年份。
DOI:10.7606/j.issn.1000-7601.2015.05.41URL [本文引用: 1]
以陕西1961—2010近50 a 22个站点的逐日气象数据为基础资料,计算其冬小麦生育期各旬需水量(ETi)以及作物缺水指数(CWDI),并根据农业干旱等级计算出研究区干旱频率,分析陕西冬小麦各生育期内干旱指数时空分布特征。结果表明:陕西冬小麦各生育期干旱频率为拔节抽穗期>灌浆成熟期>返青期>冬前生长期>越冬期;冬小麦重旱以上频率的空间分布由北向南逐渐减少;冬小麦干旱指数的年代际变化呈上升趋势,20世纪70年代和90年代干旱指数较高,1968年为突变年份。
DOI:10.3969/j.issn.1002-6819.2012.12.017URLMagsci [本文引用: 1]
分析近50?a东北玉米生育阶段的水分供需及旱涝变化,可以为防灾减灾对策的制定提供理论依据。该文基于东北地区48个农业气象观测站1961-2010年逐日气象资料、近20多年玉米生育期资料及近10?a农业灾情多元数据,利用作物系数法计算4个生育阶段的需水量,揭示东北玉米4个生育阶段水分供需的时空规律;以作物水分盈亏指数为评价指标,分析近50?a东北玉米不同生育阶段的旱涝分布及演变。结果表明:东北玉米4个生育阶段及全生育期的需水量没有显著变化;乳熟-成熟阶段,有显著的干旱化趋势,其它3个阶段和全生育期没有明显的旱涝变化。4个生育阶段需水量空间差异较大,基本呈带状分布。播种-七叶期,中旱及以上、中涝及以上灾害频率较低;后3个生育阶段,中旱及以上、中涝及以上灾害频率较高,且全域、区域旱涝现象呈明显的年代际变化特征,从20世纪80年代起全域、区域中旱及以上、中涝及以上次数明显增加。
DOI:10.11841/j.issn.1007-4333.2013.05.05URL [本文引用: 1]
Drought is one of the costliest weather related natural hazards in North China Plain (NCP).This study was conducted to quantify the influence of drought on grain yield variability using drought indices.Detailed crop and weather data were collected from Beijing,providing a typical region of winter wheat-summer maize rotation system in NCP.The data collected from 1962 to 2011 provided 50 years of data,which were used to compute the SPI and the SPEI drought indices at different time scales from 1 to 24 months.(a) The SPEI and SPI showed large differences in the evolution and identification of drought conditions during the last five decades,positive temperature anomalies were the most important cause of the aforementioned differences.(b) Drought indices more strongly correlated with yield variability during the last two decades.Regression of maize climatic yield as the dependent variable and the 3-month August SPI/SPEI as the independent variable explained up to 60.0% and 60.1% of yield variability in a curvilinear relationship,respectively.Optimum SPI/SPEI values were in the range of-0.8 to 3.2 and-0.9 to 2.1.(c) Furthermore,winter wheat climatic yield and 24-month SPI/SPEI were a linear relationship,SPI-5 and the SPEI-5 drought indices explained 51.8% to 51.2% (<0.01) of the variation in wheat yield.These results implied that SPI and SPEI provided the accurate assessment of drought impacts on grain yield of the NCP.(d) Based on these results it would be possible to generate preliminary estimates of drought impacts on winter wheat yield by preseason with some confidence.This could be very useful in regard to providing farmers with early warning information to plan irrigation management and prepare for potential drought conditions.In conclusion,the SPI and the SPEI showed excellent capability to identify drought impacts.The impacts of drought on grain yield were much greater,yet decreased precipitation is still the key factor in yield losses.This study identified an increase in drought severity associated with higher water demand as a result of evapotranspiration.Future researches in NCP should be focused on the drought indices based on precipitation and potential evapotranspiration,as they could reflect the better role played by global warming on drought severity,and provide more accurate assessment of drought impacts on yield variability.
DOI:10.7519/j.issn.1000-0526.2015.07.012URL [本文引用: 1]
Based on the meteorological data and the winter wheat yield data of 78 weather stations in Anhui Province from 1971 to 2010, the spatiotemporal variation of the water budget during the whole growth period and critical period of winter wheat (from booting to milk ripening stages) in Anhui Province was analyzed using the water budget index. The occurrence of droughts and floods and its impact on the winter wheat yield was also analyzed using the water budget index as the drought flood indicator. The results showed that the water budget index during the whole growth period and critical period of the winter wheat presents zonal distribution and decreases from south to north. The water deficit occurs significantly in the area north to Hefei and the water supply is adequate in the southern part of the Yangtze Huaihe Area and the region south to this area, with large water surplus in south and small in north. On the whole, the water shortage degree is greater in the critical period than in the whole growth period. The change trend of the water budget index is not significant during the past 40 years. However, the interannual variation of the water budget index is obvious due to the large variation coefficient of the precipitation, increasing the risk of droughts and floods. The drought occurs mainly in the area along Huaihe River and the part north to the river. The frequency of waterlogging is higher in the Yangtze Huaihe Area and the region south. The average yield reduction rates of the winter wheat due to the drought and the flood are 4.2% and 12.4%, respectively. There is a significantly positive (negative) correlation between water budget index and relative meteorological yield in typical drought (flood) year of winter wheat. The medium drought risk of winter wheat is greater in north area than in south area, and the medium waterlogging risk is greater in south area. It is necessary to minimize the planting of the winter wheat in the south area where water is more because the yield loss caused by the waterlogging is greater than the drought.
DOI:10.11755/j.issn.1006-7639(2016)-05-0852URL [本文引用: 1]
利用1981—2010年河南省118站夏玉米生长季(6月中旬—9月下旬)逐日降水量、日照时数、最高最低气温、平均风速、平均水汽压等气象资料,通过交叉验证确定较优的克里金插值方法,进行基于百米网格的空间要素插值。对插值后的数据进行空间运算,计算各生育阶段夏玉米水分亏缺量,建立全生育阶段干旱危险性指标;以基于遥感反演的夏玉米种植面积作为暴露性指标;以多年平均减产率作为脆弱性指标;以近6 a社会经济条件构建综合抗灾能力指标;在此基础上综合各项风险要素建立干旱综合风险评估模型。最后,利用风险评估模型结合土地利用信息进行河南省夏玉米干旱综合风险精细化区划,把河南全省划分为高、中、低3个风险区,低风险区主要位于豫东和豫东南,高风险区主要分布在周口、驻马店及豫西北地区,其它地区为中度风险区,与历史夏季旱灾发生频次的空间分布趋势基本一致。区划结果充分考虑夏玉米种植面积和土地利用信息,具有较高的精度,可为夏玉米干旱灾害防御提供参考依据。
URL [本文引用: 1]
利用四川省135个气象台站1961~2014年逐日气象资料和29个农业气象观测站的小麦观测资料,选取水分盈亏指数作为干旱评估指标,分析了54年来四川小麦7大种植区不同生育期的各级干旱时空变化特征及其风险分布情况。结果表明:小麦各生育期发生干旱站均次数以川西南山地最多,其多年平均值达0.9以上,可谓十年九旱。各区干旱站均次数的时间变化趋势不明显。生育阶段以孕穗-抽穗期发生干旱频率较高,其次是拔节-孕穗期,最低的是抽穗-乳熟期。从干旱频率空间分布特征来看,川西南山地是发生轻旱频率最高的地区,川西高原中旱和重旱的发生频率要高于其它各区,盆地各区域中只有盆中和盆西部分区域发生干旱频率相对较高。小麦干旱风险分布情况为川西南山地以及川西高原的南部区域是干旱高风险区,大部分区域可达极重风险,盆地以盆中为干旱风险高发区。
URL [本文引用: 1]
利用四川省盆地区玉米产量资料、生育期资料和相关气象资料,建立了适用于四川省盆地区玉米干旱风险评估的气候干旱风险模型、作物干旱风险模型、产量灾损风险模型、抗灾性能模型和相应的指标体系,并构建了四川省盆地区玉米旱灾综合风险评估模型,确定了综合风险区划指标.结果表明:四川省盆地区玉米各项风险评估指标具有明显的区域差异和一定的连片性;玉米旱灾综合风险评价指标,可将四川省盆地区玉米种植区划分为高、中、低3个风险区,其中,风险高值区主要集中在盆西北大部、盆中及盆南部分地区,风险中值区主要分布在盆北及盆南部分地区,风险低值区主要分布在盆东北、盆西南及盆东南部分地区.
URL [本文引用: 1]
利用四川省盆地区玉米产量资料、生育期资料和相关气象资料,建立了适用于四川省盆地区玉米干旱风险评估的气候干旱风险模型、作物干旱风险模型、产量灾损风险模型、抗灾性能模型和相应的指标体系,并构建了四川省盆地区玉米旱灾综合风险评估模型,确定了综合风险区划指标.结果表明:四川省盆地区玉米各项风险评估指标具有明显的区域差异和一定的连片性;玉米旱灾综合风险评价指标,可将四川省盆地区玉米种植区划分为高、中、低3个风险区,其中,风险高值区主要集中在盆西北大部、盆中及盆南部分地区,风险中值区主要分布在盆北及盆南部分地区,风险低值区主要分布在盆东北、盆西南及盆东南部分地区.
URL [本文引用: 4]
干旱是制约黄淮海地区夏玉米产量稳定的主要农业气象灾害,明确粮食主产区农业干旱发生的演变规律,对于采取有效的防灾减灾对策意义重大。基于作物水分亏缺指数和夏玉米干旱等级指标,分析了黄淮海地区近40a夏玉米生长季干旱的时空变化规律。结果表明:夏玉米各生育阶段间比较,播种-出苗期水分亏缺指数和干旱发生概率最大。除播种-出苗期外,随着干旱等级的升高,干旱发生概率逐渐降低,但播种-出苗期则以特旱等级发生概率最大;各阶段水分亏缺指数无明显的时间变化趋势,但年际间波动较大,特别是夏玉米生长中后期,1997年是近40a干旱发生最为严重的年份,不仅干旱持续时间长,且发生范围也最大;水分亏缺指数空间分布范围在年代际间存在“缩小-增大-缩小”的变化规律,从各年代干旱等级及其分布范围看,1991-2000年干旱最严重,2001-2010年有所减轻。夏玉米各阶段水分亏缺指数及各等级干旱发生概率基本呈现为由东南向西北逐渐增大的变化趋势,河北大部、河南西部和北部以及山东的中西部地区是各阶段干旱概率的高值区。由于年际间的波动在增大,黄淮海地区夏玉米生长中后期极端干旱灾害发生的可能性较大,北部及西部地区更是干旱灾害的高发区,生产中仍需加强对干旱灾害的预测预报及防御工作。
[本文引用: 2]
In order to analyze the water surplus deficit index for the summer corn’s key period in the Huaihe Basin, and provide the scientific guidance for the government strategy and farmers’ field management and agricultural production. Based on meteorology data from 121 sites from 1971 to 2010 in the Huaihe Basin, the crop water requirement and effective precipitation of the summer corn’s key period were calculated. The characteristic of water surplus and deficit was analyzed by water surplus deficit index. The results showed that the water requirement of summer corn’s key period showed an obvious downward trend, the descending rate of south was higher than north of the Huaihe Basin. While the descending rate of plain was higher than mountainous area. In space, the mean value of water requirement of summer corn’s key period showed an obvious latitudinal distribution, and it increased from north to south. The precipitation of summer corn’s key period had the tendency of increase, but not significant, and the mean value of precipitation in the south part of Huaihe Basin was more than that in the north, and more in the mountainous than in the plain. The effective precipitation had the same space distribution characteristics with the precipitation in corn-growing regions. The average water surplus deficit index for summer corn’s key period of each region showed a water deficit, but the tendency of yearly variation was increase. The space distribution characteristic of the mean value water surplus deficit showed an increasing trend from southwest to northeast. The water deficit was serious in the northern plain area. In this paper, we only analyzed water surplus characteristics for the summer corn’s key period, and the influence of pre precipitation was not considered. The results were preliminary, and the water surplus characteristics of summer corn require in-depth analysis in the future.
DOI:10.11820/dlkxjz.2011.07.015URL [本文引用: 1]
在各种自然灾害中,干旱是发生范围最广、频率最高、灾情和影响最严重的灾害。近年来,随着自然灾害损失的加剧,减灾工作得到各国政府前所未有的重视,各国科技工作者开始了包括干旱在内的自然灾害的评估工作。本文旨在把握干旱灾害评估的研究现状,力求对干旱灾害评估各个方面的研究做出较全面的总结和评价,以期达到促进中国干旱灾害评估研究进一步深化的目的。文章从干旱指标、干旱评估理论、干旱评估方法以及干旱评估类型等方面对国内外的研究进展进行了较全面的分析,分析表明,现有干旱评估研究多侧重于农业干旱和区域单品种干旱灾情的特征研究,缺乏从系统的角度综合研究干旱对生态环境、社会经济效应等区域灾害系统的模拟研究,干旱评估模型结果不能反映干旱带来的系统影响。未来的干旱评估研究要更多地应用新技术和新方法,不断向多学科、综合研究方向发展。
[本文引用: 2]
[本文引用: 2]
URL [本文引用: 1]
统计研究区域4个小麦种植亚区的冬小麦全生育期、冬前生长期、越冬期、返青-抽穗期、灌浆-成熟期的水分亏缺率,并对其时空分布特征进行分析。结果表明,近39 a来,淮河流域冬小麦水分亏缺率的空间分布受气候、地形等多种因素影响,具有明显的地域特点:由北向南逐步递减,呈纬向分布;冬小麦水分亏缺率的年际变化趋势虽然不明显,但各区域水分条件最好和最差的生长时段并存于同一年代中;4个冬小麦种植亚区中以淮河流域北部平原冬麦区和东北丘陵冬麦区在冬小麦生长发育中、后期,特别是灌浆-成熟的关键时期,水分亏缺严重,对产量形成有很大影响。
URL [本文引用: 1]
统计研究区域4个小麦种植亚区的冬小麦全生育期、冬前生长期、越冬期、返青-抽穗期、灌浆-成熟期的水分亏缺率,并对其时空分布特征进行分析。结果表明,近39 a来,淮河流域冬小麦水分亏缺率的空间分布受气候、地形等多种因素影响,具有明显的地域特点:由北向南逐步递减,呈纬向分布;冬小麦水分亏缺率的年际变化趋势虽然不明显,但各区域水分条件最好和最差的生长时段并存于同一年代中;4个冬小麦种植亚区中以淮河流域北部平原冬麦区和东北丘陵冬麦区在冬小麦生长发育中、后期,特别是灌浆-成熟的关键时期,水分亏缺严重,对产量形成有很大影响。
URL [本文引用: 3]
利用淮河流域171个站点1971年-2010年的气象资料及作物历年生育期资料,通过作物全生育期的需水量和有效降水量计算了主要作物全生育期的水分盈亏指数。结果表明:①淮河流域小麦种植区全生育期水分盈亏指数分区平均值在-0.66~-0.43之间,各分区均呈现水分亏缺,但多年变化趋势不明显,空间分布呈明显的纬向分布特征,越往北水分亏缺越明显;②玉米种植区全生育期水分盈亏指数分区平均值在0.05~0.17之间,各区多年变化均呈增加趋势,其中北部平原夏玉米区和中部平原夏玉米区增加趋势通过了α=0.05显著性检验,分别达到0.099/10a和0.097/10a,空间分布呈西北-东南分布特征,由西北向东南增大;③沿淮及以南一季稻区水分盈亏指数平均为0.05,呈现0.024/10a的增加趋势,空间分布呈中间小两头大的分布特征。
URL [本文引用: 1]
Based on the daily precipitation from 110 stations in the Huaihe River Basin during 1959 2008, the crop damage area due to drought and flood disasters from 1978 to 2008, the hazard factor from precipitation, the extent of damage for crops, and the spatial-temporal characteristics of disasters are analyzed. The thresholds of drought and flood disasters are calculated and the relationships between the thresholds of drought and flood disasters and the crop damage area are established. The result shows that first, the thresholds of drought and flood disasters can be calculated using the ratio of the cumulative event precipitation to the mean cumulative precipitation of 1959 2008. The ratio can well reflect the severity of flood and drought disasters of varying degrees, and can meet the requirements for analyzing flood and drought events in the study area. Second, the drought and flood disasters quantified by the calculated thresholds can reflect all degrees of drought and flood disasters and the affected areas. The thresholds and the affected areas have similar variation tendency. In particular, the threshold of drought disaster and the crop damage area are highly correlated as revealed by the high value of correlation coefficient (0.96). Thus, a model for forecasting the crop damage area is developed based on the threshold of drought disaster.
DOI:10.3969/j.issn.1002-6819.2009.08.006URLMagsci [本文引用: 1]
季节性干旱是影响湖南春玉米生产最突出的气象灾害,分析其时空分布特征和发生的规律,可为湖南春玉米生产的发展和合理布局提供技术支持。该文基于湖南省96个气象站点1961-2007年地面气象观测资料,采用FAO于1998年推荐的Penman-Monteith 方法计算了参考作物蒸散量、玉米的作物需水量。考虑盈余降水对水分亏缺指数的影响,修正了的水分亏缺指数计算方法,并依据玉米的水分亏缺指数,分析了季节性干旱发生频率的时空特征。并选取不同区域典型站点分析了水分亏缺指数年代际变化特征。结果表明,湖南春玉米生长季节内干旱呈现明显的季节性和空间区域分布特征:干旱频率较高的时段主要在玉米抽雄-吐丝阶段及其后的生育阶段,且随生育期后移干旱频率明显增加,以轻旱程度为主。空间分布特征是以湘中南的衡阳及周边一带干旱频率最高,其次为湘东、湘北一带次高,湘西等地春玉米干旱频率低。各年代之间比较,以20世纪80年代干旱较严重,90年代干旱相对较轻。
DOI:10.11755/j.issn.1006-7639(2014)-02-0163URL [本文引用: 1]
利用安徽省夏玉米主产区37个气象站点1961~2010年的气象资料,选取修订后的作物水分亏缺指数作为表征夏玉米干旱的指标,分析了安徽省夏玉米生长季内干旱频率的时空分布特征及表征干旱风险大小的干旱风险度的时空特征。结果表明:近50 a安徽省夏玉米不同发育阶段水分亏缺指数未发生显著变化,但夏玉米成熟后期的干旱现象有加重趋势;抽雄开花期是干旱频率及干旱风险较高的时段;从空间分布特征看,干旱频率与干旱风险度的空间分布特征相似,夏玉米营养生长阶段二者的高值区在淮北北部,而在夏玉米生长中后期,干旱主要发生在沿淮西部和江淮南部。整个生长季内,沿淮淮北西部是干旱高发和高风险区。
DOI:10.3724/SP.J.1006.2017.01536URL [本文引用: 1]
利用湖北省低丘平原区8个长期基准气象台站35年(1980—2014)气象资料,对湖北省不同区域春玉米、夏玉米及秋玉米的需水量、旱涝发生频率及其年际变化趋势进行了分析。结果表明玉米各生育阶段需水量区域间差异较小,而不同种植季玉米间差异较大。秋玉米需水量显著低于春玉米和夏玉米,春玉米需水量与夏玉米相近,且三季玉米的需水量随年份呈显著下降趋势,尤其是以鄂中地区需水量下降最多,平均达?18.62mm(10a)–1。鄂北、鄂中及鄂东南区域三季玉米播种?拔节阶段均以发生涝灾为主,其中重涝发生频率较高;鄂北及鄂中地区三季玉米拔节?完熟期主要以发生轻度干旱为主,尤其是灌浆期间旱灾发生频率较高;在鄂东南春玉米与夏玉米拔节?吐丝期间涝灾发生频率要高于旱灾,灌浆期间三季玉米均以旱灾较多,尤其是夏玉米与秋玉米旱灾要重于春玉米。各地区三季玉米不同生育时期旱涝年际变化趋势不显著。从降低旱涝胁迫风险考虑,建议鄂北地区主要发展夏玉米、鄂中及鄂东南地区主要发展春玉米,适当控制秋玉米面积;三季玉米拔节前均要注意防涝,拔节后注意防旱。
DOI:10.3321/j.issn:0559-9350.2004.01.004URL [本文引用: 1]
考虑土壤水分调控所产生的作物生长滞后效应与补偿生长效应,对节水灌溉条件下作物蒸发蒸腾量ETc的理论计算模型进行了研究.根据灌溉试验资料,确定了冬小麦、夏玉米、棉花及水稻作物的作物系数Kc,得出节水灌溉条件下主要农作物土壤水分修正系数Ks的计算公式.覆膜旱作节水灌溉模式的水稻需水量计算实例结果显示,计算值与实测值较为吻合,模型具有较高的精度.
DOI:10.3321/j.issn:0559-9350.2004.01.004URL [本文引用: 1]
考虑土壤水分调控所产生的作物生长滞后效应与补偿生长效应,对节水灌溉条件下作物蒸发蒸腾量ETc的理论计算模型进行了研究.根据灌溉试验资料,确定了冬小麦、夏玉米、棉花及水稻作物的作物系数Kc,得出节水灌溉条件下主要农作物土壤水分修正系数Ks的计算公式.覆膜旱作节水灌溉模式的水稻需水量计算实例结果显示,计算值与实测值较为吻合,模型具有较高的精度.
[本文引用: 1]
[本文引用: 1]
DOI:10.3969/j.issn.1002-6819.2015.z1.016URLMagsci [本文引用: 1]
作物有效降水量和需水量是科学确定灌溉时期与灌溉量的重要依据。该研究基于1961-2010年四川盆地104个气象台站的地面气象资料和1981-2010年17个农业气象观测站的玉米生育期资料,采用联合国粮食及农业组织(FAO)推荐的参考作物蒸散量和降水量的比率法计算了研究区域内玉米全生育期及不同生育阶段的有效降水量,采用参考作物蒸散量法结合单作物系数法计算了相应时段的需水量,并探讨了玉米不同生育阶段缺水量和水分盈亏指数的变化。结果表明:近50年来,除乳熟到成熟期外,玉米全生育期及播种到乳熟期的有效降水量总体呈下降趋势;全生育期和各生育阶段的需水量均呈减少趋势;除播种到拔节期外,全生育期和拔节到成熟期的缺水量以下降趋势为主。比较各区域典型地区玉米水分盈亏状况,盆地北部玉米水分亏缺程度最严重,而盆地西部最轻;比较玉米各个生育阶段的水分满足情况,播种到拔节阶段水分亏缺程度最严重。研究可为四川盆地玉米种植区的农业用水以及合理灌溉提供科学依据。
DOI:10.3969/2012jms.0061URL [本文引用: 1]
Using the observed data from 170 meteorological stations in the area of Huaihe River Basin, we analyzed the changing trend of temperature and precipitation in Huaihe River Basin from 1961 to 2008. The results show that during the 48 a, the average temperature had a significant increasing trend in Huaihe River Basin, the average temperature in winter had the largest increment while the average temperature in spring and autumn had the second largest increment. The extreme low temperature over one year also had an increasing trend, but its frequency decreased significantly. The extreme high temperature in the west part of the basin had a significant decreasing trend and its frequency decreased over the year as well. The trend of the variance of the overall precipitation had not yet been tested, but started from the 1990s, the precipitation during autumn had a decreasing trend, but after 2000 the precipitation had been increasing significantly, as well as the precipitation during summer. The precipitation days during spring and autumn had a decreasing trend, while they did not change too much during winter and summer.
URL [本文引用: 1]
Information of crop water requirement and its temporal and spatial change are important for irrigation scheduling,water resources planning and future decision-making.Based on the observed daily meteorological data in 1960 2009 of 50 normal meteorological codes in Huang-huai-hai farming region,the water requirements and irrigations of summer corn and spring corn were calculated by SIMETAW model.The results showed that water requirements of summer corn and spring corn are 321.70 and 456.70 mm respectively,which showed a significant downtrend in the past 50 years and the rainfall coupling degrees of summer corn and spring corn were 0.78 and 0.72 respectively.Compared with irrigations of summer corn,irrigations of spring corn had a significant downtrend and had significant differences in different regions,which showed a significant uptrend in the south of Shaanxi and Shanxi provinces;The downtrend of corn water requirement in Huang-huai-hai farming region mainly attributed to the reduction of solar radiation,which was also affected by other climatic factors.Wind speed,precipitation had negative correlations with the water requirements of summer corn and spring corn,while other climatic factors had positive effects.
DOI:10.11849/zrzyxb.20160459URL [本文引用: 1]
基于安徽省80个气象站的月值气温观测数据,采用线性倾向率、Mann-Kendall突变检验、小波分析和R/S分析等数理统计方法,研究多时间尺度下的气温变化特征。结果表明:1)近55 a安徽省气候呈现明显的暖化趋势,年均气温及春、秋、冬季气温均呈明显上升趋势,其中春季升温幅度最显著,年平均气温在20世纪90年代波动幅度最大;2)年平均气温在1996年发生了突变,与突变前相比,突变后的平均气温增加了0.82℃,年平均气温发生了较大的变化,增暖趋势显著;3)近55 a安徽省年平均气温的变化主要存在5-8 a和10-15 a周期振荡,由小波方差图可以确定年平均气温存在6 a和11 a的主周期;4)安徽省年及四季平均气温的Hurst指数都大于0.5,表明存在显著的Hurst现象,即在不同时间段,该地区的气温时间序列大体上延续历史变化趋势,说明近55 a来安徽省的气温变化存在趋势性成分。春季和冬季Hurst值最高,表明与其他季节相比,春季和冬季的增温持续性最强,是年平均增温的主要贡献者。
DOI:10.7519/j.issn.1000-0526.2016.04.008URL [本文引用: 1]
利用安徽省夏玉米种植区15个农业气象观测站点1971—2010年的逐日降水资料并结合区域夏玉米抽雄-乳熟期(产量形成关键期)的降水距平与夏玉米干旱减产率进行分析,建立了干旱天气指数模型。提出夏玉米干旱的保险赔付标准,并利用各市(县)的干旱风险评估结果修订干旱天气指数保险费率,最终得到各地区的夏玉米干旱天气指数保险产品。将设计的保险产品在安徽省淮北市濉溪县试验应用,该产品可以基本反映实际夏玉米干旱风险状况,有助于农业保险公司客观、快捷地提供农业灾害的经济补偿。
DOI:10.7519/j.issn.1000-0526.2016.04.008URL [本文引用: 1]
利用安徽省夏玉米种植区15个农业气象观测站点1971—2010年的逐日降水资料并结合区域夏玉米抽雄-乳熟期(产量形成关键期)的降水距平与夏玉米干旱减产率进行分析,建立了干旱天气指数模型。提出夏玉米干旱的保险赔付标准,并利用各市(县)的干旱风险评估结果修订干旱天气指数保险费率,最终得到各地区的夏玉米干旱天气指数保险产品。将设计的保险产品在安徽省淮北市濉溪县试验应用,该产品可以基本反映实际夏玉米干旱风险状况,有助于农业保险公司客观、快捷地提供农业灾害的经济补偿。
DOI:10.11898/1001-7313.20090208URL [本文引用: 1]
该文提出了一个可业务应用的农业旱涝监测预警气象指标——累积湿润指数。该指标以相对湿润度指数为基础,用作物需水量取代参考作物蒸散量,并考虑前期旱涝程度对当前旱涝状况的累积影响,具有农业意义。为方便农业气象业务应用,采用FAO Penman-Monteith模型的简化方法计算参考作物蒸散量,用气温资料对简化式进行校准,将误差减小到可满足应用要求;通过求算不同区域农田作物系数的加权平均值,得到宏观农田作物需水量,并确定了该指标分区域的旬旱涝等级标准。该指标用于旱涝监测,与土壤墒情的定性符合率为80%~90%,定量符合率为60%~70%,在旬时间尺度比土壤墒情指标更符合旱涝实况;用于下一旬旱涝预警,尽管受到中期降水量预报准确度影响,但由于含有前期旱涝实况信息,预警趋势大体正确,提高了旱涝预警的准确度。
DOI:10.11821/dlxb201511012URL [本文引用: 1]
本文全面分析了农业干旱的概念内涵及其与其他干旱类型之间的关系,进而从基于站点监测和基于遥感监测两个方面,系统梳理了国内外农业干旱监测的近今进展,对比了不同干旱监测指标的适用范围和局限性;同时,通过文献统计和重要文献引用揭示了国内外农业干旱监测研究的发展历程和最新进展,即农业干旱监测指标从传统的单一气象监测指标逐渐向气象与遥感相结合的综合监测指标转变。最后,在分析农业干旱监测现有挑战和困境的基础上,将农业干旱监测未来发展趋向归纳为5点展望,即进一步明晰农业干旱发生机理和受旱过程、识别农业干旱影响因素及其相互作用关系、构建多时空尺度农业干旱监测模型、耦合农业干旱定性表征与定量评估模型以及提高农业干旱监测模型中遥感数据的应用水平。
