 ,*, 汤菊香河南科技学院/河南省现代生物育种协同创新中心/河南省棉麦分子生态和种质创新重点实验室, 河南新乡 453003
Coordination of root growth and leaf senescence in cotton
WANG Su-Fang, XUE Hui-Yun, ZHANG Zhi-Yong,*, TANG Ju-XiangHenan Institute of Science and Technology/Henan Collaborative Innovation Center of Modern Biological Breeding/Henan Key Laboratory for Molecular Ecology and Germplasm Innovation of Cotton and Wheat, Xinxiang 453003, Henan, China通讯作者:
收稿日期:2019-03-18接受日期:2019-08-9网络出版日期:2019-09-10
| 基金资助: |
Received:2019-03-18Accepted:2019-08-9Online:2019-09-10
| Fund supported: |
作者简介 About authors
E-mail:wang2010sufang@126.com。

摘要
关键词:
Abstract
Keywords:
PDF (301KB)元数据多维度评价相关文章导出EndNote|Ris|Bibtex收藏本文
本文引用格式
王素芳, 薛惠云, 张志勇, 汤菊香. 棉花根系生长与叶片衰老的协调性[J]. 作物学报, 2020, 46(1): 93-101. doi:10.3724/SP.J.1006.2020.94043
WANG Su-Fang, XUE Hui-Yun, ZHANG Zhi-Yong, TANG Ju-Xiang.
作物根系生长、形态与分布对叶片衰老和产量有着十分重要的作用[1]。大的根系和高的根系长度密度(RLD)是超级稻高产的重要基础[2], 它们有利于提高玉米吐丝期后的氮素吸收, 增加叶片光合速率, 从而有利于高产[3,4], 同时在增强棉花后期耐钾缺乏能力及防止早衰方面发挥着重要的作用[5]。分布深而多的水稻根型有利于提高地上部叶片叶绿素含量, 延缓衰老[6]; 小麦根系深层分布多显著延缓了开花后的叶片衰老, 增加了籽粒产量[7]。
根系活力和作物产量及叶片衰老也有着密切的关系。水稻根系活力的大小直接影响了地上部分生长发育的进程及产量的高低[8,9]。小麦根系活力在开花后急剧下降, 并与叶片衰老指数显著相关[10]。从田间土壤取根系样测定根系活力往往反映的是局部单位根量的活力, 而不是地下根群的总活力。而作物根系伤流液, 可以把作物的地上部与地下部有机地联系起来[11]。伤流强度能比较准确地反映整体根系活力的变化[12,13,14]。例如, 水稻在齐穗期和乳熟期, 根系伤流强度与剑叶等叶片衰减指数及千粒重、结实率呈显著正相关[15]。
棉花的熟性可被分为正常成熟衰老、早衰和贪青晚熟3类[16]。正常的成熟衰老可以帮助棉花抵御不利自然灾害, 提高生育期内有限能量和物质资源的利用效率从而提高产量[17]。但在生产中, 棉花叶片衰老快(早衰)是普遍现象, 一般导致产量损失10%左右, 严重情况下, 损失达20%以上[18,19]。因此, 棉花衰老的生理生化和分子机理被广泛研究[16,20-22]。董合忠等[23]通过利用2个遗传背景相似但衰老进程不同的转基因棉花进行嫁接发现, 叶片衰老主要依赖于根系。进一步研究发现, 不协调的根冠关系会引起棉花不正常的衰老表现[24]。但目前关于棉花叶片衰老与根系生长和根系活力关系的研究相对较少。棉花早熟与早衰存在遗传正相关, 所以在生产上早熟基因型经常早衰, 但不是必然伴随早衰现象。黄淮流域棉花, 春棉通常在7月中下旬至8月中旬进入棉花生殖生长旺盛期即盛花期, 这个生长阶段大量铃形成和生长, 需从叶片获取大量养分, 所以该阶段也是生殖和营养生长矛盾突出期。衰老通常也始发于8月中下旬, 但此阶段根系生长及与地上部生长协调性未见报道。因此, 本试验在大田条件下, 研究衰老特性不同但早熟性基本一致的棉花基因型的产量、叶片衰老及其根系形态、根系分布和根系活力, 以探索根系生长和叶片衰老之间的协调性。
1 材料与方法
1.1 试验材料
百棉1号是国家审定的转基因抗虫棉品种, 由河南科技学院棉花研究所培育, 为钾高效性棉花品种, 生产上表现为早熟衰老慢[25]; DP99B是转基因抗虫棉, 由美国孟山都公司选育而成, 2000年通过河北省农作物品种审定, 为钾低效性品种, 生产上表现为早熟衰老快[26]。1.2 试验方法
1.2.1 大田试验设计与种植 新乡市试验田为沙质土, pH 8.5, 含有机物0.60%、速效氮18.6 mg kg-1、速效磷16.2 mg kg-1、速效钾158.5 mg kg-1。2011年, 小区内采用宽窄行种植, 宽行行距1 m, 窄行行距0.6 m, 株距约27 cm, 密度为4.5万株 hm-2, 起垄种植, 棉花种在垄背上。2012年, 小区内采用等行距种植, 株距约22 cm, 密度为4.5万株 hm-2, 平地种植。2年试验均采用完全随机设计, 每个基因型设3个重复, 共6个小区, 每个小区6行, 行长10 m。统一施肥、浇水和喷施调节剂等。1.2.2 产量和霜前籽棉率测定 每年约从9月10日开始手工收花, 按小区每隔20 d收获一次直至收花结束, 分别称量其籽棉重。轧花后, 称量其皮棉重。10月20日前的籽棉产量除以总籽棉产量, 记为霜前籽棉率。
1.2.3 棉花开白花动态及白花以上主茎节数测定
随机挑选每个小区3~4行30株棉花, 从第一次看到有白花开放时, 记录当天开放的白花数量, 1周统计1次, 直到开花基本结束。同时, 从最上部果枝第1节位白花开放所在位置为起点, 记录上部主茎节数, 1周统计1次, 直至白花以上主茎节数小于5.0时终止调查。
1.2.4 叶片衰老指标(棉花叶片净光合速率和叶绿素荧光)测定 棉花叶片净光合速率(net photosynthetic rate, Pn)和叶片叶绿素荧光, 均可反映叶片的衰老过程。棉花打顶后逐渐进入生殖生长的盛期, 2011年7月17日打顶后不同时期于晴朗天气上午10:00-11:00用光合测定仪Li-6400 (USA)测定倒一叶的光合速率; 2012年7月15日打顶后不同时期用连续激发式荧光仪(Handy-PEA, England)测定倒一叶的荧光, 测定前叶片先暗适应30 min。
1.2.5 根系取样及测定 2011年依据叶片光合情况判定, 于2个基因型叶片衰老有明显差异时(9月中下旬即处于吐絮期)取样。在小区的中间2行, 使用内径为5 cm的土钻在棉株4周打孔取样, 其中2个取样点位于株行间, 距主茎20 cm, 另外2个孔位于同行相邻植株的正中间。垂直向下以0~20 cm、20~40 cm土层分别取样。每层土样的体积为392.5 cm3。2012年, 于叶片衰老前(7月初即初花期)至衰老后(10月中上旬即吐絮期), 间隔约20 d分别取样。在小区中间2行, 用内径为5.48 cm土钻在棉花行间靠其中一行棉花距离分别为25 cm和50 cm的部位取样, 取样深度为0~20 cm、20~40 cm、40~60 cm和60~80 cm。每层的土壤体积为471.5 cm3。将样品分别放入塑料袋内, 带回实验室, 放到筛网内(孔径为80目), 下面套放孔径较小的筛网(孔径为200目), 以防止根系流失。用自来水慢慢冲洗土壤, 直至冲洗干净为止。然后将筛网放在水面上, 用镊子挑选根系, 用于根系扫描。将待扫描根系放于盛有一定水的盘中, 用EPSON scan扫描仪在透射模式下扫描并保存, 通过WinRHizo软件分析得到根系的长度、表面积等指标。
1.2.6 根系长度(面积、体积)密度与根系分布
根系长度(面积、体积)密度为每层土中根系的长度、面积和体积分别除以每层土的体积。根系分布为较深层土壤中根系长度、面积和体积分别与较浅层土壤中根系长度、面积和体积的比值。因2年种植方式和取样深度不同, 故根系分布于2011年是土壤20~40 cm中根系长度、面积和体积分别与较浅层土壤0~20 cm中根系长度、面积和体积的比值; 2012年是土壤40~80 cm中根系长度、面积和体积分别与土壤0~40 cm中根系长度、面积和体积的比值。
1.2.7 根系伤流液获取 棉花根系伤流液的量可反映棉花的根系整体活力。伤流液取样时间和叶绿素荧光测定时间进程大致一致。每次从每个小区取4株, 于紧靠棉株子叶节下方剪断棉花主茎, 套乳胶管, 用封口膜将乳胶管和茎连接处缠好, 铝箔纸包裹乳胶管以避免光线照射, 用夹子夹紧乳胶管另一端, 放置在冰盒中, 每天8:00、11:00、19:00, 用注射器从乳胶管收集伤流液, 并注入离心管, 放入冰盒中带回室内, 存于-80℃冰箱。连续取3 d。
1.2.8 蛋白质浓度测定 用超微量核酸蛋白测定仪(Thermo SCIENTIFIC NANODROP 2000, USA)测定。
1.2.9 数据分析 采用SAS软件的ANOVA t-test比较2个品种之间各测定指标。利用Microsoft Excel软件分析数据和绘图。
2 结果与分析
2.1 2个棉花基因型的产量和早熟性
2011年, 百棉1号籽棉产量和霜前籽棉产量与DP99B相比没有显著差异, 但分别比DP99B高3.4%和5.9%; 百棉1号的皮棉和霜前皮棉显著高于DP99B, 分别高13.7%和16.7%。2012年, 百棉1号的籽棉、皮棉、霜前籽棉、霜前皮棉产量均显著高于DP99B (表1)。Table 1
表1
表1大田条件下, 2个棉花基因型的产量和霜前籽棉率
Table 1
| 年份Year | 品种 Variety | 籽棉 Seed cotton (kg hm-2) | 皮棉 Ginned cotton (kg hm-2) | 霜前籽棉 Seed cotton before frost (kg hm-2) | 霜前皮棉 Ginned cotton before frost (kg hm-2) | 霜前籽棉率 Ratio of seed cotton before frost (%) |
|---|---|---|---|---|---|---|
| 2011 | DP99B | 4026.0 a | 1576.5 b | 3375.0 a | 1318.5 b | 83.8 a |
| 百棉1号Baimian 1 | 4164.0 a | 1792.5 a | 3573.0 a | 1539.0 a | 85.8 a | |
| 2012 | DP99B | 4026.0 b | 1587.0 b | 3829.5 b | 1509.0 b | 95.1 a |
| 百棉1号Baimian 1 | 4656.0 a | 2019.0 a | 4311.0 a | 1869.0 a | 92.6 a |
新窗口打开|下载CSV
2012年7月14日, 2个基因型棉花开白花数量均达到高峰。7月28日至8月4日, DP99B开白花数量显著低于百棉1号(表2), 这和DP99B的霜后籽棉和皮棉均低于百棉1号(表1)具有一致性。当最上果枝第1节位白花以上主茎节数等于5.0时, 表示棉花生长发育进入生理衰退期。2012年, 2个基因型棉花的生长发育进入生理衰退期的时间一致, 均在7月19日到7月26日之间。
Table 2
表2
表22012年2个基因型棉花白花以上主茎节数/开白花动态
Table 2
| 基因型 Genotype | 日期 Date | |||||
|---|---|---|---|---|---|---|
| June 28/June 30 | July 5/July 7 | July 12/July 14 | July 19/July 21 | July 26/July 28 | -/August 4 | |
| DP99B | 8.3 b/2 a | 6.7 b/14 a | 6.8 b/31 a | 6.0 b/11 a | 3.8 a/15 b | -/16 b |
| 百棉1号Baimian 1 | 9.4 a/1 a | 7.5 a/13 a | 7.2 a/31 a | 6.6 a/11 a | 3.8 a/19 a | -/23 a |
新窗口打开|下载CSV
2012年6月28日至7月19日, DP99B白花以上主茎节数均显著小于百棉1号, 表明在这个期间其营养生长相对弱于百棉1号, 更偏向生殖生长(表2), 与本年度的霜前花比例具有一致性(表1)。
2.2 2个棉花基因型的叶片衰老特性
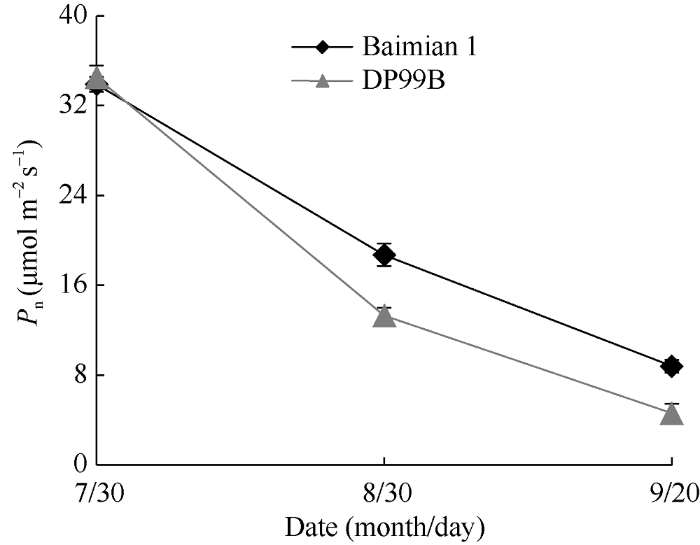
2011年棉花倒一叶刚进入功能期时(7月30日), 两基因型的Pn之间没有差异。随着时间的推移, 两基因型的Pn均明显下降, 但百棉1号倒1叶Pn下降幅度明显小于DP99B。在8月30日和9月20日, 百棉1号倒一叶的Pn分别比DP99B高40.6%和31.6%, 且差异显著(图1)。图1
 新窗口打开|下载原图ZIP|生成PPT
图12011年2个基因型棉花倒一叶净光合速率Pn变化趋势
Fig. 1Net photosynthetic rate change of the first leaf counted from the stem top of two cotton genotypes in 2011
2012年7月20日, 2个棉花基因型的所有荧光参数之间无显著差异。从8月10日至10月11日, PIABS开始呈现整体下降趋势, 但百棉1号的PIABS始终显著高于DP99B。8月10日, 2个棉花基因型的Fo、Fv/Fm之间没有显著差异; 8月30日, 百棉1号的Fo显著小于DP99B, 2个基因型Fv/Fm无差异; 9月20日和10月11日, 百棉1号的Fo显著小于DP99B, 而百棉1号的Fv/Fm显著高于DP99B (表3)。
Table 3
表3
表32012年不同基因型棉花叶片叶绿素荧光随时间的变化趋势
Table 3
| 日期 Date (month/day) | 基因型 Genotype | 倒1叶 First leaf counted from stem top | ||
|---|---|---|---|---|
| Fo | Fv/Fm | PIABS | ||
| 7/20 | DP99B | 526 a | 0.84 a | 6.98 a |
| 百棉1号 Baimian 1 | 541 a | 0.84 a | 6.97 a | |
| 8/10 | DP99B | 558 a | 0.83 a | 4.71 b |
| 百棉1号 Baimian 1 | 538 a | 0.84 a | 5.83 a | |
| 8/30 | DP99B | 551 a | 0.84 a | 5.10 b |
| 百棉1号 Baimian 1 | 477 b | 0.84 a | 6.10 a | |
| 9/20 | DP99B | 604 a | 0.80 b | 2.72 b |
| 百棉1号 Baimian 1 | 551 b | 0.83 a | 3.77 a | |
| 10/11 | DP99B | 610 a | 0.76 b | 0.51 b |
| 百棉1号Baimian 1 | 487 b | 0.83 a | 2.68 a | |
新窗口打开|下载CSV
2.3 2个基因型棉花的根系生长和分布
2011年棉花吐絮期(9月20日), 0~20 cm土层内百棉1号的RLD、RSD和RVD分别比DP99B少15.6%、27.1%和35.0%, 且两基因型RSD和RVD差异显著; 20~40 cm土层内, 百棉1号的RLD、RSD和RVD分别比DP99B大124.6%、96.7%和72.7%, 且均差异显著; 0~40 cm土层内, 百棉1号的RLD、RSD和RVD分别比DP99B大29.4%、14.6%和3.2%, 但仅RLD差异显著。2个基因型各根系纵向分布(20~40 cm/0~20 cm)差异显著, 且百棉1号上述各根系参数在深处分布分别比DP99B多166.2%、169.7%和165.7% (表4)。Table 4
表4
表42011年9月20日不同基因型棉花根系长度密度、面积密度、体积密度及纵向分布
Table 4
| 土层深度 Soil depth | 根长度密度RLD (mm cm-3) | 根表面积密度RSD (mm2 cm-3) | 根体积密度RVD (mm3 cm-3) | |||||
|---|---|---|---|---|---|---|---|---|
| DP99B | 百棉1号Baimian 1 | DP99B | 百棉1号Baimian 1 | DP99B | 百棉1号Baimian 1 | |||
| 0-20 cm | 3.27 a | 2.76 a | 4.62 a | 3.37 b | 0.51 a | 0.33 b | ||
| 20-40 cm | 1.55 b | 3.47 a | 2.34 b | 4.61 a | 0.28 b | 0.48 a | ||
| 0-40 cm | 2.41 b | 3.12 a | 3.48 a | 3.99 a | 0.39 a | 0.41 a | ||
| 纵向分布LD (%) | 47.33 b | 125.98 a | 50.63 b | 136.56 a | 55.00 b | 146.15 a | ||
新窗口打开|下载CSV
2012年棉花生长从初花期至吐絮期(7月4日至10月13日), 2个基因型根系生长动态存在差异。0~20 cm土层内, DP99B的RLD、RSD和RVD变化大体呈现单峰曲线, 于8月11日(处于盛花期)达到高峰; 百棉1号的RLD、RSD和RVD变化总体呈现稳定上升趋势。在20~40 cm、40~60 cm和60~80 cm土层内, DP99B根系生长动态近似于0~20 cm土层内根系生长动态; 而百棉1号根系生长于9月23日达到高峰。总体上看, 0~80 cm土层内DP99B的RLD、RSD和RVD变化呈现双峰曲线; 8月11日, DP99B根系生长达到最高峰, 9月3日下降后, 于9月23日又达到一个小高峰(表5)。百棉1号的RLD、RSD和RVD变化呈现单峰曲线; 9月23日, 百棉1号的根系生长达到高峰(表5)。
Table 5
表5
表52012年不同基因型棉花根系长度密度、面积密度、体积密度及纵向分布
Table 5
| 日期 Date (month/day) | 土层深度 Soil depth (cm) | 根长度密度 RLD (mm cm-3) | 根表面积密度 RSD (mm cm-3) | 根体积密度 RVD (mm3 cm-3) | |||||
|---|---|---|---|---|---|---|---|---|---|
| DP99B | 百棉1号Baimian 1 | DP99B | 百棉1号 Baimian 1 | DP99B | 百棉1号Baimian 1 | ||||
| 7/4 | 0-20 | 2.00 a | 2.17 a | 2.50 a | 2.60 a | 0.25 a | 0.25 a | ||
| 20-40 | 1.61 a | 1.98 a | 1.98 a | 2.53 a | 0.19 a | 0.25 a | |||
| 40-60 | 0.79 b | 1.11 a | 1.20 b | 1.72 a | 0.15 a | 0.21 a | |||
| 60-80 | 0.30 a | 0.28 a | 0.56 a | 0.51 a | 0.08 a | 0.08 a | |||
| 0-80 | 1.17 a | 1.38 a | 1.56 a | 1.84 a | 0.17 a | 0.20 a | |||
| 纵向分布LD (%) | 30.17 a | 33.34 a | 39.43 a | 43.63 a | 52.38 a | 58.33 a | |||
| 7/24 | 0-20 | 5.57 a | 5.08 a | 6.02 a | 5.66 a | 0.53 a | 0.51 a | ||
| 20-40 | 3.24 a | 2.61 a | 4.06 a | 2.82 b | 0.40 a | 0.23 b | |||
| 40-60 | 2.26 b | 3.36 a | 2.55 b | 4.04 a | 0.23 b | 0.38 a | |||
| 60-80 | 1.20 a | 1.24 a | 1.75 a | 1.67 a | 0.21 a | 0.19 a | |||
| 0-80 | 3.07 a | 3.07 a | 3.60 a | 3.55 a | 0.34 a | 0.33 a | |||
| 纵向分布LD (%) | 39.24 b | 59.81 a | 42.64 b | 67.38 a | 47.73 b | 77.14 a | |||
| 8/11 | 0-20 | 9.26 a | 7.28 b | 8.38 a | 6.59 b | 0.62 a | 0.47 a | ||
| 20-40 | 3.67 a | 2.93 a | 3.75 a | 2.94 b | 0.30 a | 0.23 a | |||
| 40-60 | 3.27 a | 3.49 a | 3.67 a | 3.89 a | 0.34 a | 0.34 a | |||
| 60-80 | 2.06 a | 1.56 a | 2.54 a | 2.14 a | 0.25 a | 0.23 a | |||
| 0-80 | 4.57 a | 3.82 b | 4.59 a | 3.89 b | 0.38 a | 0.32 a | |||
| 纵向分布LD (%) | 41.26 b | 49.48 a | 51.21 b | 63.28 a | 65.12 b | 81.82 a | |||
| 9/3 | 0-20 | 6.47 b | 8.85 a | 6.62 b | 8.66 a | 0.53 b | 0.68 a | ||
| 20-40 | 3.12 a | 3.39 a | 3.11 a | 3.67 a | 0.25 a | 0.32 a | |||
| 40-60 | 2.56 a | 2.16 a | 2.67 a | 2.20 a | 0.21 a | 0.19 a | |||
| 60-80 | 1.40 a | 1.66 a | 1.91 a | 2.33 a | 0.21 a | 0.25 a | |||
| 0-80 | 3.39 a | 4.01 a | 3.58 a | 4.21 a | 0.30 a | 0.36 a | |||
| 纵向分布LD (%) | 41.31 a | 31.22 b | 47.12 a | 36.71 b | 54.05 a | 44.68 b | |||
| 9/23 | 0-20 | 6.91 b | 9.24 a | 9.10 b | 11.42 a | 0.98 b | 1.12 a | ||
| 20-40 | 3.75 b | 5.18 a | 4.35 b | 5.57 a | 0.40 a | 0.49 a | |||
| 40-60 | 3.07 b | 3.95 a | 3.28 b | 4.66 a | 0.28 b | 0.45 a | |||
| 60-80 | 1.37 b | 3.06 a | 1.88 b | 3.89 a | 0.21 b | 0.40 a | |||
| 0-80 | 3.78 b | 5.36 a | 4.65 b | 6.38 a | 0.47 b | 0.62 a | |||
| 纵向分布LD (%) | 41.67 b | 48.65 a | 38.33 b | 50.29 a | 35.38 b | 52.63 a | |||
| 10/13 | 0-20 | 6.03 b | 9.86 a | 7.05 b | 10.87 a | 0.68 b | 0.95 a | ||
| 20-40 | 3.00 b | 3.47 a | 4.04 b | 5.52 a | 0.42 b | 0.70 a | |||
| 40-60 | 1.99 b | 3.55 a | 2.36 b | 4.31 a | 0.23 b | 0.42 a | |||
| 60-80 | 1.17 b | 1.88 a | 1.48 b | 2.66 a | 0.15 b | 0.30 a | |||
| 0-80 | 3.05 b | 4.69 a | 3.73 b | 5.84 a | 0.37 b | 0.59 a | |||
| 纵向分布LD (%) | 34.99 b | 40.67 a | 34.63 b | 42.53 a | 34.62 b | 43.59 a | |||
新窗口打开|下载CSV
7月4日, 在40~60 cm土层, 百棉1号的RLD和RSD显著高于DP99B; 其他土层中2个基因型RLD、RSD和RVD均无显著差异。7月24日, 在20~40 cm土层, DP99B的RSD和RVD显著大于百棉1号, 其中DP99B的RVD比百棉1号高72.3%; 在40~60 cm土层百棉1号的RLD、RSD和RVD均显著高于DP99B, 其中百棉1号的RVD比DP99B高63.6%; 其余均无显著差异。8月11日, 在0~20 cm土层, DP99B的RLD和RSD均显著高于百棉1号; 在20~40 cm土层, DP99B的RSD显著高于百棉1号; 其余均无显著差异。
9月3日, 在0~20 cm土层, 百棉1号的RLD、RSD和RVD显著高于DP99B, 其中百棉1号的RVD比DP99B高28.0%; 其余均无显著差异。9月23日, 在0~20 cm、20~40 cm、40~60 cm和60~80 cm土层, 百棉1号的RLD比DP99B分别高出33.7%、38.3%、28.6%和123.8%, 均达到显著水平; 百棉1号的RSD比DP99B分别高出25.4%、28.1%、42.2%和106.8%, 均达到显著水平; 在0~20 cm、40~60 cm和60~80 cm土层, 百棉1号的RVD比DP99B分别高出14.3%、61.5%和90.0%, 达到显著水平。10月13日, 在0~20 cm、20~40 cm、40~60 cm和60~80 cm土层, 百棉1号的RLD比DP99B分别高出63.5%、15.9%、78.0%和60.8%, 百棉1号的RSD比DP99B分别高出54.1%、36.6%、82.8%和79.2%, 百棉1号的RVD比DP99B分别高出40.6%、65.0%、81.8%和100.0%, 并达到显著水平。
从总体上看, 0~80 cm土层内, 7月4日和7月24日, 2个基因型之间的RLD、RSD和RVD相比较, 无显著差异; 8月11日, DP99B的RLD、RSD显著大于百棉1号; 9月23日和10月13日, 百棉1号的RLD、RSD和RVD开始显著大于DP99B, 并随着时间的延长, 大于的幅度变大。从根系在土壤纵向分布(40~80 cm/0~40 cm)上看, DP99B的RLD、RSD和RVD在深层分布总体呈现增加、平台期(8月11日至9月23日)、减少的动态变化; 百棉1号呈现增加、减少、增加、减少的动态变化。其中, 除9月3日DP99B根系深层分布比例显著高于百棉1号及7月4日两者差异不显著外, 其他日期百棉1号的根系深层分布比例显著高于DP99B。
2.4 2个基因型棉花的根系活力
随着棉花的生长(7月22日至9月15日), DP99B的根系伤流液总量和流速逐步减小, 且减小幅度依次增大。百棉1号的根系伤流液总量和流速呈现单峰曲线; 8月22日, 其伤流液总量和流速均达到最大; 9月15日, 明显降低。7月22日, DP99B的根系伤流液总量和流速显著高于百棉1号, 分别高68.2%和66.9%; 8月2日, DP99B和百棉1号的根系伤流液总量和流速均无显著差异; 8月22日, 百棉1号的根系伤流液总量和流速显著高于DP99B, 分别高185.7%和184.8%; 9月15日, 百棉1号的根系伤流液总量和流速显著高于DP99B, 分别高1675.0%和1664.3%。2个基因型伤流液的蛋白质浓度均随着棉花生长呈现先增加后降低动态变化, 4个取样时期中仅8月22日有微小显著差异; 2个基因型的伤流液蛋白质总量之间差异和伤流液总量差异呈现一致趋势(表6)。Table 6
表6
表62012年2个基因型棉花根系伤流液总量、流速及蛋白质含量
Table 6
| 日期 Date (month/day) | 基因型 Genotype | 伤流液 Bleeding sap | |||
|---|---|---|---|---|---|
| 总量 Total volume (mL) | 流速 Velocity (μL h-1) | 蛋白质含量 Protein conc. (μg mL-1) | 蛋白质总量 Total protein content (μg) | ||
| 7/22 | DP99B | 11.1 a | 38.4 a | 0.8 a | 9.4 a |
| 百棉1号Baimian 1 | 6.6 b | 23.0 b | 0.8 a | 5.1 b | |
| 8/02 | DP99B | 8.5 a | 29.6 a | 1.5 a | 12.2 a |
| 百棉1号Baimian 1 | 7.3 a | 25.5 a | 1.4 a | 10.4 a | |
| 8/22 | DP99B | 4.9 b | 17.1 b | 2.7 a | 13.6 b |
| 百棉1号Baimian 1 | 14.0 a | 48.7 a | 2.3 b | 31.1 a | |
| 9/15 | DP99B | 0.4 b | 1.4 b | 1.2 a | 0.5 b |
| 百棉1号Baimian 1 | 7.1 a | 24.7 a | 1.0 a | 7.3 a | |
新窗口打开|下载CSV
3 讨论
棉花熟性通常可用霜前籽棉占总籽棉的产量、棉花的开白花动态、棉花白花以上主茎节数3个指标表示[18]。2年间2个品种的霜前籽棉率差异均不显著(表1)。2012年6月30日至7月21日, DP99B和百棉1号的开白花量无显著差异; 依据白花以上主茎节数值判断, 百棉1号和DP99B的生长发育均在7月19日至7月26日之间进入生理衰退期(表2)。因此, DP99B和百棉1号2个基因型的早熟性具有一致性。2个早熟性基本一致的基因型, 其叶片衰老进程明显不同。2年结果显示, DP99B的Pn下降速率和PIABS下降速率等显著快于百棉1号(图1和表3), 表明DP99B为易衰老(叶片衰老快)基因型, 百棉1号为不易衰老(叶片衰老慢)基因型, 和生产上的报道具有一致性。
3.1 棉花衰老与根系生长和活力的关系
棉花衰在叶片, 源在根系[18]。伤流液多少反应根系衰老状况, 因此, 从伤流液可以看出, 2个基因型的根系衰老和叶片衰老具有协同性, 叶片衰老快的基因型DP99B的根系活力衰退也快, 而叶片衰老慢的基因型百棉1号的根系活力衰退也慢(图1、表3和表6)。棉花叶片衰老慢(不早衰)的品种, 平均根系直径大, 并且在盛花期后根系再生能力强、根系大[5,27]。本试验中, DP99B根系生长在盛花期后的花铃期达到高峰(8月中旬), 而百棉1号根系继续生长, 于吐絮早期(9月中下旬)达到高峰(表5)。因此, 盛花期后根系继续生长是叶片衰老慢的重要基础。有报道显示, 根系深层分布有利于延缓衰老。Kong等[7]研究发现, 小麦根系深层分布多显著延缓了开花后的叶片衰老, 增加了籽粒产量。本试验中, 与DP99B相比, 百棉1号根系深层分布多(2012年2个时期除外), 叶片衰老晚, 产量高(表1、图1、表4和表5)。由此可知, 根系伤流液多、盛花期后根系继续生长及根系深层分布多可延缓棉花衰老。3.2 棉花衰老与其根叶的源库关系
植物库源关系是不断变化的, 如植物叶片在营养生长阶段是库, 而在生殖生长阶段又是源。库源比增大, 叶片衰老加速; 库源比减小, 叶片衰老延迟[28,29,30,31]。植物的开花和结实会引起源库矛盾加剧, 引起叶片衰老[29]。黄淮流域棉区, 8月中上旬, 春棉进入生长高峰盛花期, 花铃从叶片争夺大量养分, 导致叶片衰老。根系生长, 也会从叶片争夺养分, 加剧叶片衰老。但是, 根系生长变化和叶片衰老的关系目前还不清楚。本试验结果显示, 叶片衰老快的基因型DP99B根系生长高峰在8月中上旬(8月11日), 与棉株生长高峰—盛花期相重叠; 而叶片衰老慢的基因型百棉1号根系生长高峰延后至吐絮期—9月下旬(9月23日); 而且在8月中上旬, 总取样土层DP99B的RLD、RSD和RVD显著高于百棉1号(表5)。这表明DP99B叶片衰老比百棉1号早的原因可能是, 在盛花期根系生长也从叶片转移走较多的光合产物。3.3 棉花根长密度范围与变化
土壤表层含有最多的根系, 随着土层深度加深, RLD减少, 随着作物生长, RLD增多[32,33,34]。但是, 不同土壤深度RLD分布随深度增加而减少的规律并非一成不变。Yang等[35]报道, 不同的年份间新疆棉花根系在不同土壤深度的分布存在一定差异, 2015年30~50 cm土层RLD高于0~30 cm土层, 而2016年则相反。随着棉花的生长, 不同灌溉条件下, 其RLD呈现不同的变化趋势[32]。本试验结果显示, 2011年起垄种植条件下, 百棉1号20~40 cm土层RLD高于0~20 cm土层; 2012年平地种植条件下, 从7月4日至10月11日的6个时期取样均显示, 其0~20 cm土层RLD高于20~40 cm土层, 但高的幅度不一样; DP99B则2年表现一致(表4和表5)。此外, 2个棉花品种的RLD、RSD和RVD随生长呈现不同的规律, 百棉1号在9月下旬(吐絮期) RLD达到最大值后开始下降; DP99B在8月中旬(盛花期) RLD达到最大值后开始下降。与其他主要大田作物(玉米、小麦、大豆等)相比, 棉花的根系在土壤中更为稀疏[36]。但是, 试验条件、土壤质地及水分养分供应及不同基因型等因素均会影响作物RLD。例如, 英国冬小麦RLD, 土壤表土层(0~20 cm)为5~10 cm cm-3, 而在80~100 cm 土层仅0.2 cm cm-3 [37]; 在耕作层(0~40 cm)介于3~5 cm cm-3之间, 而在40 cm土层以下小于1 cm cm-3 [38]; 澳大利亚冬小麦RLD, 15个基因型在土壤表层15 cm内的变化范围为0.6~2.0 cm cm-3之间[39]。中国新疆棉花RLD, 在初花期30~40 cm土层可高达0.35 cm cm-3 [35]; 在0~10 cm土层最高可达约5.0 cm cm-3; 在70~80 cm土层最高约0.1 cm cm-3 [32]。本试验结果显示, 0~20 cm土层RLD接近1 cm cm-3, 而60~80 cm土层棉花根系RLD最高仅0.02 cm cm-3 (表4和表5), 且不同棉花品种之间存在明显差异。新疆棉花和本试验中棉花RLD在表土层的差异, 可能和密度大小、灌溉方式、是否覆盖薄膜等有关。从最近小麦、棉花根系研究报道及本文结果对比, 也进一步表明, 土壤中棉花RLD明显小于小麦RLD。
4 结论
棉花根系生长与叶片衰老具有一致性, 且前者决定后者。棉花盛花期后根系大、根系在土壤深层分布相对多及根系活力强直接延缓了叶片衰老; 生长旺盛期根系生长相对弱, 可避免与花铃一起从叶片争夺养分, 从而间接延缓叶片衰老, 增加产量。参考文献 原文顺序
文献年度倒序
文中引用次数倒序
被引期刊影响因子
DOI:10.1007/s11104-009-9929-9URL [本文引用: 1]

Without roots there would be no rhizosphere and no rhizodeposition to fuel microbial activity. Although micro-organisms may view roots merely as a source of carbon supply this belies the fascinating complexity and diversity of root systems that occurs despite their common function. Here, we examine the physiological and genetic determinants of root growth and the complex, yet varied and flexible, root architecture that results. The main functions of root systems are also explored including how roots cope with nutrient acquisition from the heterogeneous soil environment and their ability to form mutualistic associations with key soil micro-organisms (such as nitrogen fixing bacteria and mycorrhizal fungi) to aid them in their quest for nutrients. Finally, some key biotic and abiotic constraints on root development and function in the soil environment are examined and some of the adaptations roots have evolved to counter such stresses discussed.
DOI:10.1016/j.fcr.2009.04.004URL [本文引用: 1]
DOI:10.1016/j.eja.2011.12.003URL [本文引用: 1]
Improving grain yield per unit area is needed to meet the growing demand for corn in China where the availability of fertile land is very limited. Roots are vital organs for yield improvement. A field experiment was conducted in 2009 and 2010 to compare the Morphological and physiological characteristics of the root systems of the higher-yielding corn variety DengHai 661 (DH661) and the commonly grown corn variety for northern China ZhengDan 958 (ZD958). The results clearly showed that DH661 consistently yielded higher than ZD958 in both years. The average biomass and grain yield of DH661 were 20.11% and 19.15% higher than those of ZD958. The roots DH661 grow faster than ZD98, it can get the depth to 160-200 cm at VT stage, but the roots of ZD958 get that depth at R3 stage. At the same time, the maximum of root biomass and average root length density (RLD), root actively absorbing area, root TTC reducing capacity after VT stage in both years were 83.06%, 43.30%, 58.10% and 40.38% higher than those of ZD958, respectively. Which can supplying more water and nutrient for the shoot, and improve the LAI, photosynthetic rate (in the later growth stage) and longer duration of high photosynthesis, make the contribution to the shoot growth and grain filling. All the results supporting the hypothesis that greater root systems lead to higher yield. Crown Copyright (C) 2011 Published by Elsevier B.V.
DOI:10.1016/j.eja.2014.11.009URL [本文引用: 1]
DOI:10.1016/0378-4290(90)90054-FURL [本文引用: 2]
URL [本文引用: 1]
1983—1984年,通过群体水培、土培试验,在控制水稻根系不同分布空间形状情况下,研究了叶角与根系分布的关系,其结果主要表现如下:1.根系分布较深且多纵向时,叶角较小,叶片趋向于直立;根系分布较浅且少纵向时,叶角较大,叶片趋向于披垂。2.叶角的大小同时受叶片大小的影响,根系分布较浅且少纵向时,较大的叶片更易披垂,叶角更大,
URL [本文引用: 1]
1983—1984年,通过群体水培、土培试验,在控制水稻根系不同分布空间形状情况下,研究了叶角与根系分布的关系,其结果主要表现如下:1.根系分布较深且多纵向时,叶角较小,叶片趋向于直立;根系分布较浅且少纵向时,叶角较大,叶片趋向于披垂。2.叶角的大小同时受叶片大小的影响,根系分布较浅且少纵向时,较大的叶片更易披垂,叶角更大,
DOI:10.1111/jac.12007URL [本文引用: 2]
Root activity plays a dominant role in grain filling in cereal crops. However, the importance of deep roots for regulating post-anthesis leaf senescence is not clearly understood in wheat (Triticum aestivum L.). In this study, we used 32P tracing to estimate the difference in wheat root activity at soil depths of 30 and 70cm and the root restriction method to investigate the effects of vertical distribution of deep roots on leaf senescence, with non-restricted plants as controls. Recovery of radioactive 32P indicated that deep roots had significantly higher activity than upper roots in wheat. Root restriction at a soil depth of 50cm caused significant decreases in the activities of superoxide dismutase (EC 1.15.1.1), peroxidase (EC 1.11.1.7), catalase (EC 1.11.1.6) and ascorbate peroxidase (EC 1.11.1.11) at 16days after anthesis and thereafter resulting in an increase in malondialdehyde. As a result, chlorophyll levels and net photosynthesis decreased. Ultimately, the root-restricted wheat produced a significantly lower grain yield than the non-restricted controls. These data suggest that deep roots are pivotal for regulating plant senescence, duration of grain filling, and yield formation.
URL [本文引用: 1]
1986—1990年,在群体水培、大田及盆栽条件下,对不同类型水稻品种、不同氮素处理的根量、活力、籽粒灌浆结实、物质积累与分配等进行了研究。结果表明:(1)水稻品种间根量差异较大,主要由上层根量不同所致;(2)结实期平均根系活力随品种伸长节间数的增加呈下降趋势,与根量呈负相关;(3)不同生育期氮素处理对根量的影响以前期最大
URL [本文引用: 1]
1986—1990年,在群体水培、大田及盆栽条件下,对不同类型水稻品种、不同氮素处理的根量、活力、籽粒灌浆结实、物质积累与分配等进行了研究。结果表明:(1)水稻品种间根量差异较大,主要由上层根量不同所致;(2)结实期平均根系活力随品种伸长节间数的增加呈下降趋势,与根量呈负相关;(3)不同生育期氮素处理对根量的影响以前期最大
[本文引用: 1]
[本文引用: 1]
URL [本文引用: 1]
URL [本文引用: 1]
DOI:10.1007/s10142-014-0395-yURLPMID:25163431 [本文引用: 1]
The xylem sap of a plant is primarily responsible for transporting molecules from the underground root system to the aboveground parts of the plant body. In order to understand the role that roots play in cotton growth and development, the components present in xylem sap must be elucidated. In this study, we used a shotgun HPLC-ESI-MS/MS proteomics approach to identify 455 peptides from the xylem sap of field-grown cotton plants at peak blooming stage. Of these peptides, 384 (84.4%) were found to be secreted proteins and 320 (70.3%) had special molecular functions. Based on Gene Ontology (GO) analysis, 348 peptides were annotated in terms of molecular function, biological process, and cellular localization, with 46.9 and 45.1% being related to catalytic activity and binding activity, respectively. Many xylem sap-containing proteins were predicted to be involved in different phases of xylem differentiation including cell wall metabolism, secondary cell wall development and patterning, and programmed cell death. The identification of starch and sucrose hydrolyzing enzymes implicated the interaction between roots and aboveground parts on the aspect of carbohydrate metabolism. Many of the proteins identified in this study are involved in defense mechanisms including pathogen-related proteins, such as peroxidases, chitinases, and germin-like proteins, proteases involved in disease resistance, and phytoalexin phenylpropanoid synthesis-related proteins. The majority of identified signaling proteins were fasciclin-like arabinogalactan proteins and kinases. The results of this study provide useful insight into the communication mechanisms between cotton roots and the rest of the cotton plant.
[本文引用: 1]
[本文引用: 1]
[本文引用: 1]
[本文引用: 1]
[本文引用: 1]
[本文引用: 1]
[本文引用: 1]
[本文引用: 1]
URLPMID:27396141 [本文引用: 2]
Senescence is a natural termination process at the plant or organ level of cotton, leading to the inevitable end of the growth and development process. Maturity performance is termed as senescence performance and results of a cotton plant during boll opening, including normal maturity, premature senescence and late-maturity in cotton. Senescence and maturity performance are influenced by genotype and environment interactions. This paper summarized and reviewed the research progress in eco-physiology and molecular biology of cotton leaf senescence. Strategies were proposed to regulate cotton growth and aging through breeding of stably-developed varieties, rational application of plant growth regulators and agronomic cultivation measures, to realize normal maturity and improve yield and quality of cotton.
DOI:10.1016/j.fcr.2017.11.002URL [本文引用: 1]
[本文引用: 3]
[本文引用: 3]
DOI:10.1023/A:1004652728420URL [本文引用: 1]
DOI:10.1093/jxb/ers238URL [本文引用: 1]
To elucidate the phytohormonal basis of the feedback regulation of leaf senescence induced by potassium (K) deficiency in cotton (Gossypium hirsutum L.), two cultivars contrasting in sensitivity to K deficiency were self- and reciprocally grafted hypocotyl-to-hypocotyl, using standard grafting (one scion grafted onto one rootstock), Y grafting (two scions grafted onto one rootstock), and inverted Y grafting (one scion grafted onto two rootstocks) at the seedling stage. K deficiency (0.03mM for standard and Y grafting, and 0.01mM for inverted Y grafting) increased the root abscisic acid (ABA) concentration by 1.6- to 3.1-fold and xylem ABA delivery rates by 1.8- to 4.6-fold. The K deficiency also decreased the delivery rates of xylem cytokinins [CKs; including the zeatin riboside (ZR) and isopentenyl adenosine (iPA) type] by 2965% and leaf CK concentration by 1657%. The leaf ABA concentration and xylem ABA deliveries were consistently greater in CCRI41 (more sensitive to K deficiency) than in SCRC22 (less sensitive to K deficiency) scions under K deficiency, and ZR- and iPA-type levels were consistently lower in the former than in the latter, irrespective of rootstock cultivar or grafting type, indicating that cotton shoot influences the levels of ABA and CKs in leaves and xylem sap. Because the scions had little influence on phytohormone levels in the roots (rootstocks) of all three types of grafts and rootstock xylem sap (collected below the graft union) of Y and inverted Y grafts, it appears that the site for basipetal feedback signal(s) involved in the regulation of xylem phytohormones is the hypocotyl of cotton seedlings. Also, the target of this feedback signal(s) is more likely to be the changes in xylem phytohormones within tissues of the hypocotyl rather than the export of phytohormones from the roots.
.
DOI:10.1371/journal.pone.0036126URLPMID:22558354
Leaf senescence plays a vital role in nutrient recycling and overall capacity to assimilate carbon dioxide. Cotton premature leaf senescence, often accompanied with unexpected short-term low temperature, has been occurring with an increasing frequency in many cotton-growing areas and causes serious reduction in yield and quality of cotton. The key factors for causing and promoting cotton premature leaf senescence are still unclear. In this case, the relationship between the pre-chilling stress and Alternaria alternata infection for causing cotton leaf senescence was investigated under precisely controlled laboratory conditions with four to five leaves stage cotton plants. The results showed short-term chilling stress could cause a certain degree of physiological impairment to cotton leaves, which could be recovered to normal levels in 2-4 days when the chilling stresses were removed. When these chilling stress injured leaves were further inoculated with A. alternata, the pronounced appearance and development of leaf spot disease, and eventually the pronounced symptoms of leaf senescence, occurred on these cotton leaves. The onset of cotton leaf senescence at this condition was also reflected in various physiological indexes such as irreversible increase in malondialdehyde (MDA) content and electrolyte leakage, irreversible decrease in soluble protein content and chlorophyll content, and irreversible damage in leaves' photosynthesis ability. The presented results demonstrated that chilling stress acted as the key predisposing factor for causing A. alternata infection and leading to cotton leaf senescence. It could be expected that the understanding of the key factors causing and promoting cotton leaf senescence would be helpful for taking appropriate management steps to prevent cotton premature leaf senescence.
DOI:Y2015/V27/I1/71URL [本文引用: 1]
早衰是棉花生长发育的一种异常现象,是大量衰老相关基因差异表达的结果。早衰棉花光合作用、碳水化合物和其他生物大分子合成相关基因大多下调表达,而蛋白、核苷酸、脂类降解和氨基酸、糖类、嘌呤、嘧啶和离子转运体等养分循环利用相关基因大多上调表达;脱落酸(ABA)、乙烯、生长素、茉莉酸(JA)和赤霉素(GA)相关基因大多上调表达,而细胞分裂素合成基因IPT下调表达;NAC和WRKY等转录因子基因也大多上调表达。结合作者在该领域的研究,总结评述了光合作用及大分子降解、养分循环利用、激素和转录因子相关基因在早衰棉花中的表达模式及作用机理。
DOI:Y2015/V27/I1/71URL [本文引用: 1]
早衰是棉花生长发育的一种异常现象,是大量衰老相关基因差异表达的结果。早衰棉花光合作用、碳水化合物和其他生物大分子合成相关基因大多下调表达,而蛋白、核苷酸、脂类降解和氨基酸、糖类、嘌呤、嘧啶和离子转运体等养分循环利用相关基因大多上调表达;脱落酸(ABA)、乙烯、生长素、茉莉酸(JA)和赤霉素(GA)相关基因大多上调表达,而细胞分裂素合成基因IPT下调表达;NAC和WRKY等转录因子基因也大多上调表达。结合作者在该领域的研究,总结评述了光合作用及大分子降解、养分循环利用、激素和转录因子相关基因在早衰棉花中的表达模式及作用机理。
URL [本文引用: 1]
With the removal of vegetative branches plus the maintenance of early fruiting branches as the control, the effects of various training modes on the sourcesink relation of field-grown cotton were examined in 2005 and 2006. The results showed that compared with the control, either the removal of vegetative branches plus the removal of early fruiting branches (Ⅰ), the maintenance of vegetative branches plus the removal of early fruiting branches (Ⅱ), or the maintenance of vegetative branches plus the maintenance of early fruiting branches (Ⅲ) could increase the leaf area per plant significantly, with the average maximum LAI across the two years increased by 10.3%, 28.3%, and 9.5%, respectively, and resulting in the decreases of the load per leaf area and the ratio of sink to source. Ⅰand Ⅱ alleviated the leaf senescence of cotton plants as indicated by the enhanced leaf chlorophyll content and the reduced percentage of yellow leaves and C/N ratio of functional leaves, and Ⅱ also induced the late-maturing of cotton plants. Ⅲ had no significant effects on senescence alleviation. Ⅰ produced approximately equal seed cotton, but Ⅱ and Ⅲ produced 6.4%-15.6% less and 6.3% more seed cotton than the control, respectively. It was concluded that either the maintenance of vegetative branches or the removal of early fruiting branches could be an effective pathway to regulate the ratio of sink to source, C/N, and maturity performance of cotton plants.
DOI:10.1007/s11738-010-0706-4URL [本文引用: 1]
Many studies have shown that root-shoot imbalance influences vegetative growth and development of cotton (Gossypium hirsutum L.), but few have examined changes in leaf senescence and endogenous hormones due to stem girdling. The objective of this study was to determine the correlation between some endogenous phytohormones, particularly cytokinins and abscisic acid (ABA), and leaf senescence following stem girdling. Field-grown cotton plants were girdled on the main stem 5 days after squaring (DAS), while the non-girdled plants served as control. Plant biomass, seed cotton yield, main-stem leaf photosynthetic (Pn) rate, chlorophyll (Chl) and malondialdehyde (MDA) concentrations, as well as levels of cytokinins and ABA in main-stem leaves and xylem sap were determined after girdling or at harvest. Main-stem girdling decreased the dry root weight and root/shoot ratio from 5 to 70 days after girdling (DAG) and reduced seed cotton yield at harvest. Main-stem leaf Pn and Chl concentration in girdled plants were significantly lower than in control plants. Much higher levels of MDA were observed in main-stem leaves from 5 to 70 DAG, suggesting that stem girdling accelerated leaf senescence. Girdled plants contained less trans-zeatin and its riboside (t-Z + t-ZR), dihydrozeatin and its riboside (DHZ + DHZR), and isopentenyladenine and its riboside (iP + iPA), but more ABA than control plants in both main-stem leaves and xylem sap. These results suggested that main-stem girdling accelerated leaf senescence due to reduced levels of cytokinin and/or increased ABA. Cytokinin and ABA are involved in leaf senescence following main-stem girdling.
DOI:10.7668/hbnxb.2014.05.037URL [本文引用: 1]
为了探讨不同熟性棉花品种之间是否存在钾效率和根系生长对钾缺乏响应差异,在室内水培条件下,以中熟/长季棉(百棉1号、鲁棉研28)和早熟/短季棉(中棉所50、百棉2号)为材料,将刚出苗的幼苗转移至含不同K浓度[钾缺乏(0.05 mmol/L)和钾充分(2.5 mmol/L)]的培养液中生长,于幼苗期开展研究。结果表明,幼苗在营养液中分别生长至7 d和13 d时,4个棉花品种的钾效率(钾缺乏条件下的幼苗干质量)和根系干质量及根系总长度、总表面积和总体积对钾缺乏响应方面均存在显著差异,但均没表现为长季棉类品种和短季棉类品种两大类别之间的一致性差异;4个品种的钾效率和根系生物参数(根干质量、根系总长度和总面积)呈正相关。13 d时,低钾对长季型棉花品种细根长度和面积的抑制率(61.8%~75.5%)明显高于短季型棉花品种百棉2号(47.7%~51.4%),并且明显提高了中棉所50的细根长度和面积;低钾对长季型棉花品种中根长度和面积的抑制率(40.7%~53.9%)也明显高于短季型棉花品种(18.0%~36.2%)。幼苗培养从7 d延长至13 d时,不论是高钾水平还是低钾水平下,细根长度和面积所占比例增加,中根长度和面积所占比例下降;低浓度钾条件下,2个短季型棉花品种的细根长度和面积所占比例上升幅度显著大于2个长季型棉花品种。因此,不同熟性棉花品种的细根生长对钾缺乏的响应存在差异性。
DOI:10.1080/01904160701289206URL [本文引用: 1]
DOI:10.2136/sssaj1989.03615995005300030030xURL [本文引用: 1]
[本文引用: 1]
[本文引用: 1]
DOI:10.1111/ppl.1984.62.issue-2URL [本文引用: 2]
[本文引用: 1]
[本文引用: 1]
[本文引用: 1]
[本文引用: 3]
DOI:10.1016/j.fcr.2015.03.012URL [本文引用: 1]
DOI:10.1371/journal.pone.0197284URLPMID:29750816 [本文引用: 1]
Cotton root growth can be affected by different nitrogen fertilizer rates. The objective of the present study was to quantify the effects of nitrogen fertilization rate on cotton root growth and distribution using minirhizotron and soil coring methods. A secondary objective was to evaluate the minirhizotron method as a tool for determining nitrogen application rates using the root distribution as an index. This study was conducted on a Bt cotton cultivar (Jimian 958) under four nitrogen fertilization rates, i.e., 0, 120, 240 and 480 kg ha(-1) (control, low, moderate and high levels, respectively), in the Yellow River basin of China from 2013-2015. The sampling process, details of each method as well as the root morphology and root distribution were measured. The operational processes, time and labor needed for the soil core method were all greater than those for the minirhizotron method. The total root length density and the length density in most soil layers, especially in the upper soil layers, first increased but then decreased as nitrogen fertilization increased, and the same trend was observed for both methods. Compared with N0, the total root length density under moderate nitrogen fertilization by the soil coring method increased by more than 94.82%, in 2014 and 61.11% in 2015; while by the minirhizotron method the corresponding values were 28.24% in 2014 and 57.47%, in 2015. Most roots were distributed in the shallow soil layers (0-60 cm) in each method. However, the root distribution with the soil coring method (>73.11%) was greater than that with the minirhizotron method (>47.07%). The correlations between the root morphology indexes of shallow soil depth measured using the two methods were generally significant, with correlative coefficients greater than 0.334. We concluded that the minirhizotron method could be used for cotton root analysis and most cotton roots distributed in upper soil layers (0-60cm). In addition, a moderate nitrogen rate (240 kg ha-1) could increase root growth, especially in the shallow soil layers. The differences observed with the minirhizotron method were clearer than those observed with the soil coring method.
DOI:10.2134/agronj2017.06.0310URL [本文引用: 2]
DOI:10.2134/agronj1987.00021962007900030006xURL [本文引用: 1]
DOI:10.1111/ppa.2005.54.issue-4URL [本文引用: 1]
[本文引用: 1]
[本文引用: 1]
