关键词:甜玉米; 果皮厚度; QTL; 上位性互作 Mapping and Epistatic Interactions of QTLs for Pericarp Thickness in Sweet Corn YU Yong-Tao, LI Gao-Ke, QI Xi-Tao, LI Chun-Yan, MAO Ji-Hua, HU Jian-Guang* Crop Research Institute, Guangdong Academy of Agricultural Sciences / Guangdong Provincial Key Laboratory of Crops Genetics and Improvement, Guangzhou 510640, China
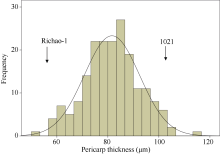
AbstractPericarp thickness is of great importance to the sensory quality of sweet corn. Mining the gene for pericarp thickness and understanding its genetic mechanism can provide a base for instructing breeding. Quantitative trait locus (QTL) for pericarp thickness was detected based on two genetic models using a population comprising 190 BC1F2 families derived from the cross of Richao-1 (thin pericarp, 56.57 μm) ×1021 (thick pericarp, 100.23 μm) in the present study. Three QTLs for pericarp thickness were identified on bin 3.01, 6.01, and 8.05 using the Composite interval mapping (CIM) method, explained 8.6%, 16.0%, and 7.2% of phenotypic variation, respectively. Based on the MCIM (mixed-model based CIM) method, we identified five QTLs for pericarp thickness, comprising one additive QTL and two pairs of epistatic QTLs. The additive QTL was located on bin 8.05. Additive × additive epistatic effects for pericarp thickness were showed between QTL in 2.01 and QTL in 6.05 with estimated 6.63% of the phenotypic variation and between QTL in 5.06 and QTL in 6.01 with the estimated phenotypic variation of 12.48%. The results indicated that epistasis and additive effects play an important role in the genetic basis of pericarp thickness. The MCIM model with the ability to detect epistatic QTLs is more suitable for pericarp thickness QTL mapping. In addition, candidate genes encoding proteins that play important role for pigment biosynthesis and cell transformation in endosperm were contained in four QTL regions of all, suggesting the likely relations between the expressions of these candidate genes and pericarp thickness variation.
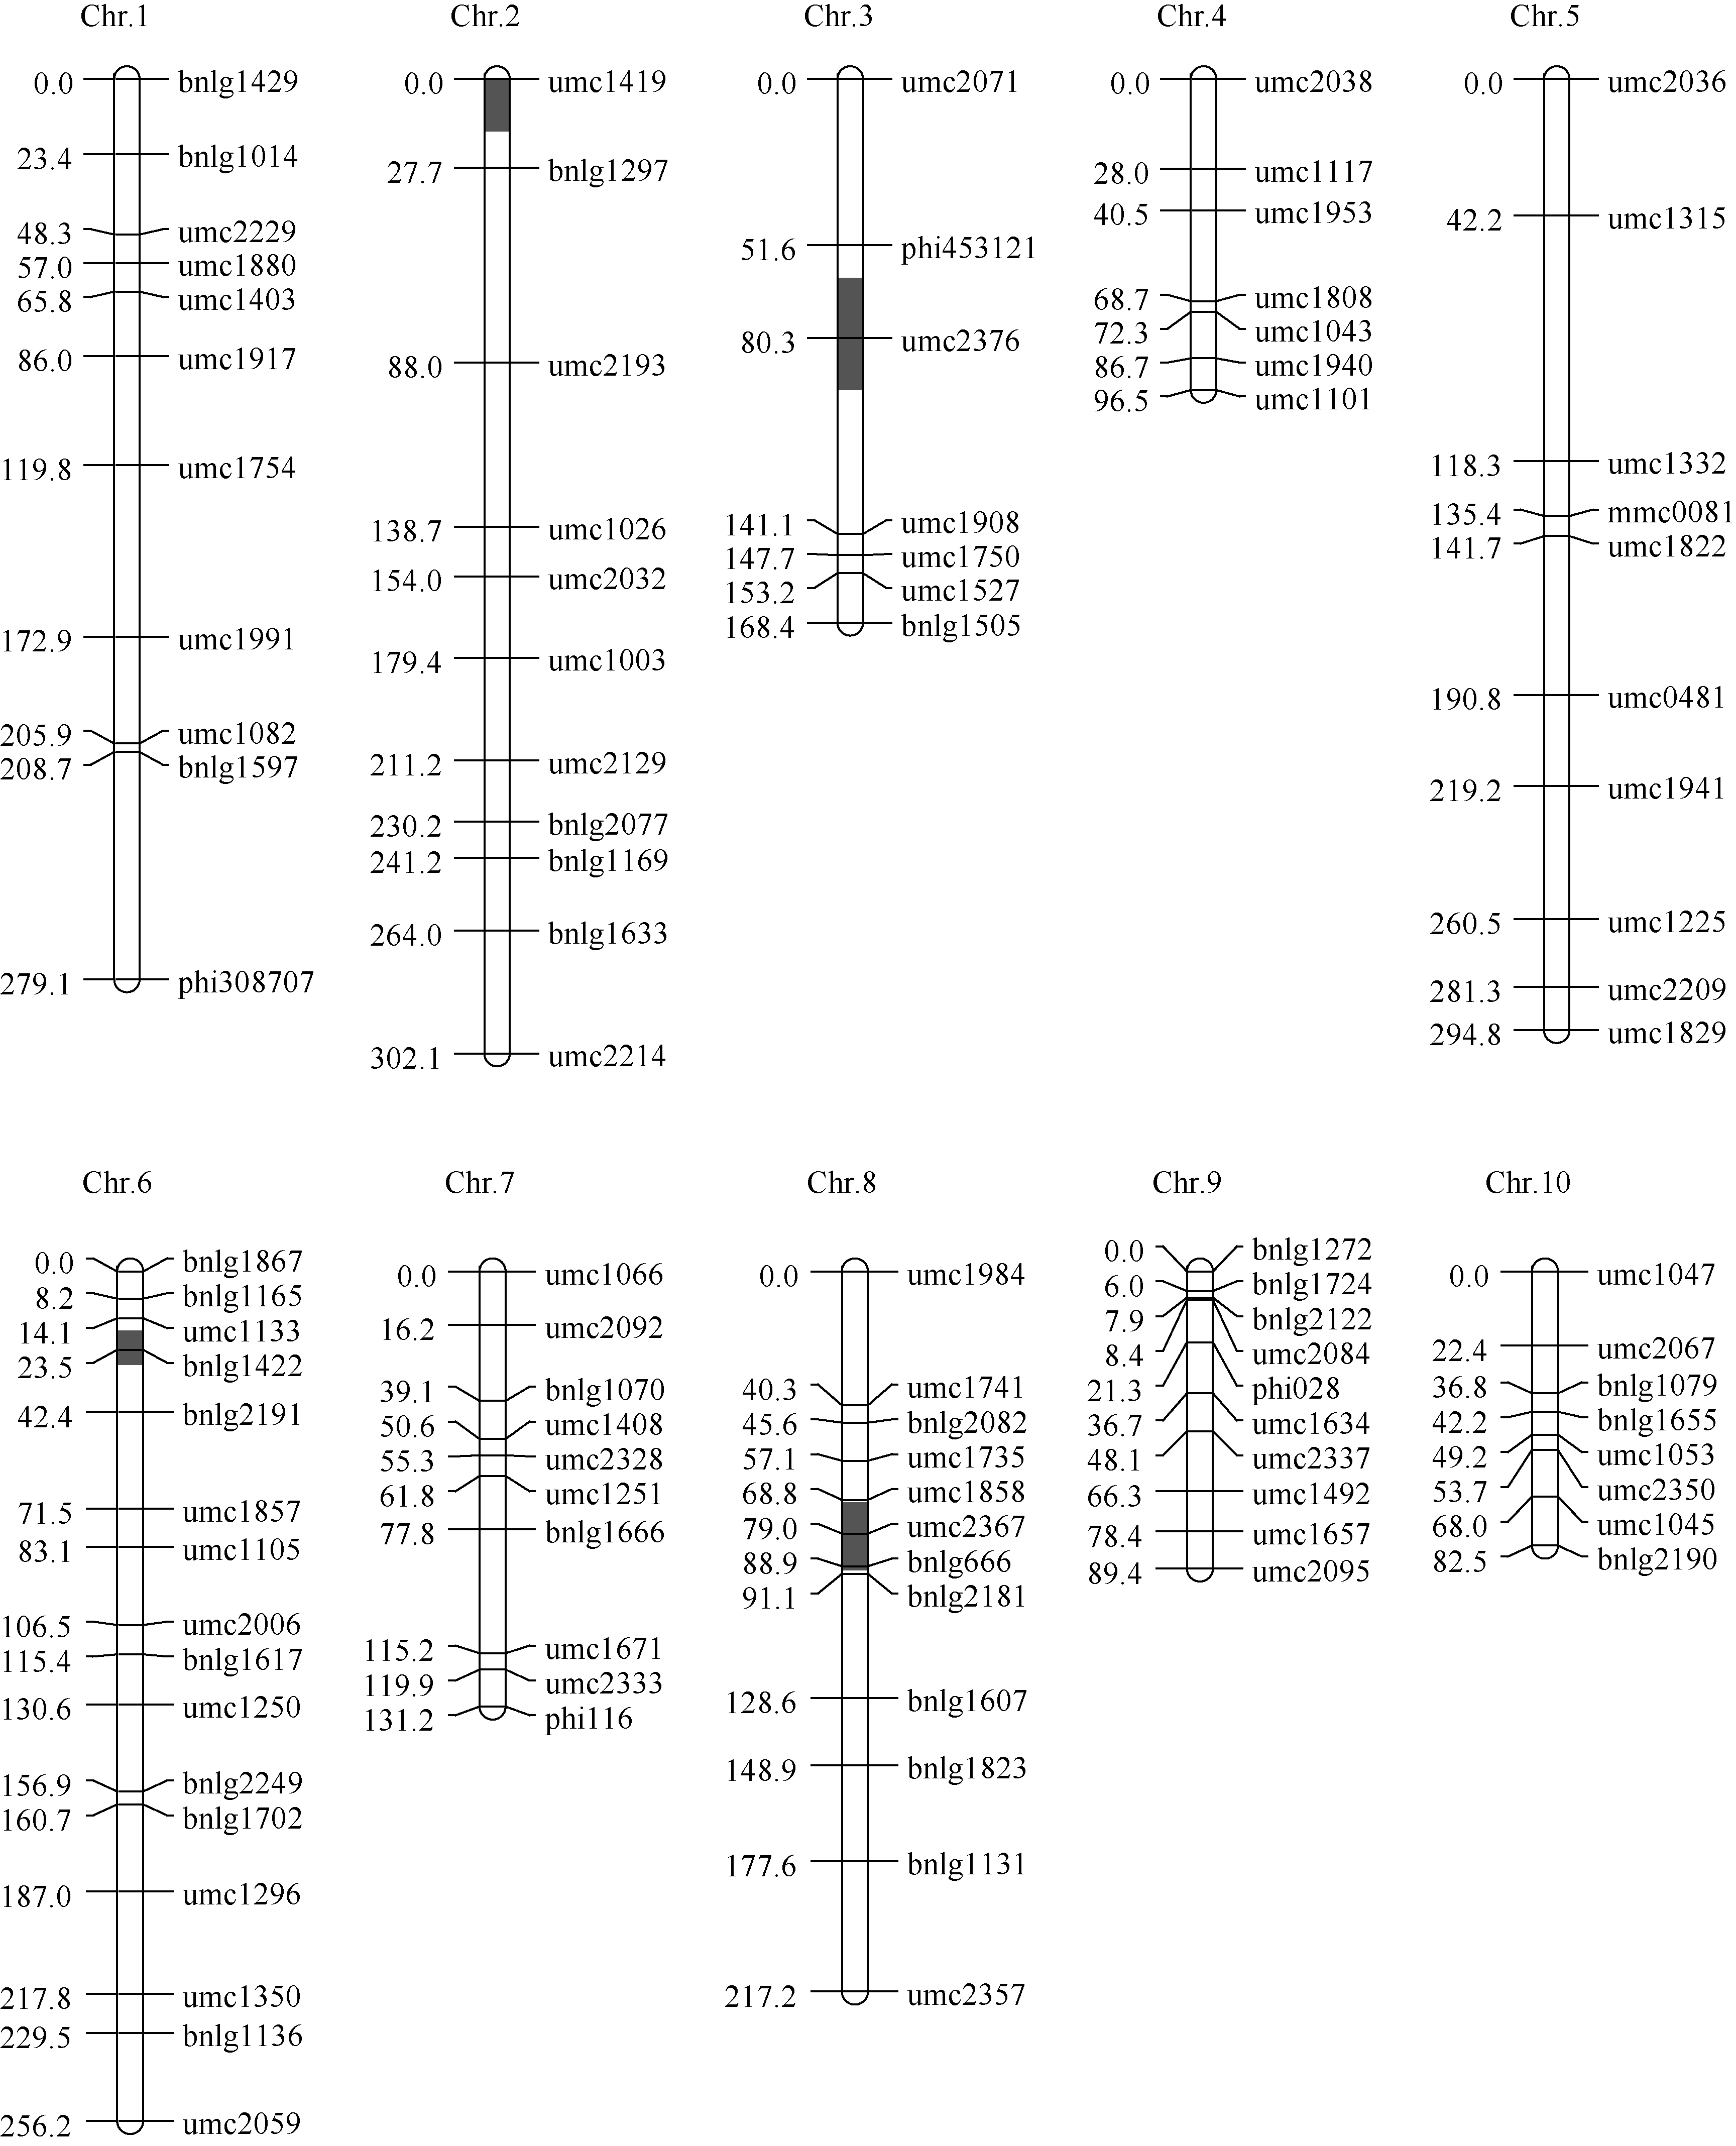
图2 基于日超-1× 10²¹的BC1F2群体的连锁图和果皮厚度QTL (灰色区段为QTL所在区域)Fig. 2 The linkage map based on the Richao-1× 10²¹ BC1F2population and QTLs for pericarp thickness (the gray bars show the support interval of QTL position)
表1 用PlabQTL软件检测到的果皮厚度QTL及相关遗传参数 Table 1 QTL and estimates of genetic effects for pericarp thickness by PlabQTL software
QTL
染色体区段 Chr./Bin.
峰值位置a Peak position (cM)
LOD
解释表型变异 Variance explained (R2)
加性效应 Additive
显性效应 Dominance
作用方式b Gene action
1
3.01
phi453121+22
3.73
8.6
0.026
0
A
2
6.01
umc1133+8
7.18
16.0
0.052
0.049
D
3
8.05
umc2367+1
3.10
7.2
0.020
0.009
PD
a Position of QTL peak is indicated by locus + centiMorgans from that locus toward the end of the long arm. b A: additive; PD: partial dominance; D: dominance. aQTL峰值位置, 用位点加上从该位点向长臂方向的遗传距离(cM)表示。bA: 加性效应, PD: 部分显性, D: 显性效应。
表1 用PlabQTL软件检测到的果皮厚度QTL及相关遗传参数 Table 1 QTL and estimates of genetic effects for pericarp thickness by PlabQTL software
表2 Table 2 表2(Table 2)
表2 用QTLNetwork软件检测到的果皮厚度性状加性QTL Table 2 Additive QTL for pericarp thickness by QTLNetwork software
QTLa)
区间 Interval
位置 Position
Ab)
h2(a)d)
8.05
umc2367-bnlg666
80.0
-4.0233* * c)
0.0822
a)QTL region is indicated by the chromosome bins; b)A indicates the estimated additive effect; c) * * indicates the P-value < 0.01; d)h2(a) indicates the heritability of additive effect. a)QTL所在区域以染色体的Bin值表示; b)A表示加性效应; c) * * 表示P值小于0.01; d)h2(a) 表示加性效应的遗传力。
表2 用QTLNetwork软件检测到的果皮厚度性状加性QTL Table 2 Additive QTL for pericarp thickness by QTLNetwork software
表3 Table 3 表3(Table 3)
表3 用QTLNetwork软件检测到的果皮厚度性状QTL上位性互作 Table 3 Epistatic interaction between QTLs for pericarp thickness by QTLNetwork software
QTL_ia)
区间Interval_i
位置Position_i
QTL_j
区间Interval_j
位置Position_j
AAb)
h2(aa)d)
2.01
umc1419-bnlg1297
0
6.05
umc1250-bnlg2249
148.6
4.1727* * c)
0.0663
5.06
umc1941-umc1225
219.2
6.01
bnlg1165-umc1133
8.2
5.0305* *
0.1248
a)QTL region is indicated by the chromosome bins. QTL_i and QTL_j are the two QTLs involved in epistatic interaction; b)AA indicates the estimated additive by additive effect; c) * * indicates the P-value < 0.01; d)h2(aa) indicates the heritability of additive by additive effect. a)QTL所在区域以染色体的Bin值表示。QTL_i和QTL_j为存在互作的1对QTL; b)AA表示QTL间的加× 加互作效应; c) * * 表示P值小于0.01; d)h2(aa)表示加× 加互作的遗传力。
表3 用QTLNetwork软件检测到的果皮厚度性状QTL上位性互作 Table 3 Epistatic interaction between QTLs for pericarp thickness by QTLNetwork software
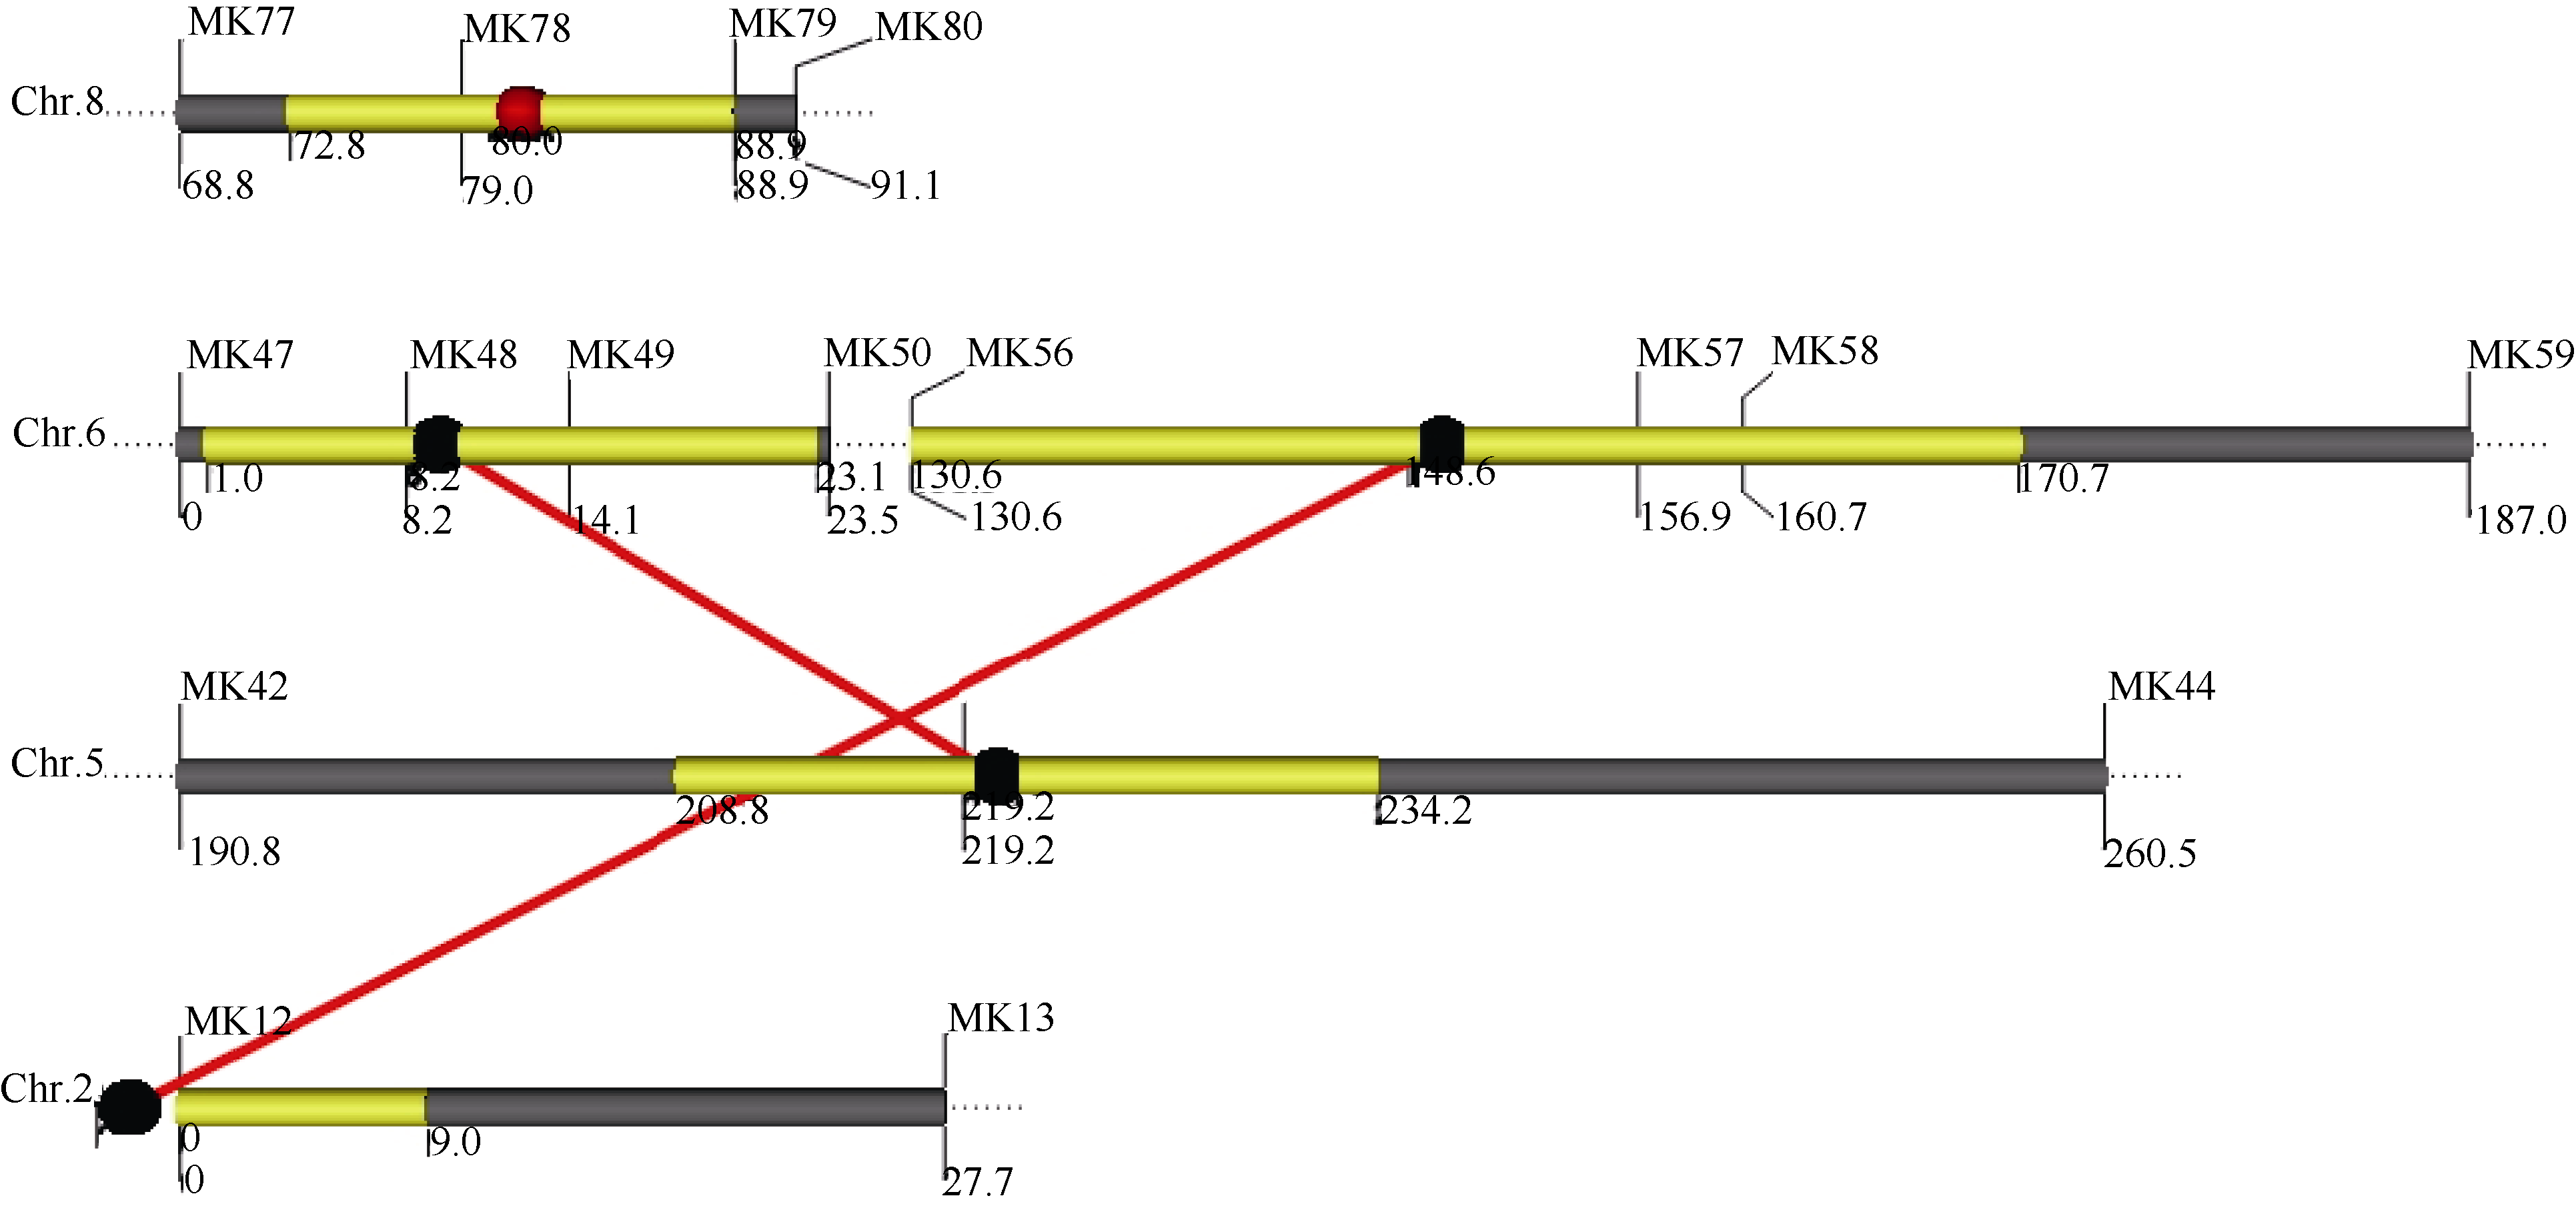
图3 图示果皮厚度上位性QTL间的遗传结构 实心球代表QTL位点, 红色代表加性效应, 黑色的代表无个体效应的成对上位性互作QTL, 黄色条代表QTL的支持区间。Fig. 3 Graphic presentation of the genetic architecture between epistatic QTLs for pericarp thickness The red ball represents QTL with additive effect. The black ball represents epistatic QTLs without individual effect while interacting loci are shown by red colored line. The yellow bar shows the support interval of QTL position.
4 结论共检测到6个QTL, 其中位于3.01、6.05和8.05的为共性位点, 位于3.01和8.05的为加性QTL, 位于6.05的QTL除了上位性以外主要为加性遗传效应, 它们应被用作甜玉米果皮厚度分子辅助选择的重要标记; 而另外4个QTL则分别表现上位性互作而成对存在, 表明加性效应和上位性互作效应在果皮厚度的形成和遗传中也发挥着重要作用。 The authors have declared that no competing interests exist.
Bailey DM, Bailey RM. The relationship of pericarp to tenderness in sweet corn. Proc Am Soc Hortic Sci, 1938, 36: 555-559[本文引用:1]
[2]
Ito GM, Brewbaker JL. Genetic advance through mass selection for tenderness in sweet corn. J Am Hortic Sci, 1981, 106: 496-499[本文引用:1][JCR: 1.122]
[3]
Hoenisch RW, Davis RM. Relationship between kernel pericarp thickness and susceptibility to Fusarium ear rot. Plant Dis, 1994, 78: 517-519[本文引用:1][JCR: 2.455]
[4]
Tracy WF, Galinai WC. Thickness and cell layer number of the pericarp of sweet corn and some of its relatives. HortScience, 1987, 22: 645-647[本文引用:1][JCR: 0.938]
[5]
Helm JL, Zuber MS. Inheritance of pericarp thickness in corn belt maize. Crop Sci, 1972, 12: 428-430[本文引用:4][JCR: 1.513]
[6]
Ho LC, KannenbergW, Hunter RB. Inheritance of pericarp thickness in short season maize inbreds. Can J Genet Cytol, 1975, 17: 621-629[本文引用:4]
[7]
Ito GM, Brewbaker JL. Genetic analysis of pericarp thickness in progenies of eight corn hybrids. J Am Soc Hortic Sci, 1991, 116: 1072-1077[本文引用:7][JCR: 1.122]
[8]
ChoeE, RochefordT. Marker assisted selection and breeding for desirable thinner pericarp thickness and ear traits in fresh market waxy corn germplasm. Euphytica, 2012, 183: 243-260[本文引用:5][JCR: 1.643]
王晓明, 谢振文, 曾慕衡, 乐素菊. 超甜玉米果穗形态和品质性状的杂种优势及遗传特性分析. 中国农业科学, 2005, 38: 1931-1936Wang XM, Xie ZW, Zeng MH, Le SJ. Heterosis and inheritance analysis of ear shape and quality characters in super sweet corn. Sci Agric Sin, 2005, 38: 1931-1936 (in Chinese with English abstract)[本文引用:2][CJCR: 1.889]
[11]
刘鹏飞, 蒋锋, 乐素菊, 张姿丽, 陈青春, 张媛, 王晓明. 甜玉米果皮厚度主基因+多基因遗传效应分析. 西北农林科技大学学报(自然科学版), 2013, 41(7): 43-48Liu PF, JiangF, Le SJ, Zhang ZL, Chen QC, ZhangY, Wang XM. Major genes and polygenes inheritance for pericarp thickness of sweet corn. J Northwest A&F Univ (Nat Sci Edn), 2013, 41(7): 43-48 (in Chinese with English abstract)[本文引用:1]
[12]
WangB, Brewbaker JL. Quantitative trait loci affecting pericarp thickness of corn kernels. Maydica, 2001, 46: 159-165[本文引用:3][JCR: 0.368]
[13]
李余良, 林瑞德, 胡建广, 刘建华. 用显微测微尺测定超甜玉米果皮厚度初报. 广东农业科学, 2004, (增刊): 48-49Li LY, Lin RD, Hu JG, Liu JH. A preliminary report on pericarp thickness determination by micrometer in sweet corn. Guangdong Agric Sci, 2004, (suppl): 48-49 (in Chinese)[本文引用:1][CJCR: 0.6672]
[14]
Saghai-Maroof MA, Soliman KM, Jorgensen RA, Allard RW. Ribosomal DNA spacer-length polymorphisms in barley: mendelian inheritance, chromosomal location, and population dynamics. Proc Natl Acad Sci USA, 1984, 81: 8014-8018[本文引用:1][JCR: 9.737]
[15]
Sanguinetti CJ, Neto ED, Simpson A J G. Rapid silver staining and recovery of PCR products separated on polyacrylamide gels. BioTechniques, 1994, 17: 914-921[本文引用:1][JCR: 2.399]
[16]
Land er ES, GreenP, AbrahamsonJ, BarlowA, Daly MJ, Lincoln SE, Newberg LA. MAPMAKER: an interactive computer package for constructing primary genetic linkage maps of experimental and natural populations. Genomics, 1987, 1: 174-181[本文引用:1][JCR: 3.01]
[17]
Lincoln SE, Daly MJ, Land er ES. Mapping Genes Controlling Quantitative Traits Using MAPMAKER/QTL. Whitehead Institute for Biomedical Research, Cambridge, MA. 1993[本文引用:1]
[18]
Voorrips RE. MapChart: software for the graphical presentation of linkage maps and QTLs. J Hered, 2002, 93: 77-78[本文引用:1][JCR: 1.995]
[19]
苏成付, 赵团结, 盖钧镒. 不同统计遗传模型QTL定位方法应用效果的模拟比较. 作物学报, 2010, 36: 1100-1107Su CF, Zhao TJ, Gai JY. Simulation comparisons of effectiveness among QTL mapping procedures of different statistical genetic models. Acta Agron Sin, 2010, 36: 1100-1107 (in Chinese with English abstract)[本文引用:1][CJCR: 1.667]
[20]
Utz HF, Melchinger AE. PlabQTL: a program for composite interval mapping of QTL. J Agric Genomics, 1996, 2: 1-5[本文引用:1]
[21]
Edwards MD, Stuber CW, Wendel JF. Molecular-marker- facilitated investigations of quantitative trait loci in maize: I. Numbers, genomic distribution and types of gene action. Genetics, 1987, 116: 113-125[本文引用:1][JCR: 4.389]
[22]
YangJ, ZhuJ, Williams RW. Mapping the genetic architecture of complex traits in experimental populations. Bioinformatics, 2007, 23: 1527-1536[本文引用:1][JCR: 5.323]
[23]
YangJ, Hu CC, HuH, Yu RD, XiaZ, Ye XZ, ZhuJ. QTLNetwork: mapping and visualizing genetic architecture of complex traits in experimental populations. Bioinformatics, 2008, 24: 721-723[本文引用:1][JCR: 5.323]
[24]
Helm JL, Zuber MS. Effect of harvest date on pericarp thickness in dent corn. Can J Plant Sci, 1970, 50: 411-413[本文引用:1][JCR: 0.716]
[25]
张士龙, 周淑梅, 王青峰, 李小琴. 玉米籽粒果皮厚度变化规律研究. 华南农业大学学报, 2008, 29(1): 10-13Zhang SL, Zhou SM, Wang QF, Li XQ. Research on variation of pericarp thickness of sweet maize kernel. J South China Agric Univ, 2008, 29(1): 10-13 (in Chinese with English abstract)[本文引用:1][CJCR: 0.686]
[26]
乐素菊, 肖德兴, 刘鹏飞, 曾慕衡, 王伟权, 王晓明. 超甜玉米果皮结构与籽粒柔嫩性的关系. 作物学报, 2011, 37: 2111-2116Yue SJ, Xiao DX, Liu PF, Zeng MH, Wang WQ, Wang XM. Relationship between pericarp structure and kernel tenderness in super sweet corn. Acta Agron Sin, 2011, 37: 2111-2116 (in Chinese with English abstract)[本文引用:1][CJCR: 1.667]
[27]
姚坚强, 俞琦英, 王美兴, 张莲英, 朱金庆. 春播超甜玉米籽粒果皮厚度与可溶性总糖含量在灌浆期间的变化. 浙江农业学报, 2012, 24: 193-196Yao JQ, Yu QY, Wang MX, Zhang LY, Zhu JQ. Changes of pericarp thickness and soluble sugar during the kernel filling process of spring super-sweet corn. Acta Agric Zhejiangensis, 2012, 24: 193-196 (in Chinese with English abstract)[本文引用:1][CJCR: 0.602]
[28]
Brewbaker JL, Larish LB, Zan GH. Pericarp thickness of the indigenous American races of maize. Maydica, 1996, 41: 105-111[本文引用:2][JCR: 0.368]
Li ZK, Luo LJ, Mei HW, Wang DL, Shu QY, TabienR, Zhong DB, Ying CS, Stansel JW, Khush GS, Paterson AH. Overdominant epistatic loci are the primary genetic basis of inbreeding depression and heterosis in rice: I. Biomass and grain yield. Genetics, 2001, 158: 1737-1753[本文引用:1][JCR: 4.389]
[31]
CarlborgO, Haley CS. Epistasis: too often neglected in complex trait studies?Nat Rev Genet, 2004, 5: 618-625[本文引用:1][JCR: 41.063]
[32]
GómezE, RoyoJ, Muñiz LM, SellamO, PaulW, GerentesD, BarreroC, LópezM, PerezP, HuerosG. The maize transcription factor myb-related protein-1 is a key regulator of the differentiation of transfer cells. Plant Cell, 2009, 21: 2022-2035[本文引用:1][JCR: 9.251]
[33]
Selinger DA, Chand ler VL. A mutation in the pale aleurone color1 gene identifies a novel regulator of the maize anthocyanin pathway. Plant Cell, 1999, 11: 5-14[本文引用:1][JCR: 9.251]
[34]
CareyC, Strahle JT, SelingerD, Chand lerV. Mutations in the pale aleurone color 1 regulatory gene of the Zea mays anthocyanin pathway have distinct phenotypes relative to the functionally similar TRANSPARENT TESTA GLABRA1 gene in Arabidopsis thaliana. Plant Cell, 2004, 16: 450-464[本文引用:1][JCR: 9.251]
[35]
BucknerB, Miquel PS, Janick-BucknerD, Bennetzen JL. The y1 gene of maize codes for phytoene synthase. Genetics, 1996, 143: 479-488[本文引用:1][JCR: 4.389]
[36]
MatusovaR, RaniK, Verstappen F W A, Franssen M C R, Beale M H, Bouwmeester H J. The strigolactone germination stimulants of the plant-parasitic Striga and Orobanche spp. are derived from the carotenoid pathway. Plant Physiol, 2005, 130: 920-934[本文引用:1][JCR: 6.555]


