1.School of Bioinformatics, Chongqing University of Posts and Telecommunications, Chongqing 400065, China 2.School of Life Science and Technology, Xi’an Jiaotong University, Xi’an 710049, China
Fund Project:Project supported by the National Natural Science Foundation of China (Grant Nos. 11904042, 82061148015), the Natural Science Foundation of Chongqing, China (Grant No. cstc2019jcyj-msxmX0534), and the Science and Technology Research Program of Chongqing Municipal Education Commission, China (Grant No. KJQN202000617)
Received Date:26 January 2021
Accepted Date:14 March 2021
Available Online:07 June 2021
Published Online:05 August 2021
Abstract:Ultrasound-induced cavitation in the viscoelastic biological tissues has attracted considerable attention due to its mechanical bio-effects, such as cell sonoporation, hemolysis, vascular disruption and tissue erosion. Cavitation can exert strong mechanical stresses on the surrounding tissues during the rapid bubble growth and collapse. The occurrence of cavitation needs the ultrasound exposure exceeding a certain acoustic pressure threshold, and the cavitation threshold is very high in most tissues, probably causing undesirable side-effects. Introducing artificial cavitation nuclei, e.g., microbubbles and nanodroplets stabilized with a shell such as albumin, lipids or polymers, into the targeted region can effectively reduce the cavitation threshold and significantly enhance the cavitation effects. However, neither the cavitation dynamics of an encapsulated microbubble nor the cavitation-induced stress field around the bubble in a soft tissue is quite clear. In this study, a comprehensive numerical model is developed to describe the dynamics of a lipid-shelled microbubble in vivo and quantify the cavitation-induced mechanical stress in the tissue. Considering the nonlinear changes of both shell viscosity and elasticity, a Gilmore model that has been considered as the most developed and realistic cavitation model is coupled with the Zener viscoelastic model for precisely describing tissue viscoelastic behavior with both creep recovery and stress relaxation of tissue. The developed model has an advantage of accurately describing the bubble behaviors in different biological tissues at high ultrasound intensities, especially for the bubble collapse. Furthermore, the spatiotemporal evolution of mechanical stress in the surrounding tissue generated by the cavitation bubble is investigated. Finally, the effects of encapsulated shell, elasticity modulus and viscosity of tissue as well as ultrasound amplitude are examined. The results show that the viscoelasticity of encapsulated shell and tissue both inhibit the bubble oscillations, and the tissue viscoelasticity has a larger inhibition effect. During the bubble oscillation, the compressive (negative) stress is generated in the tissue with the bubble growing and it continuously increases until it reaches a maximum value at a maximum radius, while the tensile (positive) stress is generated at the stage of bubble collapse and initial stage of bubble rebound due to the restoration of deformed tissue. The stress magnitude is greatest near the bubble wall and decreases rapidly with depth extending into the surrounding tissue. By contrast, the tensile stress decreases at a higher rate than the compressive stress. The encapsulated bubble presents a smaller stress in the tissue, but the decrease of the stress can be ignored at large acoustic pressures. Moreover, the stress decreases with the increase of tissue elasticity modulus, whereas it first increases and then decreases with tissue viscosity increasing, showing a maximum at 15 mPa·s. The increasing of the ultrasound amplitude enhances the bubble oscillations and consequently increases the stress in the tissue. This study is helpful in understanding the bubble dynamics and cavitation-induced mechanical stress of an encapsulated microbubble in soft tissue, which is essential for a safe and precise ultrasound therapy. Keywords:bubble dynamics/ encapsulated microbubble/ acoustic cavitation in soft tissue/ mechanical effect of cavitation
考虑单个微泡在黏弹性生物组织内的声空化动力学行为以及组织内应力的时空分布$ {\tau }_{rr}(r, t) $, 如图1所示. 声空化过程中, 假设微泡仍然保持球形、微泡内部压力和温度均匀分布、微泡内气体满足理想气体定理以及微泡与周围介质间无物质交换. 本文选用适用性更广的Gilmore方程描述声空化动力学[18,19]: 图 1 黏弹性组织内微泡动力学与应力示意图 Figure1. Schematic of the bubble dynamics and stress in the viscoelastic tissue.
同时考虑微泡周围生物组织和微泡包膜的黏弹特性, 构建的理论模型(模型I)可描述临床常用脂类包膜微泡在生物组织内的声空化动力学行为. 该模型也可通过参数设置简化为生物组织内无包膜微泡(模型II)、牛顿流体水中脂类包膜微泡和无包膜微泡的动力学模型(模型III和IV), 表明该模型具有更广泛的适用性. 图2对比研究了脂类包膜微泡、无包膜微泡分别在生物组织和牛顿流体水中的声空化动力学行为, 阐释了组织和包膜黏弹性对微泡声空化动力学行为的影响, 并验证模型的适用性. 图2(a)和图2(b)分别给出了超声声压pA = 0.1 MPa时, 微泡半径和振动速度随时间的变化曲线. 从图2(a)和图2(b)可以看出, 微泡在水中的振动幅度和振动速度都明显大于微泡在生物组织内的振动幅度和振动速度, 这表明生物组织黏弹性限制了微泡的声空化振动过程. 对于包膜材料黏弹性的影响, 对比发现包膜微泡振动呈现出明显的“仅压缩”行为, 且包膜微泡的振动幅度、振动速度都明显小于无包膜微泡, 这也说明包膜材料的黏弹性会减弱微泡的声空化振动过程. 图2(c)和图2(d)分别给出了pA = 1 MPa时, 微泡半径和振动速度随时间的变化曲线. 同样地, 组织和包膜的黏弹性都会减弱微泡声空化的振动幅度和振动速度. 图 2 不同条件下微泡声空化动力学行为 (a), (b)和(c), (d)分别表示pA为0.1 和1 MPa时, 微泡半径和振动速度随时间的变化曲线. I—IV分别表示组织内(I)脂类和(II)无包膜微泡、水中(III)脂类和(IV)无包膜微泡声空化动力学模型 Figure2. Bubble dynamics under different conditions. Panels (a), (b) and (c), (d) show the bubble radius and bubble wall velocity at pA = 0.1 MPa and pA = 1 MPa, respectively. The model I and II simulate a shelled microbubble and a clean microbubble oscillating in soft tissue, while the model III and IV in liquid water.
图3给出了组织内微泡声空化过程中, 微泡周围组织内应力随时间t和距离r的变化. 从图3(a)可清楚地看出, 组织内微泡在超声波作用下发生周期性膨胀与收缩的振动过程; 在微泡膨胀阶段, 微泡对周围组织造成挤压, 产生较大的挤压应力(负应力), 而在微泡收缩阶段, 微泡膨胀导致的形变组织会恢复到初始状态, 组织内产生较大的拉伸应力(正应力). 假设某一粒子(比如细胞)与微泡中心的初始间距为d0, 如图1所示, 根据质量守恒原则, 在微泡声空化过程中该粒子与微泡中心间距d可以表示为$d\left(t\right)=\sqrt[\root{4}{3}]{{d}_{0}^{3}+{R\left(t\right)}^{3}-{R}_{0}^{3}}$[11]. 图3(a)给出了在微泡声空化过程中3个粒子(d0 = 2, 6 和11 μm)与微泡中心间距d随时间的变化曲线, 在微泡膨胀阶段d逐渐增大, 在收缩阶段d逐渐减小. 图3(b)给出了3个粒子所受应力随时间的变化曲线. 组织内距离微泡中心较近(2 μm)的粒子所受应力最大, 挤压应力最大值为0.42 MPa, 拉伸应力最大值可达1.52 MPa. 随着d0增加, 组织内粒子所受到的应力急剧减小, 当d0 = 11 μm时, 挤压应力最大值减小为0.03 MPa, 拉伸应力最大值减小为0.015 MPa. 图 3 组织内微泡声空化过程中, 微泡周围组织内机械应力的时间演化和空间分布 (a)微泡声空化动力学与组织内应力的时空分布, 实线、虚线和点线分别为d0 = 2, 6和11 μm粒子的运动轨迹; (b) 3个粒子所受应力随时间的变化曲线; (c)不同时刻(图(a)中点线所示)组织内应力的空间分布, 蓝色和红色实线分别表示挤压应力和拉伸应力 Figure3. Temporal and spatial evolution of the mechanical stress distribution during acoustic cavitation in the tissue: (a) The bubble dynamics and spatiotemporal stress distribution, in which solid line, dashed line and dotted line correspond to the trajectories starting at 2, 6 and 11 μm from the bubble center, respectively; (b) the stress magnitudes as a function of time along each trajectory; (c) the stress distribution at the fixed times as indicated by vertical dotted lines in panel (a), with traces indicating the magnitudes of compressive stresses (solid blue) and tensile stresses (solid red).
图5给出了组织内无包膜和脂类包膜微泡在声压pA = 0.1 MPa和pA = 1 MPa下, 微泡的声空化动力学行为以及微泡周围组织内应力的时空分布. 在较低声压条件下, 对比图5(a)无包膜和图5(b)脂类包膜微泡的声空化动力学, 发现脂类包膜微泡的振动幅度更小且呈现出明显的“仅压缩”行为. 图5(c)给出了组织内最大挤压应力和最大拉伸应力随距离d0的变化曲线, 可以明显看出组织内应力都随着距离增大而逐渐减小. 对比相同距离处的应力可发现包膜微泡声空化在周围组织内产生的应力明显小于无包膜微泡声空化产生的应力, 其中微泡膨胀阶段产生的挤压应力减弱程度更大, 这表明脂类微泡“仅压缩”行为限制了微泡膨胀, 减小了组织应变γrr, 进而减小了微泡声空化在周围组织产生的挤压应力. 图 5 微泡包膜对声空化动力学和组织内应力的影响, 包括pA = 0.1 MPa时, 组织内(a)无包膜微泡和(b)脂类包膜微泡的声空化动力学以及微泡周围应力的时空分布; pA = 1 MPa时, 组织内(d)无包膜微泡和(e)脂类包膜微泡的声空化动力学以及微泡周围应力的时空分布; (c)和(f)表示对应的最大挤压应力和最大拉伸应力随d0的变化曲线 Figure5. Effects of bubble shell on the bubble dynamics and stress distributions in the tissues, including (a) the clean bubble and (b) shelled bubble at pA = 0.1 MPa, (d) the clean bubble and (e) shelled bubble at pA = 1 MPa; panels (c) and (f) show the corresponding maximum compressive stresses and tensile stresses, respectively.
图6(a)给出了不同弹性模量(G = 10, 100, 200, 500和1000 kPa)时, 组织内脂类包膜微泡半径随时间的变化曲线. 从图6(a)可以明显看出, 随着弹性模量G增大, 微泡的振动幅度和振动周期明显减小, 这说明弹性模量较大的组织(如病变的肝脏)将抑制微泡声空化振动过程. 图6(b)给出了不同d0处(2, 6和11 μm)粒子所受最大挤压应力和最大拉伸应力随组织弹性模量G的变化曲线. 从图6(b)可以看出: 组织内最大挤压应力和最大拉伸应力都随着d0增大而明显减小; 随着组织弹性模量G增大, 最大挤压应力和最大拉伸应力都逐渐减小, 这是因为组织的弹性模量增大限制了微泡声空化振动过程, 进而减弱了声空化对周围组织的机械力作用. 图6(c)给出了不同组织黏度(μ = 1, 5, 15, 50和100 mPa·s)时, 组织内脂类包膜微泡半径随时间的变化曲线. 随着组织黏度μ增大, 微泡的振动幅度和振动周期明显减小. 介质黏度增大使得微泡振动时需要克服介质中越来越大的分子间引力, 因此在黏度较大的介质中微泡比较难振动. 图6(d)给出了组织内不同d0处(2, 6和11 μm)粒子所受最大挤压应力和最大拉伸应力随组织黏度μ的变化曲线. 由图6(d)可知: 随着d0增大, 组织内最大挤压应力和最大拉伸应力都逐渐减小; 随着组织黏度μ增大, 最大挤压应力和最大拉伸应力先增大后减小, 在μ = 15 mPa·s时达到最大值. 图 6 (a)不同组织弹性模量(G = 10, 100, 200, 500和1000 kPa)下, 组织内微泡半径随时间的变化关系, (b)组织内不同d0处(2, 6和11 μm)粒子所受最大挤压应力和最大拉伸应力随组织弹性模量G的变化关系; (c)不同组织黏度(μ = 1, 5, 15, 50和100 mPa·s)下, 组织内微泡半径随时间的变化关系, (d)组织内不同d0处(2, 6和11 μm)粒子所受最大挤压应力和最大拉伸应力随组织黏度μ的变化关系 Figure6. (a) Bubble radius as a function of time, (b) maximum compressive and tensile stresses at different distances (d0 = 2, 6 and 11 μm) in tissues under different shear moduli (G = 10, 100, 200, 500 and 1000 kPa); (c) the bubble radius as a function of time, (d) maximum compressive and tensile stresses at different distances (d0 = 2, 6 and 11 μm) in tissues under different viscosities (μ = 1, 5, 15, 50 and 100 mPa·s).
33.3.3.超声声压的影响 -->
3.3.3.超声声压的影响
图7给出了超声声压变化(pA = 0.1—5 MPa)对组织内微泡声空化动力学以及应力的影响. 如图7(a)所示, 随着激励超声声压增大, 组织内微泡振动幅度明显增大, 声压从0.1 MPa增至5 MPa时微泡最大半径Rmax从1.016 μm增至24.45 μm. 图7(b)给出了Rmax、微泡最小半径Rmin和微泡膨胀-压缩比ΔR+/ΔR–(见插图)随声压变化的曲线. 当声压较小(pA < 0.3 MPa)时, 微泡膨胀幅度明显小于压缩幅度(ΔR+/ΔR– < 1), 呈现出脂类包膜微泡典型的“仅压缩”行为; 随着声压增大, 微泡膨胀幅度明显大于压缩幅度(ΔR+/ΔR– > 1), 说明脂类包膜微泡典型的“仅压缩”行为仅在激励声压较小的情况下出现. 因为较高声压下的微泡剧烈膨胀可导致其脂类包膜发生破裂, 使得“仅压缩”行为消失; 同时, 较高声压下微泡非线性动力学行为更显著, 从而微泡膨胀程度远大于压缩程度. 该现象与水中脂类包膜微泡声空化动力学行为类似[29]. 图7(c)和图7(d)分别给出了组织内不同d0处粒子所受最大挤压应力和最大拉伸应力随激励超声声压的变化曲线. 从图7(c)和图7(d)可以清楚地看出: 随着超声声压增大, 最大挤压应力和最大拉伸应力都增大; 随着d0增大, 粒子所受应力逐渐减小, 其中拉伸应力减小程度比挤压应力更大. 图 7 (a)不同超声声压(0.1—5 MPa)下, 微泡半径R随时间的变化关系; (b)微泡最大半径Rmax、最小半径Rmin和微泡膨胀-压缩比ΔR+/ΔR– (见插图)随超声声压的变化关系; 组织内不同d0处(2, 6和11 μm)粒子所受(c)最大挤压应力和(d)最大拉伸应力随超声声压的变化关系 Figure7. (a) Bubble radius as a function of time at different ultrasound pressures (0.1?5 MPa); (b) the maximum bubble radius Rmax, minimum bubble radius Rmin and the ratio ΔR+/ΔR– of the positive and negative radius excursions as a function of ultrasound pressure; (c) maximum compressive stresses and (d) maximum tensile stresses in tissues at three distances (d0 = 2, 6 and 11 μm) as a function of ultrasound pressure.


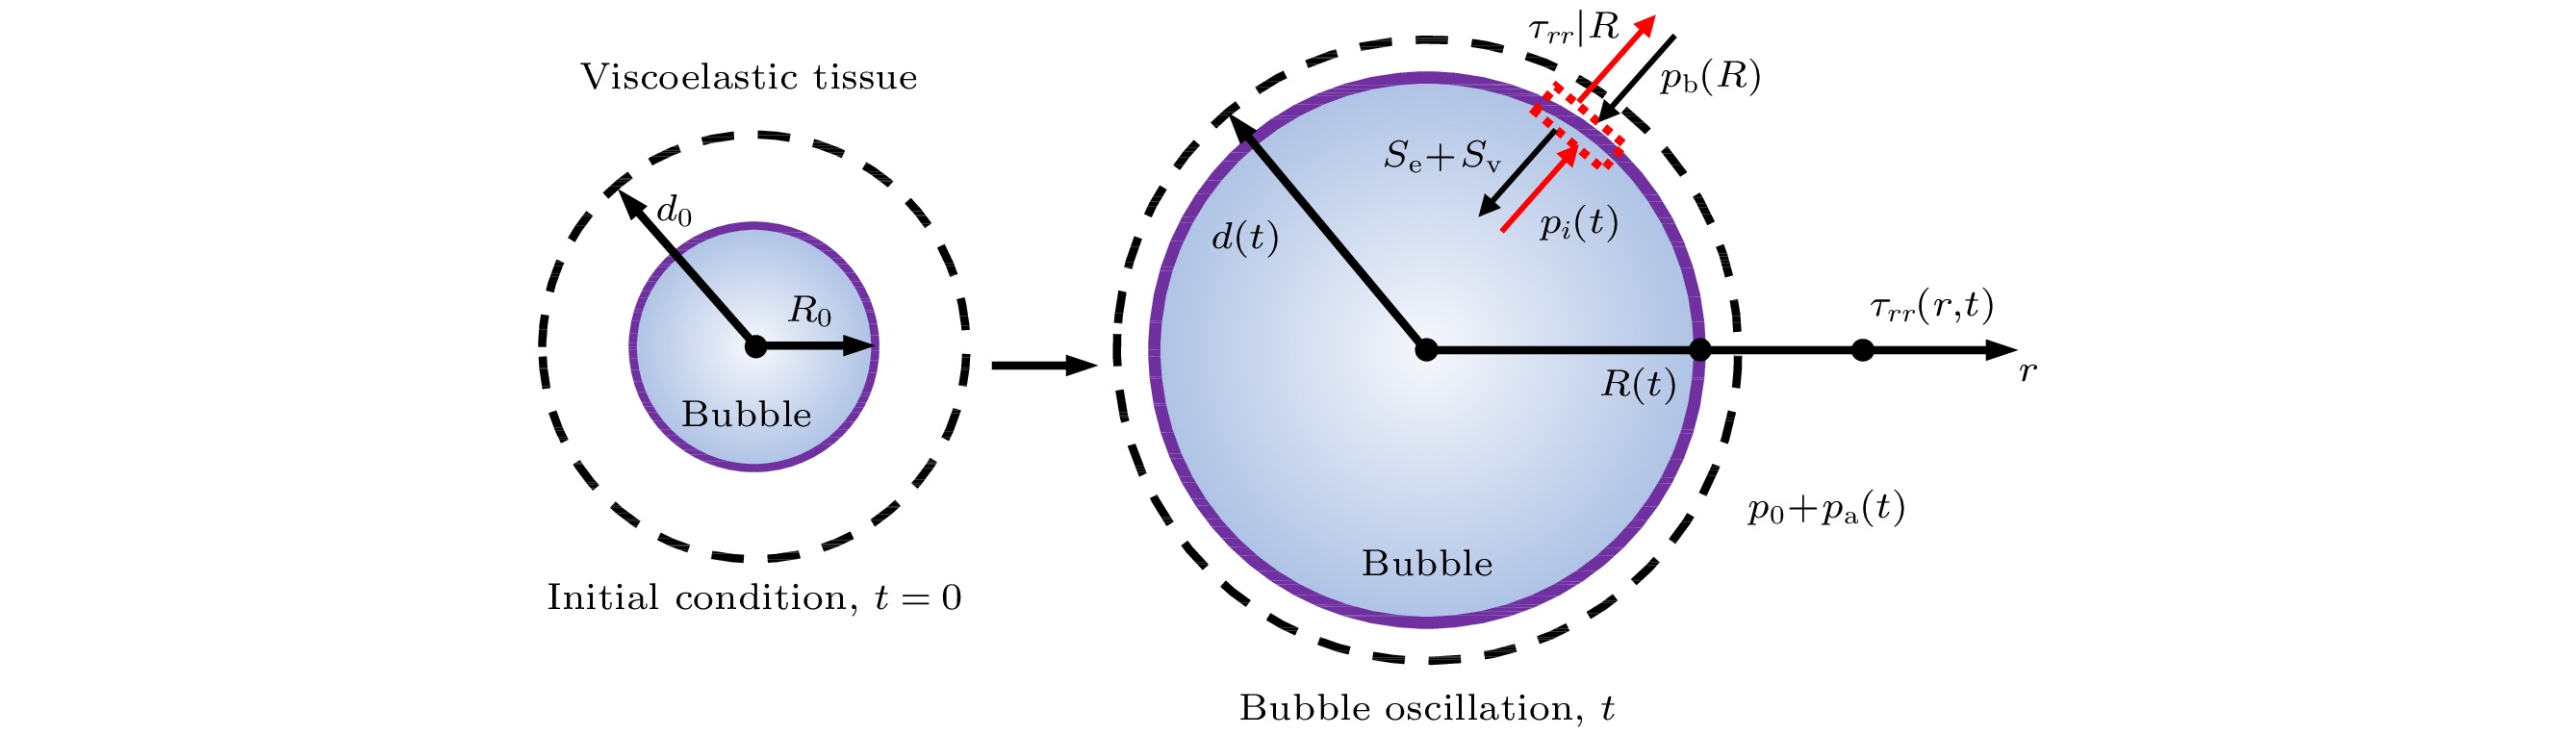 图 1 黏弹性组织内微泡动力学与应力示意图


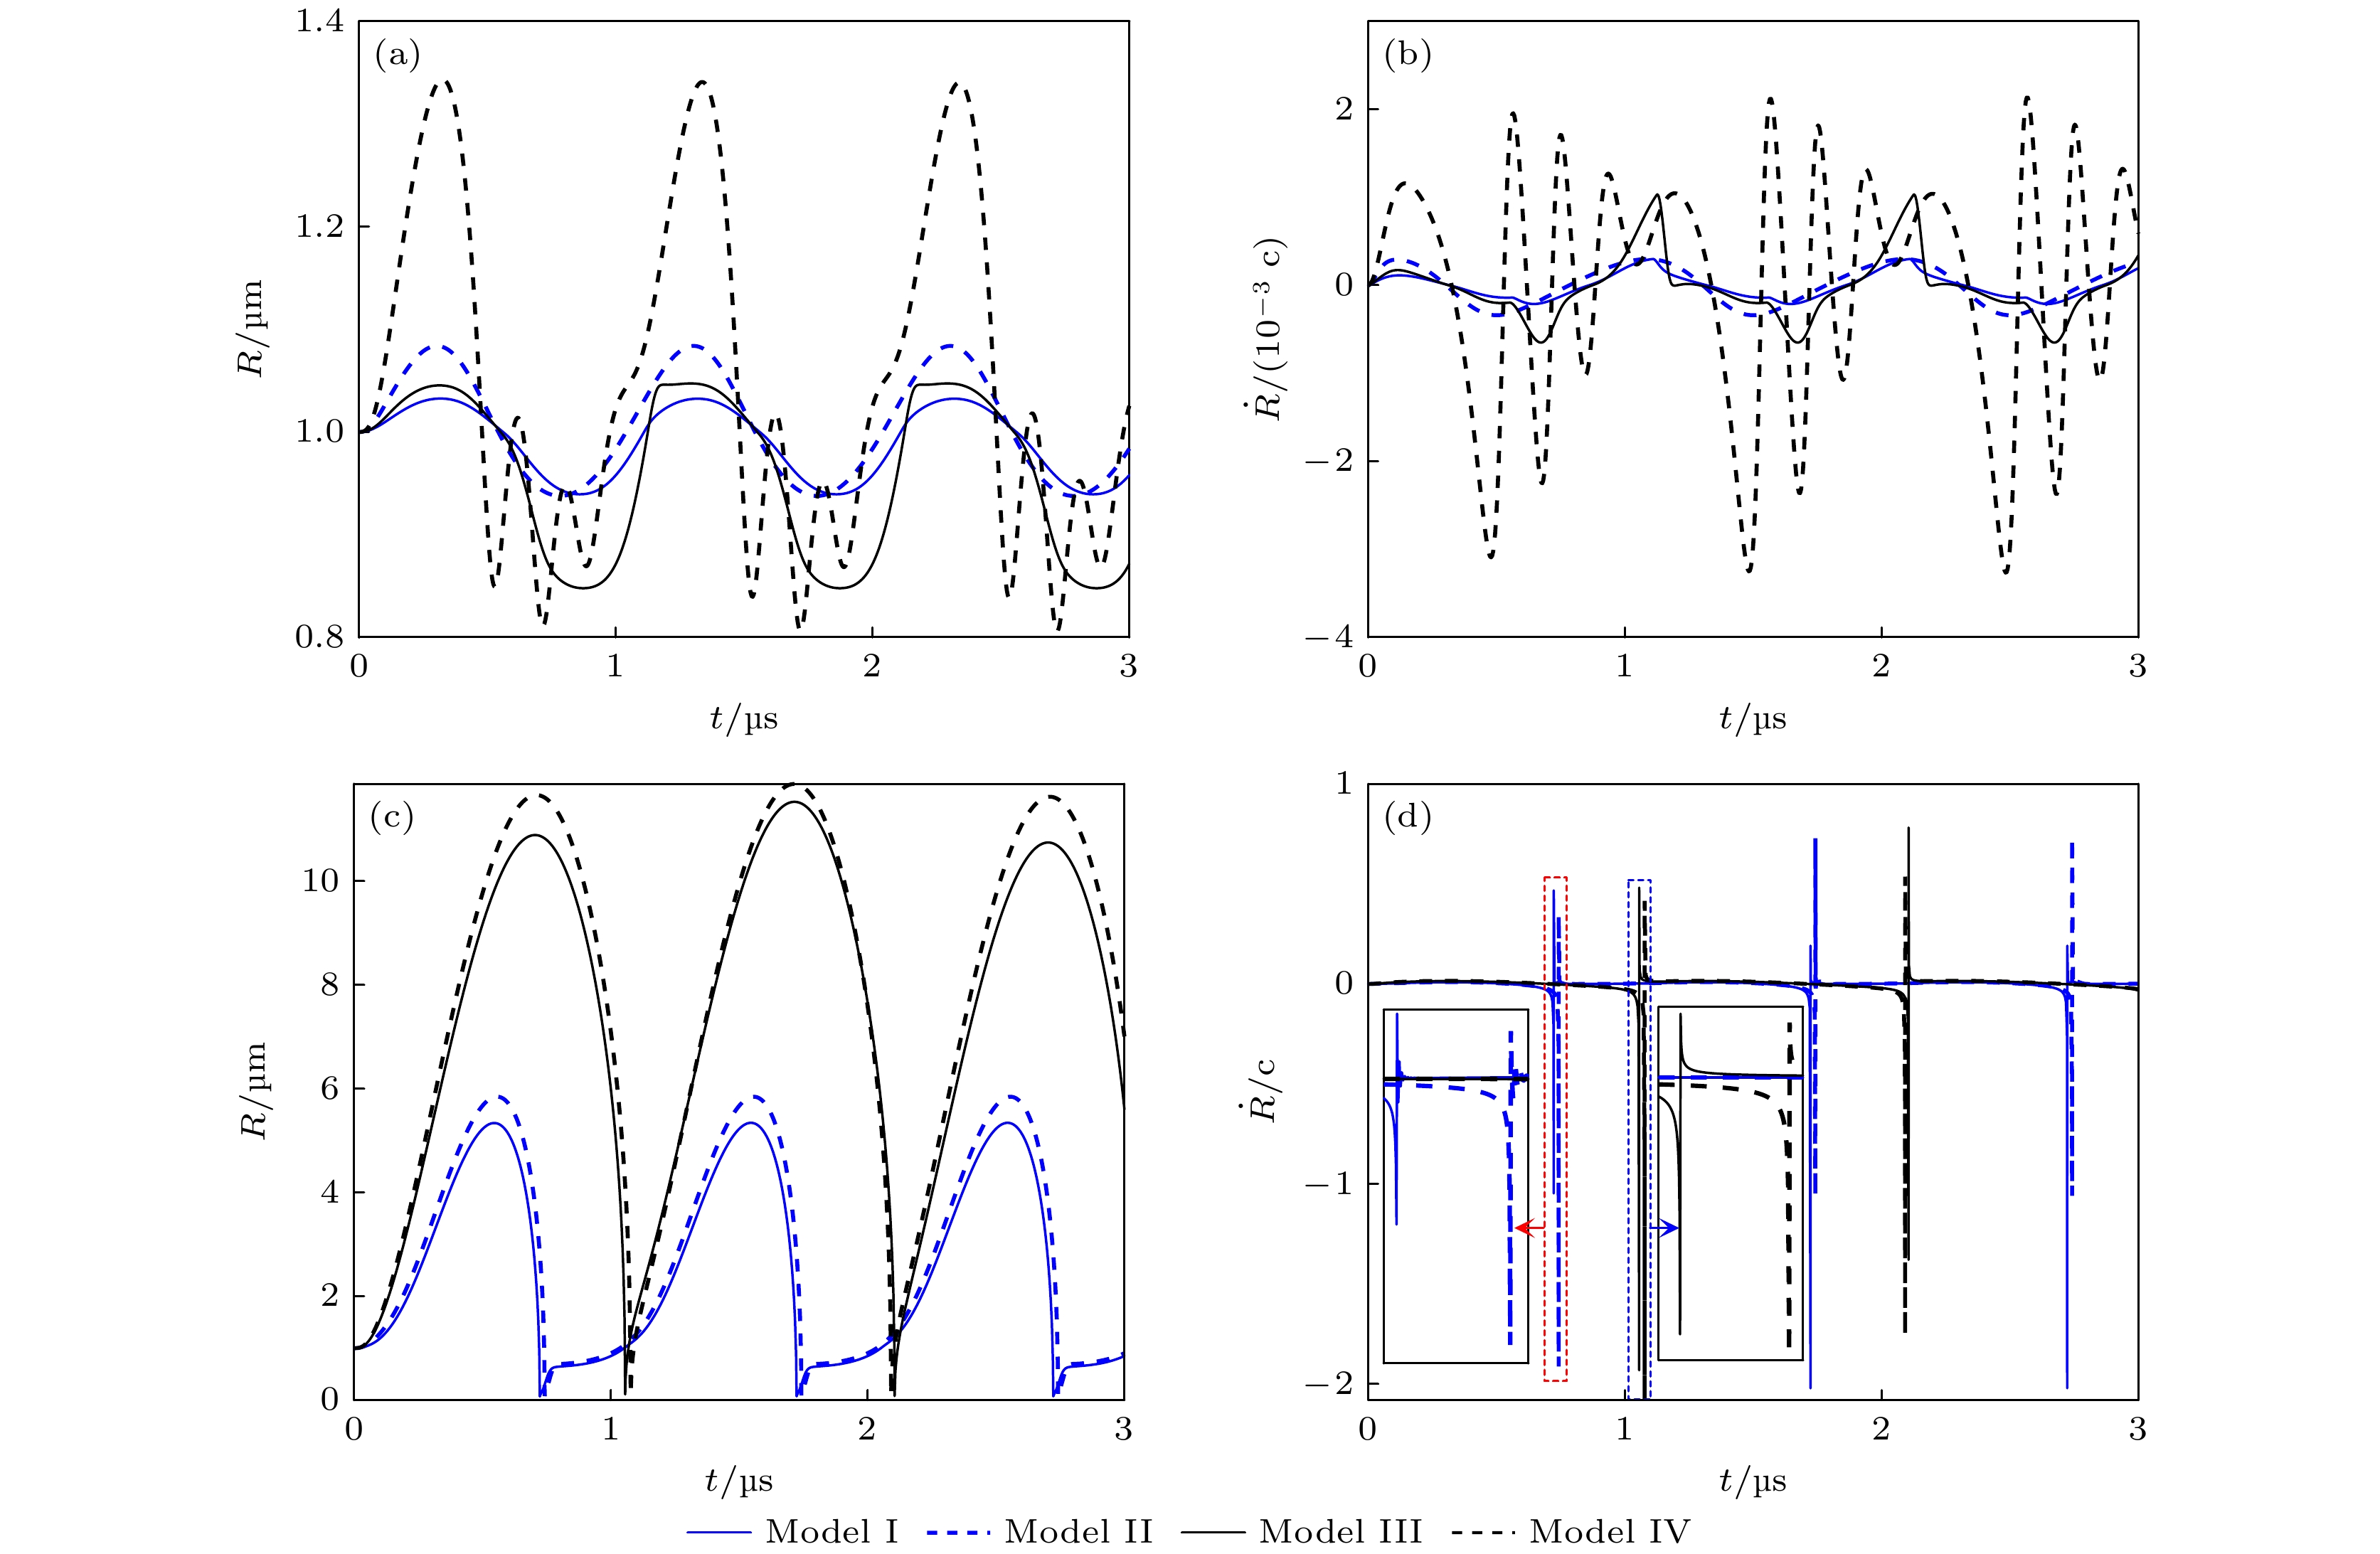 图 2 不同条件下微泡声空化动力学行为 (a), (b)和(c), (d)分别表示pA为0.1 和1 MPa时, 微泡半径和振动速度随时间的变化曲线. I—IV分别表示组织内(I)脂类和(II)无包膜微泡、水中(III)脂类和(IV)无包膜微泡声空化动力学模型


 图 3 组织内微泡声空化过程中, 微泡周围组织内机械应力的时间演化和空间分布 (a)微泡声空化动力学与组织内应力的时空分布, 实线、虚线和点线分别为d0 = 2, 6和11 μm粒子的运动轨迹; (b) 3个粒子所受应力随时间的变化曲线; (c)不同时刻(图(a)中点线所示)组织内应力的空间分布, 蓝色和红色实线分别表示挤压应力和拉伸应力


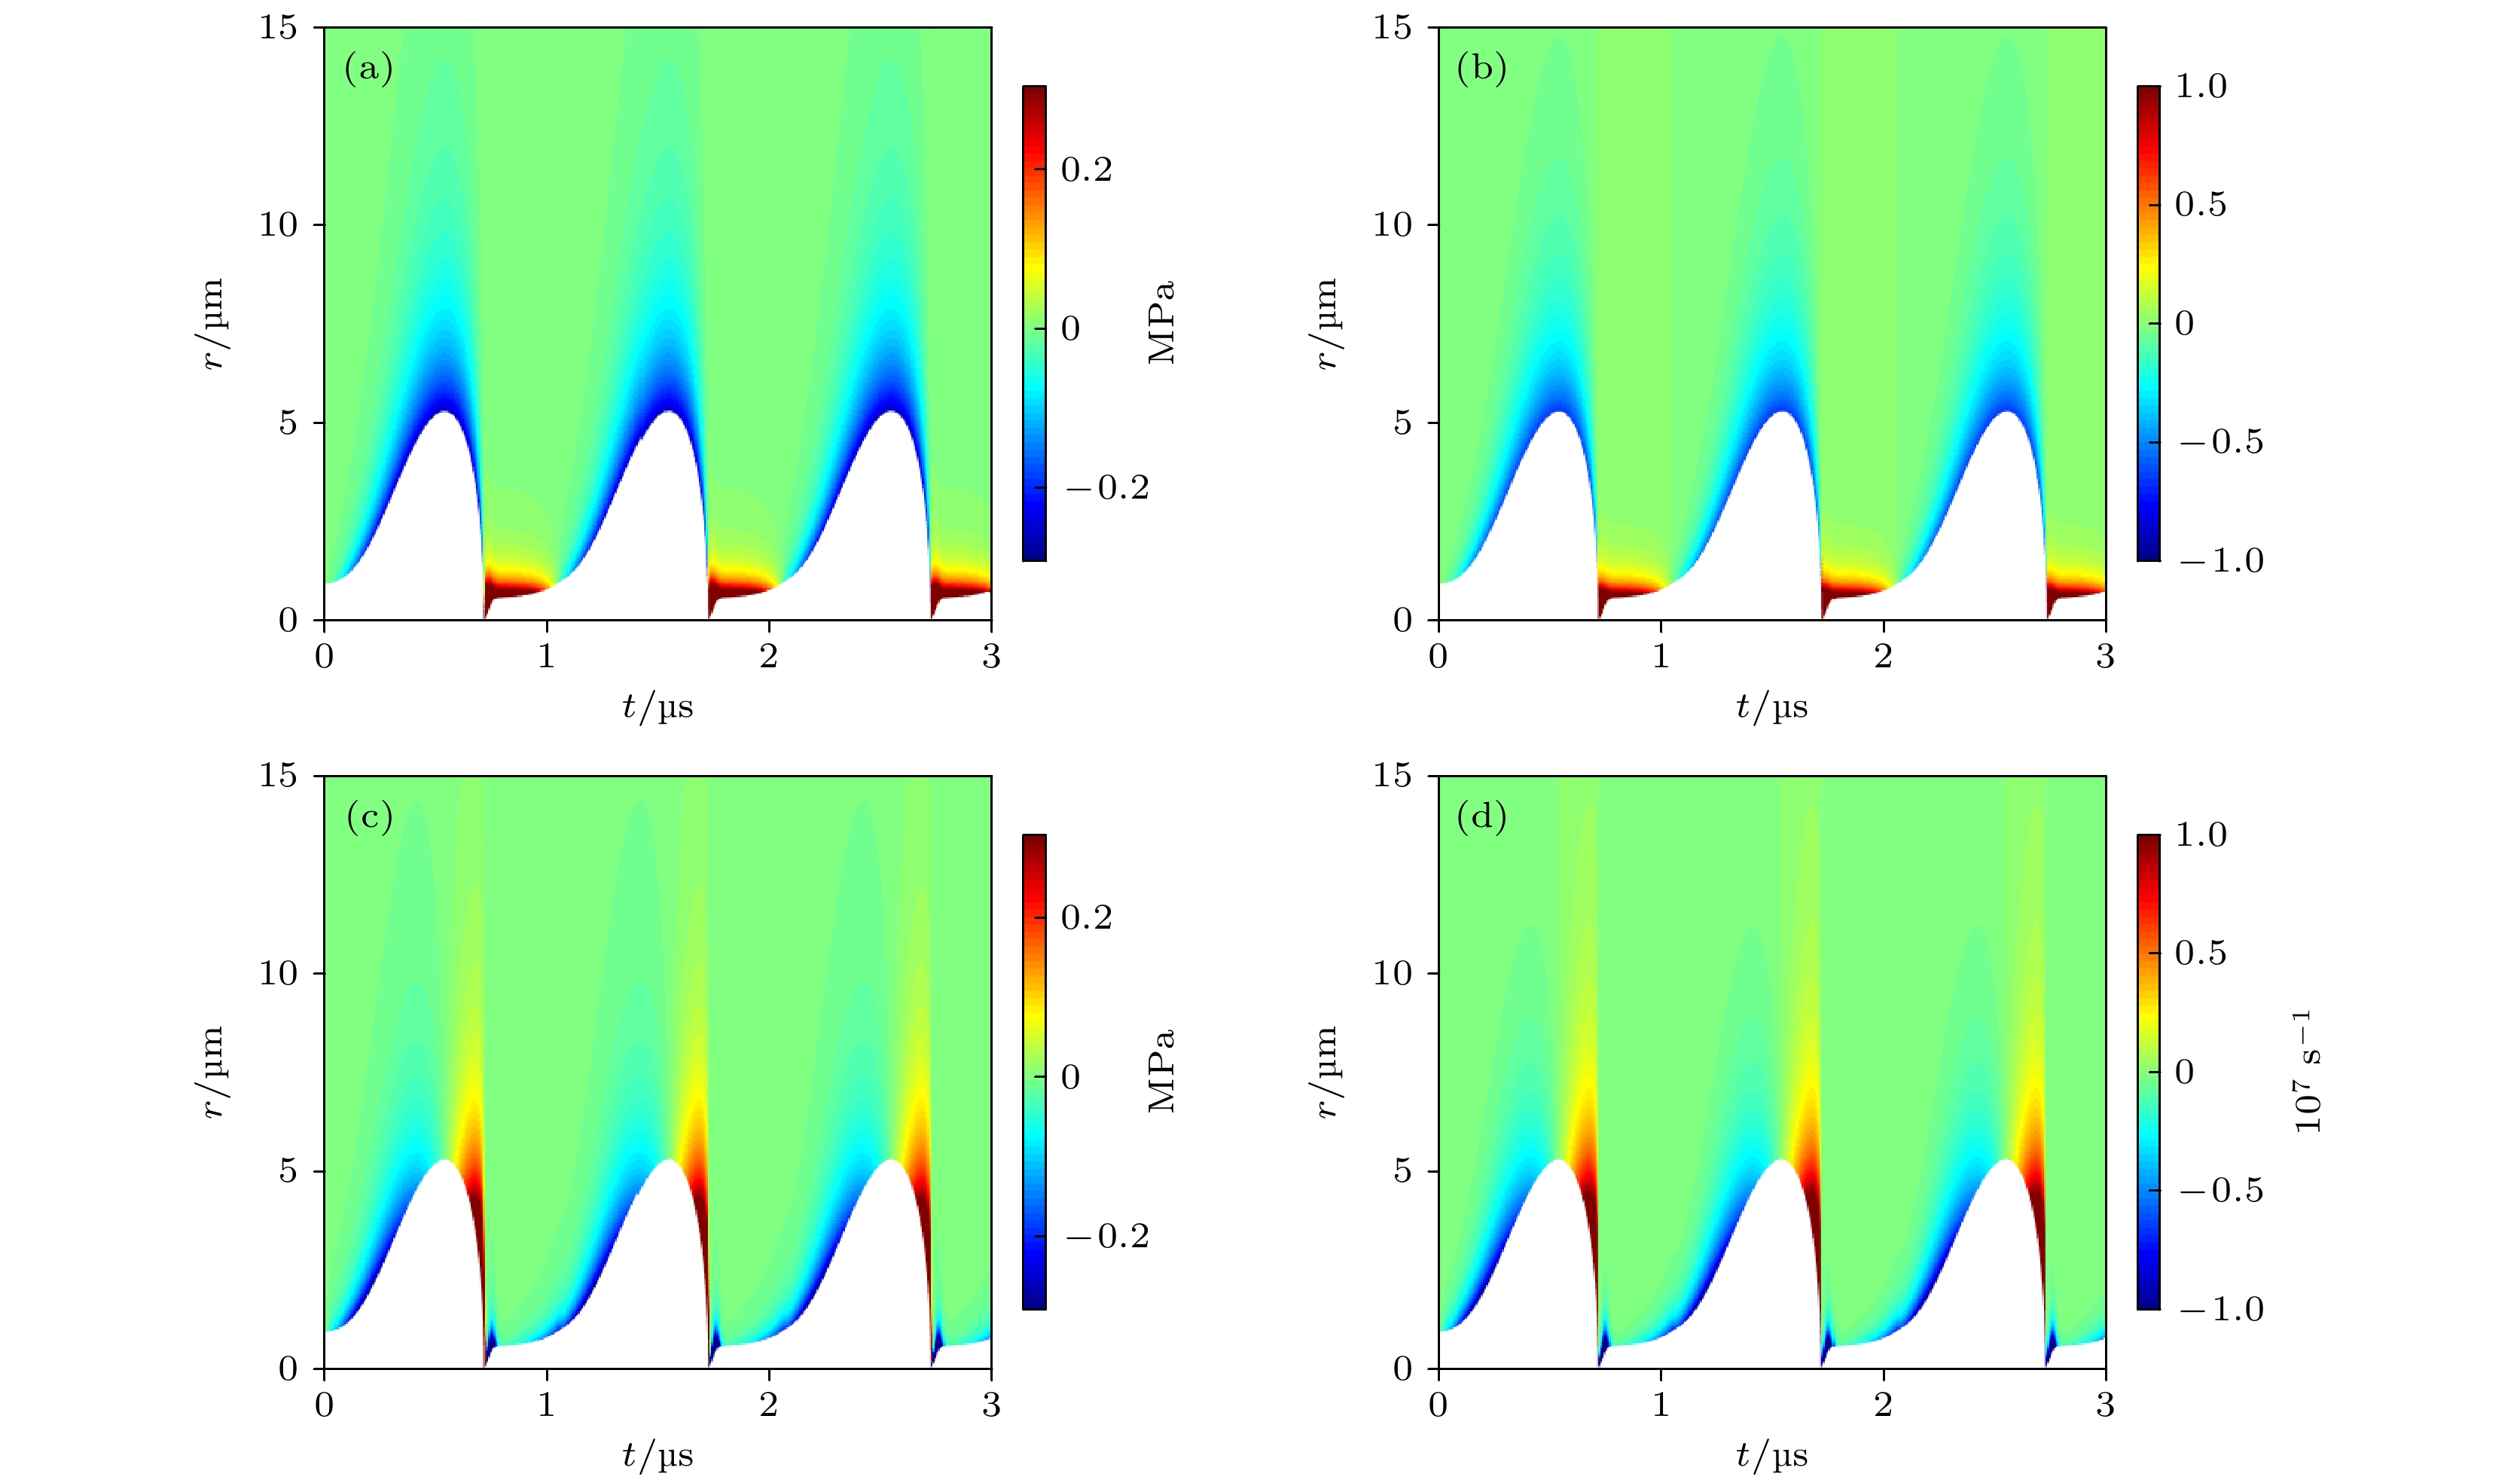 图 4 组织内微泡声空化过程中(a)弹性应力


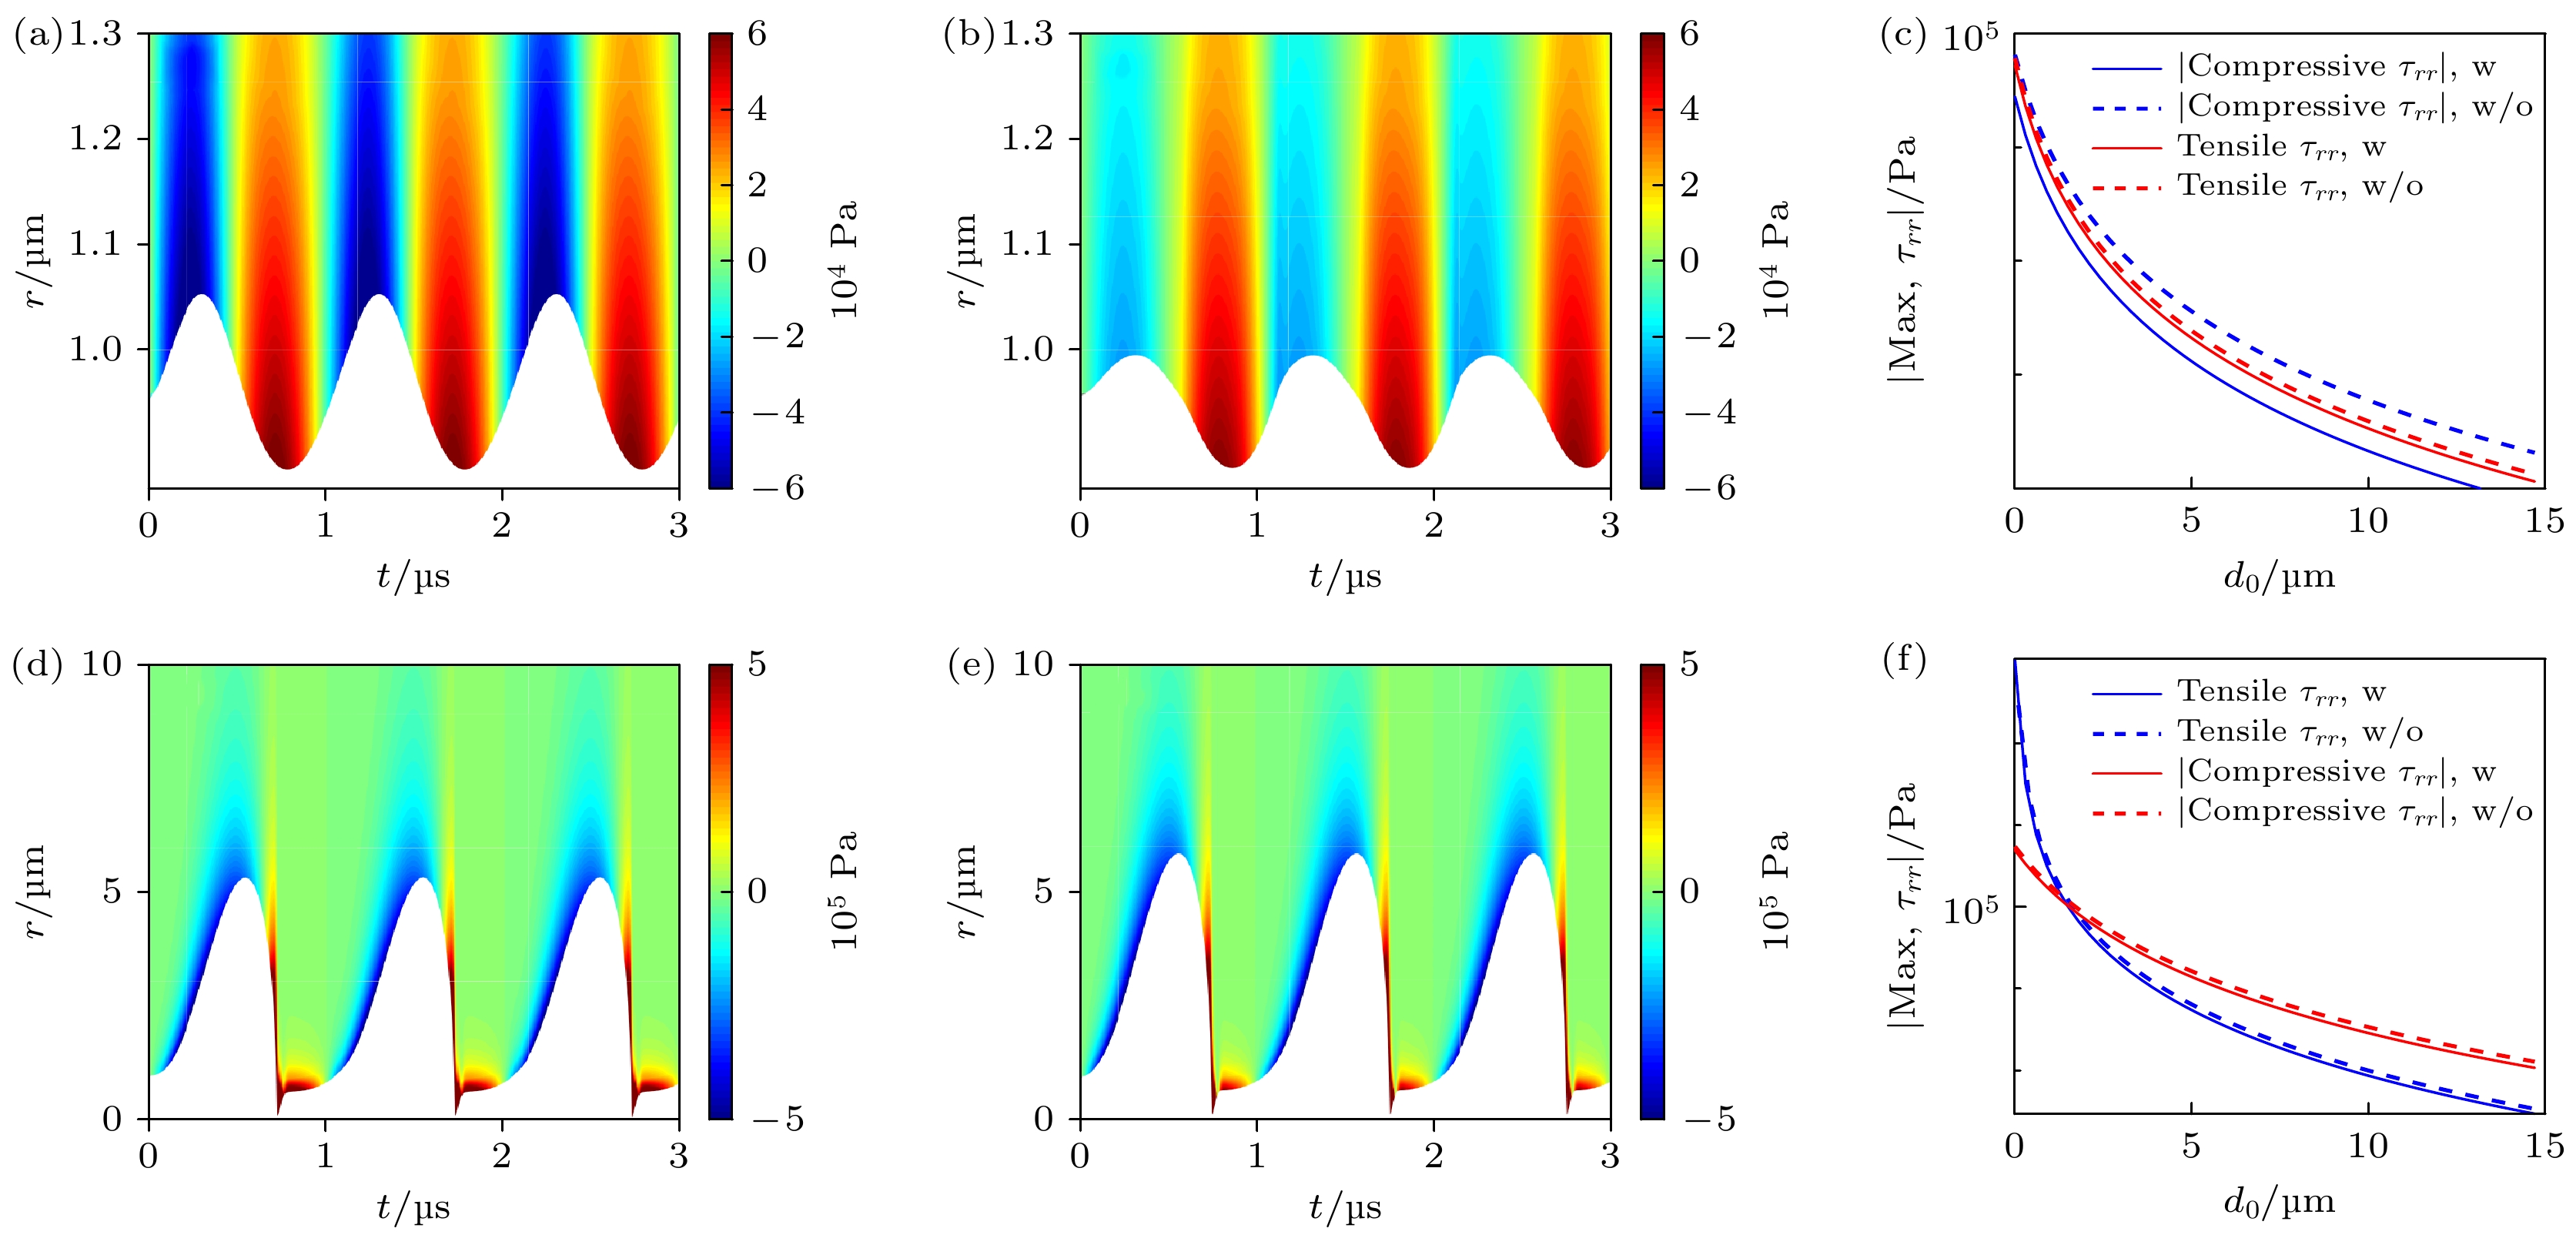 图 5 微泡包膜对声空化动力学和组织内应力的影响, 包括pA = 0.1 MPa时, 组织内(a)无包膜微泡和(b)脂类包膜微泡的声空化动力学以及微泡周围应力的时空分布; pA = 1 MPa时, 组织内(d)无包膜微泡和(e)脂类包膜微泡的声空化动力学以及微泡周围应力的时空分布; (c)和(f)表示对应的最大挤压应力和最大拉伸应力随d0的变化曲线
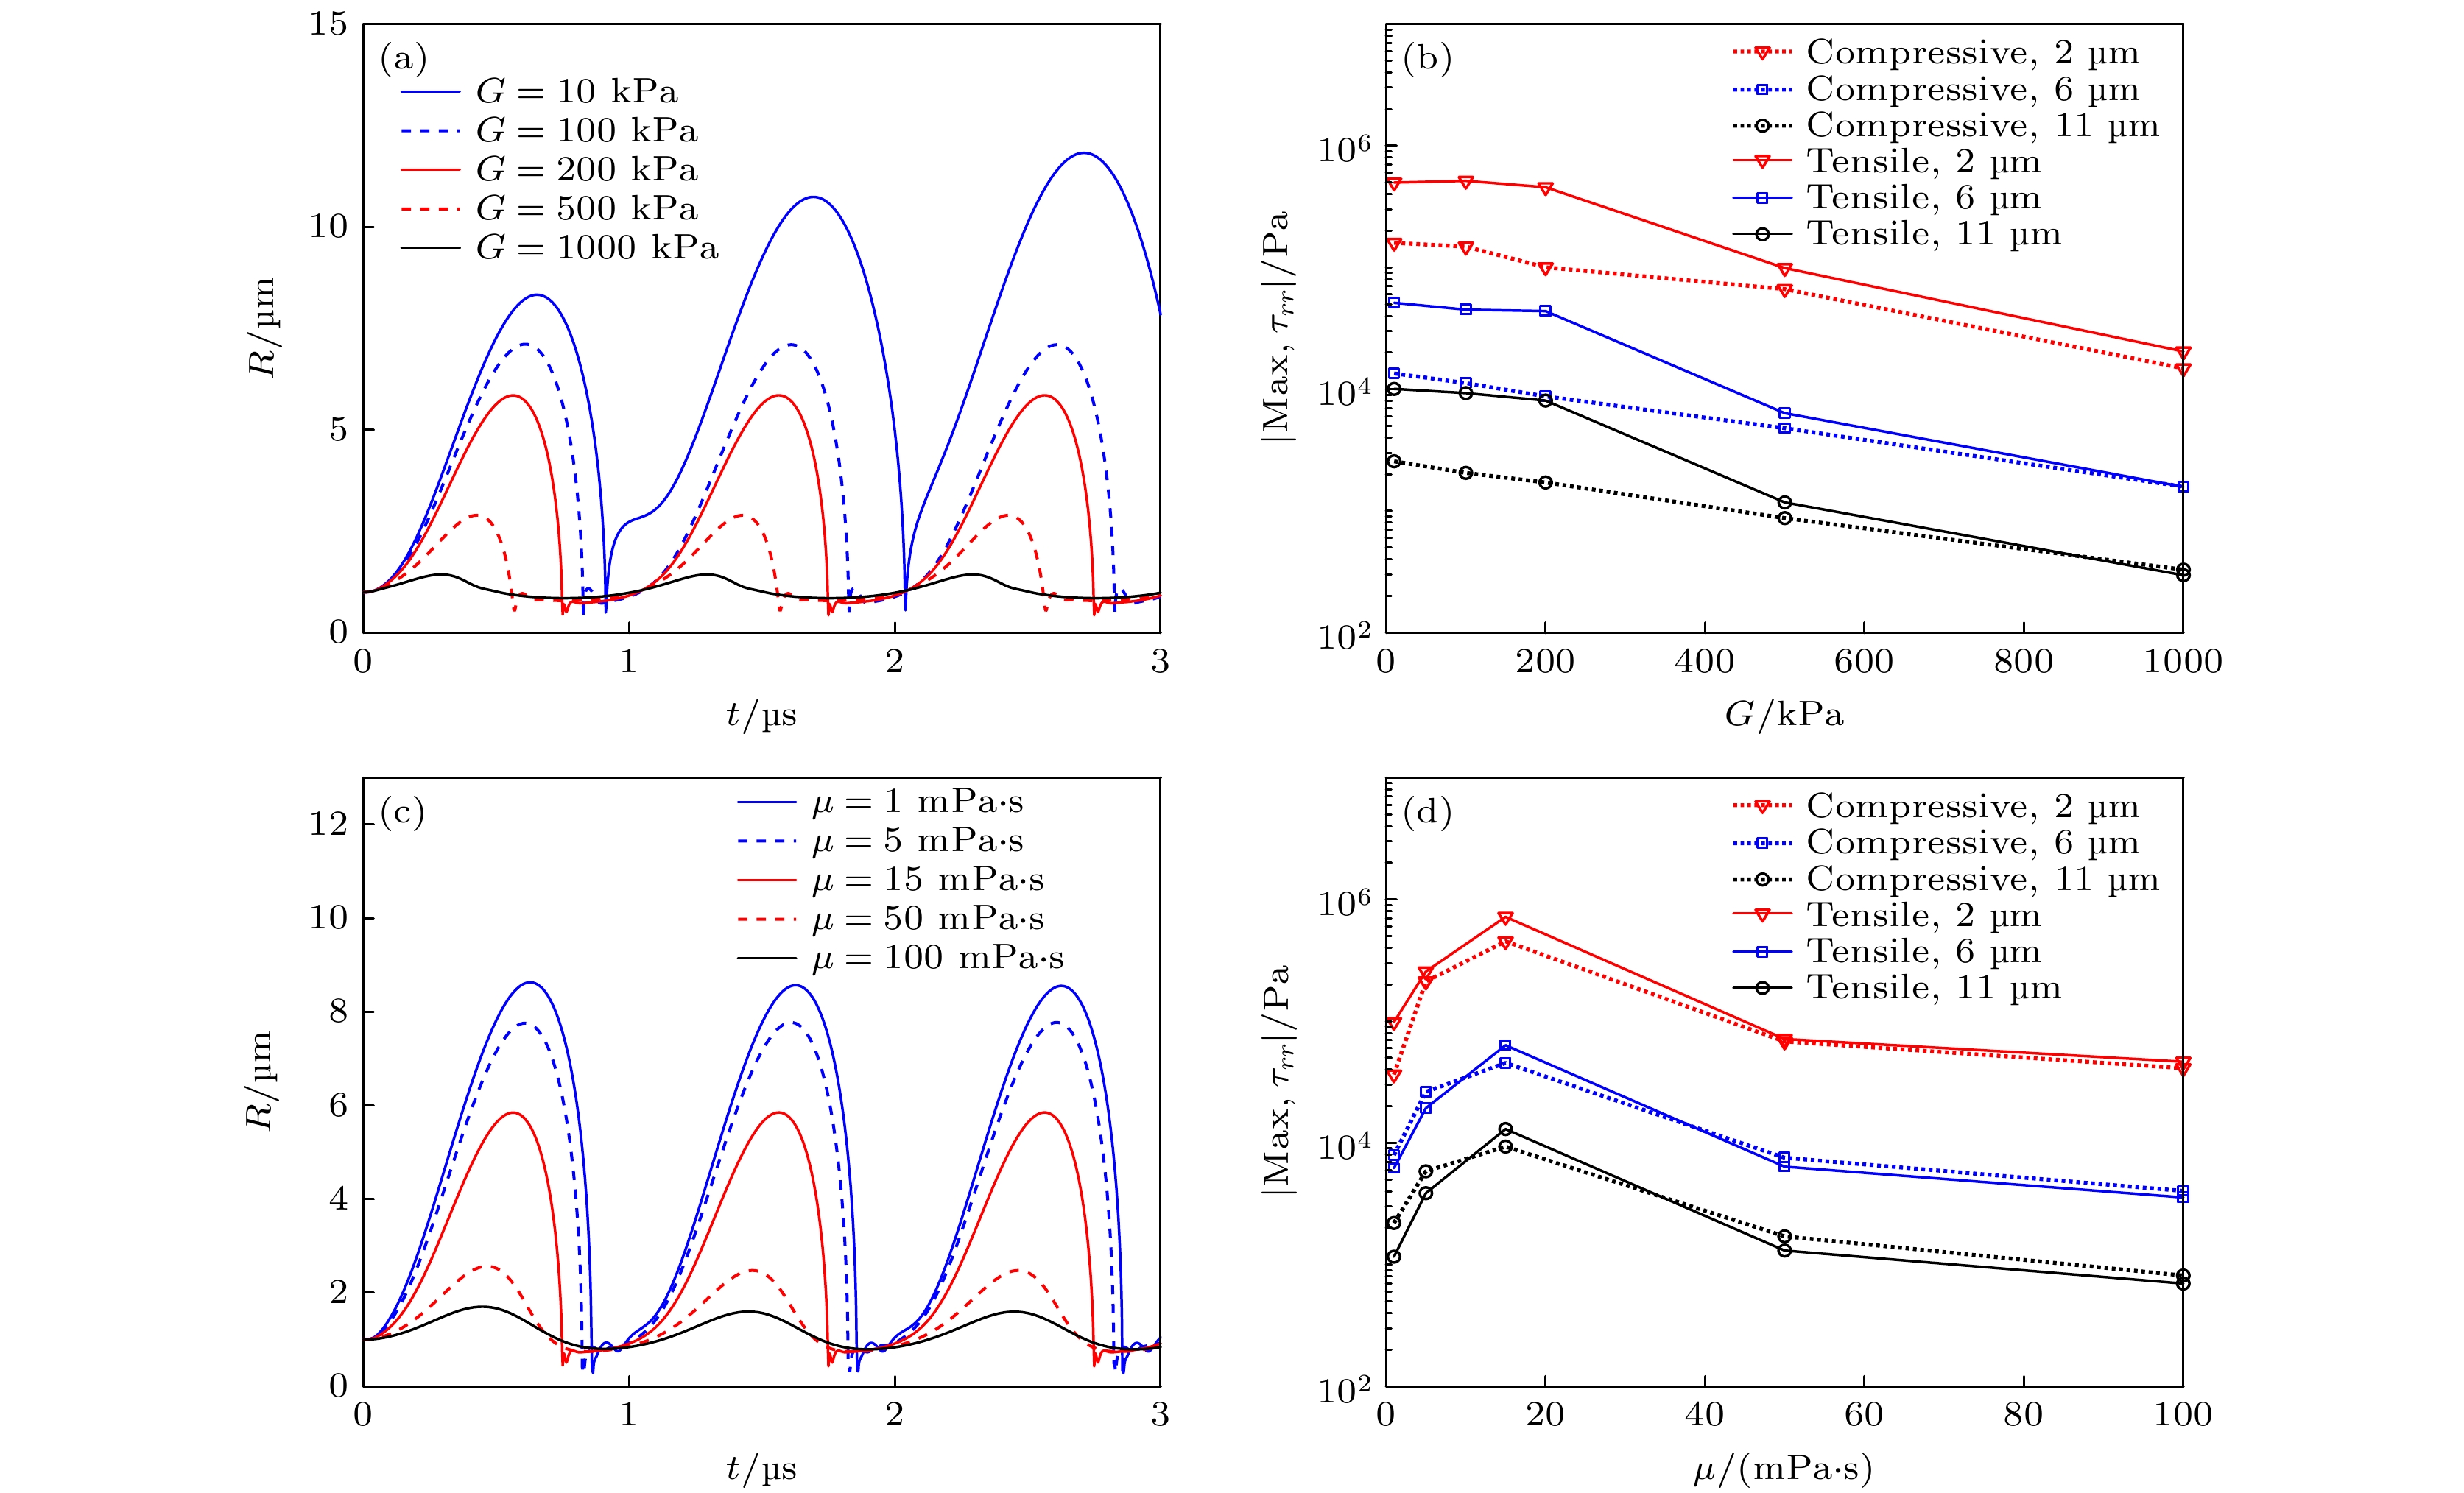 图 6 (a)不同组织弹性模量(G = 10, 100, 200, 500和1000 kPa)下, 组织内微泡半径随时间的变化关系, (b)组织内不同d0处(2, 6和11 μm)粒子所受最大挤压应力和最大拉伸应力随组织弹性模量G的变化关系; (c)不同组织黏度(μ = 1, 5, 15, 50和100 mPa·s)下, 组织内微泡半径随时间的变化关系, (d)组织内不同d0处(2, 6和11 μm)粒子所受最大挤压应力和最大拉伸应力随组织黏度μ的变化关系
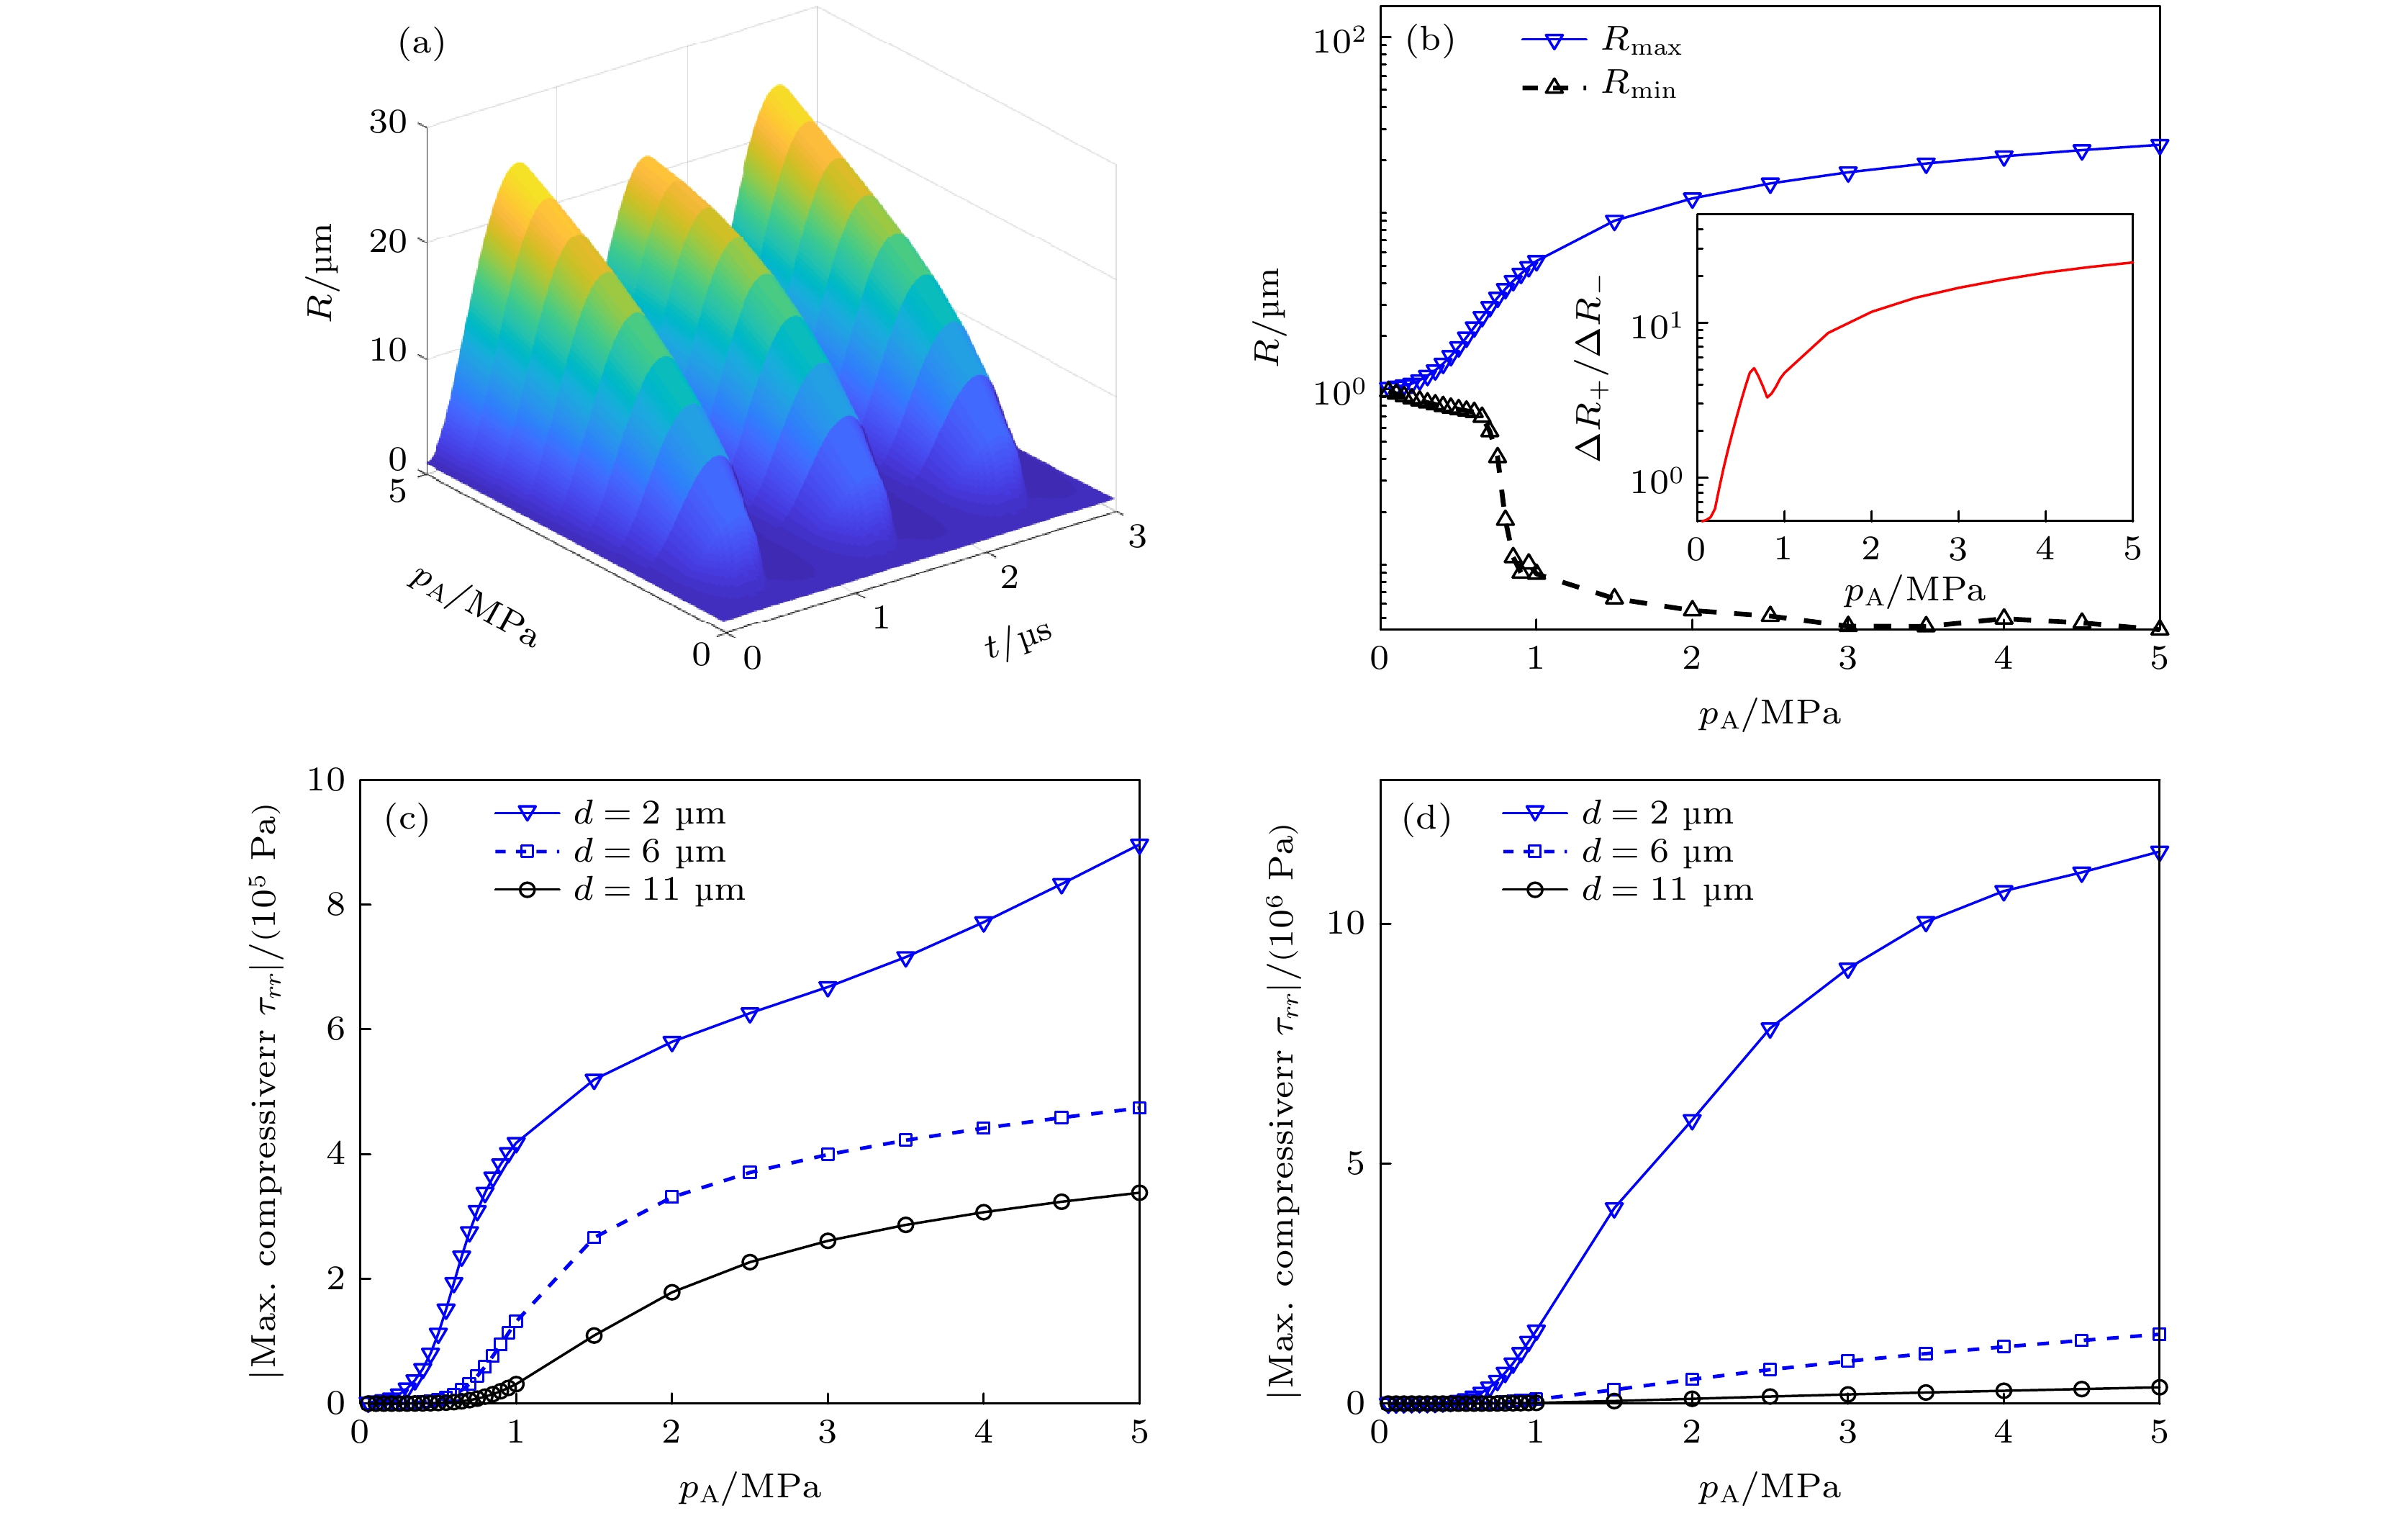 图 7 (a)不同超声声压(0.1—5 MPa)下, 微泡半径R随时间的变化关系; (b)微泡最大半径Rmax、最小半径Rmin和微泡膨胀-压缩比ΔR+/ΔR– (见插图)随超声声压的变化关系; 组织内不同d0处(2, 6和11 μm)粒子所受(c)最大挤压应力和(d)最大拉伸应力随超声声压的变化关系
